Embed Size (px)
Citation preview

Evaluating Success of Oyster Restoration
Deriving Benchmarks
From Natural Populations
Hadley, N. H., L.D. Coen, V. Shervette, and M. Hodges

Success depends on your goals– Harvestable product– Ecosystem services– Public awareness
Sustainability may be an over-riding goal which applies to all
• When can/should success be determined?
• What constitutes success?
• Multiple year classes
• Size/density comparable to natural populations
• How do you establish the targets?
• Habitat functioning
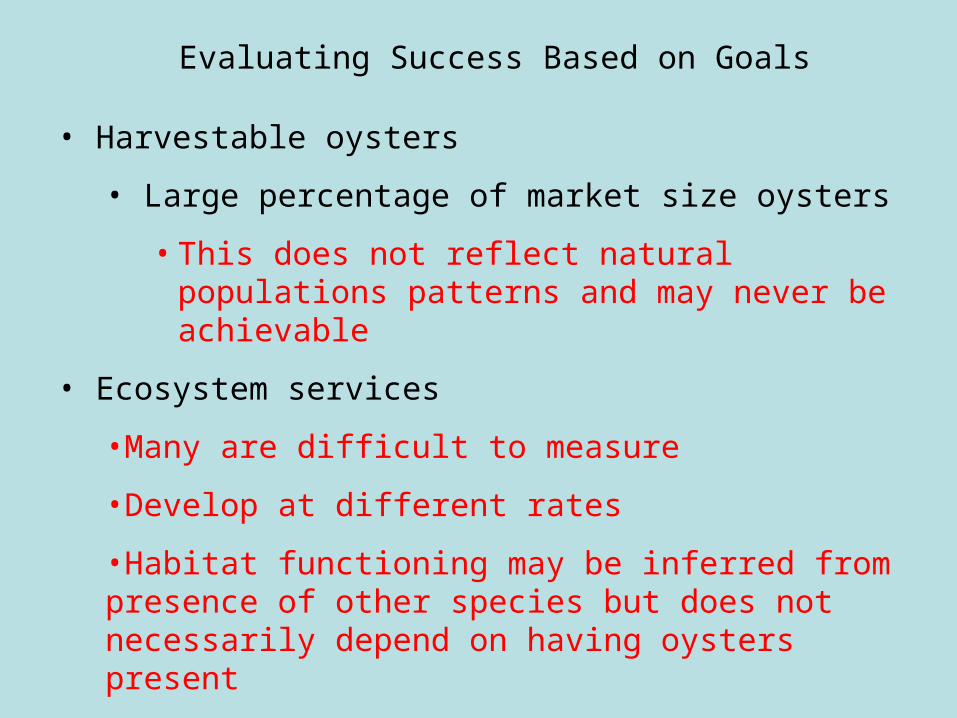
Evaluating Success Based on Goals
• Harvestable oysters
• Large percentage of market size oysters
• This does not reflect natural populations patterns and may never be achievable
• Ecosystem services
•Many are difficult to measure
•Develop at different rates
•Habitat functioning may be inferred from presence of other species but does not necessarily depend on having oysters present

• When can/should success be determined?
• Multiple year classes
• Recruitment
• Survival/growth
• Size/density comparable to natural populations (convergence)
• Retention of hard substrate for continued recruitment
Evaluating Success Based on Goals
Sustainability

Size Frequencies on 1 and 3 Year Old Reefs Fall 2004
Dataw
0
100
200
300
400
500
600
700
800
5 10 15 20 25 30 35 40 45 50 55 60 65 70 75 80 85 90 95 >95
Oyste
rs/m
2 +
1 S
E
2001 - 3 Years
2003 - 1 Year


•Reference reefs
• Do they exist?
• Are they “good”?
• Long-term datasets
•Mean values
•Percentiles
•What proportion of natural reefs are in “good” condition?
• Classifying natural reefs along a continuum of “goodness”
Size/density comparable to natural populations
What’s your benchmark?

2006 - 12 yearsSite Experimental Natural Experimental NaturalInlet 29.2 128.1 414.2 395.6Tolers 15.2 88.7 307.7 322.6
Oyster Density on Paired Experimental and Natural Reefs in 1998 and 2006
1998 - 4 years
p<0.05 ns
Reference reefs

0
1,000
2,000
3,000
4,000
5,000
6,000
7,000
8,000
9,000
Oyste
rs/m
2 +
1SE
Sample Year
Natual Oyster Density in South Carolina
Series1 mean 30th 50th 70th
Mean= 2,348
70Mean50
30

Mean HeightMax
Height Total DensityDensity of
small oysters
Density of large
oysters % Recruits % Largemm mm #/m2 #/m2 #/m2 % %
Good 32 102 2,350 1,100 240 42-58 12Fair 23-32 84-102 850-2,350 140-1,100 100-240 25-42,>58 3-12
Poor <23 <84 <850 <140 <100 <25 <3
Mean HeightMax
Height Total DensityDensity of
small oysters
Density of large
oysters % recruits % largemm mm #/m2 #/m2 #/m2 % %
Good >35 >110 >2800 >1400 >300 50 15Fair 28-35 93-110 1400-2800 450-1400 145-300 30-50 6-15
Poor <28 <93 <1400 <450 <145 <30 <6
Target Values Based on Natural Population Percentiles
Target Values Based on Population Means

Good22%
Fair42%
Poor36%
Success Evaluation Based on Oyster Population Parameters for Large Scale Restored Sites in SC
20 Sites 45 Reefs
10
19
16
27 Reefs were less than 3 years old at time of assessment.
66% of reefs were fair or better
Overall Rating: Fair

Success of 19 Small-scale Reefs based on oyster population parameters
48%
26%
26%Good
Fair
Poor
Reefs sampled at 3 – 4 years

Alternative approach: Classify Natural Reefs

Fair
Good
FairStrata C
Strata E Excellent?
Strata A Very Good
Strata G Good

0
5
10
15
20
25
30
35
40
0
500
1000
1500
2000
2500
3000
3500
4000
4500
E strata A strata Gstrata Fstrata F1 strata C strata D strata
Shell H
eig
ht
(mm
)
Oy
ste
rs/m
2
Abundance/ Size Characteristicsof SC Oyster Strata
Total abundance
Abundance less YoY
Abundance YoY
Abundance Large
Mean Size
Good
Very Good
Fair
Poor

Characteristics of Natural Intertidal Oyster Populations in South Carolina
• Few large oysters – usually less than 20% • High recruitment – usually 50% of populations• Mean size for all strata ranges from 25 – 35 mm • High variability within and among sites • High variability among years
• A “good” reef one year may seem like a “poor” reef in another year

What proportion of natural reefs are in “good” condition?
Very Good – 5% - Stratas A and E
Good – 37% - Stratas F and G
Fair – 38% - Stratas F1 and C
Poor -19% - Stratas D and W
Establishing Success Benchmarks

Trask 3 YearsPopulation means: Good
Percentiles: Good
Strata convergence: Similar to G, may reach A
Strata G Good Strata A Very Good

Palmetto 3 YearsPopulation means: GoodPercentiles: Good
Strata Convergence: Similar to A or E
Strata G Good Strata A Very Good
Strata E Excellent? Or overcrowded

Dataw - 3 YearsPopulation means: Fair
Percentiles: Good
Strata Convergence: Better than C, may reach G
FairStrata CStrata G Good

72% of planted area remained at the end of the study77% of sites were fair or better
Overall Rating : Good
Good48%
Fair38%
Poor14%
Success Evaluation based on Footprint for Large-scale Restoration in SC
Total number of sites=21Total number footprints=52
7
25
20

CONCLUSIONS• Size frequency of restored populations is useful for evaluating
rate of development and sustainability.
• Using natural population means or percentiles as targets may be striving for mediocrity.
• Stratifying natural populations may provide more meaningful targets and allows us to examine development trajectories.
• Success ratings for large and small-scale restored sites ranging in age from 3 to 6 years are similar regardless of which of these targets are used
• Approximately 25% of restoration sites examined, both large and small scale, appear to be failures with little potential for development of sustainable populations of oysters.

AcknowledgementsShellfish Research Section personnel who have measured thousands of oysters each year to generate this dataset.
All the volunteers who helped build and sample the reefs!
Funded by: