Embed Size (px)
Citation preview

1
EVALUATING ORBIT DETERMINATION POST-PROCESSING METHODS FOR OPERATIONAL ARTEMIS DATA
Bradley W. Cheetham* and George H. Born†
Operating in the highly dynamic Earth-Moon libration point orbit (LPO) region,
which is predominantly perturbed by the Earth, the Moon, and the Sun, is a chal-
lenge. The Artemis mission operated by the NASA Goddard Space Flight Cen-
ter and the University of California at Berkeley recently became the first to ever
maintain orbits in this regime. The resulting operational data provides signifi-
cant opportunity for analysis to better understand these orbits and their opera-
tional constraints. Future efforts to quantify orbit determination results, recover
un-modeled accelerations, realistic uncertainty propagation, and ultimately LPO
utilization will grow out of an ability to post-process this operational data for
further understanding of the dynamics involved. To prepare for post-processing
of this data, this paper quantifies the effects of various contributors to the dy-
namic models, experimentally models errors in a simulated environment, and
outlines areas of future focus. Realistic spacecraft ephemeris and attribute in-
formation will be used to the maximum extent possible. Simulations of orbit de-
termination efficacy are performed using the Analytical Graphics Inc. Orbit De-
termination Tool Kit (ODTK) with appropriate tracking and spacecraft charac-
teristics and known error sources.
INTRODUCTION
This work is motivated by the desire to better understand the dynamic environment and opera-
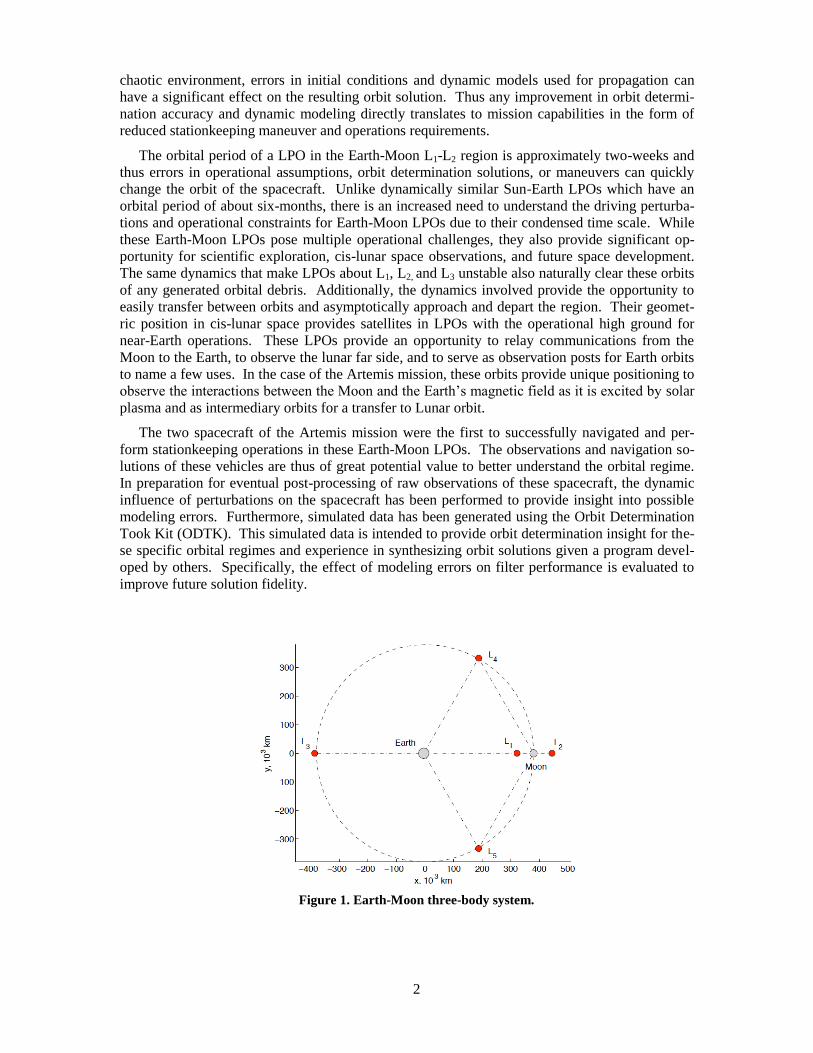
tional constraints of spacecraft in the Earth-Moon three-body regions. Specifically of interest are
libration point orbits (LPOs) about the Earth-Moon co-linear L1 and L2 points as labeled in Fig-
ure 1. These orbits exist in a regime perturbed predominantly by the Earth, the Moon, and the
Sun, and are chaotic in nature. Orbits in this region are unstable and require stationkeeping ma-
neuvers to maintain their orbits. These stationkeeping maneuvers have previously been found to
vary from approximately 1-4 m/s/yr assuming orbit determination accuracy of better than 10 me-
ters1 to more than 50 m/s/yr including modeling and maneuver errors.
2 The Artemis mission
budgeted approximately 15 m/s for the planned ~6 month L1/L2 orbit maintenance portion of the
mission. The magnitude of these station keeping maneuvers is very highly dependent on the ac-
curacy of the orbit determination solutions recovered, dynamic models employed, and maneuver
execution errors observed. As a result of the driving nature of these error sources on operational
implementation of LPO missions, they will become the focus of this and future efforts. In this
* Graduate Research Assistant, University of Colorado Boulder Aerospace Engineering Sciences, Colorado Center for
Astrodynamics Research, 431 UCB, 80309. † Director, Colorado Center for Astrodynamics Research, University of Colorado, Boulder Aerospace Engineering
Sciences, 431 UCB, 80309.
AAS 11-513
2
chaotic environment, errors in initial conditions and dynamic models used for propagation can
have a significant effect on the resulting orbit solution. Thus any improvement in orbit determi-
nation accuracy and dynamic modeling directly translates to mission capabilities in the form of
reduced stationkeeping maneuver and operations requirements.
The orbital period of a LPO in the Earth-Moon L1-L2 region is approximately two-weeks and
thus errors in operational assumptions, orbit determination solutions, or maneuvers can quickly
change the orbit of the spacecraft. Unlike dynamically similar Sun-Earth LPOs which have an
orbital period of about six-months, there is an increased need to understand the driving perturba-
tions and operational constraints for Earth-Moon LPOs due to their condensed time scale. While
these Earth-Moon LPOs pose multiple operational challenges, they also provide significant op-
portunity for scientific exploration, cis-lunar space observations, and future space development.
The same dynamics that make LPOs about L1, L2, and L3 unstable also naturally clear these orbits
of any generated orbital debris. Additionally, the dynamics involved provide the opportunity to
easily transfer between orbits and asymptotically approach and depart the region. Their geomet-
ric position in cis-lunar space provides satellites in LPOs with the operational high ground for
near-Earth operations. These LPOs provide an opportunity to relay communications from the
Moon to the Earth, to observe the lunar far side, and to serve as observation posts for Earth orbits
to name a few uses. In the case of the Artemis mission, these orbits provide unique positioning to
observe the interactions between the Moon and the Earth’s magnetic field as it is excited by solar
plasma and as intermediary orbits for a transfer to Lunar orbit.
The two spacecraft of the Artemis mission were the first to successfully navigated and per-
form stationkeeping operations in these Earth-Moon LPOs. The observations and navigation so-
lutions of these vehicles are thus of great potential value to better understand the orbital regime.
In preparation for eventual post-processing of raw observations of these spacecraft, the dynamic
influence of perturbations on the spacecraft has been performed to provide insight into possible
modeling errors. Furthermore, simulated data has been generated using the Orbit Determination
Took Kit (ODTK). This simulated data is intended to provide orbit determination insight for the-
se specific orbital regimes and experience in synthesizing orbit solutions given a program devel-
oped by others. Specifically, the effect of modeling errors on filter performance is evaluated to
improve future solution fidelity.
Figure 1. Earth-Moon three-body system.
3
BACKGROUND
Artemis Mission
The Artemis mission, which is used here as a the baseline for simulated data, is a phase two
mission which re-purposed two satellites of the original five satellites involved with the THEMIS
mission. The ultimate objective of the THEMIS mission is to study the interrelationship between
the Sun and the Earth’s magnetic field. Specifically of interest is the phenomenon associated
with geomagnetic sub-storms. The outer two spacecraft of this constellation are what became P1
and P2 of the Artemis mission. To raise the outer two satellites, P1 and P2, to the Moon they first
underwent many phasing loops about the Earth. After a complex transfer including Lunar, Earth,
and Solar assists, the vehicles then entered lissajous orbits about the Lunar L1 and L2 points. This
is where the mission data of relevance to this and future work in this area was gathered.3,4,5
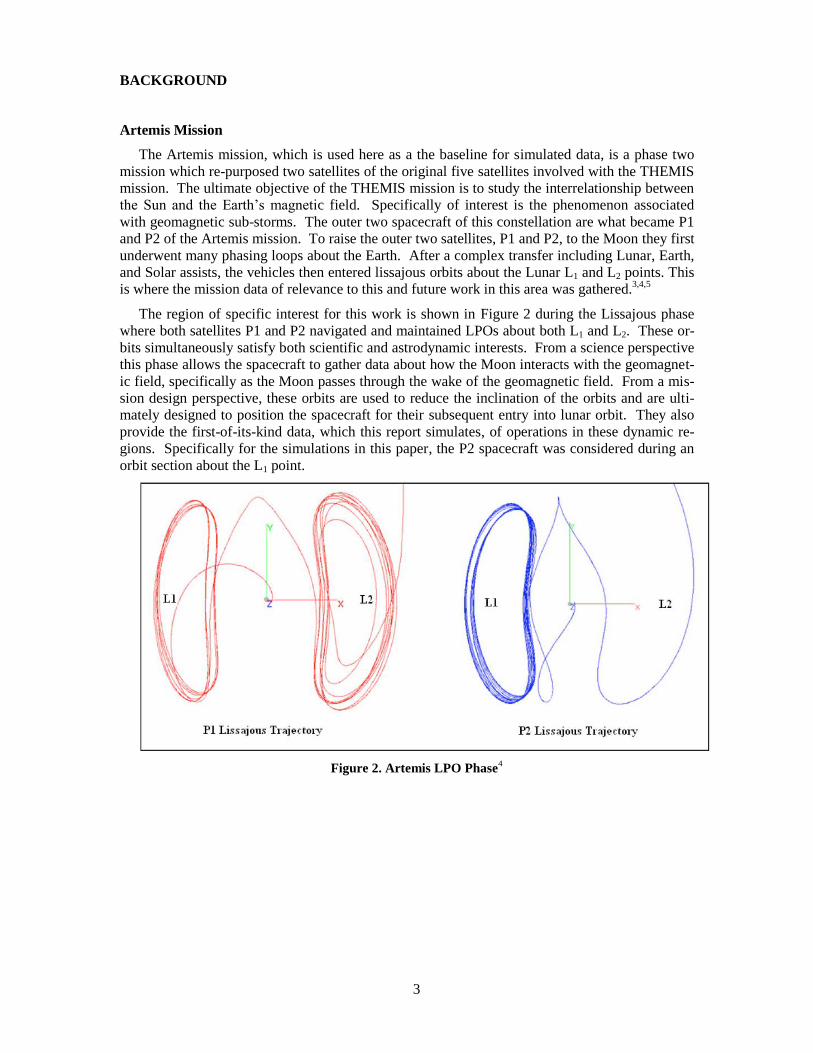
The region of specific interest for this work is shown in Figure 2 during the Lissajous phase
where both satellites P1 and P2 navigated and maintained LPOs about both L1 and L2. These or-
bits simultaneously satisfy both scientific and astrodynamic interests. From a science perspective
this phase allows the spacecraft to gather data about how the Moon interacts with the geomagnet-
ic field, specifically as the Moon passes through the wake of the geomagnetic field. From a mis-
sion design perspective, these orbits are used to reduce the inclination of the orbits and are ulti-
mately designed to position the spacecraft for their subsequent entry into lunar orbit. They also
provide the first-of-its-kind data, which this report simulates, of operations in these dynamic re-
gions. Specifically for the simulations in this paper, the P2 spacecraft was considered during an
orbit section about the L1 point.
Figure 2. Artemis LPO Phase4

4
Three-Body Orbits
Satellites in the region of consideration are perturbed predominantly by both the Earth and
Moon which are both under the influence of gravitational forces from the Sun. These orbits tradi-
tionally have been simulated and studied using specific assumptions to facilitate evaluation in-
cluding the circular restricted three body problem (CRTBP).6 Using this simplified model, equa-
tions of motion can be developed using dimensionless parameters and a better understanding of
the theoretical performance of spacecraft is possible. This work has led to many proposed utiliza-
tions of these orbits some of which were alluded to earlier in this paper. One of the initial cham-
pions of such orbits in the 1960s was Robert Farquhar who coined the term Halo orbits for certain
LPOs.7
While these simplified models make study and simulation easier, when implemented for a
mission, the full ephemeris must be used as well as forces such as solar radiation pressure. This
is possible to simulate, given certain assumptions, in software packages and has been done fre-
quently when considering operational constraints. These simulations, however, have never before
had true operational data to validate the modeling and operational constraints involved with
spacecraft navigation, orbit determination, or stationkeeping. It is this shortcoming which the
Artemis mission now presents the opportunity to address. To begin this process, the work in this
paper simulates the operational environment to evaluate the orbit determination constraints and
subtleties.
Perturbation Evaluation
The performance of orbit determination and propagation is dependent on the accuracy and fi-
delity of the dynamic model used both for filtering observations and predicting satellite states
during times without observations. Generally for Earth orbiting satellites, improved accuracy is
derived from improving the gravity modeling of the Earth. In the LPO region, however, space-
craft are perturbed by many celestial bodies and forces and thus the focus on dynamical modeling
is driven by accurately accounting for relevant gravitational accelerations from celestial bodies
and modeling solar radiation pressure effects. In many evaluations of station keeping perfor-
mance or orbit evolution, simplifying assumptions are made to reduce the complexity of the dy-
namic models required. To understand the appropriateness of such assumptions and the relevan-
cy of various perturbing forces, Figure 3 was developed.

5
Figure 3. LPO Acceleration Contributions
The evaluation of the accelerations in Figure 3 is based on the position and velocity of the
Artemis P2 spacecraft over a 5-day arc beginning January 4th, 2011. The ephemeris data was
generated using operational mission data. Spacecraft parameters were derived from mission
information and are detailed in subsequent tables. Gravitational accelerations from the Earth,
Moon, and Sun are evaluated at the spacecraft’s position. Magnitude of the 2-body gravitational
effects are considered individually. Other planetary accelerations are similarly calculated based
on their instantaneous position vector relative to the Moon in a heliocentric frame. Gravitational
parameters not listed in Table 1 can be found in Reference 8.
1.00E-14
1.00E-13
1.00E-12
1.00E-11
1.00E-10
1.00E-09
1.00E-08
1.00E-07
1.00E-06
1.00E-05
1.00E-04
1.00E-03
1.00E-02
1.00E-01
0 1 2 3 4 5
Acc
eler
ati
on
(m
/s^
2)
Days from Epoch
Solar Gravity (m/s^2)
Earth Gravity (m/s^2)
Lunar Gravity (m/s^2)
Jupiter Gravitational (m/s^2)
Solar Radiation Pressure (m/s^2)
High In-plane Linear Approx. of
Accel. Unc. (m/s^2)
Venus Gravity (m/s^2)
Saturn Gravity (m/s^2)
Earth J2 (m/s^2)
Mercury Gravity (m/s^2)
Uranus Gravity (m/s^2)
Low In-Plane Linear Appox. of
Accel. Unc. (m/s^2)
Mars Gravity (m/s^2)
Neptune Gravity (m/s^2)
Lunar J2 (m/s^2)
Earth Relativistic Effect (m/s^2)

6
Table 1. Parameter Values for Acceleration Calculations
Parameter Value
GM Earth 3.986004418E+014 ⁄
GM Moon 4.902798882E+12 ⁄
GM Sun 1.3271240E+020 ⁄
J2 Earth 0.0010826269
J2 Moon9 0.000203428
(Time Averaged
Solar Luminocity) 3.839E+26 W
c (speed of light) 299792458 m/s
To calculate the acceleration due to Solar Radiation Pressure (SRP) a model using the absolute
distance of the spacecraft from the Sun (| |) was used. It was observed over a 14-day evaluation
of the SRP acceleration, that it varied 0.99% over what is approximately equivalent to 1
revolution of a LPO or appoximately half of an orbit about the Earth. To evaluate the
acceleration due to this SRP force, the refectivity constant ( ) of 1.12, perpendicular area ( )
of .95 meters, and spacecraft mass (m) of 85.243 kg were used from mission derived values.
(1)
Where f is the radiative power per unit area. This can be solved for using the folowing
equation,
| | . (2)
Using equations 1 and 2 an approximation for the acceleration on the spacecraft caused by
Sun’s radiation energy can be found.
(3)
A simplified acceleration model from Reference 8 was used to evaluate the acceleration
caused by J2 forces of both the Earth and Moon. For comparison a first order evealuation of the
relativistic effects of the Earth were included in the plot and were derived using the following
equation found in Reference 10.
(
) (4)
To provide a rough estimate of the ability of various accelerations to be recovered in the OD
process, two double-dashed lines in Figure 3 show the first order linear approximations of the
accelerations recoverable for uncertainties related to the in-plane velocity component of the
spacecraft. The ‘high’ value is associated with a 0.01 cm/s uncertainty and the ‘low’ value is
associated with a 0.001 cm/s uncertainty. These values correspond to initial results associated
with the orbit solutions for the mission. Ultimately the ability of the orbit solution to resolve ac-
celerations will be a function of the arc length evaluated and the noise of the measurements.

7
Tracking Stations and Data Types
Tracking both P1 and P2 in the region near the Moon and during the trans-lunar phase, which
saw them travel approximately 1.5 million km from Earth, significantly increased the require-
ments on the data and tracking systems as compared to the systems used previously for the
THEMIS baseline mission. To accommodate these increased demands on both distance and ge-
ometry for tracking, the Artemis mission employs tracking assets from the Deep Space Network
(DSN), the Universal Space Network (USN), and an 11-meter antenna at the University of Cali-
fornia at Berkeley. Primarily the DSN assets used are the 34-meter antennas at Goldstone, CA,
Canberra, Australia, and Madrid, Spain. The USN assets are the 13-meter antennas in Australia
and Hawaii. The specific locations of the stations used for simulation of the data in this report
and their associated parameters will be discussed in the following section.
Data formats from these stations are currently processed by NASA Goddard Space Flight Cen-
ter using the Goddard Trajectory Determination System (GTDS). The information provided in-
cludes range and Doppler tracking data. The USN and Berkeley stations provide this in the Uni-
versal Tracking Data Format (UTDF) while the DSN provides range and range-rate information
in the TRK-2-34 format. 11,12
This DSN format is complex and non-trivial to convert. Embedded
functionality within GTDS, however, is able to convert this data source to the UTDF. Solutions
are then found using the embedded GTDS batch least squares algorithm.
TEST DESCRIPTION
As mentioned previously, the objective of this work is to simulate observational data for the
Artemis mission in the Earth-Moon LPO regime. For this initial study one spacecraft was select-
ed for simulation and evaluation. The focus of analysis was on understanding the effects of errors
on filter performance given a known truth orbit as well as intricacies and nuances of the ODTK
system. Such understanding will benefit future studies in the efforts to perform analysis and vali-
date independent analyses performed with custom filters and scripts.
Specifically explored in the following sections is the effect of known modeling errors on the
orbit determination filter performance for a data arc given operationally informed initial condi-
tions, tracking schedule, observation noise estimates, and spacecraft parameters. The remainder
of this section will outline the parameters used as the baseline for this study with variations and
their effects discussed later.
The initial spacecraft position and velocity information was derived from operational orbit de-
termination solutions provided by the mission team and are displayed in the True of Date refer-
ence frame.
Table 2. Spacecraft Initial Conditions.
Central Body: Earth Initial Epoch: 4 Jan 2011 16:43:30.000 UTCG
True of Date
Initial Position
(x, y, z) 41446.5477729 km -323743.687141 km -138118.185082 km
Inertial Velocity
(vx, vy, vz) 0.8995114561 km/s 0.154223195118 km/s 0.158948565273 km/s

8
Having defined the initial conditions for position, velocity, and epoch from operational mis-
sion solutions in Table 2, the spacecraft parameters were derived from mission information. The
spacecraft mass is specific for spacecraft P2 and represents the mission team estimate of the mass
of the vehicle at the evaluation epoch. The solar pressure area value was derived from operation-
al mission information on what the spacecraft orbit determination solution has consistently con-
verged on. While there may be room for improvement on all of these parameters they are consid-
ered sufficient given the current status of analysis and errors in their modeling will be evaluated
and discussed in the following section. Using the nominal spacecraft values as defined will thus
allow for the evaluation of filter susceptibility to errors or variation in such parameters. The
spacecraft is a spinning vehicle, however for simplicity in this simulation it was assumed to be
aligned/constrained with the body alignment vector in the negative Z direction and the body con-
straint vector in the X direction. Additionally the center of mass was assumed to be at the center
of the spacecraft for simplicity. This simplification is most relevant to the perpendicular cross
sectional area of the spacecraft for evaluation of SRP forces. It is acknowledged that this will
insert modeling errors which will likely need to be resolved in the future.
Table 3. Spacecraft Parameters
Mass (kg) Solar Pressure: Area Solar Pressure:
CPNominal Attitude
85.2553 0.95 m^2 1.12 Aligned/Constrained*
Utilizing the spacecraft parameters from Table 3, the next information required to simulate the
spacecraft behavior is the force model with which to propagate the initial conditions and to which
the filter will attempt to fit the observational data. This baseline force model is shown in Table 4
and incorporates gravitational perturbations from all planetary bodies in the Solar system in addi-
tion to a high fidelity gravity model of the Earth.
Table 4. Spacecraft Force Model (baseline)
Degree and Order 40
Tides Solid: OFF Ocean: OFF
Variational
Equations Degree: 20 Order: 20
Third Bodies Sun, Moon, Mars, Mercury, Venus,
Jupiter, Saturn, Uranus, Pluto
Perturbations SRP: ON Drag: OFF
* Note that the Artemis spacecraft are spinners with a spin rate of approximately 17-20 RPM. This was omitted for
simplicity in this simulation but should be included for future studies.

9
Having the spacecraft and force models sufficiently defined the next critical aspect which
must be defined is the locations and properties associated with ground stations. These ground
stations will subsequently be used to simulate range and Doppler observations for filtering with
alterations to the filter force models. For this study several stations are included in the modeling
and represent a simplification of the operational capabilities employed by the Artemis mission.
Table 5 displays the approximations of the the ground station locations as used in this simulation.
Table 5. Ground Station Locations
Station Geodetic Latitude
(deg)
Geodetic Longitude
(deg) Altitude (m)
Berkeley -35.2192 148.981 0
Canberra (DSN) 34.822609417 239.498148250 271.51
Goldstone (DSN) 35.1186 -116.806 0
Madrid (DSN) 40.2389 -4.2489 0
Australia (USN) -29.200 114.900 250
Hawaii (USN) 19.0000 -155.600 367
These station coordinates thus allow for the simulation of range and Doppler measurements
given the defined initial epoch and satellite state, force models, and satellite parameters.
Additional information which has a non-trivial effect on the ability of the ODTK filter to
converge on an orbit solution is the inclusion of noise and bias factors on the ground stations.
The following measurement statistics were implemented for this simulation based on published
estimates.13
Ultimately evaluation of the observational data will be done to evaluate bias and
noise values within the observation residuals. The parameters outlined in Table 6 are the Bias, a
constant offset between the value of the measurement as predicted by the measurement model and
the observed value of the measurement. The White Noise Sigma is defined as the square root of
the variance representing the random uncertainty in the measurements and the Weight Sigma is
defined as the square root of the variance of a Gauss Markov bias associated with the measure-
ment model.
Table 6. Station Measurement Statistics
Measurement
Type Bias White Noise Sigma Weight Sigma
Range 15.0 m 3 m 20.0
Doppler 0.0 m 0.001 m/sec 0.1
With the modeling information provided to this point it was then possible to create simulated
observations of the P2 spacecraft as it orbits the Earth-Moon L1 point. To maintain validity of the
simulation, the operational tracking schedule over this time period was used and is outlined in
Table 7.

10
Table 7. Observation Intervals
Station Tracking Intervals
Berkeley
5 Jan 2011 16:19:15.000 UTCG - 5 Jan 2011 17:09:15.000 UTCG
6 Jan 2011 17:54:00.000 UTCG - 6 Jan 2011 18:44:00.000 UTCG
6 Jan 2011 22:01:35.000 UTCG - 6 Jan 2011 22:39:00.000 UTCG
7 Jan 2011 02:44:40.000 UTCG - 7 Jan 2011 03:14:50.000 UTCG
8 Jan 2011 19:33:30.000 UTCG - 8 Jan 2011 20:23:30.000 UTCG
Canberra (DSN) 8 Jan 2011 08:20:00.000 UTCG - 8 Jan 2011 10:20:00.000 UTCG
Goldstone (DSN) 5 Jan 2011 20:10:00.000 UTCG - 5 Jan 2011 21:25:00.000 UTCG
Madrid (DSN) 7 Jan 2011 16:55:00.000 UTCG - 7 Jan 2011 18:50:00.000 UTCG
Australia (USN) 7 Jan 2011 00:30:00.000 UTCG - 7 Jan 2011 01:00:00.000 UTCG
Hawaii (USN) 8 Jan 2011 21:00:00.000 UTCG - 8 Jan 2011 21:30:00.000 UTCG
To validate that the simulation of data and the filter were working properly, observations were
generated with no added errors. This would provide quantification of the errors caused by noise
and bias on the observation data. Filter performance was evaluated based on the aforementioned
modeling conditions with the ODTK sequential filter which resulted in 3D position RMS of
0.01362 m and 3D velocity RMS of 8.7433e-008 m/s. To further refine the solution, the smooth-
er function within ODTK was implemented and found to result in 3D position RMS of 7.276e-
004 m and 3D velocity RMS of 6.0476e-009 m/s which can be considered the lowest attainable
RMS errors given the noise on the data and observation lengths. The lack of process noise added
through the filtering process renders this smoother result as merely a mapping of the final state
solution backward in time.
RESULTS
Using the previously described simulation set-up, three error sources were evaluated and the
following results outline the effect of known errors in the modeling of planetary ephemerides,
solar radiation pressure reflectivity constant, and solar radiation pressure cross-sectional area.
These results are meant to quantify the impact on accuracy of the sequential filter and the
smoother within ODTK based on known errors. Such information provides insight into the im-
pact and relative importance of spacecraft parameters needed for future work post-processing the
orbit solutions for improved accuracy and dynamical knowledge.
The first error which was evaluated using this simulation was the absence of planetary pertur-
bations. An initial simulation of this effect was done with third body perturbations in the filter
including only the Moon and Sun with the central body in the filter being the Earth. This is a
common approximation used to simplify calculations in this regime. Calculated with the mission
observations over the arc under consideration, the following results demonstrate the impact of
omitting these planets in the force modeling for the filter and subsequently the smoother function.

11
Inertial Position RMS [x, y, z] (m): 0.25072801, 0.26276446, 0.31865537
Inertial Velocity RMS [vx, vy, vz] (m/s): [1.66819e-006, 5.492091e-006, 1.907048e-006]
3D Position RMS (m): 0.434702764
3D Velocity RMS (m/s): 5.7674966e-006
Figure 4. Dynamic Model Error Evaluation I
In order to display the data some plots do not include the 1-sigma covariance envelope into
which all solution errors are found. Introducing Jupiter and Saturn into the force model for the
filter and the smoothed results are shown below in Figure 5.
Inertial Position RMS [x, y, z] (m): 0.006425941, 0.0156984, 0.00698146
Inertial Velocity RMS [vx, vy, vz] (m/s): [1.727184e-007, 2.697031e-007, 1.138552e-007]
3D Position RMS (m): 0.01734142
3D Velocity RMS (m/s): 3.0599783e-007
Figure 5. Dynamic Model Error Evaluation II
Looking next to the effect of an error in modeling the solar radiation coefficient of reflectivity,
multiple cases were run and a representative error of 5% is shown in Figure 6. These results are
from running the filter with a solar radiation coefficient of reflectivity equal to 1.064 compared to
the nominal ‘truth’ value of 1.12. In these results, as observed in other figures, the error in the
radial direction is much smaller than the in-track and cross-track error directions.
Inertial Position RMS [x, y, z] (m): 3.96644212, 4.6905965, 10.1605366
Inertial Velocity RMS [vx, vy, vz] (m/s): [2.092476e-005, 7.366856e-005, 5.308424e-005]
3D Position RMS (m): 11.4206805
3D Velocity RMS (m/s): 8.9222149e-005
0 200 400 600 800 1000 1200 1400 1600 1800-2
0
2RIC Position Errors (red), 1-Sigma Covariance Envelope (green)
R-p
ositio
n
Err
or
(m)
0 200 400 600 800 1000 1200 1400 1600 1800-2
0
2
I-p
ositio
n
Err
or
(m)
0 200 400 600 800 1000 1200 1400 1600 1800-2
0
2
C-p
ositio
n
Err
or
(m)
Observation #
0 200 400 600 800 1000 1200 1400 1600 1800-2
0
2x 10
-5 RIC Velocity Errors (red)
Rd
ot
Err
or
(m/s
)
0 200 400 600 800 1000 1200 1400 1600 1800-2
0
2x 10
-5
Ido
t E
rro
r (m
/s)
0 200 400 600 800 1000 1200 1400 1600 1800-2
0
2x 10
-5
Cd
ot
Err
or
(m/s
)
Observation #

12
Figure 6. Coefficient of Reflectivity Evaluation
Looking again at the force of solar radiation pressure and its effect on the orbit solution filter
performance, the cross sectional area used to calculate the solar radiation pressure force was al-
tered in the third simulation case. Similar to the previous simulation, this value was modeled in
the filter with ~5% error. Instead of the nominal .95 square meter area, it was instead modeled
with a cross sectional area of .90 square meter. The resulting errors are displayed in the Figure 7.
Inertial Position RMS [x, y, z] (m): 4.3788182, 5.1735448, 11.109153
Inertial Velocity RMS [vx, vy, vz] (m/s): [2.2957514e-005, 8.027695e-005, 5.781153e-005]
3D Position RMS (m): 12.520693
3D Velocity RMS (m/s): 9.71735123e-005
Figure 7. Cross Sectional Area Evaluation
0 200 400 600 800 1000 1200 1400 1600 1800
-20
0
20
RIC Position Errors (red), 1-Sigma Covariance Envelope (green)
R-p
ositio
n
Err
or
(m)
0 200 400 600 800 1000 1200 1400 1600 1800
-20
0
20
I-p
ositio
n
Err
or
(m)
0 200 400 600 800 1000 1200 1400 1600 1800
-20
0
20
C-p
ositio
n E
rro
r (m
)
Observation #
0 200 400 600 800 1000 1200 1400 1600 1800-2
0
2x 10
-4 RIC Velocity Errors (red)
Rd
ot
Err
or
(m/s
)
0 200 400 600 800 1000 1200 1400 1600 1800-2
0
2x 10
-4
Ido
t
Err
or
(m/s
)
0 200 400 600 800 1000 1200 1400 1600 1800-2
0
2x 10
-4
Cd
ot
Err
or
(m/s
)
Observation #
0 200 400 600 800 1000 1200 1400 1600 1800-10
0
10RIC Position Errors (red), 1-Sigma Covariance Envelope (green)
R-p
ositio
n
Err
or
(m)
0 200 400 600 800 1000 1200 1400 1600 1800-10
0
10
I-p
ositio
n
Err
or
(m)
0 200 400 600 800 1000 1200 1400 1600 1800-10
0
10
C-p
ositio
n
Err
or
(m)
Observation #
0 200 400 600 800 1000 1200 1400 1600 1800-2
0
2x 10
-4 RIC Velocity Errors (red)
Rd
ot
Err
or
(m/s
)
0 200 400 600 800 1000 1200 1400 1600 1800-2
0
2x 10
-4
Ido
t
Err
or
(m/s
)
0 200 400 600 800 1000 1200 1400 1600 1800-2
0
2x 10
-4
Cd
ot
Err
or
(m/s
)
Observation #

13
A final simulation was run including all of the previous error sources in a single filter run.
These results are shown in Figure 8 and represent a worst-case scenario given the modeled error
sources.
Inertial Position RMS [x, y, z] (m): 8.4464378, 10.051105, 21.373203
Inertial Velocity RMS [vx, vy, vz] (m/s): [4.2851904e-005, 0.00015576432, 0.0001110488]
3D Position RMS (m): 24.12931891
3D Velocity RMS (m/s): 0.00018772778
Figure 8. Cumulative Error Performance
DISCUSSION
As presented in Figure 3, the relative perturbations on the 5-day arc of the LPO provide initial
insight into the impact of force modeling on propagation and filter performance. This figure is
meant to exhibit the force impact in the specific case of the P2 spacecraft during a 5-day section
of its orbit in January 2011. This figure is not meant to apply universally to other LPO regions or
time-periods although future efforts to generate longer time-scale and higher fidelity information
has the potential to provide valuable insight in the preparation of filtering schemes or the simpli-
fication of force modeling. Of the resulting acceleration magnitudes identified, solar radiation
pressure presents the most difficulty in modeling or accurately quantifying. Planetary ephemeri-
des can be incorporated into filter force models or into propagation schemes relatively easily as
compared to the dynamic effects of varied solar radiation pressure on a spacecraft. This problem
was outlined recently by McMahon, who put forth an analytical theory to model solar radiation
pressure effects on spacecraft.14
Additional unmodelled accelerations or unaccounted for perturbations are undoubtedly present
in the true operational environment. The first result discussed as a validation step in this simula-
tion demonstrated that using published estimates for the noise on observations and given a nomi-
nal tracking schedule for the Artemis mission, filter performance as measured by 3D RMS errors
and after being smoothed were found to be 7.276e-004 m in position and 6.0476e-009 m/s in ve-
locity. These are admittedly created under ideal simulated circumstances but are demonstrative
of achievable fidelity. Future work investigating the observation residuals for the Artemis data
has the potential to refine knowledge of the true observation noise present and thus the attainable
fidelity with which the spacecraft states can be solved for. A better quantification of this fidelity
will open the door to advanced schemes for recovering unmodelled accelerations such as the use
0 200 400 600 800 1000 1200 1400 1600 1800-50
0
50RIC Position Errors (red), 1-Sigma Covariance Envelope (green)
R-p
ositio
n
Err
or
(m)
0 200 400 600 800 1000 1200 1400 1600 1800-50
0
50
I-p
ositio
n
Err
or
(m)
0 200 400 600 800 1000 1200 1400 1600 1800-50
0
50
C-p
ositio
n
Err
or
(m)
Observation #
0 200 400 600 800 1000 1200 1400 1600 1800-5
0
5x 10
-4 RIC Velocity Errors (red)
Rd
ot
Err
or
(m/s
)
0 200 400 600 800 1000 1200 1400 1600 1800-5
0
5x 10
-4
Ido
t E
rro
r (m
/s)
0 200 400 600 800 1000 1200 1400 1600 1800-5
0
5x 10
-4
Cd
ot
Err
or
(m/s
)
Observation #
14
of second order Gauss-Markov processes.15
Moreover, the use of filtering schemes such as an
Extended Kalman Filter (EKF) to update the reference trajectory or an Uncented Kalman Filter
(UKF) for improved non-linear filtering and quantification of realistic uncertainty bounds will be
explored.
The simulations presented in this work demonstrate that uncertainty in spacecraft parameters
has the potential for more significant filter errors than does planetary ephemerides or gravitational
models. In addition to the added susceptibility of orbit determination filters to errors in modeling
solar radiation pressure in the LPO region, there is also an inherent problem with observation ge-
ometry in this regime. Although not seen in all figures due to the emphasis on displaying orbit
errors, in Figures 4, 6, 7, & 8, the radial direction in all cases has lower uncertainty as compared
to the in-track and cross-track directions. This is a result of having Earth based observations
which are geometrically constrained to favor the radial direction.
Better observation geometry would provide mission designers with improved performance
relative to uncertainty and ultimately improved accuracy potential. Adding inter-spacecraft data
to the filter process has the potential to provide this added geometric robustness. Prior work has
demonstrated the ability of both relative and absolute orbit determination capabilities for space-
craft in a LPO due to the asymmetry of the gravitational field and the resulting uniqueness of or-
bit behavior.16
Alternately, recent work by Tombasco has investigated a similar constraint for sat-
ellites in GEO with poor geometric observability. This work has demonstrated that the selection
of differing element sets for orbit determination can improve filter performance in the presence of
poor geometric observability.17
CONCLUSIONS
Simulating the operational environment for the P2 spacecraft of the Artemis mission has led to
the quantification of individual relative acceleration contributions on the satellite. It has also
demonstrated the effect on filter/smoother performance within ODTK of observation noise, errors
in modeling gravitational contributors and uncertainties associated with solar radiation parame-
ters. Filter performance was shown to be minimally effected by observation noise as modeled.
Omitting planetary perturbations resulted in modest RMS errors. Incorrect spacecraft modeling
with respect to solar radiation pressure was seen to exhibit non-negligible RMS errors. The ulti-
mate goal of this work is to improve understanding of operations in the Earth-Moon LPO regime.
This is significantly driven by the need for orbit determination solutions that enable frequent sta-
tionkeeping maneuvers to remain in highly dynamic orbits. Future improvements to obtaining
orbit solutions for spacecraft will require improvements in data sources, filter schemes, and oper-
ational execution to minimize cost and increase operability. Opportunities for follow-on studies
in this area are bountiful and will be based upon this preliminary work to further study operation-
al constraints to efficient orbit determination. Some areas that this future work may include are
the study of solar radiation pressure on orbit accuracy, the potential for specific element sets or
frames to improve orbit determination filter performance, the benefit of modeling spacecraft ma-
neuvers in the orbit determination filter over longer filter times, the evolution of non-Gaussian
uncertainty throughout the orbit and given differing observation geometries, and the true meas-
urement noise by evaluating operational measurement residuals.
Information on relevant forces, appropriately modeling such influences, and realistically quan-
tifying the uncertainty associated with orbit solutions are significant motivating factors for study-
ing Artemis operational data. These forces, modeling parameters, and uncertainties have a direct
impact on the ability of orbit determination filters to produce accurate results. As was demon-

15
strated in the simulated cases for this paper, accuracy in orbit solutions is tied to the ability to
know spacecraft parameters with a high degree of confidence. In a broader sense this knowledge
relates to the fundamental challenge facing LPO utilization: orbit determination. Sufficient per-
formance has been demonstrated using traditional software and tracking capabilities by the Arte-
mis mission team to plan station keeping maneuvers and maintain orbits in the region.18
As the
Artemis spacecraft begin the Lunar orbit phase of their mission untold additional science and en-
gineering data will be generated for evaluation. Future missions to the Earth-Moon LPO region
will benefit tremendously from the work done by the Artemis mission team. It is the hope of the
authors of this work to build upon this incredible achievement and to improve our fundamental
knowledge of the Earth-Moon region with the ultimate goal of enabling robust utilization of libra-
tion point orbits in cis-lunar space.
ACKNOWLEDGMENTS
This work is made possible by the close collaborative assistance of David Folta and Mark
Woodard within the Flight Dynamics Branch at NASA Goddard Space Flight Center.
This work was supported by the Department of Defense (DoD) through the National Defense
Science & Engineering Graduate Fellowship (NDSEG) Program.
REFERENCES
1 Hill K., J. Parker, G. H. Born, and N. Demandante, “A Lunar L2 Navigation, Communication, and Gravity Mission,”
Paper AIAA 2006-6662, AIAA/AAS Astrodynamics Specialist Conference, Keystone, Colorado, August 21-24, 2006.
2 Folta, D., and F. Vaughn, “A Survey of Earth-Moon Libration Orbits: Stationkeeping Strategies and Intra-Orbit
Transfers,” Paper AIAA 2004-4741, AIAA/AAS Astrodynamics Specialist Conference, Providence, Rhode Island,
August 16-19 August, 2004.
3 Woodard, M., David Folta, and Dennis Woodfork, “ARTEMIS: The First Mission to the Lunar Libration Orbits.”
2009.
4 Broschart, S.B.,M-K.J. Chung, S.J. Hatch, J.H. Ma, T.H. Sweetser, S.S. Weinstein-Weiss, and V. Angelopoulos, “Pre-
liminary Trajectory Design for the ARTEMIS Lunar Mission,” AAS Paper 09-382, AAS/AIAA Astrodynamics Spe-
cialists Meeting, Pittsburgh, PA, August 10-13, 2009.
5 Angelopoulus, V., The ARTEMIS Mission, Space Science Reviews, August 2010. doi:10.1007/s11214-010-9687-2.
6 Szebehely, V., Theory of Orbits: The Restricted Problem of Three Bodies, Academic Press, New York, 1967.
7 Farquhar, R. W., “Lunar Communications with Libration-Point Satellites,” Journal of Spacecraft and Rockets, Vol-
ume 4(10), 1967.
8 Vallado, D.A. and W.D. McClain, Fundamentals of Astrodynamics and Applications, Space Technology Library,
Springer Link. 2001.
9 Konopliv, A.S., et al. “Improved Gravity Field of the Moon from Lunar Prospector,” Science 281(1476), 1998.
doi:10.1126/science.281.5382.1476 LUNAR PAPER
10 Montenbruck, O. and E. Gill, Satellite Orbits – Models, Methods, and Applications, Springer-Verlag, Heidelberg,
2000.
11 “Deep Space Network Services Catalog,” DSN No. 820-100, Rev. E, JPL D-19002, December 17, 2009.
12 “TRK-2-34 DSN Tracking System Data Archival Format,” DSN No. 820-013, Rev I-1, JPL D-16765, February 29,
2008.

16
13 Schanzle, A., D. Kelbel, and D. Oza, “Error Sources and Nominal 3-sigma Uncertainties for Covariance Analysis
Studies using ODEAS (Update No. 2),” Task Assignment 55 737, NASA GSFC, May 31, 1995.
14 McMahon, J.W., “An Analytical Theory for the Perturbative Effect of Solar Radiation Pressure on Natural and Arti-
ficial Satellites,” Ph.D Thesis, University of Colorado Boulder. 2011.
15 Leonard, J.M., F.G. Nievinski, and G.H. Born, “Gravity Error Compensation Using Second-Order Gauss-Markov
Processes,” AAS 11-502, AAS/AIAA Astrodynamics Specialist Conference, Girdwood, Alaska, July 31 – Aug. 4,
2011.
16 Hill, K., “Autonomous Navigation in Libration Point Orbits,” Ph.D Thesis, University of Colorado Boulder, 2007.
17 Tombasco, J., “Orbit Estimation of Geosynchronous Objects Via Ground-Based and Space-Based Optical Tracking,”
Ph.D. Thesis, University of Colorado Boulder, 2011.
18 Woodard, M., D. Cosgrove, P. Morinelli, J. Marchese, B. Owens, and D. Folta, “Orbit Determination of Spacecraft
in Earth-Moon L1 and L2 Libration Point Orbits,” AAS 11-515, AAS/AIAA Astrodynamics Specialist Conference,
Girdwood, Alaska, July 31 – Aug. 4, 2011.


![Orbit type: Sun Synchronous Orbit ] Orbit height: …...Orbit type: Sun Synchronous Orbit ] PSLV - C37 Orbit height: 505km Orbit inclination: 97.46 degree Orbit period: 94.72 min ISL](https://img.dokumen.tips/doc/110x75/5f781053e671b364921403bc/orbit-type-sun-synchronous-orbit-orbit-height-orbit-type-sun-synchronous.jpg)