Embed Size (px)
Citation preview

12-1
Evaluating Legal Risks and Costs with Decision Tree Analysis by: Craig B. Glidden, Executive Vice President & Chief Legal Officer, LyondellBasell Clyde W. Lea, Deputy General Counsel, Litigation & Arbitration, ConocoPhillips and Marc B. Victor, President, Litigation Risk Analysis, Inc.
Chapter 12 of Successful Partnering Between Inside and Outside Counsel (Robert L. Haig ed.) (West & Association of Corporate Counsel 2000). Selected portions reprinted with permission. © 2013 Thomson Reuters.
§ 12:1 Scope note § 12:2 Selecting an approach for evaluating legal risks § 12:3 —The need for risk analysis § 12:4 —Practical considerations § 12:5 — —Objectives § 12:6 — —Commitment § 12:7 — Best practice characteristics § 12:8 ConocoPhillips’ litigation management process § 12:9 —Previous ad hoc approach and its problems § 12:10 —Implementation § 12:11 Preliminary considerations § 12:12 —Determining litigation objectives § 12:13 —Estimating litigation cost § 12:14 —Approximating maximum litigation risk § 12:15 —Persons responsible for performing risk analysis § 12:16 Analysis of risk, cost and value § 12:17 —Dependency diagrams § 12:18 —Decision trees § 12:19 —Lists of reasons § 12:20 —Probability and verdict range assessments § 12:21 —Compound probabilities and the expected value § 12:22 —Potential adjustments to the expected value § 12:23 — —Litigation costs § 12:24 — —Willingness and ability to take risk § 12:25 — —Impact on other litigation or on other business § 12:26 —Cost-benefit analysis using sensitivity analyses § 12:27 —Identifying creative settlements using sensitivity analyses § 12:28 Benefits of using decision tree analysis in negotiation and mediation § 12:29 Benefits of using decision tree analysis in guiding alternative fee arrangements § 12:30 Benefits to the corporate law department of using decision tree analysis § 12:31 Benefits to the business client of using decision tree analysis § 12:32 Benefits to outside counsel of using decision tree analysis § 12:33 Risk analysis checklist

12-2
§ 12:1 Scope note This Chapter discusses and contrasts “intuitive” and “quantitative” models for making decisions about which risks to take and which costs to incur in the corporate legal environment. With the goals of facilitating decision making, achieving better results, and reducing unnecessary costs, ConocoPhillips Company (“ConocoPhillips”) has embraced a quantitative model for evaluating its litigation portfolio and making other legal decisions. ConocoPhillips’ experience in successfully implementing a quantitative model is a useful example of the opportunities and challenges presented by eschewing a solely intuitive approach to legal decision making.
The primary focus of this Chapter will be the application of quantitative analysis to litigation, the most common area of risk management encountered by corporate counsel.1 Although litigation is the primary focus, the principles and practices discussed are equally applicable to other aspects of the legal function. The methodical application of risk and cost management techniques can enhance the performance of any legal function, such as conducting due diligence examinations, planning strategy for regulatory proceedings, and structuring business transactions.
The particular quantitative model described in this Chapter is a form of decision tree analysis called Litigation Risk Analysis™ (“LRA”). This procedure, developed by attorney Marc B. Victor, has been utilized by numerous in-house legal departments, including ConocoPhillips and LyondellBasell, and by many outside law firms. Its primary tools for analyzing risk in the litigation context will be examined: the Dependency Diagram, the Decision Tree, and the Sensitivity Analysis. Use of these tools—ideally by in-house and outside counsel working together, with the assistance of a litigation risk specialist on complex, high-exposure matters—will be shown to promote a better understanding of the key areas of litigation uncertainty and the factors primarily influencing them, and a more realistic assessment of the potential range of litigation results. Once the litigation alternatives, probabilities, and potential economic gains or exposures are identified, the costs of achieving these objectives are analyzed. Most importantly, this process fosters the focused use of legal resources to maximize the probabilities of success. In addition, LRA simultaneously provides a basis for determining a reasonable settlement value for any dispute.
The LRA methodology can be applied to all types of litigation, from once-in-a-lifetime, “bet the company” commercial disputes to high-volume, small personal injury claims. When implemented, such an explicit and formalized methodology for analyzing and deciding on litigation risks offers great benefits to all involved—in-house counsel, their corporate clients, and their outside legal advisors.
1In this Chapter, the term risk will be used to connote both the exposure to loss and the opportunity for
gain. While corporate clients are usually called upon to defend lawsuits, it is also true that corporations pursue litigation to obtain business or economic benefits. The principles articulated in this Chapter are equally relevant to litigating as a plaintiff or as a defendant.

12-3
§ 12:16 Analysis of risk, cost and value2 As has been noted in § 12:3, performing a comprehensive risk analysis usually serves several purposes: in addition to providing a quantitative analysis of the risks inherent in pursuing a given legal strategy, it imposes a valuable rigor on the attorney’s identification of the important issues and forces a thorough understanding of their significance. To illustrate, consider the following problem:
Two years ago, your company, Eagle Oil Incorporated, executed a Marketing Agreement with Sparrow Corporation whereby Eagle would encourage and support installation of Sparrow’s aviation system at Eagle’s customers (and at businesses not yet served by either), while Sparrow would provide its system to businesses that used Eagle fuel. Sparrow has recently filed a complaint against Eagle, alleging breach of contract, as well as detrimental reliance, and fraudulent and negligent misrepresentation.
Specifically, Sparrow now claims that Eagle breached the provision of the Agreement obligating Eagle to “use its best efforts to implement the installation of Sparrow’s product with customers of Eagle and others ... .” Sparrow also claims that Eagle induced execution of the Marketing Agreement on the basis of deliberate and false representations regarding Eagle’s commitment of personnel and money to the undertaking and regarding its ability to deliver business to Sparrow. Sparrow further alleges that, even independently of any contract rights, it detrimentally relied on the promises made by Eagle and invested substantial amounts of money, time and other resources.
Sparrow is seeking damages of $20 million—$2 million for the capital investments it made in reliance on Eagle’s promises, $8 million for the present value of its lost profits, and $10 million in punitive damages.
Eagle denies Sparrow’s allegations in their entirety. Furthermore, your business people have told you that the reasons why Sparrow has incurred losses on its product are because it was overpriced and because of technical problems that Sparrow was slow to solve.
§ 12:17 Analysis of risk, cost and value— Dependency diagrams The first step in performing a good risk analysis of litigation is to identify the uncertainties that will affect the amount of money3 your client will be ordered to pay (if defendant) or will be awarded (if plaintiff), and to explore their interrelationships using a dependency diagram. A dependency diagram (such as the partial one in Figure 1), therefore, consists of two parts: (1) a description of the uncertainties counsel feels the judge and/or jury will consider (the questions in the bubbles) and (2) a statement of how each uncertainty impacts
2A number of business school textbooks provide in-depth treatment of decision tree analysis. See Clemen
and Reilly, Making Hard Decisions (2013); Raiffa, Decision Analysis: Introductory Lectures on Choices Under Uncertainty (1968); Skinner, Introduction to Decision Analysis (2009).
3This discussion focuses on litigation in which the sole consequence is the potential exchange of money between the parties. Of course, in some cases the primary or sole consequence of concern is the possibility of injunctive relief, while in others it is the possible precedential effect on existing or likely additional lawsuits. Although these consequences may be difficult to value in dollar terms—and may require the identification and eventual quantification of additional uncertainties such as “How much will my market share change if I must redesign my product?” or “How many more lawsuits will I get if I lose this one? If I settle this one?”—litigation that raises such issues can and should also be subjected to a rigorous risk analysis such as described throughout this Chapter.

12-4
the chances of liability or the amount the client will pay or receive (the comments on the arrows).
FIGURE 1. PARTIAL DEPENDENCY DIAGRAM —Analysis of a Single Claim—
At the outset of § 12:16, it was stated that the exercise of performing a risk analysis “imposes a valuable rigor on the attorney’s identification of the important issues and forces a thorough understanding of their significance.” This occurs as a result of the two basic rules for constructing a good dependency diagram:
Rule I— Concerning the uncertainties in the bubbles: Write each as a long, unambiguous question, framed the way you think the trier would. In other words, avoid using only one- or two-word legalese such as “breach” and “proximate cause.”
Rule II— Concerning the arrows and their associated comments: For each uncertainty, be sure to identify what the consequences are of both a favorable and an unfavorable result. In other words, indicate what other issues are impacted, and in what way.
In cases with multiple claims, it is especially important to try to construct a complete dependency diagram. In Figure 2, for example, which issues should be interconnected and how should each arrow be labeled? If the jury thinks Eagle did breach the contract, is it even important to analyze the other two claims? And if the jury does not think Eagle breached the contract, could the jury nonetheless find detrimental reliance or fraudulent misrepresentation? What if the jury does not think Eagle fraudulently misrepresented something material to induce execution of the contract, could the jury still find Eagle liable for detrimental reliance? And even if the jury technically could, do you think it would—in other words, if Sparrow’s facts and witnesses did not persuade the jury to find fraudulent misrepresentation, do you think the same facts and witnesses would persuade the same jury to find detrimental reliance? If not, are there any other facts you could imagine Sparrow pointing to on the latter claim that it would not have used on the former one? As shown in § 12:18, if the legal reasoning that is implied by the arrows and comments is flawed, so will be the decision tree, and thus, so will be the
Will jury find Eagle failed to use its "best efforts" to
implement installation of Sparrow's product with
customers of Eagle and others?
Will jury find Eagle liable under Sparrow's
breach of contract claim?
Will jury believe that Eagle's breach
caused at least some of Sparrow's losses?
if no, no
if yes
if yes also, yes if no, no

12-5
quantitative results.
FIGURE 2. INCOMPLETE DEPENDENCY DIAGRAM —Analysis of Multiple Claims (Missing Arrows and Comments)—
A thorough dependency diagram will also show the key damage uncertainties, and specify how different liability claims either allow for or preclude the award of different types of damages as a matter of law. For example, the Sparrow v. Eagle dependency diagram might indicate that punitive damages could be awarded under the fraudulent misrepresentation claim but not, in this jurisdiction, under the breach of contract or detrimental reliance claims. Legal uncertainties can and should also be included on the diagram. For example, if it is uncertain whether the trial judge or appellate court will allow for a type of damages (e.g., lost profits) to be awarded under a particular liability claim (e.g., detrimental reliance), the diagram should include a bubble reflecting that uncertainty as well as the jury uncertainty of “how much,” as illustrated in Figure 3. (Note that Figure 3 has been constructed as if Sparrow’s only claim was for liability arising out of detrimental reliance.)
Will Eagle have any liability to
Sparrow?
Will jury find Eagle liable
under Sparrow's breach of contract claim?
Will jury find Eagle liable
under Sparrow's detrimental
reliance claim?
Will jury find Eagle liable
under Sparrow's fraudulent
misrepresentation claim?

12-6
FIGURE 3. PARTIAL DEPENDENCY DIAGRAM —Damage Analysis of a Single Claim—
Finally, a dependency diagram should capture those evidentiary uncertainties upon which other key issues depend. (Hence the name “dependency” diagram.) For example, if the jury’s likelihood of finding liability depends significantly on the judge’s ruling with respect to the admissibility of some testimony, or on your ability to locate a particular document or witness, the diagram should so indicate, as illustrated in Figure 4.
FIGURE 4. PARTIAL DEPENDENCY DIAGRAM —Inclusion of an Influencing Uncertainty—
How much will jury award in lost profits?
Will jury find Eagle liable
under Sparrow's detrimental
reliance claim?
Will judge allow jury to award lost profits for liability under
this claim?
How much will jury award in reliance damages
-- i.e., how much will it feel was invested specifically
in reliance on Eagle's promises, and how much of that
investment is now worthless?
if yes
only if yes (if no, $0)
only if yes (if no, $0)
if no, $0
Will jury find Eagle liable
under Sparrow's fraudulent
misrepresentation claim?
Will Eagle's negotiator (since terminated) agree to testify for
Sparrow?
if yes, hurts if no, helps
12-7
§ 12:18 Analysis of risk, cost and value— Decision trees When the attorney responsible for the case has captured all of the key uncertainties and their interrelationships in the correct dependency diagram, this information is then converted into a decision tree (or in complex cases, a “main” tree and a number of “sub” trees). The decision tree will show all of the possible litigation scenarios implied by the dependency diagram, along with their respective consequences, and thus is a powerful tool in communicating with the business client how the legal and factual uncertainties in a case could play out. In addition, the decision tree provides the framework for combining probabilities and verdict ranges to arrive at the case value, much as an income statement provides the framework for combining various income and expense items to arrive at net profit.4 If the dependency diagram is complete—i.e., if all important liability and damage, legal and factual, uncertainties have been included, and if the legal reasoning implied by the existence (or non-existence) of specific arrows along with their associated comments is sound—converting it into the correct decision tree does not require any further legal expertise. That has already been fully captured in the dependency diagram. Instead, one merely needs to follow a few rules. These are best understood while comparing the dependency diagram of Figure 3 with the decision tree of Figure 5.5
Rule I— Any uncertainty at the base of an arrow must go earlier in the tree than (i.e., to the left of) the uncertainty at the tip of that arrow.
Rule II— There are as many “branches” for an uncertainty as there are possible ways in which the uncertainty could be resolved. An exception is that range-type issues (e.g., “How much will the jury award for reliance damages?”) are usually approximated with three branches representing high, middle, and low values along the potential range.6
Rule III— An uncertainty (which is indicated in the tree by a circle, or “chance node”) must be appended to all relevant branches of the prior uncertainty, such that each uncertainty occupies its own “column” in the tree.
4See § 12:21. 5Although the decision tree in Figure 5 reflects everything contained in the dependency diagram of Figure
3, because this dependency diagram was only a “partial” one of a far more complex dispute, this decision tree in turn is far simpler than the full tree that would correctly reflect the entire problem. That tree would need to capture all of the liability theories (see Figure 2), including the elements the jury would focus on for each theory (e.g., see Figure 1), all key evidentiary uncertainties (e.g., see Figure 4), and all related damage issues.
6In truth, the decision tree at this stage of the risk analysis would typically not yet have dollar amounts on the branches (and thus would not have computed “Totals” at the end of each scenario). Instead, one would see only the words “high,” “middle,” and “low” on the branches. It is not until the ranges have been carefully assessed (see § 12:20) that dollar amounts can be placed on the branches and that totals can be calculated. Dollar amounts have been placed prematurely in this tree to make it easier for the uninitiated to understand.

12-8
FIGURE 5. DECISION TREE —Corresponding to Issues Shown in Dependency Diagram at Figure 3—
§ 12:19 Analysis of risk, cost and value— Lists of reasons In order to assess realistic probabilities and verdict ranges, counsel must first think about all the things that the trier will be thinking about when it decides the case. Thus, the next step in performing a correct risk analysis consists of collecting the information—both pro and con—that is relevant to each of the uncertainties in the decision tree. Some of this information will be readily available—e.g., contract terms, product specs, key client correspondence, interviews with employees, case law, knowledge about the judge, experience with juries in the venue, the skill of opposing counsel, etc. Other information will develop more slowly—e.g., from interrogatories and depositions, expert witness studies, community surveys, etc.
Range of
$7.5 M
potential jury awards for lost profits
TOTAL = $9.5M
$5.0 M TOTAL = $7.0M
$3.0 M TOTAL = $5.0M
$2.0 M
Range of potential jury awards for reliance damages
$7.5 M TOTAL = $9.0M
$5.0 M TOTAL = $6.5M
$3.0 M TOTAL = $4.5M
$1.5 M
$7.5 M TOTAL = $8.5M
$5.0 M TOTAL = $6.0M
$3.0 M TOTAL = $4.0M
$1.0 M
lost profits allowed (in addition to reliance damages)
Judge's ruling re: whether lost profits can be awarded for detrimental reliance
$2.0 M TOTAL = $2.0M
$1.5 M TOTAL = $1.5M
$1.0 M TOTAL = $1.0M
lost profits not allowed (only reliance damages)
Eagle is liable
Jury finding re: detrimental reliance
Eagle not liable
TOTAL = $0.0M
LITIGATE

12-9
Both because an early assessment of risk may be desired, and because the exercise of thinking about how an issue might be won or lost can greatly increase the efficiency and success of one’s pre-trial activities, counsel is encouraged to develop lists of reasons at an early stage of the problem. These lists of reasons should summarize information on hand as well as facts that either side might uncover during discovery, evidentiary rulings the judge might make, or information you might be able to develop that would improve your chance of winning. By including the latter types of factors, you will reduce the chance of unpleasant surprises and improve the chance of having winning arguments and evidence to present at trial. As the case progresses, the lists can be easily updated. One list—consisting of both a “pro” and a “con” side—should be developed for each uncertainty captured in your decision tree. In preparing the “con” side, do not understate your opponent’s arguments; rather, try to use the same language you anticipate opposing counsel will use in addressing the trier. A sample list of reasons has been started in Figure 6. Information not yet developed, or uncertainties not yet resolved, are preceded by “IF.”
FIGURE 6. LIST OF REASONS —On Issue of “Best Efforts”—
• Eagle had every incentive to try to make Sparrow’s product a big success, since Sparrow would help promote Eagle fuel at new locations
• Although Eagle is a large company, the division that entered the agreement with Sparrow is about the same size as Sparrow
• Although Eagle assigned only one person full-time to market the Sparrow product, lots of other employees spent part-time on the project {note to file: need graph showing total # of hours and dollars spent, company-wide, and some way of making these look enormous}
• Eagle’s promise to use best efforts to implement installation of Sparrow’s product did not obligate it to sacrifice its own interests; Eagle was afraid that if it told customer who was about to install competing product to “hold off,” customer might drop Eagle as fuel supplier
• IF Eagle can get customers to testify on its behalf, both about Eagle’s efforts and about the technical and financial reasons they chose not to install the Sparrow product
• More recent cases in this state equate “best efforts” with “in good faith and in accordance with fair dealing,” and not much more than that
• Eagle is such a large company (with annual sales in the billions), yet it only assigned one person full-time to market the Sparrow product
• Eagle’s significant witness may be defensive on cross
• Eagle was slow to include Sparrow’s product in its promotional material
• IF any evidence surfaces that Eagle thought installation of Sparrow’s product would actually reduce Eagle’s sales
• Jury upset that Eagle did not tell Sparrow that one of Eagle’s largest customers was about to install a competing product, so Sparrow could make a sales pitch before customer signed contract
• IF judge allows Sparrow to testify about all the “requirements for success” it outlined to Eagle during the negotiations over the agreement, even though these were not incorporated into the final written agreement
• IF the judge instructs that “best efforts” language imposes a requirement substantially greater than just “good faith efforts” would
Reasons Why Jury Finds Eagle DID Use Its Best Efforts
Reasons Why Jury Finds Eagle FAILED to Use Its Best Efforts

12-10
§ 12:20 Analysis of risk, cost and value— Probability and verdict range assessments
Once all of the lists have been developed (as thoroughly as is possible considering the current stage of the litigation), it is time to assess the probability of success on each issue. There are a few important points to bear in mind.
Rule I— Although it is okay to begin your assessment process by thinking that you are “quite likely” to prevail on one issue, or that you have “some chance, but it won’t be easy” to win another issue, you will quickly have to convert your opinions into numerical probabilities (i.e., percentages). There are two principal reasons for this: (1) the qualitative phrases are much too ambiguous, and (2) there is no good way to combine a “quite likely” on one issue, a “some chance” on another, and so on for all of the uncertainties in a lawsuit.
Rule II— The emphasis should be on providing realistic assessments: if 100 juries or judges were simultaneously deliberating the same question, how many would actually rule favorably versus unfavorably? It is counterproductive to be intentionally “conservative” or intentionally “aggressive” with one’s assessments.
Rule III— Issues do not exist in a vacuum. Consider what path in the tree the trier has followed to get to the issue you are currently assessing, and make your assessment conditional on what the trier has already found.
For all uncertainties where there are only two (or a small number of) clear alternative answers (e.g., witness testifies / witness does not testify, defendant liable / defendant not liable, lost profits allowed / lost profits not allowed), it is a straightforward process to review your list of reasons on the issue and make your best guess of the relative likelihood of getting the favorable rather than the unfavorable result. It is advised however, that when possible you also make use of a probability wheel such as shown in Figure 7. Years of the authors’ experience have shown that people provide more realistic assessments when they can visualize probability and compare their chance of winning (or losing) an issue to the chance of a spinner landing in the darker region of the wheel.7
7The percentage of the dark and light regions is, of course, variable. Once counsel is satisfied that the
regions have been appropriately set, the size of each region (in numerical percentages) can be read off the back (if using a paper wheel) or provided by a click of the mouse (if using a software wheel; see § 12:21, at note 1).

12-11
FIGURE 7. PROBABILITY WHEEL
For uncertainties where there are an almost unlimited number of possible answers (e.g., the amount of Sparrow’s lost profits attributable to Eagle’s breach, assuming the jury will be awarding at least some lost profits; or in cases involving comparative fault, the percentage share the jury will apportion to a personal injury plaintiff or to a codefendant), some kind of approximation will need to be made. Most frequently, attorneys already think in terms of a “likely verdict range” between some “low” and some “high,” plus a “most likely” amount within that range. In these situations, it is natural to think of using a similar three-point approximation when doing a decision tree analysis:8
To avoid confusion, it is suggested that the “low” branch be consistently defined as your best guess of the 10th percentile of the entire potential range, the “high” branch as your best guess of the 90th percentile, and the “middle” branch as your best guess of the 50th percentile. The three corresponding dollar amounts can then be dropped onto their respective branches in the tree.9 Finally, it is reasonable to think of each of these three amounts as being the average of a band of potential awards running from somewhat below to somewhat above. Therefore, add a “±” sign at the end of each of the three amounts and assign a 25 percent probability to the low amount, a 50 percent to the middle amount, and a 25 percent to the high amount.10
Traditionally, probabilities are shown in decimal form (e.g., .25 for 25 percent), and are placed directly under their respective branches on the tree, as in Figure 8.
8A different approximation than the one that follows would need to be used if counsel’s view of the range
were different—for example, if counsel thought that the extreme ends of the range were actually more likely than amounts towards the middle.
9If a damage award uncertainty is influenced by some other uncertainty (e.g., the amount of punitive damages may depend on the admissibility or inadmissibility of a sensitive internal memo), you will have to assess two high-middle-low ranges for the same issue—a higher one to follow the branch where the influencing uncertainty is resolved in your adversary’s favor (e.g., the document is admitted), and a lower one to follow the branch where the influencing uncertainty is resolved in your favor (e.g., the document is excluded).
10This suggested approach stems from the fact that the mean of the bottom quartile of a normal distribution is very close to the 10th percentile, the mean of the middle 50 percent is at the 50th percentile, and the mean of the top quartile is very close to the 90th percentile. Even if you do not think that the range of potential awards in your case exactly describes a normal distribution, the suggested approach will usually be a reasonable approximation so long as you think that as awards move further and further away from your median, they become less and less likely to occur.

12-12
FIGURE 8. DECISION TREE —With Probabilities and Verdict Ranges Assessed—
§ 12:21 Analysis of risk, cost and value— Compound probabilities and the expected value
The most common measure of the value of an uncertain venture is its expected value. This is an average value calculated by weighting each of the possible outcomes by its probability of occurring. To use a simple example, the expected value of a fair coin flip for $100 if heads or $0 if tails is $50. But if the coin is not fair and lands heads 75 percent of the time, the expected value is $75 for the bettor who calls heads. In order to calculate the expected value of the detrimental reliance case represented by Figure 8, it is first necessary to calculate the probability of following each scenario of the tree to its conclusion. Only then will we know how much weight to give to each of the possible
$7.5 M ±
Range of potential jury awards for lost profits
0.25 TOTAL = $9.5M
$5.0 M ± 0.50
TOTAL = $7.0M
$3.0 M ± 0.25
TOTAL = $5.0M
$2.0 M ±
Range of potential jury awards for reliance damages
0.25
$7.5 M ± 0.25
TOTAL = $9.0M
$5.0 M ± 0.50
TOTAL = $6.5M
$3.0 M ± 0.25
TOTAL = $4.5M
$1.5 M ± 0.50
$7.5 M ± 0.25
TOTAL = $8.5M
$5.0 M ± 0.50
TOTAL = $6.0M
$3.0 M ± 0.25
TOTAL = $4.0M
$1.0 M ± 0.25
lost profits allowed (in addition to reliance damages)
Judge's ruling re: whether lost profits can be awarded for detrimental reliance
0.20
$2.0 M ± 0.25
TOTAL = $2.0M
$1.5 M ± 0.50
TOTAL = $1.5M
$1.0 M ± 0.25
TOTAL = $1.0M
lost profits not allowed (only reliance damages)
0.80
Eagle is liable
Jury finding re: detrimental reliance
0.80
Eagle not liable
0.20 TOTAL = $0.0M
LITIGATE

12-13
“TOTAL” awards. The probability of a combination of events is known as a compound probability and is determined by multiplying the percentages of all the events. For example, the compound probability that (1) Eagle is liable, and (2) lost profits are not allowed, and (3) the jury awards approximately $1.0 million for reliance damages (i.e., the next-to-the-bottom scenario of Figure 8) is 0.80 × 0.80 × 0.25 = 0.16. In other words, there is a 16 percent chance of this scenario occurring based on the three separate opinions of counsel. Figure 9 shows the earlier tree solved for all of its compound probabilities (these are to the right of the TOTAL awards, following “P = ”).
FIGURE 9. SOLVED DECISION TREE —Showing Compound Probabilities and Expected Value—
Knowing the compound probability of each scenario permits us to calculate the expected value of all the scenarios. This is done by multiplying each of the total awards by its respective compound probability, and summing the results. On the tree in Figure 9, it is the
$7.5 M ±
Range of potential jury awards for lost profits
0.25 TOTAL = $9.5M; P = 0.01
$5.0 M ± 0.50
TOTAL = $7.0M; P = 0.02
$3.0 M ± 0.25
TOTAL = $5.0M; P = 0.01
$2.0 M ±
Range of potential jury awards for reliance damages
0.25
$7.5 M ± 0.25
TOTAL = $9.0M; P = 0.02
$5.0 M ± 0.50
TOTAL = $6.5M; P = 0.04
$3.0 M ± 0.25
TOTAL = $4.5M; P = 0.02
$1.5 M ± 0.50
$7.5 M ± 0.25
TOTAL = $8.5M; P = 0.01
$5.0 M ± 0.50
TOTAL = $6.0M; P = 0.02
$3.0 M ± 0.25
TOTAL = $4.0M; P = 0.01
$1.0 M ± 0.25
lost profits allowed (in addition to reliance damages)
Judge's ruling re: whether lost profits can be awarded for detrimental reliance
0.20
$2.0 M ± 0.25
TOTAL = $2.0M; P = 0.16
$1.5 M ± 0.50
TOTAL = $1.5M; P = 0.32
$1.0 M ± 0.25
TOTAL = $1.0M; P = 0.16
lost profits not allowed (only reliance damages)
0.80
Eagle is liable
Jury finding re: detrimental reliance
0.80
Eagle not liable
0.20 TOTAL = $0.0M; P = 0.20
LITIGATE $2.0M

12-14
$2.0M shown just to the right of the LITIGATE branch.11,12 How should the expected value be used? If your client can afford to “play the averages” given the range of dollars at risk in the case, the expected value is usually considered to be the most a defendant should pay to settle and the least a plaintiff should accept.13 This is because it is well-recognized that making decisions based on the expected value will maximize one’s wealth over time.14 This does not mean that if Sparrow refuses to settle for less than $4 million, for example, and Eagle rejects this demand (as excessive in light of the $2 million expected value) and proceeds through trial, that Eagle will necessarily be hit with a verdict of less than its $2 million expected value—or even less than the $4 million demand (any more than it means that if Eagle’s exploration group did a risk analysis of whether to drill for oil in a given location, and the analysis resulted in an expected value of $100 million, Eagle would be assured of striking at least $100 million of oil). In any single uncertain venture, one could do better or worse than the expected value. However, assuming that Eagle’s legal and business advisors can realistically assess uncertainty in their respective fields of expertise, by always selecting the alternative with the best expected value, Eagle will maximize its wealth over its entire portfolio of risky ventures.
§ 12:22 Analysis of risk, cost and value— Potential adjustments to the expected value
The expected value can be adjusted to reflect litigation costs, willingness and ability to take risk, and the impact on other litigation or on other business. These three types of adjustments are discussed in §§ 12:23–12:25.
§ 12:23 Analysis of risk, cost and value— Potential adjustments to the expected value— Litigation costs
The expected value can be adjusted to reflect your costs of continuing with litigation—both the external costs of outside counsel and expert witnesses, the internal costs of in-house counsel, and the opportunity costs of management involvement. If the costs themselves are
11All of these computations were performed in a fraction of a second using an off-the-shelf decision tree
software program called TreeAge Pro 2009. (Available at www.TreeAge.com; the 2009 version is recommended for attorneys over the 2012 or other versions; pricing as of 1/3/13 was $345 for an annual commercial license and $1,145 for a perpetual one.) This program also generated all of the dependency diagrams, decision trees, and graphs found in earlier and later sections of this Chapter. For more information, including a software manual written especially for attorneys, please call (707) 833-1093 or visit www.LitigationRisk.com. (The manual was priced at $60 as of 1/3/13.)
12If you are solving by hand rather than using decision tree software, look for obvious computational errors. Do your compound probabilities fail to sum to 1.00 (i.e., 100 percent)? Does your expected value fall much too close to the worst case or to the best case to seem correct?
13The effect of litigation costs and other factors are discussed in §§ 12:23–12:25. 14For example, Spurr and Bonini write: “If the decision maker follows the criterion of maximizing
expected monetary value in each [situation], he will be better off, on the average, than using any other decision criterion. In this context, maximizing expected value can be thought of as maximizing average payoff over a number of different situations.” Spurr & Bonini, Statistical Analysis for Business Decisions 169 (1973). See also Miller and Prasnikar, Strategic Play (2008): “This chapter analyzes rational choice under uncertainty. Our point of departure is the simple hypothesis, that in games for a single player, individuals maximize the expected value of their wealth. … Indeed expected wealth maximization is not only the simplest way to intelligently aggregate across uncertain outcomes …, it is quite realistic to believe many businesses do so.” (Chapter 4, at 1–2.)

12-15
substantial and highly uncertain, they can be the subject of a decision tree analysis, just as the potential verdicts were. Costs would be added to the expected value when you are the defendant, and subtracted from the expected value when you are the plaintiff. Only costs that have yet to be incurred should be counted; those that have already been “sunk” cannot affect the relative value of continuing to litigate versus stopping and settling (unless they are recoverable from the other party as part of a judgment in your favor).
Although it is possible to do so, it is not a requirement that the expected value be adjusted to reflect your costs. Defendants will frequently not want to do so in situations where plaintiff has a very weak case on the merits and there is a significant risk of encouraging a number of additional frivolous—but costly—suits if the case is settled for an amount greater than the expected value exclusive of costs. Looking at the broad picture, this can make the most economic sense, even though looking at just the one suit, it might be more profitable to settle than to continue to incur pre-trial and trial costs. Where counsel suspects that this might be the case,15 a risk analysis of this broader problem should be performed, as outlined in § 12:25.
§ 12:24 Analysis of risk, cost and value— Potential adjustments to the expected value— Willingness and ability to take risk
In cases where the dollars at stake represent a significant percentage of a client’s net worth, the client might not want to “play the averages” by using the expected value as its decision criterion. Whether or not to make an adjustment because of risk aversion (or risk tolerance) is the client’s decision—not the attorney’s. To facilitate the client’s decision making process, it is most helpful to summarize all of the scenarios of the tree in a probability distribution bar chart, such as shown in Figure 10.
FIGURE 10. PROBABILITY DISTRIBUTION BAR CHART —Showing Range and Likelihood of Potential Litigation Outcomes—
15See § 12:13.
If We Litigate Swallow v. Eagle
TOTAL AWARD
Pro
babi
lity
$0M $2M $4M $6M $8M $10M
0.50
0.40
0.30
0.20
0.10
0.00
Expected Value of Litigating = $2M Probability of Defense Verdict = 20%
Prob. of Verdict $4M to $10M = 16% Prob. of Verdict $1M or $2M = 64%

12-16
§ 12:25 Analysis of risk, cost and value— Potential adjustments to the expected value— Impact on other litigation or on other business
Concerns about the effect of a trial or a settlement on other litigation (existing or potential) or on the client’s business and operations can be dealt with either explicitly or implicitly. An explicit analysis of these concerns would consist of (1) capturing the key uncertainties (such as the number and cost of additional lawsuits, or the impact on market share or production costs) and their dollar consequences in dependency diagrams and then decision trees, (2) brainstorming how each could be resolved favorably or unfavorably using lists of reasons, (3) quantifying them with probabilities or high-middle-low ranges as appropriate, and (4) calculating their expected values.16 An implicit analysis of these concerns would entail thinking less formally about whether they are enough to tip the scales from litigation to settlement or vice-versa. For example, if Sparrow insists on $3 million to settle a case for which you have calculated a litigation expected value of only $2 million, can you imagine that rejecting the settlement will have an impact—regardless of whether Eagle loses or wins at trial—on other aspects of Eagle’s business of more than $1 million? If so, the scales would tip from litigation being the better strategy to settlement making more sense overall. Or can you imagine that litigating and losing will have an impact on lost sales (or future lawsuits) of more than $1.25 million relative to the impact of settling for $3 million?17 If so, then once again the better choice would be to settle.
§ 12:26 Analysis of risk, cost and value— Cost-benefit analysis using sensitivity analyses
Not only can decision tree analysis be used to make “big picture” decisions such as do we litigate or do we settle, it can also be used to make a myriad of tactical decisions that lawyers constantly face. Consider two examples. Question 1: Is it worth spending an additional $200,000 in discovery to try to reduce the chance of being held liable from 80 percent to 60 percent? Question 2: Are you better off trying to improve by 10 percentage points the chance of getting a defense verdict or the chance of having the judge rule that plaintiff is only entitled to its reliance damages and not its lost profits? These kinds of cost-benefit decisions are easily made with the help of sensitivity analyses. The graphs in Figure 11 show how the expected value of litigating changes with changes in the probabilities of Eagle being found liable (top graph) and of the judge ruling that lost profits can be awarded in addition to reliance damages (bottom graph). As regards Question 1, the top graph shows that every 10 percentage point change in probability changes the expected value of litigating by $250,000, since the value swings from $0 at 0 percent to $2.5 million at 100 percent.18 Thus, a 20 percentage point improvement (from 80 percent
16For an example of an explicit analysis, see Calihan, Dent, and Victor, The Role of Risk Analysis in Dispute and Litigation Management, American Bar Association Forum on Franchising (2004), at 25–27. This paper also illustrates, at pages 10–12, the impact of a counterclaim on an analysis.
17Because the chance of Eagle losing the detrimental reliance case to Sparrow is 80 percent, the relative impact of losing compared to settling would have to exceed $1.25 million—not just $1.0 million—to make the total expected value of litigating greater than the $3 million settlement demand: (i) $2 million expected value of litigation + (ii) 80 percent × $1.25 million expected value of relative impact if lose = $3 million.
18In other words, if the probability under the branch “Eagle is liable” in Figure 9 were changed from 0.80

12-17
chance of losing to 60 percent) would be worth $500,000,19 and a decision to spend an additional $200,000 on discovery would be cost-justified so long as you thought you had at least a 40 percent chance of being able to improve your chance of winning by these 20 percentage points.20 As regards Question 2, the bottom graph shows that every 10 percentage point change in the probability that the judge will rule that lost profits can be awarded changes the expected value by over $400,000 (since the value swings from somewhat more than $1 million at 0 percent to somewhat more than $5 million at 100 percent). Therefore, the more cost-effective use of counsel’s time (and the client’s money) would be to improve the probability on the lost profits legal issue rather than on the liability jury issue. Although this might seem counter-intuitive at first, a closer look at the disparity between reliance damages and lost profits on our decision tree should bring your intuition into agreement with the logic of the probability arithmetic.
An additional use of these sensitivity analysis graphs is to give counsel more confidence in making its “litigate or settle?” decisions. Let’s say you are very sure that Sparrow won’t reduce its settlement demand below $3 million, but you are not so sure about how realistically you have assessed your chance of being found liable. Perhaps the deck is stacked even more seriously against you than the 80/20 probability you assessed. The top graph shows that $3 million is too much to pay in settlement even if the chance of liability being found were 100 percent. In contrast, however, if you are uncomfortable about the 20 percent probability assessed on the judge permitting the jury to award lost profits, you might well want to do more research on that issue: if a more realistic probability would be 44 percent or higher (as indicated by the intersection of the two lines in the bottom graph), the expected value of litigating would jump above $3 million, making settlement the better option.
to 0.00, the expected value would fall to $0 (since a defense verdict was now a certainty). Similarly, if this probability were increased from 0.80 to 1.00, the expected value—based on the revised compound probabilities of each of the scenarios and the resulting probability-weighted average—would be $2.5 million.
1920 percent × $2.5 million = $500,000. 20This is true because 40 percent × $500,000 improvement = $200,000. Note that the decision to spend
$200,000 would also be cost-justified if you thought you had at least an 80 percent chance of at least a 10 percentage point improvement (because 80 percent × $250,000 improvement = $200,000, too).

12-18
FIGURE 11. TWO SENSITIVITY ANALYSIS GRAPHS —Showing Impact on Expected Value of Changing Probabilities—
Sensitivity Analysis on Jury Finds Eagle IS Liable (Detrimental Reliance)
Probability Eagle IS Liable
Expe
cted
Val
ue
0.00 0.20 0.40 0.60 0.80 1.00
$6.0M
$5.0M
$4.0M
$3.0M
$2.0M
$1.0M
$0.0M
LITIGATE SETTLE
Sensitivity Analysis on Judge Rules Lost Profits CAN Be Awarded
Probability Lost Profits CAN Be Awarded
Expe
cted
Val
ue
0.00 0.20 0.40 0.60 0.80 1.00
$6.0M
$5.0M
$4.0M
$3.0M
$2.0M
$1.0M
$0.0M
LITIGATE
SETTLE

12-19
§ 12:27 Analysis of risk, cost and value— Identifying creative settlements using sensitivity analyses
Some settlement strategies are almost impossible to evaluate properly without the benefit of the decision tree approach. For example, let’s say the plaintiff Sparrow still insists on $3 million to settle, while the defendant Eagle isn’t willing to offer more than $2 million (i.e., the expected value produced by its decision tree in Figure 9). What if Sparrow counters with a “high-low” settlement agreement? These are designed to protect the plaintiff against a defense verdict and the defendant against an exceptionally high jury award. They work as follows.
If Sparrow proposes, for example, a low of $1.5 million and a high of $5 million, the case would proceed to trial where three things could happen: (1) if the verdict comes in below $1.5 million (including even a defense verdict), Sparrow would be guaranteed $1.5 million; (2) if the verdict comes in above $5 million, Eagle would only have to pay $5 million (no matter how high the jury award); (3) any verdict between the low and the high (e.g., $4 million) would be unaffected by the agreement and would be the exact amount that Eagle would have to pay Sparrow. How easy is it to know whether a $1.5 million low/$5 million high is a good deal for Eagle? What if Sparrow proposed a low of $1 million but a high of $5.5 million? Would that be a better deal for Eagle—or a worse one? With Eagle’s views of liability and potential verdicts already captured in the decision tree, it is a very simple matter to re-program the software so that the TOTAL for any scenario is never less than the proposed low nor more than the proposed high. A special “two-way” sensitivity analysis can then be performed showing all combinations of lows and highs that produce expected values below Eagle’s $2 million unbounded litigation value (see Figure 12), thereby permitting Eagle to strike the best deal possible.

12-20
FIGURE 12. TWO-WAY SENSITIVITY ANALYSIS GRAPH —Based on Decision Tree (and $2 Million Expected Value) in Figure 9—
§ 12:28 Benefits of using decision tree analysis in negotiation and mediation Sharing the results of a decision tree analysis can, in certain circumstances, be useful in both direct negotiations and in mediations. In direct negotiations, whether to disclose all or a part of one’s analysis is a strategic decision that requires a thoughtful review of the pros and cons of revealing to an adversary the analysis underlying one’s decision making. Among the risks to consider are whether disclosure is likely to highlight issues that an adversary has neglected to fully consider and/or whether inclusion of probabilities and outcomes will provide the adversary with insight into one’s negotiation or trial strategy. The usefulness of disclosure will also depend on the degree that transparency is supportive of the user’s objectives. In instances where the principal issues are clearly understood and appreciated by both parties, sharing all or part of a decision tree can permit the parties to come to a more complete understanding of the dispute and provide an analytical basis for resolving the dispute. In other situations, it might be appropriate to share only those portions of the decision tree analysis that identify the determinative issues without also disclosing one’s own evaluation of the probabilities or likely outcomes.
Eagle’s Preferred Strategy for Various Combinations of High-Low Settlement Offers
Low Offer
Hig
h O
ffer
$0.50M $1.00M $1.50M $2.00M $2.50M
$8.0M
$7.0M
$6.0M
$5.0M
$4.0M
$3.0M
Expected Values in this upper right region are all above $2.0M, and thus any High-Low combination that lands within (such $1.5M low and $5M high) represents a worse deal for Eagle than litigating without such a High-Low agreement in place.
Expected Values in this lower left region are all below $2.0M, and thus any High-Low combination that lands within (such $1M low and $5.5M high) represents a better deal for Eagle than litigating without such a High-Low agreement in place.

12-21
The use of a decision tree analysis as a tool in the mediation process has far fewer risks. Ordinarily, one of the objectives in mediation is to convince the mediator that the analysis underlying one’s decision making is both thoughtful and reasonable, and is superior to the analysis of the adversary. Sharing the decision tree analysis with the mediator on a confidential basis can be extremely useful in reaching this objective and does not present the risks associated with direct disclosure to one’s adversary.21
§ 12:29 Benefits of using decision tree analysis in guiding alternative fee arrangements
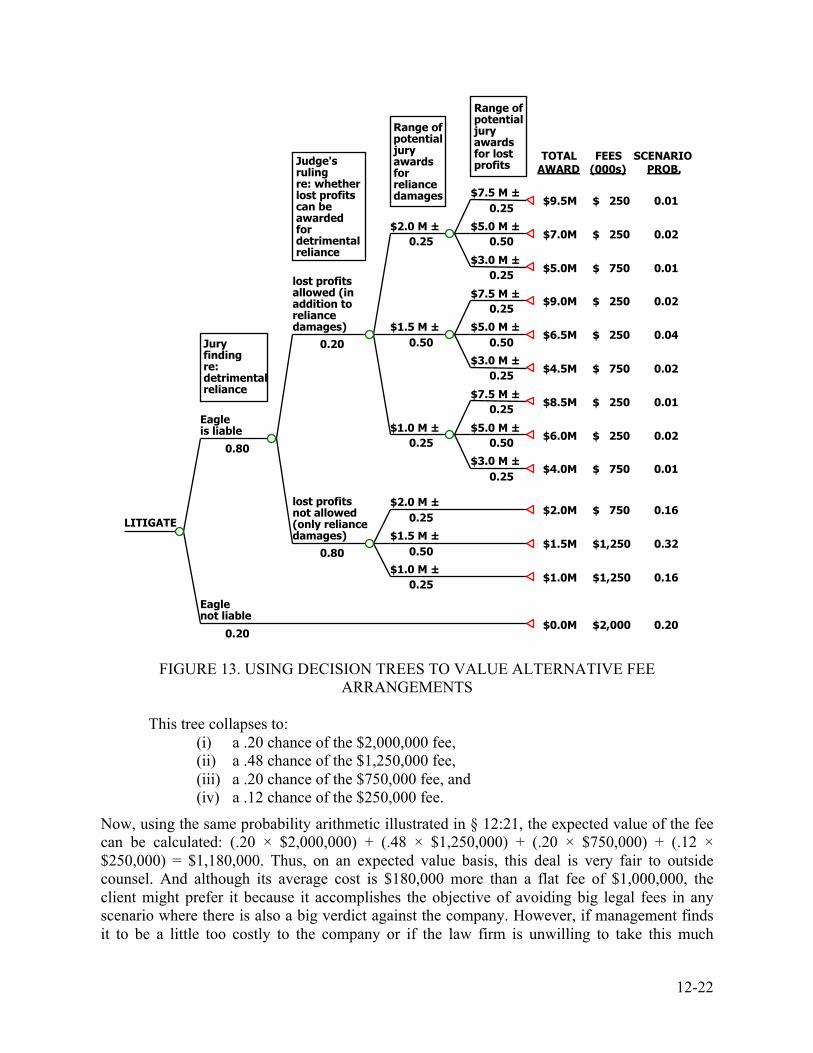
Another use for the decision tree is in guiding alternative fee arrangements. To make the math easy, assume Eagle’s outside counsel has estimated its fees through trial at $1,000,000. But the last thing Eagle management wants is to spend a million dollars in fees and then get hit with a big adverse trial verdict. Thinking of incentive arrangements it favors elsewhere in its business, the president asks the general counsel to come up with a hybrid fee arrangement in which outside counsel would get a nice bonus for bringing in a defense verdict but forego a significant portion of its fees if Eagle were to get hammered by the jury. How should the general counsel go about deciding how “nice” the bonus should be, how “significant” the fee reduction should be, and at what verdict level it should kick in? What process could the law firm’s management committee use to ensure the proposed terms are fair, or to persuade the general counsel that other terms would be more appropriate? For example, how would you get comfortable offering, or accepting, the following fee arrangement in lieu of a flat $1 million regardless of result: (i) a 100% bonus for a defense verdict; (ii) a 25% bonus for any verdict that’s below $2 million; (iii) a 25% fee reduction for a verdict that’s anywhere from $2 million to $5 million; and (iv) a 75% fee reduction for any verdict that’s above $5 million?
What seems at first to be a lot of guesswork can actually be analyzed in a very reasoned way—so long as a decision tree has been created for the underlying litigation. Thus, Figure 13 presents the same decision tree as shown in Figure 9, but with an additional column for counsel fees corresponding to the four-part arrangement described above.
21Many mediators have themselves been trained in Litigation Risk Analysis™, including not only those
in private practice but many who work for the U.S. Courts of Appeals. For an interesting discussion of the use of decision tree analysis by mediators, see John DeGroote’s blogs at www.settlementperspectives.com/2010/04/decision-trees-in-mediation-a-few-examples/ (last visited 1/3/13).
12-22
FIGURE 13. USING DECISION TREES TO VALUE ALTERNATIVE FEE ARRANGEMENTS
This tree collapses to:
(i) a .20 chance of the $2,000,000 fee, (ii) a .48 chance of the $1,250,000 fee, (iii) a .20 chance of the $750,000 fee, and (iv) a .12 chance of the $250,000 fee.
Now, using the same probability arithmetic illustrated in § 12:21, the expected value of the fee can be calculated: (.20 × $2,000,000) + (.48 × $1,250,000) + (.20 × $750,000) + (.12 × $250,000) = $1,180,000. Thus, on an expected value basis, this deal is very fair to outside counsel. And although its average cost is $180,000 more than a flat fee of $1,000,000, the client might prefer it because it accomplishes the objective of avoiding big legal fees in any scenario where there is also a big verdict against the company. However, if management finds it to be a little too costly to the company or if the law firm is unwilling to take this much
$7.5 M ±
Range of potential jury awards for lost profits
0.25 $9.5M
$5.0 M ± 0.50
$7.0M
$3.0 M ± 0.25
$5.0M
$2.0 M ±
Range of potential jury awards for reliance damages
0.25
$7.5 M ± 0.25
$9.0M
$5.0 M ± 0.50
$6.5M
$3.0 M ± 0.25
$4.5M
$1.5 M ± 0.50
$7.5 M ± 0.25
$8.5M
$5.0 M ± 0.50
$6.0M
$3.0 M ± 0.25
$4.0M
$1.0 M ± 0.25
lost profits allowed (in addition to reliance damages)
Judge's ruling re: whether lost profits can be awarded for detrimental reliance
0.20
$2.0 M ± 0.25
$2.0M
$1.5 M ± 0.50
$1.5M
$1.0 M ± 0.25
$1.0M
lost profits not allowed (only reliance damages)
0.80
Eagle is liable
Jury finding re: detrimental reliance
0.80
Eagle not liable
0.20 $0.0M
LITIGATE
TOTAL AWARD
0.01
0.02
0.01
0.02
0.04
0.02
0.01
0.02
0.01
0.16
0.32
0.16
0.20
$ 250
$ 250
$ 750
$ 250
$ 250
$ 750
$ 250
$ 250
$ 750
$ 750
$1,250
$1,250
$2,000
FEES (000s)
SCENARIO PROB.

12-23
downside risk, any of the parameters of the proposal could be modified and a new expected value easily calculated.
§ 12:30 Benefits to the corporate law department of using decision tree analysis The benefits of a corporate law department using decision tree analysis are many. First, it provides a framework for identifying the issues, both legal and factual; the potential exposure or recovery (depending on whether the corporation is the defendant or plaintiff); and the probabilities associated with those questions. Decision tree analysis thereby provides a quantitative model of the problem and identifies the factors determinative of the outcome of the dispute. Second, decision tree analysis improves the quality of the evaluation by making the process transparent, and is the basis for communication and review by outside counsel and other in-house counsel. It provides an important filter that helps identify matters with significant risk that might otherwise not be appreciated. The potential damages in a case that is perceived to be a “sure winner” may not receive attention in an intuitive evaluation of a case. This can lead to an unpleasant surprise. A quantitative evaluation will identify those damages, and incorporate that risk in the overall analysis. It will also assist the attorney in ensuring that the client is fully informed of the “high side” risk posed by the case. In the final analysis, quantitative decision tree analysis improves the quality and value of the product, i.e., legal service, and makes the service provider more valuable to the organization.
§ 12:31 Benefits to the business client of using decision tree analysis One of the primary benefits of using decision tree analysis is the ease and clarity with which the issues, risks and probabilities of prevailing are communicated to the business client. The decision tree analysis is in a format and a quantitative language that the business client will understand. With an increased understanding of the factors influencing the outcome of the litigation and the range of possible outcomes, the business client is able to make a more informed judgment regarding the matter—e.g., in litigation whether to settle or not—and often, to make this decision earlier in the life of the dispute. It also provides a useful means by which the attorney and the business client can discuss the degree of risk and potential exposure the client is prepared to tolerate. Finally, a formal, clear and logical process increases the client’s confidence that the case has been thoroughly and professionally evaluated. In addition, a decision tree analysis can be valuable in assisting publicly-traded companies to meet their disclosure obligations,22 and such an analysis can also smooth the way
22See Calihan, Dent, and Victor, The Role of Risk Analysis in Dispute and Litigation Management,
American Bar Association Forum on Franchising (2004), at 41–46. We previously noted in an earlier version of this footnote that “[t]his is a subject that is likely to gain even more consideration over the next years,” as the Financial Accounting Standards Board (“FASB”), in an effort to require more financial disclosures about lawsuits against a company and other loss contingencies, proposed in 2008 substantially overhauling FASB Statement No. 5, Accounting for Contingencies (now FASB Accounting Standards Codification™ Topic 450). In response to a tsunami of negative comments (contained in 241 letters) about the extent of disclosures required, the potential waiver of the attorney-client privilege, and the unintended assistance the new rule could provide to plaintiffs, the Board has since taken a number of actions. In 2009, it deferred the date for implementation; in July 2010, it issued a revised Exposure Draft, which then received 370 new comment letters; in October 2010, it decided that a final standard would no longer be effective for the 2010 calendar year-end reporting period, and that it would not decide on an effective date until some future meeting after it had concluded its redeliberations; and at its July 9, 2012

12-24
for approval of proposed class action settlements. As Chief Judge Posner wrote: “[T]he [trial] judge should have made a greater effort (he made none) to quantify the net expected value of continued litigation to the class.”23 One of this Chapter’s co-authors, Marc Victor, is familiar with a multi-billion dollar class action in which both parties were motivated by this decision (at least in part) to perform a risk analysis as part of their successful efforts to resolve their dispute.
§ 12:32 Benefits to outside counsel of using decision tree analysis Outside counsel will reap numerous benefits from using decision tree analysis. One of the foremost benefits of using the methodology is that it forces litigation counsel to assess the risks of pursuing various factual and legal theories in the case. By requiring counsel to assess the probabilities of these alternatives, decision tree analysis provides a rational basis for determining the most important issues in a case. The identification of a unifying theme is critical in all cases, but particularly so in complex cases. The time and energy that might otherwise be wasted in the pursuit of tangentially important alternatives can be greatly reduced. For outside counsel, decision tree analysis can be used as an ongoing tool for refining and crystallizing the issues in a case. As new information is developed, the tree can be expanded, even into sub-trees, to take into account the additional alternatives. If employed at the outset and updated as significant new information is learned, decision tree analysis can focus discovery on the right issues and further the use of resources in a more productive manner. The clarity that decision tree analysis can provide is useful to all outside counsel, not just litigators. In business transactions and virtually any other legal problem, the disciplined consideration of the alternatives and costs of pursuing those alternatives will be of value. Outside counsel will then be able to communicate that added value to the client. This capability is significant in differentiating oneself from the competition. Outside counsel will also benefit from the collaboration the decision tree analysis fosters. The client will necessarily be clearer as to the objectives sought, and both inside and outside counsel will have a framework with which to discuss the alternatives and issues. This collaboration will greatly enhance the ability of both to achieve a favorable outcome.
meeting, the Board voted 5-2 to remove the project from its technical agenda. The complete history can be found at www.fasb.org/jsp/FASB/FASBContent_C/ProjectUpdatePage&cid=900000011071 (last visited 1/3/13), and the July 2010 proposed disclosure thresholds and requirements can be found in the “Exposure Draft – Proposed Accounting Standards Update, Contingencies (Topic 450): Disclosure of Certain Loss Contingencies” at http://www.fasb.org/cs/BlobServer?blobkey=id&blobwhere=1175823559187&blobheader=application%2Fpdf&blobcol=urldata&blobtable=MungoBlobs (last visited 1/3/13).
23Reynolds v. Beneficial Nat. Bank, 288 F.3d 277, 284–285 (7th Cir.2002); accord Synfuel Technologies, Inc. v. DHL Express (USA), Inc. 463 F.3rd 646 (7th Cir.2006); Williams v. Rohm and Haas Pension Plans, 658 F.3rd 629 (7th Cir.2011). See also In Re: Advanced Telecommunication Network, Inc., 490 F.3rd 1325, 1335 (11th Cir.2007) (“We reject both extreme positions, and find that the proper approach would have simply discounted the expected value of the judgment by the probability of its ever occurring. Although it may be true, as the bankruptcy court put it, that ‘no one could have predicted this result with any reasonable certainty,’ such a precise prediction was not required. The court was instead required to calculate ... the expected cost of the liability times the estimated chance of it ever occurring.”)