Embed Size (px)
Citation preview
South Asian Journal of Banking and Social Sciences,
Vol. 03, No.01 (2017), ISSN: 2410-2067 © Institute of Banking & Finance, BZU Multan
Evaluating Financial Distress in Developing Economies: A Case Study of Pakistani and Indian Public Sector Banks using
Altman’s Z score
Dr. Muhammad Shaukat Malik, Basit Muzammal, Asad Amin
Institute of Banking and Finance, Bahauddin Zakariya University, Multan, Pakistan
Corresponding Author Email: [email protected]
ABSTRACT
Purpose - The purpose of the study is the financial performance comparison of the public banking sector’s using various ratios analysis operating in Pakistan and India. Design/methodology/approach - There are 5 public sector Pakistani banks and 5 public sector Indian banks have been selected on the basis of market capitalization out of 24 banks over the period of 2011 to 2016. There are numerous financial ratios like activity, profitability; solvency, leverage & the market value ratio have been used to estimate the financial performance of the financial institution, using the Altman Z-Score Model. Findings - The study affirm that among selected banks 100% of the selected public sector banks of Pakistan are in the “Grey Zone” and also 100% of the selected Indian banks are in the “Grey Zone”, but there are more chances of Pakistani banks to enter in the “Safe Zone” due to their z score values. Practical implications - The Z-score values of the study help the depositors, managers, top management and the shareholders look after their interest in the public banking sector operating in Pakistan and India. Originality Value - It is a review paper conducted on the Public sector banks of Pakistan and India.
Keywords Financial Distress, Public Banking Industry, insolvency, Bankruptcy & Z-score.
Research type Review Paper
___________________________________________ The current issue of this journal is available on the official website of Institute: http://www.ibfbzu.edu.pk/sajbs
South Asian Journal of Banking and Social Sciences
Vol. 03, No.01 (2017), ISSN: 2410-2067 © Institute of Banking & Finance, BZU Multan

South Asian Journal of Banking and Social Sciences,
Vol. 03, No.01 (2017), ISSN: 2410-2067 © Institute of Banking & Finance, BZU Multan
119
1.0 INTRODUCTION
Banks play significant role in the financial stability of any economy as the
banking sector is the main component of the financial system. Financially sound and
stable banking system leads to economic development of any country. Now a day,
financial stability has become the major issue for banking sector due to the factors
such as failure of management, competition, external factors, increasing portfolio of
nonperforming loans, incremental incidences of fraud, incompetence towards
regulatory requirements which case the probability of risk and directed towards the
financial distress. Banking sector faces various types of risk such as credit risk,
market risk, liquidity risk, foreign exchange risk, political risk, sovereign risk, interest
rate risk, operational risk etc. and high intensity of risk leads to business failure
(Campbell, A. 2007). There are numerous distinct models to predict the complex
problem of bankruptcy. Several internal credit rating models may be used for bank
which enhance their current predictive power of financial risk factors and explained
how banks predict the creditworthiness of the borrowers and how can they pinpoint
the defaulters to improve their credit evaluation process (Nandi, J. K; Choudhary, N.
K. 2011). The problem of business failure associated with both reasons, non-
financial and financial causes like lack of planning, inefficient management and
fraud. Upper management should have needed to analyze the bankruptcy, so that
this can help them to take an investment decision (Venkataramana, N; Azash, S.M;
Ramakrishna, K. 2012).
Bankruptcy may be type of failure, it occurs when the firm may not be in a
condition to fulfill its current obligations and its short-term liabilities are greater than
its current assets. Bankruptcy is a severe matter and very common thing among
companies and financial institutions. There may be different reasons of failure or
bankruptcy like alteration in market policies, inflation and instability in the political
environment. Many users (banks, credit rating agencies, auditors and policy maker)
use financial statement for better understanding of financial position. For this
purpose, different approaches and models are used. During economic and financial
crisis selection of model for the prediction of financial distress is necessary. For
example, when the bank gives loan facility to company then check its chances of

South Asian Journal of Banking and Social Sciences,
Vol. 03, No.01 (2017), ISSN: 2410-2067 © Institute of Banking & Finance, BZU Multan
120
bankruptcy through analysis of its previous financial statements. The prediction
models are used to check the bankruptcy and can be utilized to a modern economy
to predict distress and bankruptcy in advance (Anjum, S. 2012).
In 2008, the biggest bankruptcy in U.S. history represents an example for
Indian banks -maintain their cash flows efficiently. Thus, cautious consideration
regarding the impact of bankruptcy risk level on bank’s profitability is essential
because intensive risk may create a chance of closing down the bank’s operations
(Chotalia, P. 2012). Global financial crisis may occur due to some reasons like
inflation, devaluation of currency, highly unpredictability of economic conditions,
fluctuation of interest rates and some other factors (which are not easily controllable)
are defining the flexibility of financial sectors. The financial soundness of the banking
sector is strengthening the pillar of every economy. In this context, it is most
important to evaluate the financial stability of domestic banks (Sharma, N; Mayanka
2013).
Forecasting of distress is most important for both who give and take borrow.
There are many techniques that have developed to assess the bankruptcy risk.
Bankruptcy is a worldwide problem. Bankruptcy practices reveal that a company
having efficient management, strong financial performance and capabilities to grow
without any distress symptoms, may be avoided to be immediate insolvency. From
the period of 2011-2012, a wave of bankruptcy shows that if there is a lack of proper
management either it is a big company or not may face bankruptcy example of such
companies are Lehman Brothers and Enron. The other company is Lehman
Brothers, which was the fourth largest investment bank in the US. Lehman filed for
bankruptcy protection in 2008 to avoid the possibility of being distressed (Erari, A;
Salim, U; Idrus, M.S. 2013). There is a direct need to manage risk of insolvency as it
is the critical issue for banks. Prediction of financial distress is most challenging
tasks for every organization (Hussain, F; Ali, I; Ullah, S; Ali, M. 2014).
As start of the financial crisis of 2008, Basel-III accord was introduced in
2010. Basel III is fascinating control and considerable plan not only Indian public
sector banks but all over the world. The core purpose of Basel III is to evaluate their
own capital requirement which shows the financial stability of any financial institution
and determine the common standards of banking regulation. Basel III guides the

South Asian Journal of Banking and Social Sciences,
Vol. 03, No.01 (2017), ISSN: 2410-2067 © Institute of Banking & Finance, BZU Multan
121
banks to maintain their capital requirements and satisfy with Basel III guidelines
which are beneficial for banks in a specific area. Thus, banking sector of India and
Pakistan needs to forecast the bankruptcy risk and analyse their financial statements
because this risk directly hit the financial strength and earnings of banks. Therefore,
the appropriate judgment of liquidation risk in needed for continuous working of
banks and proper exertion of Basel III regulations. To avoid the risk of bankruptcy, it
is very important to forecast the business failure and to take corrective decisions
according the situations. The most important factor pertaining to forecasting is to
assess all the credit terms and their satisfactory recovery from customers (Pradhan,
R. 2014).
Bankruptcy can be used as a proxy for measuring economic sustainability.
Because it is examined that the bankrupt bank has uncertain, but the non-bankrupt
banks has long term continuity and certain economic position (Jan, A; Marimuthu, M.
2015).The purpose of this study is to identify the financial position of selected public
sector banks operating in Pakistan like First Women Bank Ltd, National Bank of
Pakistan Ltd, Sindh Bank Ltd, The Bank of Khyber, The Bank of Punjab and selected
Indian Banks on the basis of market capitalization like Baroda Bank, Union Bank of
India, State Bank of India, Canara Bank and Punjab National Bank, to predict the
bankruptcy using the Z-score model.
2.0 LITERATURE REVIEW
The study of many published articles in distinct journals explains that there are many
reasons of financial distress prevailed by the researchers. The Beaver was pioneer in finding
the current prediction of financial distress and performed invariant analysis by comparing the
different various ratios including 79 solvent firms and 79 insolvent firms. This study tested
the prediction strength of 30 ratios for 5-years series extracting the bankruptcy of selected
firms (Beaver, W. H. 1966). The Beaver’s work was limited because it is fundamentally
consisted on the invariant nature that permits one ratio employed at once. This can accord
erratic consequences in a firm and the cessation point predicts the post-failure of a firm,
which may result in unreliable arrangements. By keeping in mind these limitations, Edward
Altman moved forward the work done by Beaver and four more variables is integrated into
the model to strengthen the prediction of non-financial distress. Bankruptcy, insolvency,
failure and default are the four different terms and all of these define a situation of business
distress. Financial distress in an adverse situation for any type of business organization.

South Asian Journal of Banking and Social Sciences,
Vol. 03, No.01 (2017), ISSN: 2410-2067 © Institute of Banking & Finance, BZU Multan
122
Bankruptcy may be the least unfavourable scenario for specific companies. But, In the case
of the business, stakeholders, default also can cause negative consequences. The capital
will be lost by the shareholders and capital will not be gotten by the business firms for the
investment purposes and the tax also will not be collected by the Govt (Altman, E. I. 1968).
From all over the world a vast number of corporate failure prediction models have
been contributed by the academic researchers, with the help of using various types of
modelling techniques (Aldrich, J. H; & Nelson, F. D. 1984). A researcher articulated the
relationship between the financial distress and insolvency and defined it as: “Inability to pay
one’s debt and lack of means of paying one’s debts. Such as a condition of an individual’s
assets and liabilities, the former needs immediately available would be insufficient to
discharge the later” (Ross, S. A; R. W. Westerfield; J, Jaffe 1999). A study conducted that
prediction of the bankruptcy is one of the crucial business decision making problems that
impact the whole life cycle of the business. Bankruptcy of the firm or organization creates
high cost from the collaborators (firms and organizations), the society and the economy of
the country (Ahn, B. S; Cho, S. S; Kim, C. Y. 2000 & O’Leary, E. G. 2001).
The study regarding nonperforming loans argued that the high intensity of
nonperforming loans causes of non-income generating assets which not only influence the
profitability of the bank, but also has great impact on the capital adequacy of the bank
(Muniappan, G. P. 2002). Major financial statements, which more frequently used by the
researchers are profit and loss statement, balance sheet and cash flow statements. By using
these financial statements, the current performance future prospects of the concerned firm
can be accessed by calculating various ratios (Millihni, G. L. V. 2003).
Most important ratios used include current ratio, quick ratio, and working capital to
total debt, total debt to total assets, profit margin to sales and return on total assets. It may
be possible that the best way to overcome the failure is to analyse the multiple explanations
for business failure (Robbins, A; Pearce, L. 2005 & Sands, E. G; Springate, G. L; & Var, T.
1982). A study conducted by the researcher evaluated the financial distress of IDBI
(Industrial Development Bank of India) using Altman Z-Score Model. This model revealed
that the financial performance of the bank was not acceptable and also shown the symptoms
of the possible bankruptcy of the bank (IDBI) (Krishna Chaitanya, V. 2005). A
comprehensive definition of financial distress is defined as a "situation where a firm's
operating cash flows are not sufficient to satisfy current obligations and the firm is forced to
take corrective actions" (Ross, S. A; Westerfield, R. W; Jaffe, J; Jordan, B. D. 2007).

South Asian Journal of Banking and Social Sciences,
Vol. 03, No.01 (2017), ISSN: 2410-2067 © Institute of Banking & Finance, BZU Multan
123
At present, a clear synopsis and the controversy of the application of alternative
methods in corporate failure prediction is still answerable. Research has defined that
inappropriate management is the core reason most of the business failures. Financial failure
may take the form of bankruptcy or insolvency (Young, M. N; Peng, M. W; Ahlstrom, D;
Bruton, G. D; Jiang, Y. 2008). The study analyzed whether the Z-score, as examined by
Altman and other researchers, could predict correctly company failure. This study finds out
that Altman Z-score model well accomplishes in predicting failure for a period up to five
years earlier and could be helpful for the portfolio managers on stock selection and
management for merger decision or other corporate strategies (Alexakis, P. 2008). Another
study described that collapse and bankruptcy due to the reasons of management like
dissatisfactory management skills and qualities, and corporate policy and inappropriate
strategies. Financial managers are subject to measure the financial performance of the
company as well as to anticipate the financial situation of the company (Ooghe, H; De
Prijcker, S. 2008).
An emphasis study on prediction of financial distress of firms indicates that early
warning signals in distressed organizations can prevent the managers to take decisions
carefully and negate the future devastation (Telmoudi, F; Ghourabi, M. E; Limam, M. 2011).
A study argued that three basic criteria in the selection of financial ratios by Beaver was;
most commonly used ratios in past literature, good performed ratios in past studies and the
ability of ratios to be defined as cash flow (Bee, T. S; Abdollahi, M. 2011). It is stated in
another study that financial distress forecasting is the most important to minimize the
negative economic cycle in the economy of a country (Simic, D; Kovacevic, I; Simic, S.
2011). In Bangladesh, the Z score model has also been contributed in many studies related
to different industries. A study applies this model in the cement industry of Bangladesh in
order to predict the bankruptcy. Researchers apply Z score model on five leading companies
in the cement industry and they got beneficial results that two firms would be financially
strong there are no chances of bankruptcy in the near future, but other firms yet not
confirmed regarding their financial standings and found to be distress in the near future
(Mizan, A. N. K., & Hossain, M. 2014).
3.0 RESEARCH METHODOLOGY AND FINDINGS
This study was conducted primarily using the secondary data. This financial data of
the Pakistani banks are taken from the SBP’s website and the Indian banks from the annual
reports of the respective bank. This study covers the 10 banks (5 banks from Pakistan and 5
banks from India based on market capitalization) from the banking sector for the period of

South Asian Journal of Banking and Social Sciences,
Vol. 03, No.01 (2017), ISSN: 2410-2067 © Institute of Banking & Finance, BZU Multan
124
2011-2016. To find out the Z-score firstly we have analysed the financial ratios of these
banks then predict the financial distress and non-financial distress. Altman Z-score model is
considered, mainly its four independent variables and each variable from them has a
particular financial ratio. The coefficients were predicted by identifying the set of
organizations and we have to find out the differences of financial distress between the
Pakistani and Indian public sector banks. In determining the financial distress of the public-
sector banks Altman Z-score is used. The equation through which the financial distress of
the banks has determined is given below:
Z-Score bankruptcy model: Z = 6.56X1 + 3.26X2 + 6.72X3 + 1.05X4
X1 = (Current Assets − Current Liabilities) / Total Assets
X2 = Retained Earnings / Total Assets
X3 = Earnings Before Interest and Taxes / Total Assets
X4 = Book Value of Equity / Total Liabilities
Variables Ratio Description
X1= Net Working Capital/Total Asset
The Net Working Capital (NWC) to Total Asset (TA) ratio shows that how much
company has current asset to meet its short-term obligations. This ratio may be changed
from industry to industry. The greater the current ratio, the greater capacity the company
paying its obligations as they come due.
X2=Accumulated Retained Earnings/Total Asset
Accumulated Retained Earnings (ARE) to Total Asset (TA) is the ratio that measures
the accumulated profitability of the business. Usually, business firm. This ratio retains
earnings if they anticipate of investment opportunities. In case of an economically sound
business organization the ratio will be higher.
X3= Earnings Before Interest and Taxes /Total Asset
This is the ratio of Earnings Before Interest and Taxes (EBIT) to Total Asset (TA). It’s
a measure of operating efficiency of an organization. The value of this ratio shows that how
much a company generates its income or earning to fulfill its fixed liabilities. If the company’s
ratio is lower than, its mean that the company has lower capacity to pay its interest against
borrowing.
X4= Market Value of Equity / Book Value of Debt

South Asian Journal of Banking and Social Sciences,
Vol. 03, No.01 (2017), ISSN: 2410-2067 © Institute of Banking & Finance, BZU Multan
125
This is the ratio of Market Value of Equity (MVE) to Book Value of Debt (BVD). This
ratio indicated the performance of the fair market value of the company’s share in
comparison to the book value of the outstanding debt capital. The higher the ratio indicates
the higher market price of the firms share.
Zones of discriminations: The bankruptcy possibility of a company depends on the
value obtained by using the formula. If, Z > 2.6 “Safe” Zone. The business is financially
sound and there is least probability that the firm will face financial distress; If, 1.1 < Z < 2.6
“Grey” Zone The firm falls in the Grey area that means there is less probability that the firm
will face financial distress in the near future. If, Z < 1.1 “Distress” Zone this shows the
strengthen negative situation for the bank distress.
Table 1: Analysis of Pakistani Banks Using Z-Score
Pakistani Banks
years 2011 2012 2013 2014 2015 2016 Average Z-score
Discriminant zone
First Women Bank Ltd.
Z-score
2.42 1.96 1.75 1.71 2.03 2.31 2.44 Grey Zone
National Bank of Pakistan
Z-score
2.05 2.01 1.97 2.00 1.99 1.95 2.39 Grey Zone
Sindh Bank Ltd.
Z-score
2.85 2.10 2.24 2.01 2.00 1.88 2.62 Grey Zone
The Bank of Khyber
Z-score
2.51 2.44 2.14 2.26 2.13 1.89 2.67 Grey Zone
The Bank of Punjab
Z-score
1.21 1.33 1.32 1.39 1.46 1.56 1.65 Grey Zone

South Asian Journal of Banking and Social Sciences,
Vol. 03, No.01 (2017), ISSN: 2410-2067 © Institute of Banking & Finance, BZU Multan
126
Table 2: Analysis of Indian Banks Using Z-Score
Indian Banks years 2011
2012
2013
2014
2015
2016
Average Z-score
Discriminant zone
Baroda Bank Z-score
1.11
1.17
1.13
1.07
1.11
1.06
1.33 Grey Zone
Canara Bank Z-score
1.18
1.31
1.35
1.31
1.30
1.20
1.53 Grey Zone
Punjab National Bank
Z-score
1.04
1.14
1.37
1.04
1.10
0.81
1.30 Grey Zone
State Bank of India
Z-score
1.46
1.24
1.46
1.42
1.47
1.47
1.70 Grey Zone
Union Bank of India
Z-score
1.07
1.12
1.11
1.10
1.12
1.11
1.33 Grey Zone
This study concluded that the Baroda Bank, Punjab National Bank, State Bank of
India, Canara Bank and Union Bank of India lie in the bankruptcy segment because all have
Z score less than 2.6 Yet all Indian public sector banks are operating their activities normally.
But, the financial performance of these Indian public sector banks is good. On the other side,
this study concluded that the National Bank of Pakistan (NBP), First Women Bank Ltd, Sindh
Bank Ltd, The Bank of Khyber, and The Bank of Punjab lie in the bankruptcy segment
because all have Z score less than 2.6. Yet all commercial banks are operating their
activities normally. But according to the report of State Bank of Pakistan for the period 2009
to 2013, the financial performance of these public sector banks is good.

South Asian Journal of Banking and Social Sciences,
Vol. 03, No.01 (2017), ISSN: 2410-2067 © Institute of Banking & Finance, BZU Multan
127
Table 3: Public Sector Banks of Pakistan, Financial Ratios
First Women Bank Ltd.
Ratios 2011 2012 2013 2014 2015 2016
x1=WC/T.A 0.10 0.08 0.05 0.07 0.10 0.16
x2=R.E/T.A 0.02 0.01 0.01 0.02 0.01 0.02
x3=EBIT/T.A 0.10 0.05 0.05 0.02 0.04 0.03
x4=T.E/T.L 0.11 0.09 0.09 0.13 0.15 0.22
Z-score 2.42 1.96 1.75 1.71 2.03 2.31
National Bank of Pakistan
x1=WC/T.A 0.08 0.07 0.08 0.08 0.07 0.08
x2=R.E/T.A 0.02 0.02 0.02 0.02 0.03 0.02
x3=EBIT/T.A 0.06 0.06 0.05 0.05 0.04 0.05
x4=T.E/T.L 0.11 0.09 0.09 0.08 0.08 0.07
Z-score 2.05 2.01 1.97 2.00 1.91 1.95
Sindh Bank Ltd.
x1=WC/T.A 0.20 0.10 0.11 0.08 0.08 0.07
x2=R.E/T.A 0.00 0.00 0.01 0.01 0.01 0.01
x3=EBIT/T.A 0.07 0.06 0.07 0.06 0.06 0.05
x4=T.E/T.L 0.29 0.14 0.18 0.12 0.12 0.12
Z-score 2.85 2.10 2.24 2.01 2.00 1.88
The Bank of Khyber
x1=WC/T.A 0.13 0.13 0.10 0.11 0.10 0.07
x2=R.E/T.A 0.01 0.01 0.01 0.01 0.01 0.01
x3=EBIT/T.A 0.09 0.08 0.06 0.06 0.06 0.05
x4=T.E/T.L 0.17 0.15 0.12 0.12 0.10 0.08
Z-score 2.51 2.44 2.14 2.26 2.13 1.89
The Bank of Punjab
x1=WC/T.A -0.06 -0.03 -0.03 -0.01 0.00 0.03
x2=R.E/T.A 0.01 0.00 0.00 0.00 0.00 0.00
x3=EBIT/T.A 0.08 0.07 0.07 0.06 0.06 0.05
x4=T.E/T.L -0.03 -0.02 0.00 0.02 0.03 0.03

South Asian Journal of Banking and Social Sciences,
Vol. 03, No.01 (2017), ISSN: 2410-2067 © Institute of Banking & Finance, BZU Multan
128
Z-score 1.21 1.33 1.32 1.39 1.46 1.56
Table 4: Public Sector Banks of India, Financial Ratios
Baroda Bank
Ratios 2011 2012 2013 2014 2015 2016
x1=WC/T.A 0.08 0.08 0.08 0.08 0.08 0.09
x2=R.E/T.A 0.06 0.06 0.06 0.05 0.06 0.06
x3=EBIT/T.A 0.05 0.06 0.05 0.05 0.05 0.04
x4=T.E/T.L 0.06 0.07 0.06 0.06 0.06 0.06
Z-score 1.11 1.17 1.13 1.07 1.11 1.06
Canara Bank
x1=WC/T.A 0.08 0.09 0.10 0.09 0.09 0.09
x2=R.E/T.A 0.06 0.06 0.06 0.06 0.06 0.06
x3=EBIT/T.A 0.06 0.07 0.07 0.07 0.07 0.06
x4=T.E/T.L 0.06 0.06 0.06 0.06 0.06 0.06
Z-score 1.18 1.31 1.35 1.31 1.30 1.20
Punjab National Bank
x1=WC/T.A 0.08 0.08 0.09 0.11 0.11 0.10
x2=R.E/T.A 0.06 0.06 0.07 0.01 0.02 0.00
x3=EBIT/T.A 0.04 0.05 0.07 0.03 0.02 0.00
x4=T.E/T.L 0.06 0.06 0.07 0.12 0.12 0.11
Z-score 1.04 1.14 1.37 1.04 1.09 0.81
State Bank of India
x1=WC/T.A 0.14 0.12 0.12 0.12 0.13 0.13
x2=R.E/T.A 0.05 0.06 0.06 0.07 0.06 0.06
x3=EBIT/T.A 0.05 0.03 0.06 0.06 0.06 0.05
x4=T.E/T.L 0.06 0.07 0.07 0.07 0.07 0.07
Z-score 1.46 1.24 1.46 1.42 1.47 1.47
Union Bank of India
x1=WC/T.A 0.08 0.07 0.07 0.07 0.07 0.07
x2=R.E/T.A 0.05 0.05 0.05 0.05 0.05 0.05

South Asian Journal of Banking and Social Sciences,
Vol. 03, No.01 (2017), ISSN: 2410-2067 © Institute of Banking & Finance, BZU Multan
129
x3=EBIT/T.A 0.05 0.06 0.06 0.07 0.07 0.06
x4=T.E/T.L 0.06 0.06 0.06 0.06 0.05 0.06
Z-score 1.07 1.12 1.11 1.10 1.12 1.11
The study explains the discriminant zone of selected public sector banks of Pakistan
and India using Z score model. This model shows that if any, public sector bank secures
more than 2.6 score; it should be placed in safe zone. But if it fails to secure even 1.1 Z
score it should be assigned in distress zone and it is more likely to become bankrupt. If the
value of Z score is in between 1.1 and 2.6, it should be in the grey zone (Altman, E. I. 1968).
This study shows that all of the selected public sector banks of Pakistan are in the “Grey
Zone” and also all of the selected Indian banks are in the “Grey Zone”, but there are more
chances of Pakistani banks to enter in the “Safe Zone” because the z-score values of
Pakistani banks are nearer to 2.6. These results are shown in table 1, 2 and figure 1 and 2.
The financial ratios of the Pakistan’s public sector banks and selected India’s public sector
banks are given in table 3 and 4 respectively. The determinants of financial ratios of
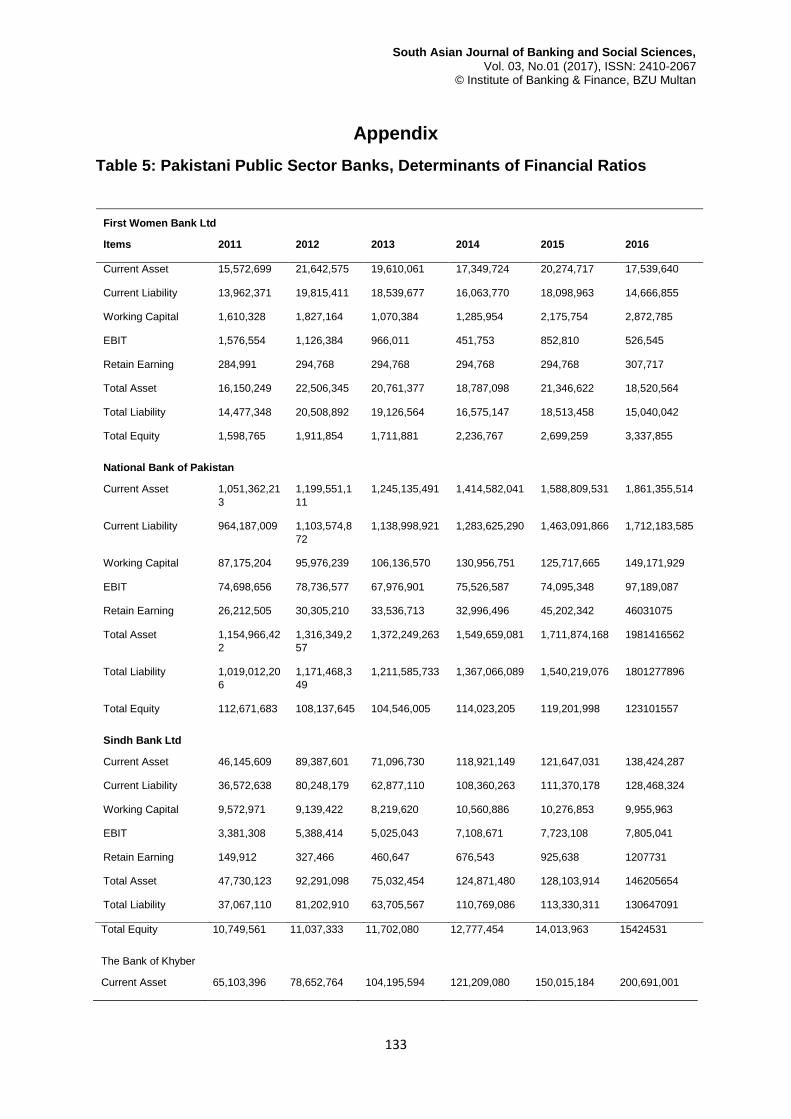
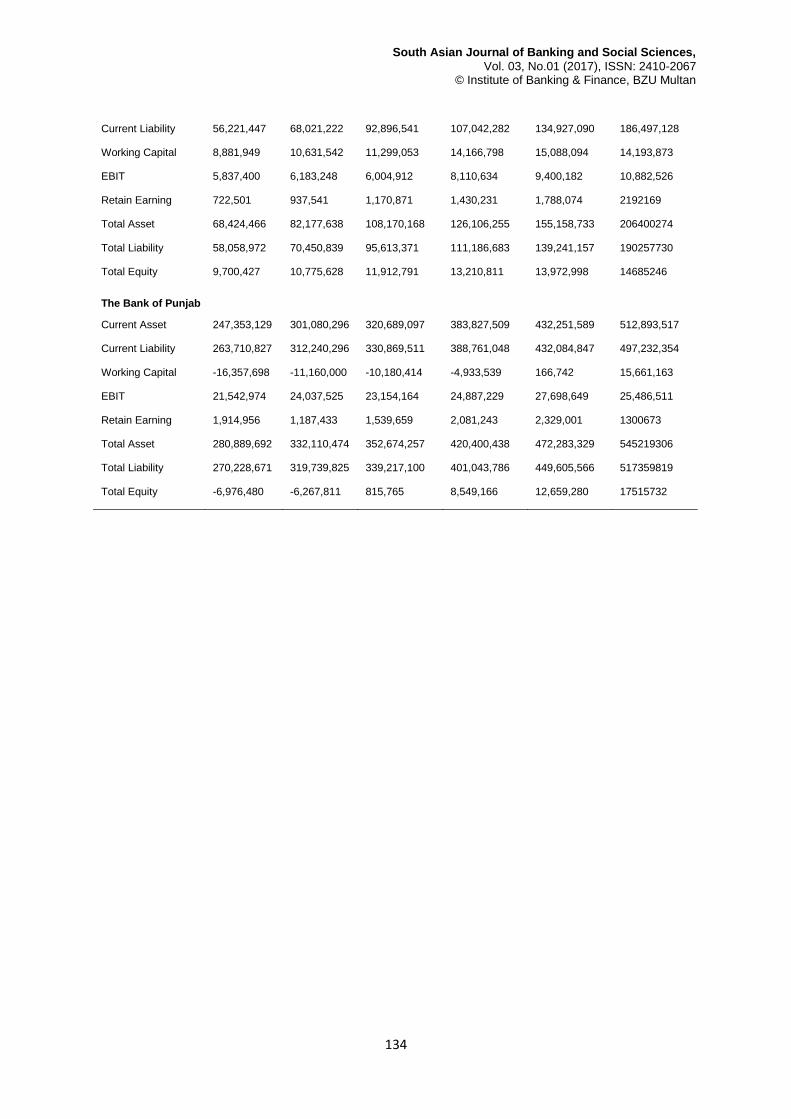
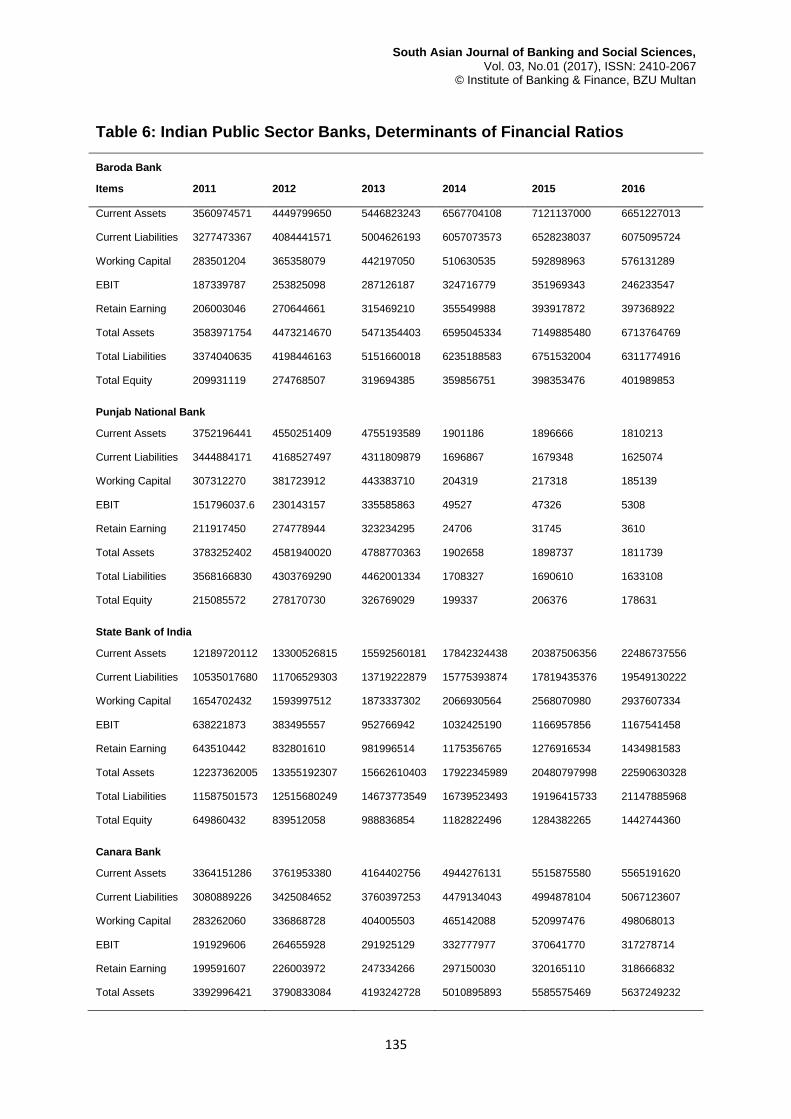
Pakistan’s public sector banks are given in table 5 and the determinants of financial ratios of
selected India’s public sector banks are given in table 6, which explains the strength of these
determinants towards financial ratios, ultimately towards z score values and table 5 & table 6
are placed in the appendix.
4.0 CONCLUSION
This study compared the financial distress in the public sector banking of Pakistan
and India by using the advanced Altman’s Z-score model applying with accounting ratios and
statistical techniques. The findings of the current study concluded that 100% of the selected
public sector banks of Pakistan are in the “Grey Zone” and also 100% of the selected Indian
banks are in the “Grey Zone”, but there are more chances of Pakistani banks to enter in the
“Safe Zone” because the z-score values of Pakistani banks are nearer to 2.6. Based on the
results of the model in this study it has cleared that the earnings before interest and taxes
(EBIT) to total asset ratio is able to predict firms financial distress more accurately than the
other variables. The study is expected to give the clear idea about the financial performance
of public sector banks operating in Pakistan and India. The result indicates that operating
efficiency is reducing gradually because of excess disbursement of nonperforming loans
(Muniappan, G. P. 2002).

South Asian Journal of Banking and Social Sciences,
Vol. 03, No.01 (2017), ISSN: 2410-2067 © Institute of Banking & Finance, BZU Multan
130
Loans are the asset of the banks when loans are written as a bad debt which
severely affects the financial performance of the banks, which may be the reason of financial
distress as well as bankruptcy. So, the top management of the banks should be more careful
about the loan disbursement and showing managerial efficiency. The results of this study are
aligned with another study on financial performance analysis of Pakistan Banking sector
using the Altman Z-score, which also explains that banks lie in the bankruptcy segment
because all have a Z-score less than 2.6. But all commercial banks are operating their
activities normally (Ihsan, I. R; Ahmed, J. S; Kazuri, N. I; Muhammad, S. L. 2015). This
comparative study is conducted on selected public sector banks of Pakistan and India for the
years 2011-2016. For future researchers it is recommended that it can be done by the
comparison of different countries like South Asian Association for Regional Cooperation
(SAARC) with the help of extended financial data.
References
1. Ahn, B. S., Cho, S. S., & Kim, C. Y. (2000). The integrated methodology of
rough set theory and artificial neural network for business failure
prediction. Expert systems with applications, 18(2), 65-74.
2. Aldrich, J. H., & Nelson, F. D. (1984). Linear Probability, Logit and Probit
Models (Quantitative Applications in Social Sciences, Vol. 45). Beverly Hills.
3. Alexakis, P. (2008). 'Altman Ζ-score model'and prediction of business
failures. International Journal of Monetary Economics and Finance, 1(4), 329-
337.
4. Altman, E. I. (1968). Financial ratios, discriminant analysis and the prediction
of corporate bankruptcy. The journal of finance, 23(4), 589-609.
5. Anjum, S. (2012). Business bankruptcy prediction models: A significant study
of the Altman’s Z-score model. Asian Journal of management research, 3(1),
212-219.
6. Beaver, W. H. (1966). Financial ratios as predictors of failure. Journal of
accounting research, 71-111.
7. Bee, T. S., & Abdollahi, M. (2011). CORPORATE FAILURE PREDICTION:
MALAYSIA'S EMERGING MARKET. International Journal of Finance, 23(2).
8. Campbell, A. (2007). Bank insolvency and the problem of nonperforming
loans. Journal of Banking Regulation, 9(1), 25-45.
9. Chotalia, P. (2012). Evaluation of Financial Health of Sampled Private Sector
Banks with Altman Z-score Model. Circulation in more than 85 countries, 7.

South Asian Journal of Banking and Social Sciences,
Vol. 03, No.01 (2017), ISSN: 2410-2067 © Institute of Banking & Finance, BZU Multan
131
10. Erari, A., Salim, U., & Idrus, M. S. (2013). Djumahir (2013),“Financial
Performance Analysis of PT. Bank Papua: Application of CAEL, Z-Score and
Bankometer”. IOSR journal of business and management, 7(5), 08-16.
11. Hussain, F., Ali, I., Ullah, S., & Ali, M. (2014). Can Altman Z-score Model
Predict Business failures in Pakistan?“Evidence from Textile companies of
Pakistan”. Journal of Economics and Sustainable Development ISSN 2222-
1700 (Paper), 5(13).
12. Ihsan, I. R., Ahmed, J. S., Kazuri, N. I., & Muhammad, S. L. (2015). Financial
Performance analysis of Pakistan Banking Sector using Altman score model
of corporate Bankruptcy. Applied research journal, 1(1), 33-40.
13. Jan, A., & Marimuthu, M. (2015). Bankruptcy and sustainability: A conceptual
review on islamic banking industry. Global Business and Management
Research, 7(1), 109.
14. Krishna Chaitanya, V. (2005). Measuring Financial Distress of IDBI Using
Altman Z-Score Model. Icfai University Journal of Bank Management, Icfai
Press, vol. 0 (3), pp7-17, August.
15. Millihni, G. L. V. (2003). Predicting the Possibility of Failure in a Canadian
Firm. Unpublished MBA Research Project, Simon Fraser University.
16. Mizan, A. N. K., & Hossain, M. (2014). Financial soundness of cement
industry of Bangladesh: an empirical investigation using Z-score.
17. Mohammed, A. A. E., & Kim-Soon, N. (2012). Using Altman's model and
current ratio to assess the financial status of companies quoted in the
Malaysian stock exchange. International Journal of Scientific and Research
Publications, 2(7), 1-11.
18. Muniappan, G. P. (2002). The NPA Overhang-Magnitude. Solutions, Legal
Reforms" address at CII Banking Summit.
19. Nandi, J. K., & Choudhary, N. K. (2011). Credit Risk Management of Loan
Portfolios by Indian Banks: Some Empirical Evidence. IUP Journal of Bank
Management, 10(2), 32.
20. O’Leary, E. G. (2001). Business Failure Prediction and the Efficient Market
Hypothesis. Unpublished MBA Research Project, Simon Fraser University,
November.
21. Ooghe, H., & De Prijcker, S. (2008). Failure processes and causes of
company bankruptcy: a typology. Management Decision, 46(2), 223-242.
22. Pradhan, R. (2014). Z score estimation for Indian banking sector. International
journal of trade, economics and finance, 5(6), 516.

South Asian Journal of Banking and Social Sciences,
Vol. 03, No.01 (2017), ISSN: 2410-2067 © Institute of Banking & Finance, BZU Multan
132
23. Robbins, A., & Pearce, L. (2005). Corporate bankruptcy prediction models
applied to emerging economies: Evidence from argentina in the years 1991-
1998. International Journal of Commerce and Management, 17(4), 295-311.
24. Ross, S. A., R. W. Westerfield, and J, Jaffe, 1999, Corporate Finance, Irwin
McGraw-Hill, Boston, International Edition
25. Ross, S. A., Westerfield, R. W., Jaffe, J., and Jordan, B. D. (2007). Modern
Financial Management. 8th ed. New York: McGraw Hill.
26. Sands, E. G., Springate, G. L., & Var, T. (1982). Predicting business failures:
a Canadian approach. Simon Fraser University, Faculty of Business
Administration.
27. Sharma, N. M. (2013). Altman model and financial soundness of Indian
banks. International Journal of Accounting and Finance, 3(2), 55-60.
28. Simić, D., Kovačević, I., & Simić, S. (2011). Insolvency prediction for
assessing corporate financial health. Logic Journal of IGPL, 20(3), 536-549.
29. Telmoudi, F., El Ghourabi, M., & Limam, M. (2011). RST–
GCBR‐Clustering‐Based RGA–SVM Model for Corporate Failure
Prediction. Intelligent Systems in Accounting, Finance and
Management, 18(2-3), 105-120.
30. Young, M. N., Peng, M. W., Ahlstrom, D., Bruton, G. D., & Jiang, Y. (2008).
Corporate governance in emerging economies: A review of the principal–
principal perspective. Journal of management studies, 45(1), 196-220.
South Asian Journal of Banking and Social Sciences,
Vol. 03, No.01 (2017), ISSN: 2410-2067 © Institute of Banking & Finance, BZU Multan
133
Appendix
Table 5: Pakistani Public Sector Banks, Determinants of Financial Ratios
Total Equity 10,749,561 11,037,333 11,702,080 12,777,454 14,013,963 15424531
The Bank of Khyber
Current Asset 65,103,396 78,652,764 104,195,594 121,209,080 150,015,184 200,691,001
First Women Bank Ltd
Items 2011 2012 2013 2014 2015 2016
Current Asset 15,572,699 21,642,575 19,610,061 17,349,724 20,274,717 17,539,640
Current Liability 13,962,371 19,815,411 18,539,677 16,063,770 18,098,963 14,666,855
Working Capital 1,610,328 1,827,164 1,070,384 1,285,954 2,175,754 2,872,785
EBIT 1,576,554 1,126,384 966,011 451,753 852,810 526,545
Retain Earning 284,991 294,768 294,768 294,768 294,768 307,717
Total Asset 16,150,249 22,506,345 20,761,377 18,787,098 21,346,622 18,520,564
Total Liability 14,477,348 20,508,892 19,126,564 16,575,147 18,513,458 15,040,042
Total Equity 1,598,765 1,911,854 1,711,881 2,236,767 2,699,259 3,337,855
National Bank of Pakistan
Current Asset 1,051,362,21
3
1,199,551,1
11
1,245,135,491 1,414,582,041 1,588,809,531 1,861,355,514
Current Liability 964,187,009 1,103,574,8
72
1,138,998,921 1,283,625,290 1,463,091,866 1,712,183,585
Working Capital 87,175,204 95,976,239 106,136,570 130,956,751 125,717,665 149,171,929
EBIT 74,698,656 78,736,577 67,976,901 75,526,587 74,095,348 97,189,087
Retain Earning 26,212,505 30,305,210 33,536,713 32,996,496 45,202,342 46031075
Total Asset 1,154,966,42
2
1,316,349,2
57
1,372,249,263 1,549,659,081 1,711,874,168 1981416562
Total Liability 1,019,012,20
6
1,171,468,3
49
1,211,585,733 1,367,066,089 1,540,219,076 1801277896
Total Equity 112,671,683 108,137,645 104,546,005 114,023,205 119,201,998 123101557
Sindh Bank Ltd
Current Asset 46,145,609 89,387,601 71,096,730 118,921,149 121,647,031 138,424,287
Current Liability 36,572,638 80,248,179 62,877,110 108,360,263 111,370,178 128,468,324
Working Capital 9,572,971 9,139,422 8,219,620 10,560,886 10,276,853 9,955,963
EBIT 3,381,308 5,388,414 5,025,043 7,108,671 7,723,108 7,805,041
Retain Earning 149,912 327,466 460,647 676,543 925,638 1207731
Total Asset 47,730,123 92,291,098 75,032,454 124,871,480 128,103,914 146205654
Total Liability 37,067,110 81,202,910 63,705,567 110,769,086 113,330,311 130647091
South Asian Journal of Banking and Social Sciences,
Vol. 03, No.01 (2017), ISSN: 2410-2067 © Institute of Banking & Finance, BZU Multan
134
Current Liability 56,221,447 68,021,222 92,896,541 107,042,282 134,927,090 186,497,128
Working Capital 8,881,949 10,631,542 11,299,053 14,166,798 15,088,094 14,193,873
EBIT 5,837,400 6,183,248 6,004,912 8,110,634 9,400,182 10,882,526
Retain Earning 722,501 937,541 1,170,871 1,430,231 1,788,074 2192169
Total Asset 68,424,466 82,177,638 108,170,168 126,106,255 155,158,733 206400274
Total Liability 58,058,972 70,450,839 95,613,371 111,186,683 139,241,157 190257730
Total Equity 9,700,427 10,775,628 11,912,791 13,210,811 13,972,998 14685246
The Bank of Punjab
Current Asset 247,353,129 301,080,296 320,689,097 383,827,509 432,251,589 512,893,517
Current Liability 263,710,827 312,240,296 330,869,511 388,761,048 432,084,847 497,232,354
Working Capital -16,357,698 -11,160,000 -10,180,414 -4,933,539 166,742 15,661,163
EBIT 21,542,974 24,037,525 23,154,164 24,887,229 27,698,649 25,486,511
Retain Earning 1,914,956 1,187,433 1,539,659 2,081,243 2,329,001 1300673
Total Asset 280,889,692 332,110,474 352,674,257 420,400,438 472,283,329 545219306
Total Liability 270,228,671 319,739,825 339,217,100 401,043,786 449,605,566 517359819
Total Equity -6,976,480 -6,267,811 815,765 8,549,166 12,659,280 17515732
South Asian Journal of Banking and Social Sciences,
Vol. 03, No.01 (2017), ISSN: 2410-2067 © Institute of Banking & Finance, BZU Multan
135
Table 6: Indian Public Sector Banks, Determinants of Financial Ratios
Baroda Bank
Items 2011 2012 2013 2014 2015 2016
Current Assets 3560974571 4449799650 5446823243 6567704108 7121137000 6651227013
Current Liabilities 3277473367 4084441571 5004626193 6057073573 6528238037 6075095724
Working Capital 283501204 365358079 442197050 510630535 592898963 576131289
EBIT 187339787 253825098 287126187 324716779 351969343 246233547
Retain Earning 206003046 270644661 315469210 355549988 393917872 397368922
Total Assets 3583971754 4473214670 5471354403 6595045334 7149885480 6713764769
Total Liabilities 3374040635 4198446163 5151660018 6235188583 6751532004 6311774916
Total Equity 209931119 274768507 319694385 359856751 398353476 401989853
Punjab National Bank
Current Assets 3752196441 4550251409 4755193589 1901186 1896666 1810213
Current Liabilities 3444884171 4168527497 4311809879 1696867 1679348 1625074
Working Capital 307312270 381723912 443383710 204319 217318 185139
EBIT 151796037.6 230143157 335585863 49527 47326 5308
Retain Earning 211917450 274778944 323234295 24706 31745 3610
Total Assets 3783252402 4581940020 4788770363 1902658 1898737 1811739
Total Liabilities 3568166830 4303769290 4462001334 1708327 1690610 1633108
Total Equity 215085572 278170730 326769029 199337 206376 178631
State Bank of India
Current Assets 12189720112 13300526815 15592560181 17842324438 20387506356 22486737556
Current Liabilities 10535017680 11706529303 13719222879 15775393874 17819435376 19549130222
Working Capital 1654702432 1593997512 1873337302 2066930564 2568070980 2937607334
EBIT 638221873 383495557 952766942 1032425190 1166957856 1167541458
Retain Earning 643510442 832801610 981996514 1175356765 1276916534 1434981583
Total Assets 12237362005 13355192307 15662610403 17922345989 20480797998 22590630328
Total Liabilities 11587501573 12515680249 14673773549 16739523493 19196415733 21147885968
Total Equity 649860432 839512058 988836854 1182822496 1284382265 1442744360
Canara Bank
Current Assets 3364151286 3761953380 4164402756 4944276131 5515875580 5565191620
Current Liabilities 3080889226 3425084652 3760397253 4479134043 4994878104 5067123607
Working Capital 283262060 336868728 404005503 465142088 520997476 498068013
EBIT 191929606 264655928 291925129 332777977 370641770 317278714
Retain Earning 199591607 226003972 247334266 297150030 320165110 318666832
Total Assets 3392996421 3790833084 4193242728 5010895893 5585575469 5637249232

South Asian Journal of Banking and Social Sciences,
Vol. 03, No.01 (2017), ISSN: 2410-2067 © Institute of Banking & Finance, BZU Multan
136
Total Liabilities 3187483190 3558784287 3939156874 4705997733 5256871878 5308660177
Total Equity 204021607 230433972 251764266 301762618 324917080 324096742
Union Bank of India
Current Assets 2336916628 2598756396 3093818002 3511724338 3789339775 4034127089
Current Liabilities 2157772550 2407784334 2875588475 3269922574 3522298988 3747541239
Working Capital 179144078 190972062 218229527 241801764 267040787 286585850
EBIT 103988786 144423797 178316097 214907580 236678994 252502665
Retain Earning 121291902 139715088 165,883,945 177340516 191251031 223606717
Total Assets 2359844470 2622114375 3118608073 3537809023 3816159307 4073645636
Total Liabilities 2232199244 2475783797 2945646186 3353055444 3618550488 3843164508
Total Equity 127645226 146330578 172961887 184753579 197608819 230481128