Embed Size (px)
Citation preview

Evaluating Eight Field and Remote Sensing Approaches for Mapping the Benthos of Three Different Coral Reef Environments in Fiji
Chris Roelfsema & Stuart Phinn
Centre for Remote Sensing and Spatial Information Science School of Geography, Planning and Architecture, University of Queensland
St.Lucia, Queensland, 4072, Australia Tel: (61)-7-3365-6977 Fax: (61)-7-3365-6899, E-mail: [email protected]
Abstract: Monitoring of coral reef environments require accurate, timely and relevant information on their composition and condition. These environments are challenging to map due to their variation in reef type, remoteness, extent, benthic cover composition and variable water clarities. This work evaluates the accuracy, cost and relevance of eight commonly used benthic cover mapping approaches applied in three different coral reef environments in Fiji. The eight mapping techniques varied in field data source (local knowledge, point and transect surveys), image data (Quickbird 2 and Landsat 5 TM), level of image correction (none or atmospheric) and processing approaches (delineation and supervised classification). The eight mapping approaches were assessed in terms of their: map accuracy; production time and cost. Qualitative assessment was carried out by map users representing the local marine monitoring agencies. These map assessments showed that users and producers preferred mapping approaches based on: supervised classification of Quickbird imagery integrated with a basic field data. This approach produced an accurate map within a short time; with low cost that suited the user’s purpose. The findings from this work demonstrate how variations in coral reef environments, and map purpose and resources management requirements affected the user’s selection of a suitable mapping approach. Keywords: Coral Reefs, seagrass, photo transects, Landsat, Quickbird, Local knowledge, Fiji
1. Introduction
Coral reef and seagrass environments have an enormous economic, cultural and biological value for the global community [1]. These environments are under threat from various human and natural impacts and require monitoring to develop sustainable management practices [2]. Spatial data play an important role in research, modelling, monitoring and management, as they can be used to display the condition and extent of coastal environments, such as a coral reef, at a variety of spatial and temporal scales [3, 4]. Remotely sensed image data are ideal for monitoring as they cover the complete spatial extent of an area on a repeated basis, at a range of spatial and temporal scales [5-7]. Commonly used approaches for mapping benthic community cover on coral reefs use local knowledge; field surveys; and remote sensing data sources separately or integrated with each other, at various levels [8-10]. Benthic communities are defined as an assemblage of stony coral and / or other conspicuous benthic populations which can co-exist on reefal or non-reefal substrates [11]. The mapping approaches used in this study were differentiated by their use of: benthic field data type (e.g. local knowledge); image data type (e.g. Quickbird); image corrections (e.g. atmospheric); and mapping methods applied (e.g. delineation or supervised classification). Conventional coral reef maps were based on field data, created through planimetric surveys and visual observations [12]. The first remote sensing based approaches used aerial photography in conjunction with local knowledge or field data to delineate coral reef features [13, 14]. More recently, local knowledge has been integrated with satellite image data [10]. Most commonly used image based mapping approaches focus on individual pixel characteristics of high, moderate and low spatial resolution multi-spectral imagery, integrated with field data, by applying unsupervised or supervised image classification methods [15-17]. The use of high spatial resolution multi- and hyper-spectral sensors has resulted in development of innovative coral reef mapping methods based on sub-pixel [18, 19] and/or object-based processing [20]. Further improvements in these digital image based mapping approaches is achieved using detailed image corrections (e.g. atmospheric, air water interface and water column) [21].
Invited Paper
Remote Sensing of Inland, Coastal, and Oceanic Waters, edited by Robert J. Frouin,Serge Andrefouet, Hiroshi Kawamura, Mervyn J. Lynch, Delu Pan, Trevor Platt,
Proc. of SPIE Vol. 7150, 71500F · © 2008 SPIE · CCC code: 0277-786X/08/$18 · doi: 10.1117/12.804806
Proc. of SPIE Vol. 7150 71500F-1
Downloaded From: http://proceedings.spiedigitallibrary.org/ on 11/23/2015 Terms of Use: http://spiedigitallibrary.org/ss/TermsOfUse.aspx

Coral reef environments are challenging to map since they are known to vary, within and between reefs, in their: remoteness, extent, reef type, water depth, benthic composition and water clarity [22]. Majority of remote sensing studies compared mapping approaches on a small portion of a coral reef, e.g. [23] or at one reef, e.g. [20]. Only a few studies have mapped several reefs at a time or reef system over large spatial scales (> 100 km2) [24-26]. Other studies focussed on discrimination of coral reef features from their reflectance properties assuming constant water clarity and depth [27]. Although the findings found in the previous mapping studies are valuable, they did not take into account the variation (e.g. water clarity) that occurs within one or more coral reef environments. Limited options are provided for producers of coral reef maps on how to select data acquisition and processing techniques that take into account variations in: water clarity, water depth, heterogeneity of the benthos, and how these affect map accuracy, production time and costs. Cost-effectiveness of coral reef mapping approaches has been assessed by reviewing various factors often in one coral reef environment [28, 29]. In these papers the factors determining cost-effectiveness included: map accuracy; production cost and time; and skills and knowledge needed. Most of these studies are conducted from a map producer’s perspective and do not take into account the perceived relevance of a coral reef map for the user. What they perceive as cost effective can vary from a producer and user [30] and both viewpoints need to be considered when designing a mapping program. The aim of this paper is to inform the coral reef research and management communities on the accuracy, cost and perceived relevance of eight commonly used benthic cover mapping approaches for three different coral reef environments in Fiji. The eight mapping approaches that were applied in three different coral reef environments are introduced in the following section, followed by a description of how they were assessed in terms of accuracy, cost and relevance to users. The resulting maps and associated assessments are then discussed to provide findings in the context of which mapping approach is suitable for a specific user, mapping purpose and coral reef environment.
2. Methodology
2.1. Study Area and Overview of Mapping Approaches Assessed
The three study areas, Suva, Navakavu and Solo, were located in Fiji and represented several different coral reef environments which varied in reef type; extent, remoteness, benthic cover composition, spatial benthic complexity, and water clarity (Figure 1).
Rewa RiverMouth
Figure 1: Study areas: Suva, Navakavu and Solo areas, in the central part of the Fiji Island group.
Proc. of SPIE Vol. 7150 71500F-2
Downloaded From: http://proceedings.spiedigitallibrary.org/ on 11/23/2015 Terms of Use: http://spiedigitallibrary.org/ss/TermsOfUse.aspx

One study area was the Suva area situated on the southeast coast of Vitu Levu Island near Fiji’s capital, Suva. The Navakavu area was located to the west of Suva and the Solo area 70 km south of Suva. The Suva study area was influenced by turbid waters flowing out of the Rewa River, which has the largest catchment on Viti Levu [31]. Navakavu was influenced by smaller amounts of runoff because of the limited discharge from a smaller river catchment. Solo reef is an oceanic atoll surrounded by clear deep water (Table 1)[32]. To assess the potential control of the spatial complexity on reef community features, a quantitative measure of spatial complexity was calculated for each study area. This measure, known as patch richness density, was determined by dividing the number of categories mapped by the extent of the area mapped [33] using the mapping approach that would provide the largest detail.
Table 1: Characterisation of the main study areas in Fiji. Study Area
Water clarity Site description Benthic cover Remarks
Study area (km2)
Mapped area (km2)
Suva Turbid to clear
Estuarine shallow bank and barrier reef
Large homogenous seagrass, sand & mud areas and large heterogenous coral and algae areas.
Large river and high rainfall, Terrestrial 64 24
Navakavu Turbid to clear
Fringing reef Mixture of seagrass, algae, sand, rubble, algae and coral reef, hetrogenous
Smaller rivers and high rainfall, Terrestrial
20 16
Solo ClearAtoll reef, (30 km
from major islands) Coral, rock, rubble and cyano bacteria, homogenous Oceanic 39 15
Eight different mapping approaches were assessed, for each study area, in terms of their cost and benefits from a user and producer perspective. The mapping approaches could be differentiated by their use of: mapping method; benthic field information sources; image type; and level of image correction (Table 2). All benthic field information was collected between August and October 2006 and the images on 24th April 2006 for Suva and Solo and 17th October 2006. Table 2: The eight coral reef mapping approaches, assessed for three Fijian reefs. Basic field data = spot check surveys, detailed field data = georeferenced photo transect. Basic atmospheric correction= dark pixel subtraction, Full corrections = radiative transfer based atmospheric correction + air water interface correction. Letters represent mapping approach.
A Detailed field data Quickbird Full atmospheric+air water interface
B Detailed field data Quickbird Basic atmospheric
C Local expert knowledge Quickbird Basic atmospheric
D Basic field data Quickbird Basic atmospheric
E Detailed field data Landsat* Basic atmospheric
F Detailed field data Quickbird RGB None
G Local expert knowledge Quickbird RGB None
H Local community knowledge Landsat 2002 None
Manual delineation of classes using the
image as a backdrop
Code: Mapping Approach Field data / knowledge Corrections
Supervised Classification
Image type *=simulated using
Quickbird
2.2. Benthic Field Information Sources
Information of the benthic cover composition was gathered in the field using detailed photo transects and/or basic spot check field methods and by local knowledge from two sources, community and experts (Figure 2). Detailed field data (Figure 2a) was collected through georeferenced photo transect surveys where a snorkeler or diver swam over the bottom while taking photos of the benthos at fixed height using a standard digital camera and towing a surface GPS which logged its track. The length of the transect varied between 100 m and 900 m and photos were taken at 2-4 m intervals, resulting in 1792 photos for Suva, 1904 for Navakavu and 1121 for Solo.
Proc. of SPIE Vol. 7150 71500F-3
Downloaded From: http://proceedings.spiedigitallibrary.org/ on 11/23/2015 Terms of Use: http://spiedigitallibrary.org/ss/TermsOfUse.aspx

Benthic cover composition for each of the photos was manually determined using Coral Point Count Excel software[34]. Mapping categories (see legend Figure 3) were assigned to each photo based on a classification scheme for the benthic cover composition. This scheme was derived on the principles outlined in [35] and modified to suit user needs and composition of reefs in the study areas. Photos were linked to coordinates using GPS-Photo Link® software and could be viewed with corresponding benthic information in GIS environment for further analysis. Basic field data (Figure 2b) were collected through spot check surveys from a boat or through in-water surveys, where visual estimates of the major benthic categories and GPS location were recorded. For Suva, Navakavu and Solo, respectively 181, 224 and 132 spot check data points were collected. Selection of field sample site location and number for photo transects and spot checks was done to cover a representative variety of reef spatial benthic community structures within the Suva, Navakavu and Solo study areas. Stratification was achieved by having sample sites distributed throughout the study areas based on visually apparent benthic community structures in the satellite image in which sites were assumed to be selected randomly. Local community knowledge (Figure 2c) was gathered for Navakavu by having local community members interpret a Landsat 5 Thematic Mapper (TM) image. The image was projected on white paper, so areas with known benthic cover could be manually delineated and labelled by the community members. The community members were represented by local fishermen who were knowledgeable on the benthic composition, since they visit Navakavu to fish on a regular basis. This approach was not implemented in Suva and Solo since there was no similar community group. Local expert knowledge (Figure 2d) was gained with the help of a marine park ranger in Navakavu and a local scientist in Suva. Both experts were knowledgeable about the two study areas due to their regular visits over several years. Based on that, the experts assigned mapping categories to 200 randomly distributed sample points, which were overlayed on top of the Quickbird image. This information could not be gathered for Solo as no local expert could be found that regular would visit the remote location.
Figure 2: Benthic cover field data collection through: (a) Detailed georeferenced photo transects, (b) basic spot check
surveys, (c) local community knowledge and (d) Local expert knowledge.
2.3. Image Acquisition and Processing
Multi-spectral high spatial resolution Quickbird 2 imagery was acquired for all sites within one hour from low tide on the 25th April 2006 for Suva (16° off nadir) and Solo (17° off nadir). and 17th October 2006 for Navakavu (19° off nadir). Suva and Navakavu had less than 5% cloud cover along coastal fringe at the time of image capture, while Solo had none but some sun glint. The Navakavu image had large areas of the reef covered by pumice stone rafts, produced from volcanoes in the South Pacific [36]. Radiometric and geometric corrections were applied to the Quickbird image to derive an image corrected to at-surface reflectance. Two forms of corrections were applied: basic and complex. The basic correction included removal of additive path radiance by applying dark pixel subtraction using ERDAS imagine 9.1[37]. For the complex adjustment the Quickbird images were atmospherically corrected using the FLAASH atmospheric correction module of the ENVI® image processing software package. Air-water interface correction was applied as discussed in [38] using coefficients extracted from [39]. Depth-invariant bands, based on [40], were not calculated since two main assumption could not be met for Suva and Navakavu. Firstly, it could not be assumed for these sites that water clarity was similar throughout the images. Secondly there was no benthic community type present in areas with same water clarity for shallow and for deep water. Even though these prerequisites were met for the Solo area, it was decided to process each study area in the same manner. Each image was subset using land and deep water masks resulting in an area containing only submerged and exposed inter-tidal areas. Land masks were manually delineated using expert knowledge of the coastal zone to differentiate between the intertidal area and land in the imagery, as the NIR band would exclude exposed intertidal areas. The deep water mask was also manually delineated and included areas where bottom features were still visible. This approach was
Proc. of SPIE Vol. 7150 71500F-4
Downloaded From: http://proceedings.spiedigitallibrary.org/ on 11/23/2015 Terms of Use: http://spiedigitallibrary.org/ss/TermsOfUse.aspx

chosen since there was no: ancillary bathymetric data to create a mask, or access to depth invariant images. The advantage of manually delineated deep water masks was that deeper areas in clear water would still be included. Additional Image Adjustments were needed for Suva and Navakavu reef images. These were manually segmented into two areas, offshore- and inshore-reef, to avoid areas with different benthic community mapping categories but with similar pixel signatures [25, 41]. For each of the study areas the basic corrected Quickbird 2 imagery was resampled to simulate a medium spatial resolution multi-spectral Landsat TM imagery. Resampling was conducted through an area weighted resampling filter based on the point-spread function of the Landsat TM sensor [42].
2.4. Benthic Community Mapping Based on Supervised Classification Five out of the eight benthic community cover maps (see Table 2, mapping approach A,B,C,D & E) were based on the supervised classification method [37]. For this method, 50% of the field data were used to create training areas of interest (AOI’s), which represented the specific benthic community types. The remaining field data were used for validation. The location, shape and label of the AOI’s were determined by: detailed field data; basic field data; or expert knowledge data. The approach was applied since it was known to minimise the mis-registration error through drawing areas of interest based on image texture and pixel colours and the field data as suggested in [43] Reflectance signatures were extracted from each of the remotely sensed images for the training areas (AOI’s), enabling a characteristic “spectral reflectance signature” to be defined for benthic community cover types. Each image pixel was then subjected to a minimum-distance-to-means classification algorithm to group pixels with similar reflectance signatures to produce a map of benthic cover types. The distance-to-means algorithm was chosen since it was known to be the simplest although others would perform better and the focus of this study was not to determine the best classification algorithm [37].
2.5. Benthic Community Mapping Based on Manual Delineation Of the eight benthic community cover mapping approaches applied, three were based on manual delineation from field and image data (see Table 2 for mapping approach F, G & H) using ARCGIS (ESRI). Two delineated maps were created by manually digitising boundaries of benthic community categories using Quickbird true colour images as a back drop in combination with: the detailed field data set (F); or the local expert knowledge (G). The Quickbird image was used to represent Google Earth type imagery. Polygon boundaries were drawn based on image colour and its texture at a scale of 1:10000 and polygon mapping categories were assigned by the field data. A final local community knowledge based map (H) was created by first photographing the previously created paper map and then georeferencing the photo to the Landsat image. The digitised image was overlaid on the Landsat image and used as a backdrop to digitising the lines and delineated additional lines based on the local community representative’s review of the map.
2.6. Scientific Assessment of Benthic Community Mapping Approaches The scientific assessment consisted of two components, applying error and accuracy metrics and time/cost measures commonly reported in scientific papers that assess image based mapping approaches for each study area. Overall accuracy, a commonly used accuracy measure, was calculated for each of the benthic community cover maps. It was defined as the total number of mapped pixels that were correctly classified divided by total number of validation pixels [44]. The mapped pixels were extracted using the validation AOI’s. These AOI’s resulted from the remaining 50% of the field data and were created following the same approach as for the calibration AOI’s, Time and cost needed to create each map were calculated. The time included: planning, field work, travel, field data analysis, image correction, image calibration and validation. The cost included: labour (e.g. field and office time for boat driver, researcher), logistics (e.g. boat hire, travel cost) and remote sensing imagery (e.g. Quickbird, Landsat TM, Google Earth). The cost excluded GIS and image processing software packages, cameras and GPS equipment, as it was assumed that these were already available.
2.7. User Assessment of Benthic Community Mapping Approaches An evaluation of the relevance of the maps, as perceived by the Fijian users was conducted by 14 users, who represented local Fijian authorities involved in research, conservation and management of the marine environment. The following information was gathered from each user: 1) details characterising themselves and their mapping needs; 2) their qualitative assessment of the maps to understand how they perceived them; and 3) the criteria they used to assess a map. For the qualitative assessment the user was provided with A3 size colour prints of each map and the original Quickbird image. The user then ranked the eight maps using the following four questions: 1) which map represents the reef best; 2) which map would provide sufficient information for the map purpose the user had defined; 3) was the same as 2) but the
Proc. of SPIE Vol. 7150 71500F-5
Downloaded From: http://proceedings.spiedigitallibrary.org/ on 11/23/2015 Terms of Use: http://spiedigitallibrary.org/ss/TermsOfUse.aspx

user was then provided with cost and time needed to create each map and asked to decide; and 4) was the same as 3) but and the user was then also provided with the accuracy of each map and asked to decide.
3. Results and Discussion
3.1. Scientific Visual Assessment of Benthic Community Maps When visually assessing the 21 maps, resulting from the mapping approaches applied in each study area, it was evident they each produced different representations of benthic community composition. Each of these maps could lead to different conclusions about the state of the coral reef environment and therefore the maps accuracy in relation to the mapping approach implemented would need careful considered. Navakavu had all eight approaches implemented, Suva seven and Solo five (see examples in Figure 3 and Figure 4). Fewer maps were created for Suva and Solo due to absence of suitable sources of local knowledge as discussed previously.
2 km
A
B
C
D
E
F
G
H
1 km
Seagrass Sand Rubble
Seagrass Dominant
Sand Rubble Rock
Sand Rubble
Sand Dominant
Sand AlgaeRubble Dominant
Rock Rubble
Rock Dominant
Pumice stone
Pavement
MudMangrove
Live/Dead coral
Coral Rubble Sand
Coral Rock
Coral Dominant
Breaking Water
Algae Seagrass
Algae Rubble Sand
Algae Dominant
Figure 3: Example of the benthic community maps for Navakavu based on the eight mapping approaches with a zoom in
of a small area to show the detail of the mapping approaches (Letter represent mapping approach see Table 2). Initial inspection of the maps showed differences in detail, mainly in terms of minimum mapping unit scale and feature generalisation (Figure 3). These difference were due to the application of supervised classified (maps A,B,C,D & E) as opposed to manual delineation (maps F,G & H). For the supervised classification based approaches individual pixels were assigned to a mapping category and with manual delineation this was based on a group of pixels. As a result, manually delineated maps showed relatively large homogenous areas assigned to one mapping category (e.g seagrass),
Proc. of SPIE Vol. 7150 71500F-6
Downloaded From: http://proceedings.spiedigitallibrary.org/ on 11/23/2015 Terms of Use: http://spiedigitallibrary.org/ss/TermsOfUse.aspx

IlIom9ef S
00.51 2
LegendAIgaeAlgae. Rubble. SancAlgae. SeagranuSand. AlgaeTurf on Rubble
whereas the same location in the supervised classifications showed mixture of these categories. One exception for this was for the map based on supervised classification using expert knowledge (maps C) which had large areas with seagrass. This was expected to be a result of a preference by the expert to assign seagrass category to the random points. The map based on local community knowledge (map H) showed only brought general patterns of the mapping categories compared to any of the other maps (maps A,B,C,D,E,F & G). This suggests that this type of map could be suitable to get a rough idea of the benthic composition of a study area but was lacking any detail. Figure 4 illustrates the differences in spatial distribution of benthic community cover types that were present in each study area. These differences were firstly, and predominantly due to differences in coral reef environments, and secondly due to differences in mapping approaches. The mapping approaches presented were considered basic and more complex.. Basic meaning an approach based on manual delineation of Quickbird RGB imagery and georeferenced photo transects with no atmospheric correction (Table 2 approach F). Whereas complex approach was based on supervised classification of Quickbird imaged subject to atmospheric and air water interface correction integrated with georeferenced photo transects (Table 2 approach A). For each of the maps based on the complex approach, patch richness density was calculated and resulted in a patch richness density for Suva of 0.13, Navakavu of 0.39 and Solo of 0.19. These values confirmed visual observation of the maps and imagery that Navakavu relative, to especially Suva, had a higher spatial complexity of the benthic cover.
Basic
Complex
Suva
Navakavu
Solo
Figure 4: Benthic community maps for the Suva, Navakavu and Solo study areas based on: Basic = Manual delineation of Quickbird RGB imagery and georeferenced photo transects; Complex = Supervised classification of atmospheric and
air water interface correction Quickbird imaged integrated with georeferenced photo transects.
3.2. Scientific Accuracy Assessment of Benthic Community Maps The comparison of the overall accuracies for the eight mapping approaches showed that the highest overall map accuracy (52 % to 62%) was obtained for mapping approaches based on supervised classification of the Quickbird imagery integrated with field survey data (Figure 5 approach A, B &D). Accuracies for the Suva site, were an exception, since two mapping approaches based on manual delineation, both had higher overall accuracies of 67 % and 75 % respectively (Figure 5 approach G & F). This was assumed to be a result of the low complexity of benthic cover features in the Suva site compared to the others. As a result this made mapping in Suva an easier task for both manual delineation and image classification. This highlights the fact that spatial complexity of environments has been found to be a significant control of per-pixel image classification accuracy [45].
Proc. of SPIE Vol. 7150 71500F-7
Downloaded From: http://proceedings.spiedigitallibrary.org/ on 11/23/2015 Terms of Use: http://spiedigitallibrary.org/ss/TermsOfUse.aspx
20
30
40
50
60
70
80
A B C D E F G H
Acc
urac
y (%
)
Mapping approaches
SuvaNavakavuSolo
Figure 5: Overall accuracy of each benthic community map for Suva, Navakavu and Solo based the eight mapping
approaches (Letter represent mapping approach see Table 2). Mapping approach H had the lowest accuracy of 22 %. This resulted from the level of detail identified by the local community members (9 mapping categories) and the scale to which delineation was conducted. Both were less then that acquired by the other field data sources (maximum 21 mapping categories). The mapping approaches resulting from supervised classification (A,B,C,D & E) showed accuracy values ranging from 25% to 62% with 10-21 mapping categories. These accuracies were lower as those found in the literature, however, the literature had less than 10 mapping categories [24, 25, 46]. This difference in number of categories could explain the reduction in accuracies since it was known that a reduction in categories would increase the accuracy [7]. Similar findings were found for the mapping approaches which included local knowledge (F&G) which also had lower accuracy and more mapping categories compared to similar studies[10]. The attribute positional accuracy was considered high for maps based on high spatial resolution (A,B,C & D) in relation to low spatial resolution maps (F,E, G & H) imagery [17]. The robustness determined if a mapping approach would result in a similar accuracy over a range of environment types and levels of spatial complexity. The literature suggests that pixel based mapping approaches in general are considered more robust and repeatable than manual delineations [8]. Mapping approaches that include detailed transects surveys for acquiring calibration and validation data are more robust then other field methods [15].
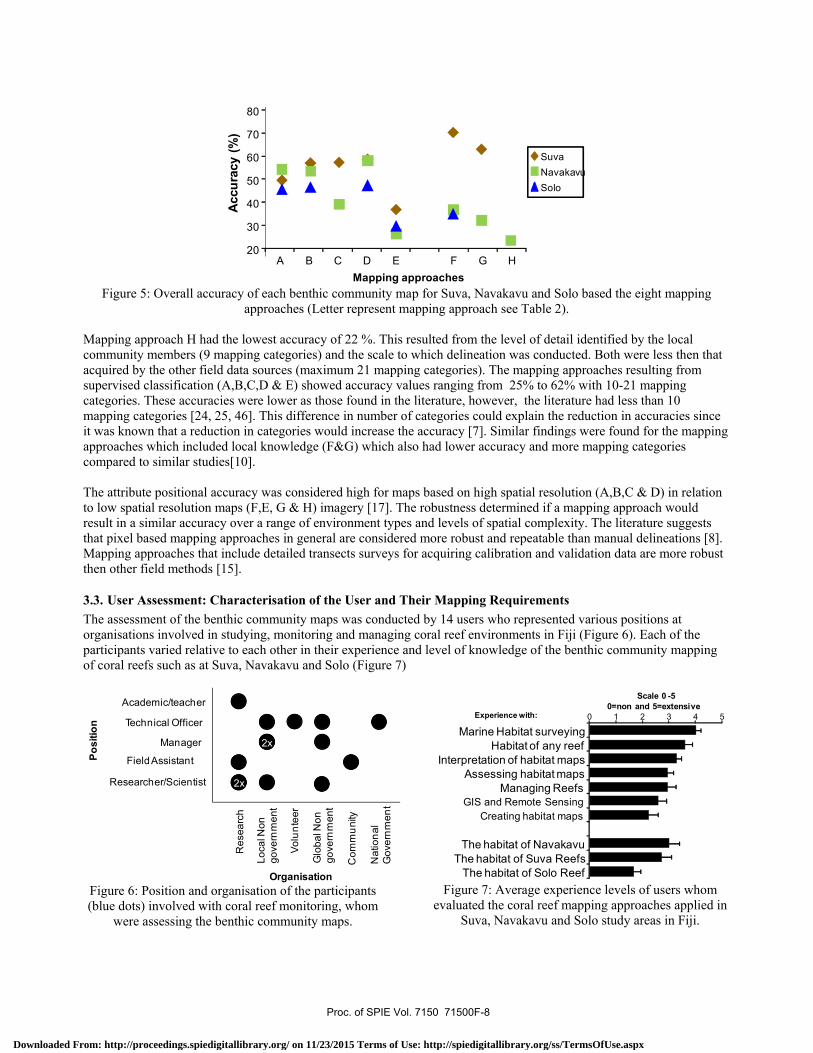
3.3. User Assessment: Characterisation of the User and Their Mapping Requirements The assessment of the benthic community maps was conducted by 14 users who represented various positions at organisations involved in studying, monitoring and managing coral reef environments in Fiji (Figure 6). Each of the participants varied relative to each other in their experience and level of knowledge of the benthic community mapping of coral reefs such as at Suva, Navakavu and Solo (Figure 7)
Posi
tion
Res
earc
h
Loca
l Non
go
vern
men
t
Glo
bal N
on
gove
rnm
ent
Volu
ntee
r
Com
mun
ity
Nat
iona
l G
over
nmen
t
Academic/teacher
Technical Officer
Manager
Field Assistant
Researcher/Scientist
Organisation
2x
2x
Figure 6: Position and organisation of the participants (blue dots) involved with coral reef monitoring, whom
were assessing the benthic community maps.
0 1 2 3 4 5
Marine Habitat surveyingHabitat of any reef
Interpretation of habitat mapsAssessing habitat maps
Managing ReefsGIS and Remote Sensing
Creating habitat maps
The habitat of Navakavu The habitat of Suva Reefs
The habitat of Solo Reef
Scale 0 -5 0=non and 5=extensive
Experience with:
Figure 7: Average experience levels of users whom
evaluated the coral reef mapping approaches applied in Suva, Navakavu and Solo study areas in Fiji.
Proc. of SPIE Vol. 7150 71500F-8
Downloaded From: http://proceedings.spiedigitallibrary.org/ on 11/23/2015 Terms of Use: http://spiedigitallibrary.org/ss/TermsOfUse.aspx

Although it would be ideal that more users would have participated in the assessment, it would take too much time within the scope of this study. However, with the participants wide spread of backgrounds (Figure 6) and their experience and/or knowledge (Figure 7) it was assumed they represented a user group of coral reef maps sufficiently. The main purpose that the user group required coral reef maps for was establishing a baseline inventory of the marine resources (Figure 8). Maps for monitoring marine resources over time were rated as the next most important purpose; while maps for determining field sites for scientific research program was the least important.
5 7 9 11 13 15
Baseline assessment of resources
Monitoring resources
Select field sites
Design monitoring program
Deciding on location Marine Protected Area
Design of scientific research program
Purpose of habitat mapNumber of times the box is ticked
Figure 8: Responses from the 14 questionnaires on what
their purpose was of coral reef maps.
4 6 8 10
Attribute AccuracyPositional Accuracy
Skills and experienceMapping unit
ValidationDetail
Stewardship by local communityEngagement with local community
Change detectionCurrent
Cost workCost start
Time
Assessment CriteriaAverage score of all users
Error bars are standard error Figure 9: Ranking of criteria for assessing a mapping
approach by the user on a scale 1-10, 1=low & 10=high. Figure 9 represented how the users perceived the relevance of various criteria that could be used to assess a mapping approach. Figure 9 showed that the most important assessment criteria identified by users were the attribute and positional accuracy of the information presented. Time and cost were considered the least important criteria for choosing a mapping approach; however, several users stated that this could be different when they need to do a real request on their own assets. This reflects a finding in the literature that a common limitation of remote sensing was perceived to be the high cost of software, hardware and remotely sensed imagery [7]. Some of the users remarked that a mapping approach involving engagement and stewardship of local community groups was preferred, since it would give them a tool for starting dialogue about managing marine resources [10, 47].
3.4. User Assessment: Qualitative Assessment by Users of Coral Reef Maps for Navakavu The visual assessment conducted by the users of the eight coral reef maps and their associated time, cost and accuracy suggested that they prefer the mapping approach based on supervised classification of basic corrected Quickbird 2 imagery integrated with basic field data (B). The user perceived that maps, showing the highest detail, provided the best actual representation of the study area (Figure 10 stage 1). However, these same maps provided, according to the users, more information than necessary to answer the research purpose (Figure 10 stage 2). Figure 10 showed that maps based on mapping approaches A and B were rated similar to each other for all four stages. This suggested that the user did not perceive that differences were obvious as a result of full correction (A) versus basic correction (B) and would therefore question the need for corrections. Figure 10 also shows that both maps A and B were rated relatively higher when comparing them with the other maps for how well they represent the actual study area (stage 1) and provided sufficient information for the research purpose (stage 2). The users had rated most maps evenly when provided with associated cost and time to create maps (Figure 10 stage 3 map A, B, C, D, F & G). This suggested that the advantages, such as the detail shown in the map, were over shadowed by higher cost and time needed to create the maps. However, when associated map accuracies were provided as well (stage 4) the evaluator favoured the maps which provided more detail (A, B & D) which suggest that these maps were considered more cost effective for Navakavu. The analysis of stage 4 showed that the highest rating was given to maps based on supervised classification of basic corrected Quickbird 2 imagery integrated with basic field data (Figure 10 map D).
Proc. of SPIE Vol. 7150 71500F-9
Downloaded From: http://proceedings.spiedigitallibrary.org/ on 11/23/2015 Terms of Use: http://spiedigitallibrary.org/ss/TermsOfUse.aspx

4.0
5.0
6.0
7.0
8.0
9.0
Perc
eive
d ra
ting
from
1-
10,1
= lo
w &
10=
high Stages for map evaluation:
Stage 1: How much was the map representing the actual reef
Stage 2: How much was the map providing sufficient information for map purpose
Stage 3: like stage 2 but user was provided with map cost and time to create it.
Stage 4: like stage 3 but user was provided with map accuracies.
Map A B C D E F G H
Cost (FJD) 6020 5970 3375 4285 3720 3495 825 1175
Time(Days) 20 18.5 6.5 9.5 18 19 7 5.5
Accuracy(%) 57 56 40 61 25 37 32 22 Figure 10: Example of user assessments for the Navakavu benthic community maps with their associated cost, time and
accuracy (Letter represent mapping approach see Table 2). The user assessment of the reef mapping approaches (Figure 10) showed that qualitative assessment of the eight maps and the associated cost, time and accuracy play an important role when users would select an approach. In reality however the user would need to make his choice for a mapping approach, before a map was created. The choice would be based on examples of available maps created for other areas and on estimates of mapping approach cost, time and accuracy for their study area. This indicated the importance that studies like these [20, 28] are published so researchers, scientist and managers can learn from these findings and use them to make appropriate choice in mapping approach.
3.5. Scientific and User Assessment of Mapping Approaches
It was concluded that the user would have for each coral reef environment a different preference for which mapping approach to apply. This was based on the results for Suva, Solo and Navakavu, where the scientific assessment (time, cost and accuracy) was combined with the perceived rating given to a mapping approach in the user assessment (Figure 11).
Label letter represents mapping approachSuva SoloNavakavu
Short time or Low cost or accuracy
vslow rating
Long time or high cost
or Low accuracyvs
low rating
Timeo
r cos
t or a
ccur
acy Long time
or High cost or Low Accuracy
vshigh rating
Short time or Low cost
or high accuracyvs
high rating
a.
AB
C
D
E F
G
A
B
C
D
EF
GH
B
D
EF
0
5
10
15
20
25
Time(
days
) A
User rating of 1– 10 (1=low, 10=high)2 4 6 8b.
AB
C
DE F
G
AB
C
DE F
GH
AB
D
EF
$0
$2,000
$4,000
$6,000
Cost(
FJD)
c.
20
40
60
80
100
Over
all A
ccur
acy (
%)
0
ABC
D
E
F
G
AB
C
D
E
F
G
H
ABD
EF
User rating of 1– 10 (1=low, 10=high)2 4 6 8d.
User rating of 1– 10 (1=low, 10=high)2 4 6 8
User rating of 1– 10 (1=low, 10=high)2 4 6 8
Figure 11: Summary of scientific (cost, time and accuracy) and user perception of mapping approaches for Suva,
Navakavu or Solo reef (Letter represent mapping approach see Table 2).
Proc. of SPIE Vol. 7150 71500F-10
Downloaded From: http://proceedings.spiedigitallibrary.org/ on 11/23/2015 Terms of Use: http://spiedigitallibrary.org/ss/TermsOfUse.aspx
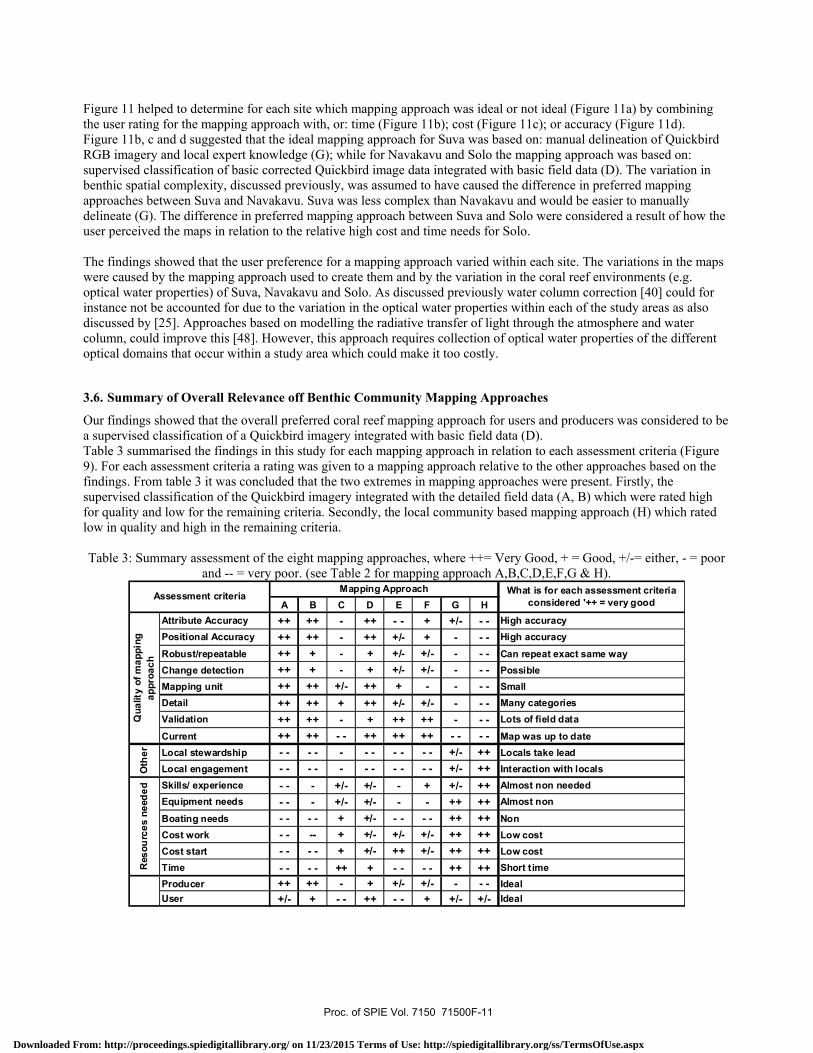
Figure 11 helped to determine for each site which mapping approach was ideal or not ideal (Figure 11a) by combining the user rating for the mapping approach with, or: time (Figure 11b); cost (Figure 11c); or accuracy (Figure 11d). Figure 11b, c and d suggested that the ideal mapping approach for Suva was based on: manual delineation of Quickbird RGB imagery and local expert knowledge (G); while for Navakavu and Solo the mapping approach was based on: supervised classification of basic corrected Quickbird image data integrated with basic field data (D). The variation in benthic spatial complexity, discussed previously, was assumed to have caused the difference in preferred mapping approaches between Suva and Navakavu. Suva was less complex than Navakavu and would be easier to manually delineate (G). The difference in preferred mapping approach between Suva and Solo were considered a result of how the user perceived the maps in relation to the relative high cost and time needs for Solo. The findings showed that the user preference for a mapping approach varied within each site. The variations in the maps were caused by the mapping approach used to create them and by the variation in the coral reef environments (e.g. optical water properties) of Suva, Navakavu and Solo. As discussed previously water column correction [40] could for instance not be accounted for due to the variation in the optical water properties within each of the study areas as also discussed by [25]. Approaches based on modelling the radiative transfer of light through the atmosphere and water column, could improve this [48]. However, this approach requires collection of optical water properties of the different optical domains that occur within a study area which could make it too costly.
3.6. Summary of Overall Relevance off Benthic Community Mapping Approaches
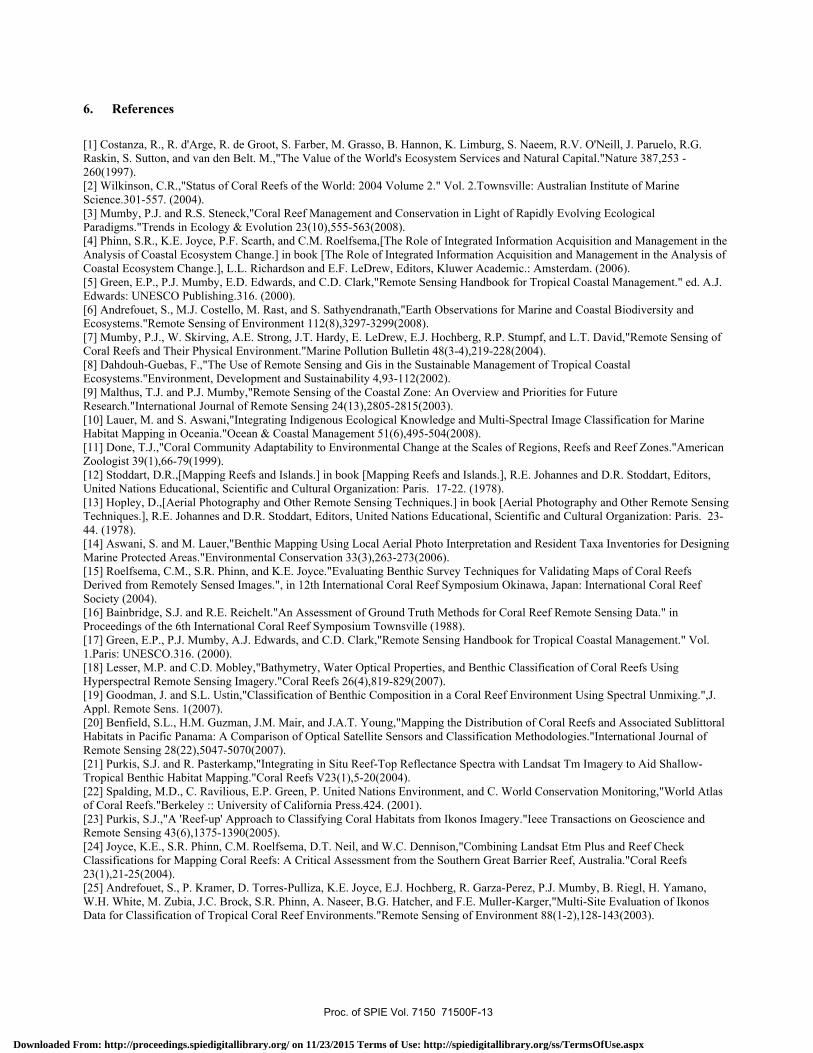
Our findings showed that the overall preferred coral reef mapping approach for users and producers was considered to be a supervised classification of a Quickbird imagery integrated with basic field data (D). Table 3 summarised the findings in this study for each mapping approach in relation to each assessment criteria (Figure 9). For each assessment criteria a rating was given to a mapping approach relative to the other approaches based on the findings. From table 3 it was concluded that the two extremes in mapping approaches were present. Firstly, the supervised classification of the Quickbird imagery integrated with the detailed field data (A, B) which were rated high for quality and low for the remaining criteria. Secondly, the local community based mapping approach (H) which rated low in quality and high in the remaining criteria. Table 3: Summary assessment of the eight mapping approaches, where ++= Very Good, + = Good, +/-= either, - = poor
and -- = very poor. (see Table 2 for mapping approach A,B,C,D,E,F,G & H).
A B C D E F G HAttribute Accuracy ++ ++ - ++ - - + +/- - - High accuracyPositional Accuracy ++ ++ - ++ +/- + - - - High accuracy
Robust/repeatable ++ + - + +/- +/- - - - Can repeat exact same wayChange detection ++ + - + +/- +/- - - - PossibleMapping unit ++ ++ +/- ++ + - - - - SmallDetail ++ ++ + ++ +/- +/- - - - Many categoriesValidation ++ ++ - + ++ ++ - - - Lots of field data
Current ++ ++ - - ++ ++ ++ - - - - Map was up to dateLocal stewardship - - - - - - - - - - - +/- ++ Locals take leadLocal engagement - - - - - - - - - - - +/- ++ Interaction with localsSkills/ experience - - - +/- +/- - + +/- ++ Almost non neededEquipment needs - - - +/- +/- - - ++ ++ Almost non
Boating needs - - - - + +/- - - - - ++ ++ NonCost work - - -- + +/- +/- +/- ++ ++ Low costCost start - - - - + +/- ++ +/- ++ ++ Low costTime - - - - ++ + - - - - ++ ++ Short timeProducer ++ ++ - + +/- +/- - - - IdealUser +/- + - - ++ - - + +/- +/- Ideal
What is for each assessment criteria considered '++ = very good
Qua
lity
of m
appi
ng
appr
oach
Oth
erR
esou
rces
nee
ded
Mapping ApproachAssessment criteria
Proc. of SPIE Vol. 7150 71500F-11
Downloaded From: http://proceedings.spiedigitallibrary.org/ on 11/23/2015 Terms of Use: http://spiedigitallibrary.org/ss/TermsOfUse.aspx

A rating from a user and producer perspective was added to Table 3 to summarise the findings from their view point in table 3. The user ratings in table 3 were based on the user assessment represented in Figure 10. The producer ratings were based on the assumptions that a producer had a preference for a mapping approach which resulted in high quality and with less emphasis on the remaining criteria. As a result the overall preferred mapping approach for the producer was supervised classification of Quickbird 2 imagery integrated with detailed field data (A & B); and for the user this was the supervised classification of Quickbird 2 imagery integrated with basic field data (D). This last approach was also the second most preferred mapping approach for the producers.
4. Conclusions
Our findings suggest that the benthic community map users and producers preferred mapping approach was: a supervised classification of Quickbird imagery with basic field data. This approached resulted in accurate maps produced within a short time frame and at reasonable cost and was still relevant for their mapping purpose. The study assessed mapping approaches that varied in terms of field data sources, image data type, image processing level, and mapping method. Similar studies focused only on a single component such as correction approaches [23], mapping methods [20], image types [49], or coral reef environments [25]. In these comparisons, the assessments included accuracy, and cost analysis [50], but none had the map user assess the relevance focussed on the user relevance. This paper discusses various options for coral reef mapping approaches in relation to reef type, its location and the user needs. Mapping approaches based on supervised classification of high spatial resolution imagery would be suitable for reefs that are characterised by high spatial complexity of benthic habitats. Whereas for relatively less complex reefs, mapping approaches based on manual delineation are sufficient. For remote coral reefs it is worthwhile to gather a detailed field data set which can be reassessed over time and integrated with image data [15]. This study and others [25] also highlighted the fact that not all coral reef environments are suitable for pixel based pre-processing (e.g. masking) or corrections (e.g, for water depth) due to variation in optical water properties within study area. These factors highlight the challenges facing users and producers of coral reef maps and demonstrate that several mapping approaches should be considered [30]. Future study should focus on applying these corrections to segments of the study site where the segments represent areas with even optical water properties. The users rational for selecting a benthic community mapping approach, depends on the purpose of the map and the resources available to create a map. If the resources are available the most robust and accurate approach should be chosen, since one can always reduce the detail if required. This same type of approach is required when mapping: several different areas for comparison or multi date mapping of the same site [24, 25]. Of the eight mapping approaches discussed in this paper the most robust and accurate approach is considered to be based on supervised classification of fully corrected Quickbird image data integrated with detailed field data. This study provides coral reef map users and producers with the opportunity to assess the cost and time needed to create a reef benthic community map. Users and producers of coral reef maps need information explaining advantages, disadvantages, resource requirements and costs, to decide on how best to set up a mapping program for their reef(s) and application(s). That type of information is provided through ours and similar studies [20, 28] and needs to be communicated to the producers and users through these type of publication. These publication and or capacity building which will strengthen their understanding of the advantages and disadvantages of coral reef mapping approaches [6, 51].
5. Acknowledgements
This work was funded through ARC Discovery Project – Innovative Coral Reef Mapping, University of Queensland, University of South Pacific, World Bank GEF Coral Reef Target Research – Remote Sensing working group, South Pacific Applied Geoscience Committee, Coral Cay Conservation, and Coral Reef Initiative for the Pacific. Bill Aalbersberg, James Comley and Leon Zann for their support and assistance. The fourteen participants of the map user assessment. Assitance from D. Kleine and the people Navakavu and Dravuni Qoliqoli and. K. Johansen for review.
Proc. of SPIE Vol. 7150 71500F-12
Downloaded From: http://proceedings.spiedigitallibrary.org/ on 11/23/2015 Terms of Use: http://spiedigitallibrary.org/ss/TermsOfUse.aspx
6. References [1] Costanza, R., R. d'Arge, R. de Groot, S. Farber, M. Grasso, B. Hannon, K. Limburg, S. Naeem, R.V. O'Neill, J. Paruelo, R.G. Raskin, S. Sutton, and van den Belt. M.,"The Value of the World's Ecosystem Services and Natural Capital."Nature 387,253 - 260(1997). [2] Wilkinson, C.R.,"Status of Coral Reefs of the World: 2004 Volume 2." Vol. 2.Townsville: Australian Institute of Marine Science.301-557. (2004). [3] Mumby, P.J. and R.S. Steneck,"Coral Reef Management and Conservation in Light of Rapidly Evolving Ecological Paradigms."Trends in Ecology & Evolution 23(10),555-563(2008). [4] Phinn, S.R., K.E. Joyce, P.F. Scarth, and C.M. Roelfsema,[The Role of Integrated Information Acquisition and Management in the Analysis of Coastal Ecosystem Change.] in book [The Role of Integrated Information Acquisition and Management in the Analysis of Coastal Ecosystem Change.], L.L. Richardson and E.F. LeDrew, Editors, Kluwer Academic.: Amsterdam. (2006). [5] Green, E.P., P.J. Mumby, E.D. Edwards, and C.D. Clark,"Remote Sensing Handbook for Tropical Coastal Management." ed. A.J. Edwards: UNESCO Publishing.316. (2000). [6] Andrefouet, S., M.J. Costello, M. Rast, and S. Sathyendranath,"Earth Observations for Marine and Coastal Biodiversity and Ecosystems."Remote Sensing of Environment 112(8),3297-3299(2008). [7] Mumby, P.J., W. Skirving, A.E. Strong, J.T. Hardy, E. LeDrew, E.J. Hochberg, R.P. Stumpf, and L.T. David,"Remote Sensing of Coral Reefs and Their Physical Environment."Marine Pollution Bulletin 48(3-4),219-228(2004). [8] Dahdouh-Guebas, F.,"The Use of Remote Sensing and Gis in the Sustainable Management of Tropical Coastal Ecosystems."Environment, Development and Sustainability 4,93-112(2002). [9] Malthus, T.J. and P.J. Mumby,"Remote Sensing of the Coastal Zone: An Overview and Priorities for Future Research."International Journal of Remote Sensing 24(13),2805-2815(2003). [10] Lauer, M. and S. Aswani,"Integrating Indigenous Ecological Knowledge and Multi-Spectral Image Classification for Marine Habitat Mapping in Oceania."Ocean & Coastal Management 51(6),495-504(2008). [11] Done, T.J.,"Coral Community Adaptability to Environmental Change at the Scales of Regions, Reefs and Reef Zones."American Zoologist 39(1),66-79(1999). [12] Stoddart, D.R.,[Mapping Reefs and Islands.] in book [Mapping Reefs and Islands.], R.E. Johannes and D.R. Stoddart, Editors, United Nations Educational, Scientific and Cultural Organization: Paris. 17-22. (1978). [13] Hopley, D.,[Aerial Photography and Other Remote Sensing Techniques.] in book [Aerial Photography and Other Remote Sensing Techniques.], R.E. Johannes and D.R. Stoddart, Editors, United Nations Educational, Scientific and Cultural Organization: Paris. 23-44. (1978). [14] Aswani, S. and M. Lauer,"Benthic Mapping Using Local Aerial Photo Interpretation and Resident Taxa Inventories for Designing Marine Protected Areas."Environmental Conservation 33(3),263-273(2006). [15] Roelfsema, C.M., S.R. Phinn, and K.E. Joyce."Evaluating Benthic Survey Techniques for Validating Maps of Coral Reefs Derived from Remotely Sensed Images.", in 12th International Coral Reef Symposium Okinawa, Japan: International Coral Reef Society (2004). [16] Bainbridge, S.J. and R.E. Reichelt."An Assessment of Ground Truth Methods for Coral Reef Remote Sensing Data." in Proceedings of the 6th International Coral Reef Symposium Townsville (1988). [17] Green, E.P., P.J. Mumby, A.J. Edwards, and C.D. Clark,"Remote Sensing Handbook for Tropical Coastal Management." Vol. 1.Paris: UNESCO.316. (2000). [18] Lesser, M.P. and C.D. Mobley,"Bathymetry, Water Optical Properties, and Benthic Classification of Coral Reefs Using Hyperspectral Remote Sensing Imagery."Coral Reefs 26(4),819-829(2007). [19] Goodman, J. and S.L. Ustin,"Classification of Benthic Composition in a Coral Reef Environment Using Spectral Unmixing.",J. Appl. Remote Sens. 1(2007). [20] Benfield, S.L., H.M. Guzman, J.M. Mair, and J.A.T. Young,"Mapping the Distribution of Coral Reefs and Associated Sublittoral Habitats in Pacific Panama: A Comparison of Optical Satellite Sensors and Classification Methodologies."International Journal of Remote Sensing 28(22),5047-5070(2007). [21] Purkis, S.J. and R. Pasterkamp,"Integrating in Situ Reef-Top Reflectance Spectra with Landsat Tm Imagery to Aid Shallow-Tropical Benthic Habitat Mapping."Coral Reefs V23(1),5-20(2004). [22] Spalding, M.D., C. Ravilious, E.P. Green, P. United Nations Environment, and C. World Conservation Monitoring,"World Atlas of Coral Reefs."Berkeley :: University of California Press.424. (2001). [23] Purkis, S.J.,"A 'Reef-up' Approach to Classifying Coral Habitats from Ikonos Imagery."Ieee Transactions on Geoscience and Remote Sensing 43(6),1375-1390(2005). [24] Joyce, K.E., S.R. Phinn, C.M. Roelfsema, D.T. Neil, and W.C. Dennison,"Combining Landsat Etm Plus and Reef Check Classifications for Mapping Coral Reefs: A Critical Assessment from the Southern Great Barrier Reef, Australia."Coral Reefs 23(1),21-25(2004). [25] Andrefouet, S., P. Kramer, D. Torres-Pulliza, K.E. Joyce, E.J. Hochberg, R. Garza-Perez, P.J. Mumby, B. Riegl, H. Yamano, W.H. White, M. Zubia, J.C. Brock, S.R. Phinn, A. Naseer, B.G. Hatcher, and F.E. Muller-Karger,"Multi-Site Evaluation of Ikonos Data for Classification of Tropical Coral Reef Environments."Remote Sensing of Environment 88(1-2),128-143(2003).
Proc. of SPIE Vol. 7150 71500F-13
Downloaded From: http://proceedings.spiedigitallibrary.org/ on 11/23/2015 Terms of Use: http://spiedigitallibrary.org/ss/TermsOfUse.aspx

[26] Naseer, A. and B.G. Hatcher,"Inventory of the Maldives' Coral Reefs Using Morphometrics Generated from Landsat Etm+ Imagery."Coral Reefs 23(1),161-168(2004). [27] Hochberg, E.J., M.J. Atkinson, and S. Andrefouet,"Spectral Reflectance of Coral Reef Bottom-Types Worldwide and Implications for Coral Reef Remote Sensing."Remote Sensing of Environment 85(2),159-173(2003). [28] Mumby, P.J., E.P. Green, A.J. Edwards, and C.D. Clark,"The Cost-Effectiveness of Remote Sensing for Tropical Coastal Resources Assessment and Management."Journal of Environmental Management 55(3),157-166(1999). [29] Prada, M.C., R.S. Appeldoorn, and J.A. Rivera,"Improving Coral Reef Habitat Mapping of the Puerto Rico Insular Shelf Using Side Scan Sonar."Marine Geodesy 31(1),49-73(2008). [30] Andrefouet, S.,"Coral Reef Habitat Mapping Using Remote Sensing: A User Vs Producer Perspective. Implications for Research, Management and Capacity Building."Journal of Spatial Science 53(1),113-129(2008). [31] Zann, L., J. Brodie, and V. Vuki,"History and Dynamics of the Crown-of-Thorns Starfish Acanthaster Planci (L.) in the Suva Area, Fiji."Coral Reefs 9(3),135-144(1990). [32] Morrison, R.J. and M.R. Naqasima,"Fiji's Great Astrolabe Lagoon: Baseline Study and Management Issues for a Pristine Marine Environment."Ocean & Coastal Management 42(6-7),617-636(1999). [33] Gustafson, E.J.,"Quantifying Landscape Spatial Pattern: What Is the State of the Art?",Ecosystems 1(2),143-156(1998). [34] Kohler, K.E. and S.M. Gill,"Coral Point Count with Excel Extensions (Cpce): A Visual Basic Program for the Determination of Coral and Substrate Coverage Using Random Point Count Methodology.",Computers and Geosciences 32(9),1259-1269(2006). [35] Mumby, P.J. and A.R. Harborne,"Development of a Systematic Classification Scheme of Marine Habitats to Facilitate Regional Management and Mapping of Caribbean Coral Reefs."Biological Conservation 88(2),155-163(1999). [36] Bryan, S.E., A. Cook, J.P. Evans, P.W. Colls, M.G. Wells, M.G. Lawrence, J.S. Jell, A. Greig, and R. Leslie,"Pumice Rafting and Faunal Dispersion During 2001-2002 in the Southwest Pacific: Record of a Dacitic Submarine Explosive Eruption from Tonga."Earth and Planetary Science Letters 227(1-2),135-154(2004). [37] Jensen, J.R.,"Introductory Digital Image Processing: A Remote Sensing Perspective. Third Edition." 3 ed: Prentice Hall; Series in Geographic Information Science.316. (2005). [38] Andréfouët, S., F. Muller-Karger, E.J. Hochberg, C. Hu, and K.L. Carder,"Change Detection in Shallow Coral Reef Environments Using Landsat 7 Etm+ Data."Remote Sensing of Environment 79,150 - 162(2001). [39] Kirk, J.T.O.,"Light and Photosynthesis in Aquatic Ecosystems."Cambridge: Cambridge University Press.500. (1994). [40] Lyzenga, D.R.,"Passive Remote Sensing Techniques for Mapping Water Depth and Bottom Features."Applied Optics 17(3),379-383(1978). [41] Andréfouët, S. and H.M. Guzman,"Ccoral Reef Distribution, Status and Geomorphology–Biodiversity Relationship in Kuna Yala (San Blas) Archipelago, Caribbean Panama."Coral Reefs V24(1),31-42(2005). [42] Storey, J.C."Landsat 7 on-Orbit Modulation Transfer Function Estimation." in Proceedings of SPIE Sensors, Systems, and Next-Generation Satellites V Toulouse, France (2001). [43] Stehman, S.V. and R.L. Czaplewski,"Design and Analysis for Thematic Map Accuracy Assessment: Fundamental Principles."Remote Sensing of Environment 64,331-344(1998). [44] Congalton, R. and K. Green,"Assessing the Accuracy of Remotely Sensed Data: Principles and Practices."Boca Rotan FL: Lewis Publishers.137. (1999). [45] Neukermans, G., F. Dahdouh-Guebas, J.G. Kairo, and N. Koedam,"Mangrove Species and Stand Mapping in Gazi Bay (Kenya) Using Quickbird Satellite Imagery."Journal of Spatial Science 53(1),75-86(2008). [46] Green, E.P., C.D. Clark, P.J. Mumby, A.J. Edwards, and A.C. Ellis,"Remote Sensing Techniques for Mangrove Mapping."International Journal of Remote Sensing 19(5),935-956(1998). [47] Longstaff, B.J., T.J.B. Carruthers, W.C. Dennison, T. Lookingbill, J.E. Hawkey, J.e. THomas, E.C. Wicks, and W. J.,"Integrating and Applying Science: A Handbook for Effective Coastal Ecosystem Assessment.".Cambridge USA: IAN Press. (In Press). [48] Phinn, S.R., A.G. Dekker, V.E. Brando, and C.M. Roelfsema,"Mapping Water Quality and Substrate Cover in Optically Complex Coastal and Reef Waters: An Integrated Approach.",Marine Pollution Bulletin 51,459-469(2005). [49] Mumby, P.J. and A.J. Edwards,"Mapping Marine Environments with Ikonos Imagery: Enhanced Spatial Resolution Can Deliver Greater Thematic Accuracy."Remote Sensing of Environment 82(2-3),248-257(2002). [50] Mumby, P.J., E.P. Green, A.J. Edwards, and C.D. Clark,[Cost-Effectiveness of Remote Sensing for Coastal Management.] in book [Cost-Effectiveness of Remote Sensing for Coastal Management.], A.J. Edwards, Editor, UNESCO: Paris. 316. (2000). [51] Dahdouh-Guebas, F., A. Verheyden, J.G. Kairo, L.P. Jayatissa, and N. Koedam,"Capacity Building in Tropical Coastal Resource Monitoring in Developing Countries: A Re-Appreciation of the Oldest Remote Sensing Method."International Journal of Sustainable Development and World Ecology 13(1),62-76(2006).
Proc. of SPIE Vol. 7150 71500F-14
Downloaded From: http://proceedings.spiedigitallibrary.org/ on 11/23/2015 Terms of Use: http://spiedigitallibrary.org/ss/TermsOfUse.aspx