Embed Size (px)
Citation preview

Europe‘s Population Change in a Global Context
Wolfgang Lutz
• Increasing political concern• The continuing demographic transition• Low fertility in Europe• Global demographic trends• Education and human capital• Toward balanced demographic trends

Political Concern
• “After the end of the cold war population ageing will be the greatest challenge for Europe. But since these fundamental demographic changes comes so slowly we are only starting to pay attention to them“
Helmut Kohl around 1994 (at a meeting of EU heads of
state and government)

European Banking Federation 2004
• The chief economists of European banks and banking federations urge EU member states to face up to the challenge of ageing, which will affect all areas of public policy.
• Governments’ main efforts should be concentrated on tackling three problem areas in particular.
• 1) Increasing the birth rate is particularly important since in many EU countries births have been below replacement level for some years and are expected to stay below replacement level in the foreseeable future.
• 2) Switching to partially capital-funded pension systems, eventually considerably decreasing the pay-as-you-go share of the fi nal pension of the retired individual.
• 3) Limiting early retirement possibilities for existing employees and eliminating the additional incentives for early retirement. Even more, timely retirement should be encouraged, at least for the time being. A gradual and moderate increase of the retirement age should also be considered as an option.

Commission of the European Communities 2005, Green Paper
Importance of demographic challenge for the Lisbon Strategy
“Europeans would like to have more children. But they are discouraged from doing so by all kinds of problems that limit their freedom of choice … It is also the case that families — the structure of which varies but which still constitute an essential part of European society — do not find the environment in which they live conducive to child-rearing”.
If Europe is to reverse this demographic decline, families must be further encouraged by public policies that allow women and men to reconcile family life and work.”

European Union, Support ratio
1.00
1.50
2.00
2.50
3.00
3.50
4.00
4.50
2000
2005
2010
2015
2020
2025
2030
2035
2040
2045
2050
Year
Su
pp
ort
rat
io
0.8
0.40.2
0.025
0.975
Median0.6
Fractiles
Sergei's DELL PIII, file: C:\Sergei\Share\EU\[presentation02.xls],21-May-02 13:56
EU-15, Uncertainty Distribution of Support Ratio (2000-2050)

The big picture: Demographic Transition
• Demographic Transition: After initial mortality decline fertility falls with some time lag.
• This paradigm explains much of the demographic trends over the 20th century.
• Original assumption: fertility decline will stop at replacement level.
• But reality has been different.• Today half of world population is below
replacement level

0
10
20
30
40
50
60
70
1875 1885 1895 1905 1915 1925 1935 1945 1955 1965 1975 1985 1995
Cru
de b
irth
and
dea
th r
ates
(pe
r 1,
000)
CBR
CDR
Year
BIRTH AND DEATH RATES IN MAURITIUS since 1871
Source: Mauritius Central Statistical Office.

Empirical Fertility Trends in Europe
• In most countries of Europe there was a “baby boom” in the 1960s.
• This “boom” was particularly strong in Western Europe.
• It was followed by a steep fertility decline during the 1970s.
• Europe was the first continent to fall below replacement level.

Figure 1. Western Europe, Total Fertility Rate, 1960-2001
Germany
Netherlands
FranceBelgium
Austria
Luxembourg
1.0
1.5
2.0
2.5
3.0
3.5
19
60
19
62
19
64
19
66
19
68
19
70
19
72
19
74
19
76
19
78
19
80
19
82
19
84
19
86
19
88
19
90
19
92
19
94
19
96
19
98
20
00
Year
To
tal F
ert
ility
Ra
te

Figure 2. Southern Europe, Total Fertility Rate, 1960-2001
Greece Slovenia
Portugal
Italy
Spain
1.0
1.5
2.0
2.5
3.0
3.5
19
60
19
62
19
64
19
66
19
68
19
70
19
72
19
74
19
76
19
78
19
80
19
82
19
84
19
86
19
88
19
90
19
92
19
94
19
96
19
98
20
00
Year
To
tal
Fe
rtil
ity
Ra
te

Figure 3. Northern Europe, Total Fertility Rate, 1960-2001
Denmark
Sweden
United Kingdom Ireland
Finland
1.0
1.5
2.0
2.5
3.0
3.5
4.0
4.5
19
60
19
62
19
64
19
66
19
68
19
70
19
72
19
74
19
76
19
78
19
80
19
82
19
84
19
86
19
88
19
90
19
92
19
94
19
96
19
98
20
00
Year
To
tal F
ert
ility
Ra
te

Scatterplot of Fertility against Proportion of Births outside of Marriage, EU-25
0
10
20
30
40
50
60
1,0 1,1 1,2 1,3 1,4 1,5 1,6 1,7 1,8 1,9 2,0 2,1
Total Fertility Rate, 2001
Pro
p. o
f liv
e B
irth
s o
uts
ide
of
Mar
riag
e (%
)
EST
LAT
SLO
H
A
DP
E
I
GR
B
L
NL
S
DK
M
CY
IRL
LIT
F
UK
SR
CR
PL

Cross-country correlation between Total Fertility Rate and Female
Labour Force Participation Rate for 21 OECD countries, 1960-2000
-0.8
-0.6
-0.4
-0.2
0
0.2
0.4
0.6
0.8
1960
1965
1970
1975
1980
1985
1990
1995

Czech Republic
Estonia
HungaryLatvia
LithuniaSlovak Republic
Poland
1.0
1.5
2.0
2.5
3.0
3.5
19
60
19
62
19
64
19
66
19
68
19
70
19
72
19
74
19
76
19
78
19
80
19
82
19
84
19
86
19
88
19
90
19
92
19
94
19
96
19
98
20
00
Year
To
tal
Fe
rtil
ity
Ra
te
Figure 4. Central / Eastern Europe, Total Fertility Rate

Figure 5. Central / Eastern Europe, mean age of childbearing, 1960-2001
Czech Republic
Estonia
Hungary
Latvia
Lithunia
Slovak Republic Poland
24
25
26
27
28
29
30
19
60
19
62
19
64
19
66
19
68
19
70
19
72
19
74
19
76
19
78
19
80
19
82
19
84
19
86
19
88
19
90
19
92
19
94
19
96
19
98
20
00
Year
Me
an
Ag
e o
f C
hil
db
ea
rin
g

Birth Deficit due to the Tempo Effect
An increase in the mean age of childbearing results in a lasting loss of births, unless the childbearing age
decreases again
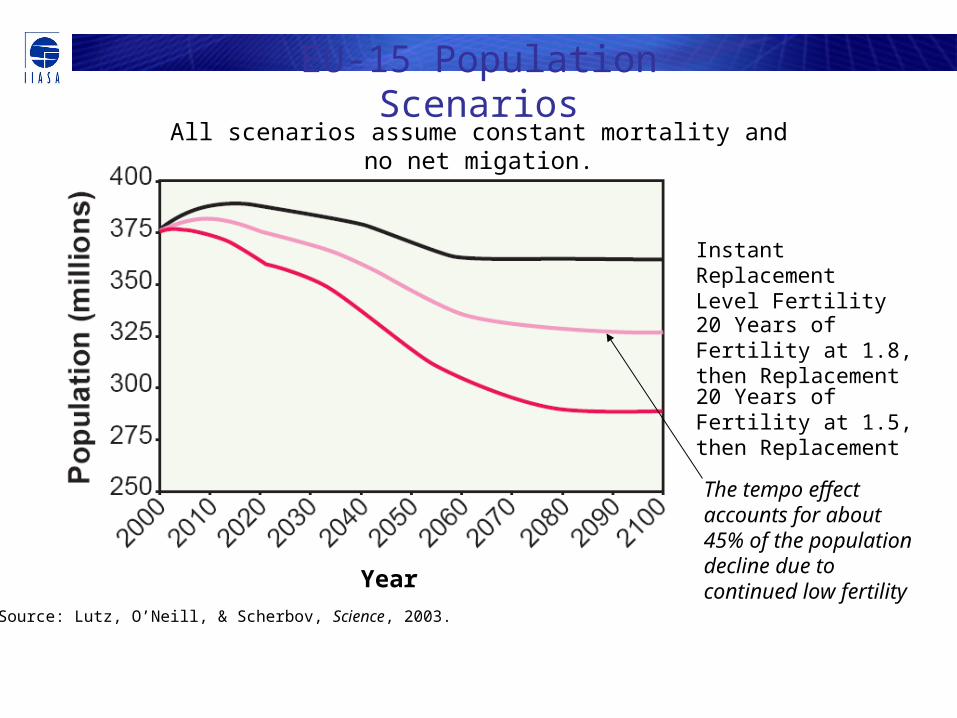
EU-15 Population Scenarios
Source: Lutz, O’Neill, & Scherbov, Science, 2003.
All scenarios assume constant mortality and no net migation.
Year
Instant Replacement Level Fertility
20 Years of Fertility at 1.8, then Replacement
20 Years of Fertility at 1.5, then Replacement
The tempo effect accounts for about 45% of the population decline due to continued low fertility

Why a policy focus on the tempo of fertility? (1)
• It is well established that in a period when the mean age of childbearing increases, the period TFR is depressed relative to what it would be without such an increase.
• So far the tempo effect has been mostly considered as an undesired disturbance that needs to be ironed out (tempo-adjusted fertility rates) in order to have a purer measure.
• The tempo effect greatly matters for the number of births born in any given year. It has a lasting effect on the age structure and size of a population.
• Tempo policies aim at influencing the tempo effect and its lasting impacts on population dynamics.

Scatterplot of Fertility against Mean Age at Childbearth, EU-25
26,5
27,0
27,5
28,0
28,5
29,0
29,5
30,0
30,5
31,0
1,0 1,1 1,2 1,3 1,4 1,5 1,6 1,7 1,8 1,9 2,0 2,1
Total Fertility Rate, 2001
Mea
n A
ge
at C
hild
bir
th, 2
001
GR
A
D
I
E
P
UKB
L
FIN DK
NLS
IRL
F
CY
MSLO
CR
LAT
SRLIT
EST
HPL

Why a policy focus on the tempo of fertility? (2)
• While choice of family size (quantum) is largely considered a private matter, where direct government interference is not welcome, a focus on the timing of births might be more favoured, particularly because there is a strong health rationale against further delays (risk of not getting pregnant, risks associated with late pregnancies).
There are essentially two ways of effecting the mean age of childbearing:
A - Change the typical sequence of life cycle phases (e.g. having children while still at university)
B - Shorten the duration of those phases that typically precede childbearing (e.g. shorten the study time to a certain degree)

What we know about demographic trends:
• We know the past trends in fertility, mortality and migration
• We know the current structure by age and sex (plus other characteristics)
• We know much about the future age structure of the population, because everybody above age 25 in 2030 has already been born (we know cohort size)

Population Pyramid for Austria, 2000
0.0 20.0 40.0 60.0 80.0
2000
1995
1990
1985
1980
1975
1970
1965
1960
1955
1950
1945
1940
1935
1930
1925
1920
1915
1910
1905
1900
1895females
0.020.040.060.080.0
0
5
10
15
20
25
30
35
40
45
50
55
60
65
70
75
80
85
90
95
100
105
Austria, 2000
Population (thousands)
males
Age Period of Birth

Probabilistic Age Pyramid for Austria 2030Yellow area gives 95 percent interval, green 60 percent and blue 20 percent
0.0 20.0 40.0 60.0 80.0
2030
2025
2020
2015
2010
2005
2000
1995
1990
1985
1980
1975
1970
1965
1960
1955
1950
1945
1940
1935
1930
1925females
0.020.040.060.080.0
0
5
10
15
20
25
30
35
40
45
50
55
60
65
70
75
80
85
90
95
100
105
Austria, 2030
Population (thousands)
males
Age Period of Birth

What we do not know:
• We do not know whether fertility will recover or continue to decline
• We do not know whether we are already close to maximum life expectancy or still far away (if there is a limit at all)
• We do not know the future political conditions that will determine migration
• We do not know well how acceptable and affordable policies can enhance level of fertility
• But we know that the plausible range of these factors is such that it cannot significantly alter the ageing trend

Uncertainty Range of Future Support Ratio in the European Union 2000-2050
European Union, Support ratio
1.00
1.50
2.00
2.50
3.00
3.50
4.00
4.50
200
0
200
5
201
0
201
5
202
0
202
5
203
0
203
5
204
0
204
5
205
0
Year
Su
pp
ort
rat
io
0.8
0.40.2
0.025
0.975
Median0.6
Fractiles
Sergei's DELL PIII, file: C:\Sergei\Share\EU\[presentation02.xls],21-May-02 13:56

How low can fertility fall?
The possible “low fertility trap” hpyothesis
• Observation that countries that fell below fertility level of 1.5 children have hardly recovered.
• Negative demographic momentum: Because of past low fertility there will be fewer potential mothers in the future.
• Economics: Gap between aspirations for consumption and expected income widens for young people due to negative consequences of ageing (cuts in social security systems, possible economic stagnation)
• Ideational change: Young people are socialized in an environment with few children – may result in lower ideal family size in next generation.

Western Europe, Uncertainty Distribution of Proportion above Age 80 (2000-2100)Western Europe, Proportion above age 80
0
0.05
0.1
0.15
0.2
0.25
0.3
0.35
0.4
0.45
0.5
2000
2005
2010
2015
2020
2025
2030
2035
2040
2045
2050
2055
2060
2065
2070
2075
2080
2085
2090
2095
2100
Year
Pro
port
ion
abov
e ag
e 80
0.8
0.4
0.2
0.025
0.975
Median
0.6
Fractiles
Sergei's DELL PIII, file: E:\Current\Run\2000\NewTechique\Simul\[pop_new21_4_del1_sing5_c1.xls],06-Jun-01 07:36
UN “low”
UN “high”

Can Migration Compensate for the Missing Births?Alternative Projections of the Old Age Dependency Ratio for the EU-15 in 2050 based on
different Fertility and Migration Assumptions (Black line gives the level in 2000)
0.0
0.1
0.2
0.3
0.4
0.5
0.6
0.7
1 1.2 1.4 1.6 1.8 2 2.2
Total fertility rate
Old
-age
dep
ende
ncy
ratio
MIG=0 MIG=400,000 MIG=800,000 MIG=1,200,000 Year 2000
z
Research Priorities and Institutional Needs
• Analysis of variation across Europe is most important source for understanding the nature and determinants of processes.
• Yet demographic studies in Europe have traditionally been conducted by national institutes with primarily national focus.
• There is an urgent need for comparative European demographic analysis that goes beyond the networking that already exists among national institutes.
• International efforts (ECE, Council of Europe, Eurostat, DG Empl, etc.) are well below critical mass.

The End of World Population Growth in the 21st Century:
New Challenges for Human Capital Formation
and Sustainable Development
A new IIASA Population Book W. Lutz, W. Sanderson and S. Scherbov (Eds.)
The End of World Population Growth in the 21st Century: New Challenges for Human Capital Formation and Sustainable Development
• The End of World Population Growth
• Applications of Probabilistic Population Forecasting
• Future Human Capital: Population Projections by Level of Education
• Literate Life Expectancy: Charting the Progress in Human Development
• Population-Environment-Development-Agriculture Interactions in Africa: A Case Study on Ethiopia
• Interactions between Education and HIV: Demographic Examples from Botswana
• China’s Future Urban and Rural Population by Level of Education
• Population, Greenhouse Gas Emissions and Climate Change
• Conceptualizing Population in Sustainable Development: From “Population Stabilization” to “Population Balance”.

World Population from the year 1000 to 2100(historical data from 1000 to 2000; deciles of IIASA’s probabilistic forecasts to 2100)
Source of historical data: UN 2001
0
2,000
4,000
6,000
8,000
10,000
12,000
14,000
1000 1200 1400 1600 1800 2000
YEAR
WO
RL
D P
OP
UL
AT
ION
(IN
MIL
LIO
NS
)

World Population Trends:The Big Picture
• While the 20th century was the century of population growth (with the world population increasing from 1.6 to 6.1 billion),
• the 21st century will be that of population aging (with the proportion above age 60 increasing from currently 0.10 to 0.25-0.45 by 2100).

Forecasting the Population by Age and Sex
• For forecasting the population we need the current population by age and sex for each region.
• We need to make assumptions on the three components of change:
• Fertility (birth rates)• Mortality (death rates, life expectancy)• Migration• The future paths of all three factors are uncertain.• Therefore we produce probabilistic population
projections.

What is wrong with the UN “Variants” Approach ?
1. High, medium and low variants only differ in fertility (mortality and migration uncertainty disregarded).
2. The high-low interval is supposed to give a “plausible range” of future outcomes without being specific (does it cover 99% or 50% of possible outcomes?)
3. It is probabilistically inconsistent when aggregating to regional and global totals (the global high variant is simply the sum of all regional high variants).
4. It assumes smooth and monotonous changes in components (i.e. no booms and busts)

Three Approaches to Probabilistic Forecasting
• Time series analysis (Lee and Tuljapurkar). Problems: assumption of no structural change, TS data often not available.
• Ex post error analysis: You assume that the errors of past projections will be replicated in the future (Keilman). Problems: mechanistic (why should we do the same errors now than others did decades ago?)
• Expert argument based uncertainty distributions: subjective probabilities (Lutz et al. 1996). Problems: How biased are experts?
• Proposed Synthesis Approach: “The end of world population growth” (Lutz et al 2001 in Nature)
• State of the Art Discussion: 2004 Special Issue of International Statistical Review: “How to deal with uncertainty in population forecasting? (Lutz and Goldstein, Guest editors).

1975 Projection 1998 Estimate
Country 1975-80 1995-00 Projected decline
1975-80 1995-00 Estimated decline
Total error
Base error
Change error
Indonesia 5.13 3.38 1.75 4.68 2.58 2.1 0.8 0.45 0.35 Malaysia 4.26 2.7 1.56 4.16 3.18 0.98 -0.48 0.1 -0.58 Philippines 5.83 3.75 2.08 4.96 3.62 1.34 0.13 0.87 -0.74 Singapore 2.47 2.1 0.37 1.87 1.68 0.19 0.42 0.6 -0.18 Thailand 5.53 3.28 2.25 4.25 1.74 2.51 1.54 1.28 0.26 Vietnam 5.84 4.39 1.45 5.59 2.6 2.99 1.79 0.25 1.54
Mean absolute error: = 0.860 = 0.592 = 0.608
1980 Projection 1998 Estimate
Country 1975-80 1995-00 Projected decline
1975-80 1995-00 Estimated decline
Total error
Base error
Change error
Indonesia 4.81 2.46 2.35 4.68 2.58 2.1 -0.12 0.13 -0.25 Malaysia 5.03 2.46 2.57 4.16 3.18 0.98 -0.72 0.87 -1.59 Philippines 4.62 2.87 1.75 4.96 3.62 1.34 -0.75 -0.34 -0.41 Singapore 1.84 1.74 0.1 1.87 1.68 0.19 0.06 -0.03 0.09 Thailand 4.27 2.51 1.76 4.25 1.74 2.51 0.77 0.02 0.75 Vietnam 5.48 2.87 2.61 5.59 2.6 2.99 0.27 -0.11 0.38
Mean absolute error: = 0.448 = 0.250 = 0.578
Errors in past UN projections for South-East Asia

Nine sample paths (out of 2,000 simulated paths) of world population size from 2000 to 2001
0
2,000
4,000
6,000
8,000
10,000
12,000
14,000
20
00
20
10
20
20
20
30
20
40
20
50
20
60
20
70
20
80
20
90
21
00
YEAR
WO
RL
D P
OP
UL
AT
ION
(IN
MIL
LIO
NS
) PATH 1
PATH 2
PATH 3
PATH 4
PATH 5
PATH 6
PATH 7
PATH 8
PATH 9

Deciles of the resulting uncertainty distribution of world population size to 21000.
0
2,000
4,000
6,000
8,000
10,000
12,000
14,000
2000
2010
2020
2030
2040
2050
2060
2070
2080
2090
2100
YEAR
WO
RL
D P
OP
UL
AT
ION
(IN
MIL
LIO
NS
)Decile 1
Decile 2
Decile 3
Decile 4
Decile 5
Decile 6
Decile 7
Decile 8
Decile 9

World Population from the year 1000 to 2100(historical data from 1000 to 2000; deciles of IIASA’s probabilistic forecasts to 2100)
Source of historical data: UN 2001
0
2,000
4,000
6,000
8,000
10,000
12,000
14,000
1000 1200 1400 1600 1800 2000
YEAR
WO
RL
D P
OP
UL
AT
ION
(IN
MIL
LIO
NS
)

Probability of End of Population Growth:Proportion peaking prior to the indicated year (out of 2,000 simulated population paths)
0.0
0.2
0.4
0.6
0.8
1.020
00
2005
2010
2015
2020
2025
2030
2035
2040
2045
2050
2055
2060
2065
2070
2075
2080
2085
2090
2095
2100
Year
Pro
babi
lity
WorldChina Region
Sub Saharan Africa
Europ. Former USSR

1st, 3rd, 5th (median), 7th, and 9th deciles of the forecasted distributions of world population size at
10-year intervals from 2000 to 2100. Note: Uncertainty measure is (9th decile-1st decile)/median.
1st Decile (10% of
cases below this number)
3rd Decile (30% of
cases below this number)
Median (50% of
cases below this number)
7th Decile (70% of
cases below this number)
9th Decile (90% of
cases below this number)
Uncertainty Measure (9th
Decile-1st Decile)/Median
2000 6.055 6.055 6.055 6.055 6.055 0.000 2010 6.612 6.743 6.828 6.915 7.038 0.062 2020 7.034 7.337 7.539 7.731 8.006 0.129 2030 7.317 7.765 8.086 8.425 8.898 0.196 2040 7.442 8.037 8.525 9.034 9.740 0.270 2050 7.347 8.157 8.797 9.492 10.447 0.352 2060 7.14 8.162 8.936 9.794 10.958 0.427 2070 6.834 8.038 8.975 9.981 11.496 0.519 2080 6.446 7.782 8.890 10.020 11.835 0.606 2090 5.998 7.478 8.682 9.964 12.105 0.703 2100 5.573 7.124 8.414 9.845 12.123 0.778

Western Europe, uncertainty distribution of the proportion above age 80.
UN “high”
Western Europe, Proportion above age 80
0
0.05
0.1
0.15
0.2
0.25
0.3
0.35
0.4
0.45
0.52
00
0
20
05
20
10
20
15
20
20
20
25
20
30
20
35
20
40
20
45
20
50
20
55
20
60
20
65
20
70
20
75
20
80
20
85
20
90
20
95
21
00
Year
Pro
po
rtio
n a
bo
ve
ag
e 8
0
0.8
0.4
0.2
0.025
0.975
Median
0.6
Fractiles
Sergei's DELL PIII, file: E:\Current\Run\2000\NewTechique\Simul\[pop_new21_4_del1_sing5_c1.xls],06-Jun-01 07:36
UN “low”
UN “high”


0.0 2.0 4.0 6.0 8.0 10.0
2050204520402035203020252020201520102005200019951990198519801975197019651960195519501945
females
0.02.04.06.08.010.0
05
101520253035404550556065707580859095
100105
Pacific Asia, 2050
Numbers (in million)
males
Age Period of Birth
Sergei's DELL PIII, file: E:\Current\Run\2000\NewTechique\Simul\[tmp_Pyr_updated_1.xls],08-Apr-02 01:40

Adding Education to Age and Sex• Formal education is typically acquired at young
ages and then does not change over the life course (goes along cohort lines, multi-state population models).
• This is why the educational composition of the total population changes only very slowly.
• Educational efforts made today will only improve the average education of the work force many years later.

0.0 50.0 100.0 150.0 200.0
2000
1995
1990
1985
1980
1975
1970
1965
1960
1955
1950
1945
1940
1935
1930
1925
1920
1915
1910
1905
1900
No education Primary Secondary Higher
females
0.050.0100.0150.0200.0
0
5
10
15
20
25
30
35
40
45
50
55
60
65
70
75
80
85
90
95
100
males
Singapore 2000
Population (thousands)
Age Period of Birth
filename:D:\IIASA2002\Sergei\Current\Run\ 2002\Educ\Final_ 031002\WithPyr\closed\ [makePyr .xls]data

Education Matters
• For individual life (Micro)• For economic development (Macro)
“Whereas at the micro case ... it is established beyond any reasonable doubt that there are tangible and measurable returns to investment in education, such evidence is not as consistent and forthcoming in the macro literature “ (Psacharopoulos and Patrinos 2002)
Findings are dependent on education indicators chosen (age-range).
• For health/mortality and fertility (cross-sectoral effects)
Indirect effects of education on institutions and good governance (control by the educated)

Fertility Rates by Level of Education
Region (1)
No Education
(2)
Primary
(3)
Secondary and higher
Difference
(1) – (3)
SS-Africa 6.4 5.5 3.7 2.7
North Africa 4.7 3.6 2.8 1.9
Asia (East +SE+South)
4.1 3.5 2.7 1.4
West Asia 6.4 4.6 3.5 2.9
Latin A.+ Caribbean
5.8 4.5 2.6 3.2

Measuring Formal Education
• Education Flows – Policy variable (Gross and Net Enrolment by Age, Repetition Rates)
• Education Stocks - Change very slowly due to great momentum– Mean years of schooling– Distribution by highest educational attainment– Functional literacy

Measuring Human Capital Stocks
• Directly from Census Data (Barro and Lee, 25+; Lutz and Goujon, 5-year age groups)
• For Forecasting:
• Perpetual Inventory Method (Nehru, Swanson and Dubey 1993, Ahuja and Filmer 1995). Sum over past school enrollment rates then superimpose it to UN population projections.
• Demogrphic Multi-state Projection Methods (Developed at IIASA in the 1970-80s by Rogers, Keyfitz and others) Full cohort component projections which consider educational attainment in addition to age and sex (can consider also fertility, mortality and migration differentials by level of education)

Principles of Population Projection by age and sex
Migration
Mortality
Migration
Fertility
Migration
Males
Population by Age and Sex Population by Age and Sex2000 2005
MalesFemales Females

Migration
Mortality
Migration
Fertility
Migration
Principles of Population Projection by age, sex, and education
Population by Age, Sex, and Education Population by Age, Sex, and Education 2000 2005

Projecting the population by level of education
• We need to know the current composition of the population by age, sex and education categories.
• We need to know how the birth rates differ for women with different levels of education.
• We need to know school enrollment at different levels and make alternative assumptions for the future education transition rates.
• We need to make assumptions about future trends in fertility, mortality and migration by level of education.

0.0 50.0 100.0 150.0 200.0
2030
2025
2020
2015
2010
2005
2000
1995
1990
1985
1980
1975
1970
1965
1960
1955
1950
1945
1940
1935
1930
No education Primary Secondary Higher
females
0.050.0100.0150.0200.0
0
5
10
15
20
25
30
35
40
45
50
55
60
65
70
75
80
85
90
95
100
males
Singapore: 2030
Population (thousands)
Age Period of Birth
filename:D:\IIASA2002\Sergei\Current\Run\ 2002\Educ\Final_ 031002\WithPyr\closed\ [makePyr .xls]data
Country Specific Scenario: TFR 1.5 in 2030, Education Constant


0.0 2.0 4.0 6.0 8.0 10.0
2050204520402035203020252020201520102005200019951990198519801975197019651960195519501945
females
0.02.04.06.08.010.0
05
101520253035404550556065707580859095
100105
Pacific Asia, 2050
Numbers (in million)
males
Age Period of Birth
Sergei's DELL PIII, file: E:\Current\Run\2000\NewTechique\Simul\[tmp_Pyr_updated_1.xls],08-Apr-02 01:40

Adding Education to Age and Sex
• Formal education is typically acquired at young ages and then does not change over the life course (goes along cohort lines, multi-state population models).
• This is why the educational composition of the total population changes only very slowly.
• Educational efforts made today will only improve the average education of the work force many years later.

0.0 50.0 100.0 150.0 200.0
2000
1995
1990
1985
1980
1975
1970
1965
1960
1955
1950
1945
1940
1935
1930
1925
1920
1915
1910
1905
1900
No education Primary Secondary Higher
females
0.050.0100.0150.0200.0
0
5
10
15
20
25
30
35
40
45
50
55
60
65
70
75
80
85
90
95
100
males
Singapore 2000
Population (thousands)
Age Period of Birth
filename:D:\IIASA2002\Sergei\Current\Run\ 2002\Educ\Final_ 031002\WithPyr\closed\ [makePyr .xls]data

Education Matters
• For individual life (Micro)• For economic development (Macro)
“Whereas at the micro case ... it is established beyond any reasonable doubt that there are tangible and measurable returns to investment in education, such evidence is not as consistent and forthcoming in the macro literature “ (Psacharopoulos and Patrinos 2002)
Findings are dependent on education indicators chosen (age-range).
• For health/mortality and fertility (cross-sectoral effects)
Indirect effects of education on institutions and good governance (control by the educated)

Fertility Rates by Level of Education
Region (1)
No Education
(2)
Primary
(3)
Secondary and higher
Difference
(1) – (3)
SS-Africa 6.4 5.5 3.7 2.7
North Africa 4.7 3.6 2.8 1.9
Asia (East +SE+South)
4.1 3.5 2.7 1.4
West Asia 6.4 4.6 3.5 2.9
Latin A.+ Caribbean
5.8 4.5 2.6 3.2

Measuring Formal Education
• Education Flows – Policy variable (Gross and Net Enrolment by Age, Repetition Rates)
• Education Stocks - Change very slowly due to great momentum– Mean years of schooling– Distribution by highest educational attainment– Functional literacy

Measuring Human Capital Stocks
• Directly from Census Data (Barro and Lee, 25+; Lutz and Goujon, 5-year age groups)
• For Forecasting:
• Perpetual Inventory Method (Nehru, Swanson and Dubey 1993, Ahuja and Filmer 1995). Sum over past school enrollment rates then superimpose it to UN population projections.
• Demogrphic Multi-state Projection Methods (Developed at IIASA in the 1970-80s by Rogers, Keyfitz and others) Full cohort component projections which consider educational attainment in addition to age and sex (can consider also fertility, mortality and migration differentials by level of education)

Principles of Population Projection by age and sex
Migration
Mortality
Migration
Fertility
Migration
Males
Population by Age and Sex Population by Age and Sex2000 2005
MalesFemales Females

Migration
Mortality
Migration
Fertility
Migration
Principles of Population Projection by age, sex, and education
Population by Age, Sex, and Education Population by Age, Sex, and Education 2000 2005

Projecting the population by level of education
• We need to know the current composition of the population by age, sex and education categories.
• We need to know how the birth rates differ for women with different levels of education.
• We need to know school enrollment at different levels and make alternative assumptions for the future education transition rates.
• We need to make assumptions about future trends in fertility, mortality and migration by level of education.

0.0 50.0 100.0 150.0 200.0
2030
2025
2020
2015
2010
2005
2000
1995
1990
1985
1980
1975
1970
1965
1960
1955
1950
1945
1940
1935
1930
No education Primary Secondary Higher
females
0.050.0100.0150.0200.0
0
5
10
15
20
25
30
35
40
45
50
55
60
65
70
75
80
85
90
95
100
males
Singapore: 2030
Population (thousands)
Age Period of Birth
filename:D:\IIASA2002\Sergei\Current\Run\ 2002\Educ\Final_ 031002\WithPyr\closed\ [makePyr .xls]data
Country Specific Scenario: TFR 1.5 in 2030, Education Constant


India 2000 China 2000 No education 3.78 2.43 Some primary education 2.89 2.14 Some secondary education 2.36 1.63 Some tertiary education 1.96 1.08
Education-specific TFR :India and China.


2030 - ICPD scenario
2000 2030 – Constant scenario
Age and education pyramids for South Asia in 2000 and 2030, according to “Constant”, "ICPD" scenario, age groups 15-64
No education
Primary
Secondary
Tertiary

Egypt 2000
Egypt 2030Constant education
scenario

Egypt 2000Egypt 2030
Strong enrolment increase scenario
0
200
400
600
800
1,000
1,200
2000 2015 2030
0
200
400
600
800
1,000
1,200
2000 2015 2030
0
200
400
600
800
1,000
1,200
2000 2015 2030
1,200
800
400
0
2000 2015 2030 2000 2015 2030 2000 2015 2030
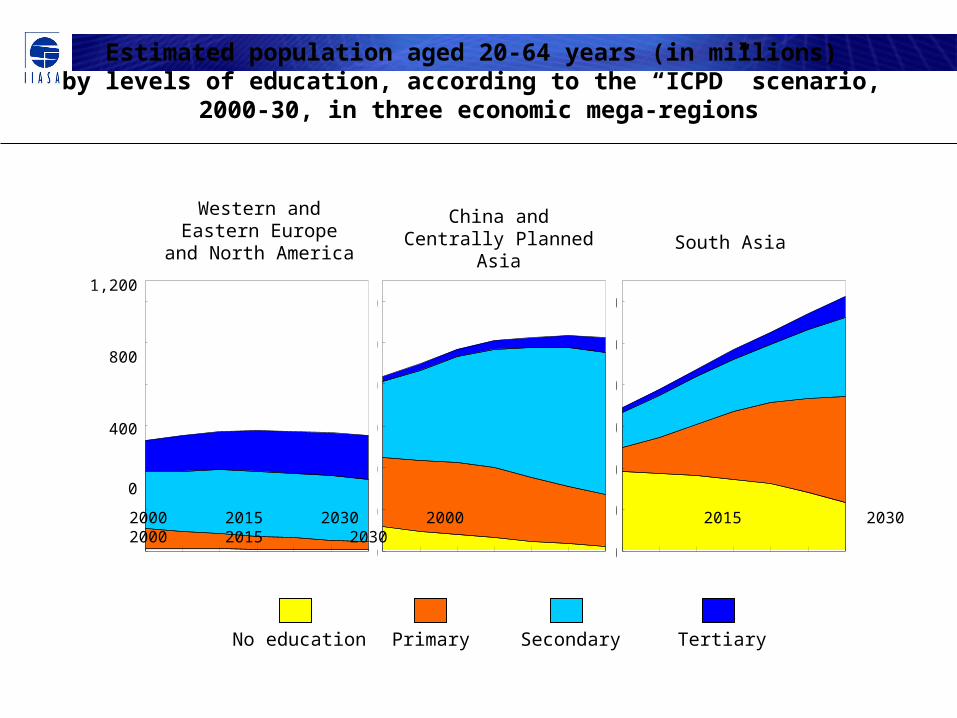
Estimated population aged 20-64 years (in millions) by levels of education, according to the “ICPD” scenario,
2000-30, in three economic mega-regions
Western and Eastern Europe and North
America
China and Centrally Planned Asia South Asia
No education Primary Secondary Tertiary

Table 1. Example of the calculation of the LLE of rural men in Egypt, 1986.
Regular life table Literate life table Age (years) mx lx Lx ex PLx LLx LTx Lex \<1 1.041 100.000 93,340 58.60 0.00 0 2,382,889 23.8 4 0.081 90.105 353,413 64.00 0.00 0 2,382,889 26.4 5--9 0.017 87.232 434,130 62.06 0.42 183,203 2,382,889 27.3 10--14 0.010 86.494 431,434 57.57 0.84 364,130 2,199,686 25.4 15--19 0.012 86.062 429,077 52.84 0.68 290,485 1,835,556 21.3 20--24 0.017 85.548 426,000 48.15 0.78 333,558 1,545,071 18.1 25--29 0.021 84.824 421,991 43.54 0.48 202,978 1,211,513 14.3 30--34 0.027 83.938 416,986 38.97 0.48 200,570 1,008,535 12.0 35--39 0.032 82.812 410,905 34.46 0.38 156,966 807,964 9.8 40--44 0.035 81.498 404,094 29.98 0.38 154,364 650,999 8.0 45--49 0.069 80.084 393,900 25.46 0.30 118,170 496,635 6.2 50--54 0.121 77.368 375,934 21.26 0.30 112,780 378,465 4.9 55--59 0.240 72.824 344,335 17.43 0.25 85,051 265,684 3.6 60--64 0.252 64.580 304,529 14.32 0.25 75,219 180,633 2.8 65--69 0.572 56.925 250,441 10.89 0.20 50,088 105,415 1.9 70--74 0.682 42.681 183,565 8.66 0.20 36,713 55,327 1.3 75+ 1.625 30.247 186,136 6.15 0.10 18,614 18,614 0.6

LLE at birth for selected countries in North Africa, 1970–2005, for males (M) and females (F)
0
10
20
30
40
50
1970-1975 1975-1980 1980-1985 1985-1990 1990-1995 1995-2000 2000-2005
Lite
rate
life
expe
ctan
cy (
year
s)
Algeria M Egypt M Morocco M Tunisia M
Algeria F Egypt F Morocco F Tunisia F

Literate life expectancy for selected countries by sex and urban and rural place of residence
Male Female
Urban Rural Urban Rural
Bangladesh 1986 27.0 15.7 14.4 6.4
Belarus 1993 60.2 56.6 68.4 65.2
Colombia 1985 53.0 53.6 57.6 53.6
Egypt 1986 35.2 23.8 25.4 9.7
Greece 1991 68.9 68.4 70.8 66.5
Mexico 1990 56.7 44.9 57.2 39.6
Romania 1994 61.8 59.1 67.7 62.2
Tajikistan 1991 56.7 60.2 62.1 60.9
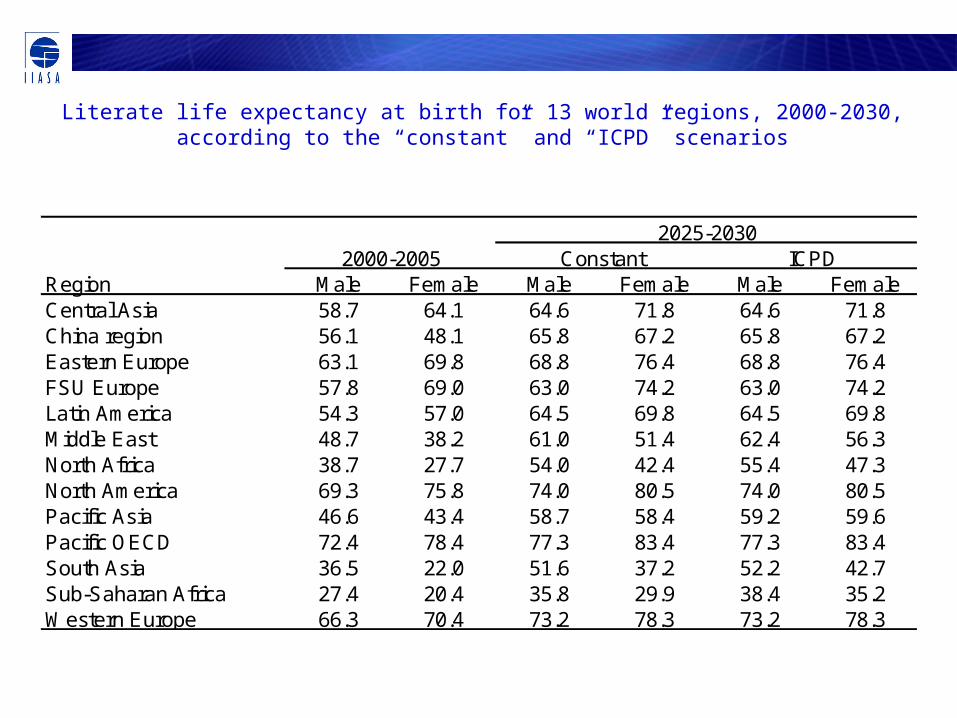
Literate life expectancy at birth for 13 world regions, 2000-2030, according to the “constant” and “ICPD” scenarios
Region Male Female Male Female Male FemaleCentral Asia 58.7 64.1 64.6 71.8 64.6 71.8China region 56.1 48.1 65.8 67.2 65.8 67.2Eastern Europe 63.1 69.8 68.8 76.4 68.8 76.4FSU Europe 57.8 69.0 63.0 74.2 63.0 74.2Latin America 54.3 57.0 64.5 69.8 64.5 69.8Middle East 48.7 38.2 61.0 51.4 62.4 56.3North Africa 38.7 27.7 54.0 42.4 55.4 47.3North America 69.3 75.8 74.0 80.5 74.0 80.5Pacific Asia 46.6 43.4 58.7 58.4 59.2 59.6Pacific OECD 72.4 78.4 77.3 83.4 77.3 83.4South Asia 36.5 22.0 51.6 37.2 52.2 42.7Sub-Saharan Africa 27.4 20.4 35.8 29.9 38.4 35.2Western Europe 66.3 70.4 73.2 78.3 73.2 78.3
2025-2030Constant ICPD2000-2005

Projections of female literate life expectancy at birth for six regions 2000-2030, according to the “ICPD” scenario
0
20
40
60
80
2000-05 2005-10 2010-15 2015-20 2020-25 2025-30
Lite
rate
life
exp
ecta
ncy
(yea
rs)
Sub Saharan Africa South Asia North Africa
Middle East Latin America China & CPA

New Concept of Population Balance
• So far the problems associated with population growth and those associated with population ageing have been studied separately.
• Here we develop a common framework considering age structure.
• We complement these purely demographic factors by also considering the cost and the productivity enhancing effects of education.

Cohort Welfare Indictor for Stable Populations by Fraction Educated and Total Fertility Rate, Baseline Parameters
0
10
20
30
40
50
60
0.01 0.51 1.01 1.51 2.01 2.51 3.01 3.51 4.01 4.51 5.01 5.51
TOTAL FERTILITY RATE
WE
LFA
RE
IN
DIC
AT
OR
efract=15% efract=50% efract=85%

Population Balance: Issues
• Fertility somewhat below 2.0 may not be a problem, if the fewer children will be more productive.
• Over the coming decades, China and SE-Asia, and in particular those countries that already have low fertility and invested in broad education will see significant increase in human capital while the old age dependency burden is still low (demographic window).
• In terms of global competitiveness these countries are likely to gain at the expense of Europe and Japan where the old-age dependency burden is already significantly increasing.