Embed Size (px)
Citation preview

EUROPEANYOUTH- 2018 -Report

Contents
1. Study Design (p. 3-4)
2. Perception Of The European Union (p. 5-20)
3. Political attitudes (p. 21-45)
4. Media Usage (p. 46-54)
5. Outlook Into The Future (p. 55-68)
6. Imprint (p. 69-70)

STUDY DESIGN

Study Design
4
In order to provide insights into the environment, identities, and attitudes
of young Europeans towards Europe in 2018, the TUI Foundation
conducted a survey among young people from France, Germany, Greece,
Italy, Poland, Spain, and United Kingdom. 1
For this purpose 6,080 young people aged 16 up to 26 were interviewed
via an online survey from February 14th until May 4th 2017. The
participants of the study where recruited through online access panels.
In each country the participants were recruited representatively according
to the actual distribution of age and gender in the respective country
(representative quotas retrieved from EUROSTAT,
https://ec.europa.eu/CensusHub2/). Results were additionally weighed in
terms of age and gender in order to adjust minor deviations. Results that
account for all countries are weighed additionally so that every country
has the same weight.
The participants were asked about four subject areas:
1. Perception of the European Union
2. Political attitudes
3. Media usage
4. Perception of the future
1 Countries sorted in alphabetical order (i.e., France, Germany, Greece, Italy, Poland, Spain, United Kingdom).
n=1.025
n=1.013
n=1.000
n=1.000n=507
n=1.025
n=510

PERCEPTION OF THE EU

Perception of the EU
6
Young Europeans seem to be more aware of Europe being
relevant than in 2017. A whole series of results point towards
Europe (as a topic) becoming more important to young people
compared to the previous year. Possibly a more distinct political
discours has led to a more positive perception of Europe and the
European Union.
Compared to 2017, the share of young people who describe
themselves as citizens of their country exclusively has decreased
(2018: 34 percent, 2017: 42 percent). At the same time, the
share of those describing themselves as citizens of their country
as well as Europeans has increased (2018: 52 percent, 2017: 45
percent). Yet, there are differences between countries. In
Germany and in Poland, descriptions of the identity of young
people have not changed. In Greece, the share of young people
with Greek and European identity has only slightly increased. In
France, Italy, Spain and the UK, identities shifting from
exclusively national to mixed identities is more pronounced.
When it comes to how young Euopeans would decide in a
hypothetical referendum on the EU membership of their country,
young peoples attitudes have become more in favor of the EU
than in the previous year. Overall, 71 percent would vote for
their country to remain in the EU. That is ten points more than
in 2017 (61 percent). This finding is consistent across all
countries. In France, Germany, Greece, Italy and Spain, the share
of those voting for remain increases by more than ten points.
Only in Poland (+ seven points) and in the UK (+ five points), the
increase of the remain votes is single-digit
The perception of the relationship between one‘s own country
and the EU has changed, too. Increasingly, young Europeans
perceive this relationship as reciprocical (country and the EU
need each other equally; 2018: 35 percent, 2017: 29 percent).
This trend is stems from changes in France, Germany, Poland,
Spain and (to a lower extent) in Greece and Italy.
Only slight changes compared to 2017 are found regarding what
the EU stands for. Above all, the EU is considered to be an
economic alliance. However, perceiving the EU as an alliance that
shares cultural values has increased in Italy (+ seven points) and
Spain (+ five points).

Half of young Europeans describe themselves at least partly as European, on third only as citizen of their country.
7
How would you be most likely to describe yourself?
Base: all respondents, n=6080
In %
3425
36 3438
46
21
40
4453
37 44
47
43
49
36
8 811
9
9 6
8
7
3 2 4 2
2 2
4
4
8 6 8 103 1
17 9
3 5 4 1 2 2 1 4
don't know/no response
other
only as a European
as a European first, and then as citizenof my country
as citizen of my country first, and then asa European
as citizen of my country

In France, Italy, Spain and UK, the share of young people describing themselves as at least partly European has increased.
8
How would you be most likely to describe yourself?
Base: all respondents, 2018: n=6080, 2017: n=6000
In %
34 4225
4736 37 34 37
44 3853
3537 34 44 44
8 7 8 711 12
9 53 3 2 1 4 4 2 38 8 6 7 8 10 10 93 2 5 2 4 4 1 1
don't know/no response
other
only as a European
as a European first, and then as citizen ofmy country
as citizen of my country first, and then as aEuropean
as citizen of my country
38 44 46 45
21 2740
55
47 40 43 42
49 4236
26
9 7 6 8
8 87 4
2 2 2 2
4 44 4
3 4 1 317 16 9 10
2 2 2 1 1 2 4 2
20172018 20172018 20172018 20172018
20172018 20172018 20172018 20172018

A solid majority of young Europeans approves the EU membership of their country.
9
If a referendum was held tomorrow about the EU membership of your country: How would you vote?
Base: all respondents, n=6080
In %
71
69
80
63
71
68
85
63
15
11
9
20
17
17
5
23
7
8
4
8
3
9
6
7
7
11
7
9
8
6
4
7
[Country] should stay in the EU [Country] should leave the EU I would not vote don't know/no response

In all countries, the approval of the EU membership has increased compared to 2017.
10
Base: all respondents, 2018: n=6080, 2017: n=6000
In %
7161 69
5880
69 6352
1521 11
19
912 20
31
7 8 8 114
7 8 97 10 11 13 7 12 9 8
don't know/no response
I would not vote
[Country] should leave the EU
[Country] should stay in the EU
7159 68 61
8573
63 58
1726 17
22
512 23 27
3 5 9 86 8 7 7
8 10 6 9 4 7 7 8
20172018 20172018 20172018 20172018
20172018 20172018 20172018 20172018
If a referendum was held tomorrow about the EU membership of your country: How would you vote?

Young Italians, Poles, Spaniards and Brits think their country needs the EU more than the EU needs their country.
11
When you think about the relationship between your country and the EU: Which of the following statements do you most agree with?
Base: all respondents, n=6080
In %
31
19
9
20
37
39
55
39
20
20
38
29
16
15
6
18
35
43
42
39
34
32
32
23
6
4
3
7
8
7
4
8
8
14
9
5
5
7
3
12
[country] needs the EU more than the EU needs the[country].
The EU needs [country] more than [country] needs theEU.
[Country] and the EU need each other equally.
Neither the EU nor [nountry] needs one another.
don't know/no response

The share of those who think the relationship between their country and the EU is inderdependent has increased.
12
Base: all respondents, 2018: n=6080, 2017: n=6000
In %
31
30
19
19
9
9
20
20
37
36
39
44
55
54
39
29
20
23
20
23
38
41
29
29
16
18
15
19
6
9
18
25
35
29
43
35
42
35
39
36
34
29
32
20
32
22
23
23
6
7
4
7
3
2
7
7
8
9
7
9
4
8
8
8
8
11
14
17
9
13
5
7
5
8
7
8
3
7
12
15
[Country] needs the EU more than the EU needsthe United Kingdom
The EU needs [Country] more than [Country]needs the EU
[Country] and the EU need each other equally
Neither the EU nor [Country] needs one another
don't know/no response
When you think about the relationship between your country and the EU: Which of the following statements do you most agree with?
2018
2017
2018
2017
2018
2017
2018
2017
2018
2017
2018
2017
2018
2017
2018
2017

FR DE GR IT PL ES UK
52 64 72 62 62 63 57
59 66 62 51 59 51 50
45 49 43 52 70 44 43
49 51 36 43 36 61 55
38 37 56 43 30 43 43
30 50 49 36 20 35 35
44 17 37 30 12 44 8
13 20 30 40 31 25 21
19 23 16 31 25 23 25
Human rights is the most important social value for young Europeans. Solidarity is important to French and Spaniards.
13
Which of these social values are most important to you personally? Please select up to 5 values. Part 1/2
Base: all respondents, n=6080
In %; sorted by total; multiple answers possible; description: Top5 (green) und Bottom5 (purple) of the respective country
61
57
50
47
41
36
27
26
23
Human rights
Peace
Safety and security
Tolerance
Individual freedom
Democracy
Solidarity
Prosperity and economic success
Stability and reliability

FR DE GR IT PL ES UK
30 20 8 30 29 19 21
11 25 25 6 17 16 20
23 8 7 15 18 11 16
10 8 17 9 26 6 9
7 6 2 15 7 12 9
7 6 4 1 14 8 7
2 2 1 1 1 1 5
1 1 0 1 0 0 2
The rule of law is relevant to young Germans, Greeks and Brits. Religion is important to Italians and Poles.
14
Which of these social values are most important to you personally? Please select up to 5 values. Part 2/2
Base: all respondents, n=6080
In %; sorted by total; multiple answers possible; description: Top5 (green) und Bottom5 (purple) of the respective country
22
17
14
12
8
7
1
2
Openness to the world
The rule of law
Intercultural understanding
Religion and faith
Shared culture
Political strength
None of these values
don't know/no response

FR DE GR IT PL ES UK
49 57 47 47 42 39 40
41 38 36 44 33 39 37
40 34 31 35 28 29 36
30 39 35 34 23 37 20
26 28 46 38 41 24 15
37 27 28 28 25 33 21
29 36 21 22 25 31 26
19 20 22 26 27 28 18
14 13 22 26 26 26 25
For young Europeans, the EU primearily stands for peace. Young French and Germans do not perceive a shared culture.
15
In your view, which of these values does the EU represent? Please select up to 5 values. Part 1/2
Base: all respondents, n=6080
In %; sorted by total; multiple answers possible; description: Top5 (green) und Bottom5 (purple) of the respective country
46
38
34
31
31
28
27
23
22
Peace in Europe
Human rights
Solidarity
Democracy
Intercultural understanding
Safety and security
Prosperity and economic success
Tolerance
Shared culture

FR DE GR IT PL ES UK
28 15 13 28 32 13 14
18 23 15 24 9 26 18
16 18 15 13 10 25 16
19 15 9 6 11 8 36
12 12 21 14 11 15 7
4 3 11 6 11 6 7
4 8 7 6 9 11 2
7 6 1 2 2 2 15
To young Brits, the EU represents strength. For young Poles, the EU stands for openness to the world.
16
In your view, which of these values does the EU represent? Please select up to 5 values. Part 2/2
Base: all respondents, n=6080
In %; sorted by total; multiple answers possible; description: Top5 (green) und Bottom5 (purple) of the respective country
20
19
16
15
13
7
7
5
Openness to the world
Stability and reliability
The rule of law
Political strength on the global stage
Individual freedom
Religion and essentially Christian culture
None of these values
don't know/no response

FR DE GR IT PL ES UK
72 75 70 75 73 76 67
64 72 60 69 74 72 72
60 71 62 68 65 62 57
53 60 52 60 55 58 55
64 64 64 61 41 70 29
48 30 41 43 49 30 30
36 32 32 42 51 39 38
28 31 54 26 34 51 24
30 26 30 43 34 33 34
9 8 7 3 5 2 19
Above all, young Europeans perceive the EU as an economic alliance, then as a coalition with open borders.
17
The EU has many tasks and meanings. In your view, which of the following tasks and meanings best describe the EU?
Base: all respondents, n=6080
In %; sorted by total; multiple answers possible; description: Top3 (green) und Bottom3 (purple) of the respective country
73
69
63
56
56
39
39
36
33
7
Economic alliance
Coalition of countries with open borders, where it is possible to travel, live and work freely
Alliance to ensure peace in Europe
Shared democratic and political principles
Alliance with a shared currency
Military alliance
Alliance of friendly countries
Alliance of convenience to pursue individual interests
Alliance of countries with shared cultural values
don't know/no response

The perception of the EU has hardly changed since last year.
18
The EU has many tasks and meanings. In your view, which of the following tasks and meanings best describe the EU? Part 1/2
Base: all respondents, 2018: n=6080, 2017: n=6000
In %; sorted by EU 2018; multiple answers possible
70
60
62
52
64
41
32
54
30
7
72
69
57
46
66
40
36
52
29
6
75
72
71
60
64
30
32
31
26
8
75
70
71
62
59
29
30
32
26
9
2018 2017
72
64
60
53
64
48
36
28
30
9
77
66
64
48
65
43
38
29
28
8
73
69
63
56
56
39
39
36
33
7
76
70
63
56
57
39
41
35
30
6
Economic alliance
Coalition of countries with open borders, where it is possible to travel, live and work
freely
Alliance to ensure peace in Europe
Shared democratic and political principles
Alliance with a shared currency
Military alliance
don't know/no response
Alliance of friendly countries
Alliance of convenience to pursue individual interests
Alliance of countries with shared cultural values

Young Poles are more likely to perceive the EU as a peacekeeping alliance than in 2017.
19
The EU has many tasks and meanings. In your view, which of the following tasks and meanings best describe the EU? Part 2/2
Base: all respondents, 2018: n=6080, 2017: n=6000
In %; sorted by EU 2018; multiple answers possible
67
72
57
55
29
30
38
24
34
19
71
72
66
55
34
33
43
24
31
14
76
72
62
58
70
30
39
51
33
2
79
69
61
58
68
36
42
45
28
3
2018 2017
73
74
65
55
41
49
51
34
34
5
80
71
58
62
45
51
55
35
32
2
75
69
68
60
61
43
42
26
43
3
79
70
66
59
63
43
43
28
36
2
Economic alliance
Coalition of countries with open borders, where it is possible to travel, live and work
freely
Alliance to ensure peace in Europe
Shared democratic and political principles
Alliance with a shared currency
Military alliance
don't know/no response
Alliance of friendly countries
Alliance of convenience to pursue individual interests
Alliance of countries with shared cultural values
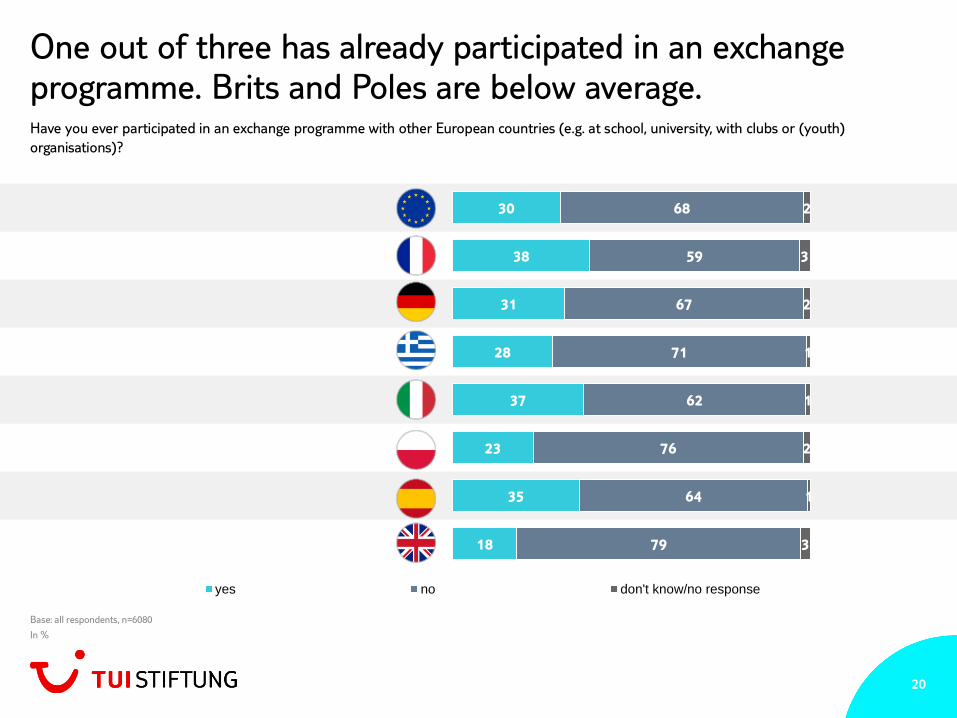
One out of three has already participated in an exchange programme. Brits and Poles are below average.
20
Have you ever participated in an exchange programme with other European countries (e.g. at school, university, with clubs or (youth)
organisations)?
Base: all respondents, n=6080
In %
30
38
31
28
37
23
35
18
68
59
67
71
62
76
64
79
2
3
2
1
1
2
1
3
yes no don't know/no response

21
Have you ever participated in an exchange programme with other European countries (e.g. at school, university, with clubs or (youth)
organisations)?
Basis: respondents who have participated in an exchange programme: n=1896; respondents who have not participated in an exchange programme: n=4081
In %
27
38
60
49
3
3
8
8
as citizen of my country
as citizen of my country and as an European
only as a European
other
don't know/no response
Has particpated
Has not particpated
33
31
21
20
38
34
4
7
5
9
[country] needs the EU more than the EU needs the[country].
The EU needs [country] more than [country] needs the EU.
[Country] and the EU need each other equally.
Has particpated
Has not particpated
78
69
12
16
4
7
5
8
[Country] should stay in the EU
[Country] should leave the EU
I would not vote
don't know/no response
Has particpated
Has not particpated
64
56
23
24
5
6
7
14
All in all, democracy is the best form of government
Democracy is just as good or bad as other forms ofgovernmentOther forms of government are better than democracy
don't know/no response
Has particpated
Has not particpated
18
16
48
44
28
29
6
11
By and large, the political system in [country] works the wayit is supposed to.
The political system in [country] does not work, but it couldbe fixed with a few changes.
The political system in [country] works so badly that onlyradical change could fix it.
don't know / no response
Has particpated
Has not particpated
20%
30%
40%
50%
60%
70%
Has paticipated Has not participated
Globalisation
Immigration and emigration
Open borders within the EU
Single currency within the EU (Euro)
Identity Relationship to the EU Approval of the EU
Approval of democracy Evaluation of democracy Perception as an opportunity
Young people who have participated in exchange programmes are more open towards Europe.

4
10
34
38
61
51
low level
medium level
high level
don't know/no response
59
54
22
23
17
20
urban
suburban
rural
don't know/no response
2
3
4
6
16
20
35
36
31
26
7
4
1 - poor household234567 - rich householddon't know/no response
44
43
56
57
16 to 20 years 21 to 26 years
12
18
37
42
47
32
low level
medium level
high level
don't know/no response
46
52
54
48
male female
Has not particpated
22
Have you ever participated in an exchange programme with other European countries (e.g. at school, university, with clubs or (youth)
organisations)?
Basis: respondents who have participated in an exchange programme: n=1896; respondents who have not participated in an exchange programme: n=4081
In %
Gender Education Perants‘ education (mother and father aggregated)
Age Economical status Place of residence
Has particpated
Has not particpated
Has particpated Has particpated
Has not particpated
Has particpated
Has not particpated
Has particpated
Has not particpated
Has particpated
Has not particpated
Young people who have participated in exchange programmes are of higher social and economic status.
POLITICAL ATTITUDES

Political Attitudes
24
Approval of democracy as a form of government has grown
compared to the previouus year. Overall, 58 percent of young
Europeans think that democracy is the best form of government.
Another 24 percent show an ambivalent attitude towards
democracy. Finally, six percent think that other froms of
government are better than democracy. Compared to the
previous year, aproval of democracy has increased by six points
(2017: 52 percent). Looking into specific countries, approval of
democracy has grown signifincantly in Germany, Italy, Poland and
Spain.
Nevertheless, young Europeans share a strong demand for
political change. Overall, not even one out of five (17 percent)
thinks that the political system works the way it is supposed to.
Almost half of young people (45 percent) thinks that the political
system needs change. Another 28 percent believes that only
radical change can fix the political system. While the share of
young people who think that the system works the way it is
supposed to is above average in Germany (39 percent), the
share of those demanding for radical change is high in Greece
(52 percent), Italy (43 percent) and Spain (35 percent) in
particular.
From a young Europeans perspective, fighting terrorism (44
percent), protecting the environment and the climate (34
percent) and regulating immigration (33 percent) are the most
important tasks the EU should take care of. Promoting economic
growth (39 percent), reducing social inequality (25 percent) and
fighting terrorism (29 percent) are the most important tasks on
a national level. Tasks related to security and environmental
policies are perceived as supranational tasks, those related to
economic and social policies are percieved as national tasks.
Promoting education and science is also considered a national
tasks. Despite the EU being strongly engaged in educational and
scientific policies, this tasks is being assigned to the national
sphere (EU: 17 percent, national: 26 percent).

Almost two out of three think that democracy is the best form of government. French and Poles are more skeptical.
25
When you think of democracy as a form of government: Which of the following statements do you agree with?
Base: all respondents, n=6080
In %
58
44
67
69
57
49
65
56
24
30
17
18
29
34
21
19
6
7
3
5
6
6
8
3
12
19
13
8
8
12
6
21
All in all, democracy is the best form of government Democracy is just as good or bad as other forms of governmentOther forms of government are better than democracy don't know/no response

The approval of democracy as a form of government has increased – especially in Italy, Poland and Spain.
26
When you think of democracy as a form of government: Which of the following statements do you agree with?
Base: all respondents, 2018: n=6080, 2017: n=6000
In %;
58 52 44 42
67 62 69 66
2426
30 26
1718
18 226 9
7 123 6
5 612 13 19 20 13 15 8 6
don't know/no response
Other forms of government are betterthan democracy
Democracy is just as good or bad asother forms of government
All in all, democracy is the best formof government
5745 49 42
65 57 56 53
2935 34
37
2124 19 20
6 10 6 138 10
3 6
8 9 12 9 6 921 21
20172018 20172018 20172018 20172018
20172018 20172018 20172018 20172018
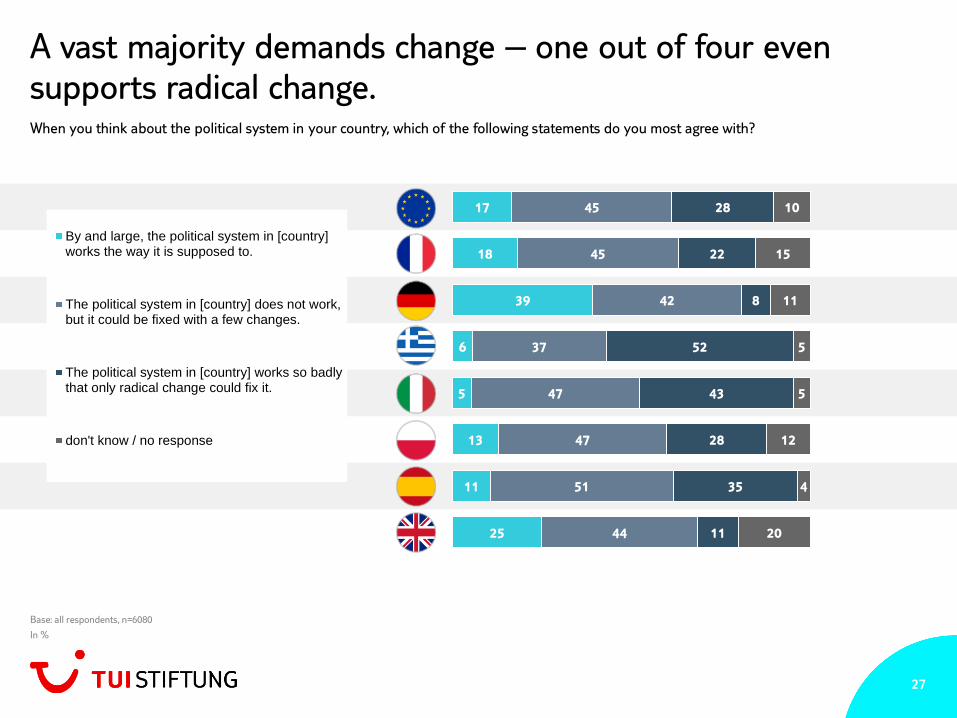
A vast majority demands change – one out of four even
supports radical change.
27
When you think about the political system in your country, which of the following statements do you most agree with?
Base: all respondents, n=6080
In %
17
18
39
6
5
13
11
25
45
45
42
37
47
47
51
44
28
22
8
52
43
28
35
11
10
15
11
5
5
12
4
20
By and large, the political system in [country]works the way it is supposed to.
The political system in [country] does not work,but it could be fixed with a few changes.
The political system in [country] works so badlythat only radical change could fix it.
don't know / no response

FR DE GR IT PL ES UK
55 59 54 70 47 59 55
43 41 36 39 37 58 59
31 34 44 44 37 47 40
33 32 37 32 30 41 38
22 33 27 33 21 46 61
26 29 36 28 28 39 19
22 20 30 39 30 36 13
Almost half of young Europeans has participated in an online petition, one out of three has posted a political online comment.
28
If you think back over the last twelve months, which of the following things did you do to express your opinion? Part 1/2
Have you…
Base: all respondents, n=6080
In %; sorted by total; multiple answers possible; description: Top3 (green) und Bottom3 (purple) of the respective country
... voted at the last election or referendum in your
country?
... participated in an online petition?
... publicly expressed my opinion in another
manner?
... posted a comment online about a political topic
on social media?
... signed a petition?
... reported a comment about a political topic on
social media?
... been involved in an advocacy group at a school,
university or company?
FR DE GR IT PL ES UK
22 14 36 28 15 41 9
19 10 27 23 27 30 14
16 14 29 19 15 29 16
11 15 15 19 20 11 9
12 13 19 12 10 14 7
10 12 12 9 9 9 16
12 10 7 5 5 7 13
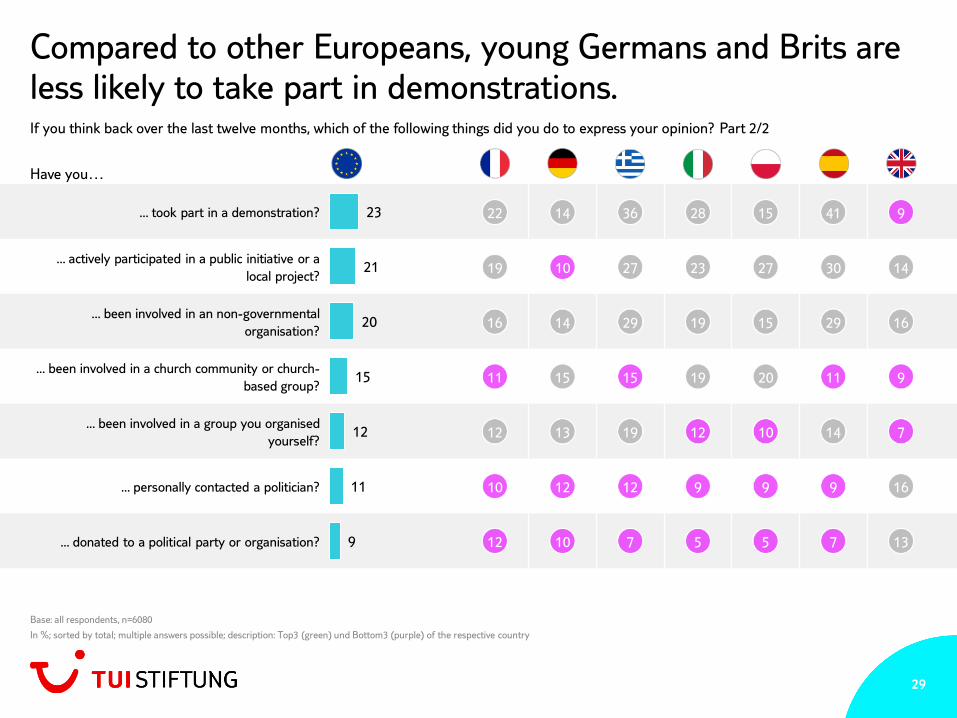
Compared to other Europeans, young Germans and Brits are less likely to take part in demonstrations.
29
If you think back over the last twelve months, which of the following things did you do to express your opinion? Part 2/2
Have you…
Base: all respondents, n=6080
In %; sorted by total; multiple answers possible; description: Top3 (green) und Bottom3 (purple) of the respective country
... took part in a demonstration?
... actively participated in a public initiative or a
local project?
... been involved in an non-governmental
organisation?
... been involved in a church community or church-
based group?
... been involved in a group you organised
yourself?
... personally contacted a politician?
... donated to a political party or organisation?
23
21
20
15
12
11
9

Young people with high socioeconomic status are more likely to participate online than others.
30
If you think back over the last twelve months, which of the following things did you do to express your opinion? (Auszug)
Base: all respondents, n=6080
In %
0%
10%
20%
30%
40%
50%
60%
low education level middle educationlevel
high education level
Posted a comment online about a political topic on social media
Reported a comment about a political topic on social media
Participated in an online petition
Signed a petition
Took part in a demonstration
0%
10%
20%
30%
40%
50%
60%
low standard of living middle standard ofliving
high standard of living
Posted a comment online about a political topic on social media
Reported a comment about a political topic on social media
Participated in an online petition
Signed a petition
Took part in a demonstration
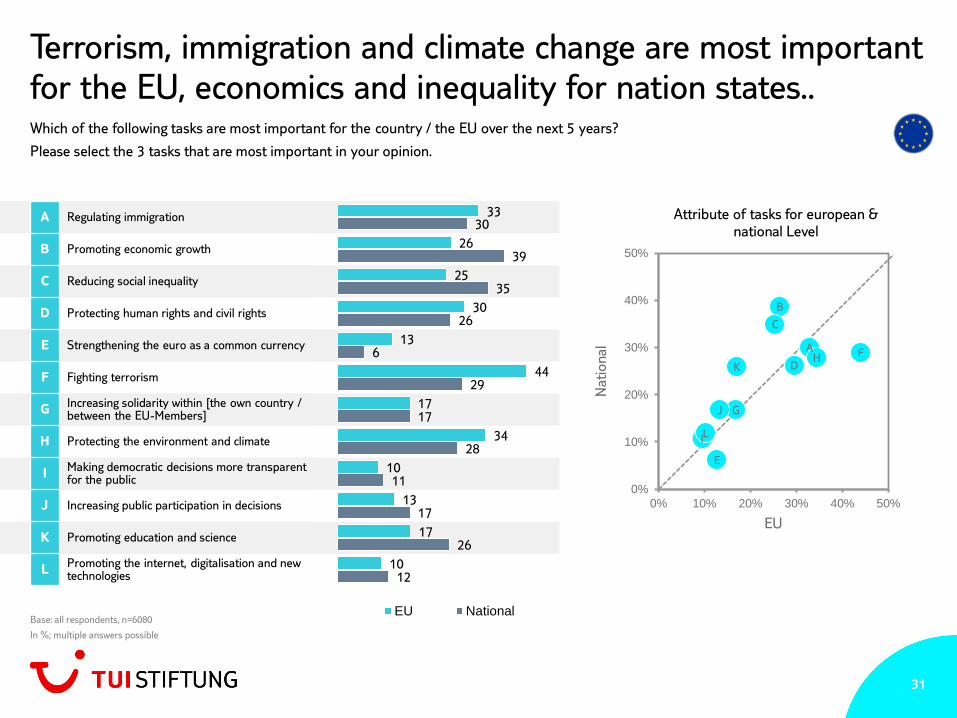
31
Which of the following tasks are most important for the country / the EU over the next 5 years?
Please select the 3 tasks that are most important in your opinion.
Base: all respondents, n=6080
In %; multiple answers possible
A Regulating immigration
B Promoting economic growth
C Reducing social inequality
D Protecting human rights and civil rights
E Strengthening the euro as a common currency
F Fighting terrorism
GIncreasing solidarity within [the own country / between the EU-Members]
H Protecting the environment and climate
IMaking democratic decisions more transparent for the public
J Increasing public participation in decisions
K Promoting education and science
LPromoting the internet, digitalisation and new technologies
Terrorism, immigration and climate change are most important for the EU, economics and inequality for nation states..
33
26
25
30
13
44
17
34
10
13
17
10
30
39
35
26
6
29
17
28
11
17
26
12
EU National
A
B
C
D
E
F
G
H
I
J
K
L
0%
10%
20%
30%
40%
50%
0% 10% 20% 30% 40% 50%
Nati
onal
EU
Attribute of tasks for european & national Level

Terrorism and climate change are considered European tasks, economics and inequality are considered national tasks.
32
Which of the following tasks are most important for the country / the EU over the next 5 years? Please select the 3 tasks that are most important
in your opinion. Part 1/2
Base: all respondents, 2018: n=6080, 2017: n=6000
In %; sorted by most important EU tasks; multiple answers possible
43
25
41
26
31
23
20
22
18
14
10
6
2
3
14
15
44
26
53
28
30
21
24
9
9
10
1
2
38
43
29
28
12
26
20
16
16
12
21
11
1
6
29
40
32
21
12
37
30
11
15
6
29
10
1
6
EU National
45
39
25
30
22
30
8
17
16
15
8
10
1
7
47
37
25
23
25
41
12
20
15
8
9
9
1
6
44
34
33
30
26
25
17
17
13
13
10
10
1
5
29
28
30
26
39
35
26
17
17
6
12
11
1
4
Fighting terrorism
Protecting the environment and climate
Regulating immigration
Protecting human rights and civil rights
Promoting economic growth
Reducing social inequality
Promoting education and science
Increasing solidarity within [the own country / between the EU-Members]
Increasing public participation in decisions
Strengthening the euro as a common
currencyPromoting the internet, digitalisation and
new technologies
Making democratic decisions more transparent for the public
Other
don't know / no response

Base: all respondents, 2018: n=6080, 2017: n=6000
In %; sorted by most important EU tasks; multiple answers possible
Promoting education and science is considered to be a national task rather than a European task.
33
37
35
21
33
23
24
14
17
11
5
6
19
1
13
33
31
20
27
34
39
21
16
10
2
7
12
2
11
45
34
23
34
35
35
17
14
12
18
7
8
1
2
32
26
18
30
47
46
24
16
19
7
5
11
3
2
EU National
61
28
46
27
25
15
18
18
8
12
11
8
1
4
29
23
25
34
46
21
33
23
16
5
14
13
2
3
38
37
45
29
37
25
21
14
13
13
8
6
1
2
19
24
47
24
54
32
32
11
18
8
11
11
1
Which of the following tasks are most important for the country / the EU over the next 5 years? Please select the 3 tasks that are most important
in your opinion. Part 2/2
Fighting terrorism
Protecting the environment and climate
Regulating immigration
Protecting human rights and civil rights
Promoting economic growth
Reducing social inequality
Promoting education and science
Increasing solidarity within [the own country / between the EU-Members]
Increasing public participation in decisions
Strengthening the euro as a common currency
Promoting the internet, digitalisation and new technologies
Making democratic decisions more transparent for the public
Other
don't know / no response

34
Do you agree or disagree with the following statements? Part 1/3
Base: all respondents, n=6080
In %; Top2Boxes [„partly agree“ + „totally agree“] and Bottom2Boxes [„partly disagree“ + „totally disagree“] are shown
Political decisions should always be based on
public welfare, and not on personal interests.
73 65 71 78 80 71 74 72
6 8 5 6 5 8 7 6
Political decisions should be as transparent as
possible, even if this means that it takes longer
for decisions to be made.
62 57 57 60 6754
73 67
9 10 8 12 8 12 6 8
The rights of minorities also need to be
protected against majority decisions.
53 55 49 54 5744
56 60
11 10 10 12 12 12 10 11
It would be better if important political decisions
were made by independent experts, and not by
elected politicians.
43 45 36 39 4256 47
37
19 17 21 21 20 12 17 26
Agree (partly/ totally agree) Disagree (partly/ totally disagree)
Transparency is important to young Spaniards, young Poles are more affine for technocratic decision making.

35
Do you agree or disagree with the following statements? Part 2/3
Base: all respondents, n=6080
In %; Top2Boxes [„partly agree“ + „totally agree“] and Bottom2Boxes [„partly disagree“ + „totally disagree“] are shown
One always has to accept democratic decisions,
even if they go against one’s own interests.
43 4051
4152
34 3750
22 2413
24 19 28 25 18
No progress is being made because political
decisions always have to be compromises.
41 44 41 3647 38 35 44
19 13 19 25 19 18 19 20
Sometimes it is important to violate the rules of
democracy in order to make important changes
possible.26
34
24 20 27 28 28 23
39
31
42 50 40 35 37 41
Members of Parliament should vote according to
their consciences, even if the majority of the
public currently have a different opinion. 26 22 26 19 27 21 26
3841 41 3652 42 47 40
28
Agree (partly/ totally agree) Disagree (partly/ totally disagree)
In Germany and France, four out of ten accept violating the rules of democracy. In Greece, this is true for one out of two.

36
Do you agree or disagree with the following statements? Part 3/3
Base: all respondents, n=6080
In %; Top2Boxes [„partly agree“ + „totally agree“] and Bottom2Boxes [„partly disagree“ + „totally disagree“] are shown
It should be easier for the government to
implement its objectives, even if that means the
rights of the opposition need to be restricted.23 22 17 26 31 21 24 16
39 3545
33 32 39 41 45
There are no major differences between the
ideas and beliefs of the parties.
22 25 21 28 20 26 21 16
42 32 40 42 43 40 3955
Sometimes it is better for political decisions to be
made behind closed doors.
18 25 17 12 15 18 1325
5134
4960 61 52 58
46
Agree (partly/ totally agree) Disagree (partly/ totally disagree)
Young Europeans reject non-transparent decision making. However, this attitude is less yet less pronounced in France.

Populist attitudes
37
Measuring populist attitudes, the survey contained 15 questions that
map three dimensions of populism:
1. Anti elitism
2. Belief in unrestricted popular sovereignty
3. Understanding the people as being homogenous and virtuous
Young Europeans were classified as having populist attitudes when
Junge Europäer wurden dann populistische Einstellungstendenzen
zugeschrieben, wenn
1. Approving 12 out of the set of 15 questions in total and
2. Approving at least two questions of each of these three
dimensions
The share of young people with populist attitudes ranges from seven
percent in Germany to 23 percent in Poland.
Young Europeans with populist attitudes do not necessarily reject
democracy as a form of government. However, they ecidently have a
different idea of democracy and political procedures. Almost two out
of three young people with populist attitudes (63 percent) think that
democracy is the best form of government. For comparison: Among
young people without populist attitudes, only 57 percent think that
democracy is the best form of government. Yet, young people with
populist attitudes are far more critical about how democracy is
organized and how the democratic system works. 39 percent think
that the political system works so badly that only radical change could
fix it (young people without populist attitudes: 26 percent).
Having populist attitudes goes along with distrusting representatives
of the political system (e.g., political parties: 71 percent vs. 61 percent;
public broadcasters: 52 percent vs. 42 percent). Political opinions of
those having populist attitudes provide guidance regarding perceived
shortcomings of the political system and the preferred type of
democracy. 74 percent think that democratic processes should be as
transparent as possible even if this is more time consuming. At the
same time, 64 percent would prefer technocratic decisions (decisions
made by non-elected experts) over decisions made by (elected)
politicians. 57 percent think that political processes are gridlocked due
to the need to compromise. 35 percent would accept if the rights of
the opposition would be restricted and if democratic rules would be
violated, respectively.
Apparently, populist attitudes go along with perceiving immigration as
a problem. 36 percent consider this to be one of the most important
policy area on a national level, another 38 percent on European level.
Almost half of those with populist attitudes (43 percent) perceives
immigration as a threat (young people without populist attitudes: 26
percent).

Definition, measurement and coding of populist attitudes
38
Items according to Schulz, A., Müller, P., Schemer, C., Wirz, D.S., Wettstein, M. & Wirth, W. (2017). Measuring Populist Attitudes on Three Dimensions. International Journal of Public Opinion Research.
Anti elitism
The Members of Parliament quickly lose contact with the public.
The differences between the public and the “elites” are far bigger than the differences
between members of the public.
People like me have no influence over what the government does.
Politicians do not care much what people like me think.
Politicians talk too much and get too little done.
Belief in
unrestricted
popular
sovereignty
The public should have the final say in political issues, by means of referendums.
The public should be asked during all important decisions.
The public should make the most important political decisions, not politicians.
The politicians in Parliament should comply with the will of the people.
Understanding
the people as
being
homogenous and
virtuous
The common people all pull together.
Common people are united by their good and honest character.
Common people share the same values and interests.
Although the [people] may have their differences, they all think the same way when it
matters.
The [people] are fundamentally upright and virtuous.
The [people] are a cohesive unit, and not just a whole lot of individual people.
Appro
val o
f 12 o
ut o
f 15 q
uestio
ns in
tota
l
Approval of at least 2 questions
Approval of at least 2 questions
Approval of at least 2 questions

Young Europeans with populist attitudes
39
Populist attitudes among young Europeans
Base: all respondents, n=6080
In %
21
7
18
14
23
16
11
79
93
82
86
77
84
89
Populist attitudes No Populist attitudes

Young Europeans with populist attitudes ask for a different type of democracy.
40
When you think of democracy as a form of government: Which of the
following statements do you agree with?
Base: all respondents, n=6080
In %
6357
24
24
56
813
don't know/no response
Other forms of government arebetter than democracy
Democracy is just as good or badas other forms of government
All in all, democracy is the bestform of government
Young
europeans
without populist
attitudes
13 17
4345
39 26
511
don't know / no response
Works so badly that only radicalchange could fix it
Does not work, but it could befixed with a few changes
By and large, works the way it issupposed to
Young
europeans with
populist
attitudes
Young
europeans
without populist
attitudes
Young
europeans with
populist
attitudes
When you think about the political system in your country, which of the
following statements do you most agree with?

Political decisions should be as transparent as possible, even if this means that it takes
longer for decisions to be made.
It would be better if important political decisions were made by independent experts,
and not by elected politicians.
No progress is being made because political decisions always have to be compromises.
It should be easier for the government to implement its objectives, even if that means
the rights of the opposition need to be restricted.
Sometimes it is important to violate the rules of democracy in order to make important
changes possible.
There are no major differences between the ideas and beliefs of the parties.
Young Europeans with populist attitudes are more likely to give up on essential constituents of democracy.
41
Do you agree or disagree with the following statements?
Base: all respondents, n=6080
In %
74
64
57
35
35
35
60
39
38
20
25
20
0% 20% 40% 60% 80% 100%
Young europeans with populist attitudes Young europeans without populist attitudes

Promoting economic growth
Regulating immigration
Fighting terrorism
Reducing social inequality
Protecting the environment and climate
Protecting human rights and civil rights
Increasing public participation in decisions
Promoting education and science
Solidarity
Promoting the internet, digitalisation and new technologies
Making democratic decisions more transparent for the public
Strengthening the euro as a common currency
Other
don't know / no response
Immigration and fighting terrorism are clearly more important to young people with populist attitudes.
42
Which of the following tasks are most important for the [country] over the next 5 years?
Which of the following tasks are most important for the EU over the next 5 years?
Base: all respondents, n=6080
In %
42
36
36
34
27
25
22
22
20
10
10
6
0
1
38
29
28
35
28
26
16
27
16
12
11
6
2
5
Young europeans with populist attitudes
Young europeans without populist attitudes
29
38
53
24
31
29
14
16
16
9
10
14
1
2
26
32
42
26
35
30
13
17
17
10
9
12
1
6
National Level EU

Political parties
Government
Parliament
Public broadcasters
Churches
Private media
Banks
Large companies and corporations
Trade unions
Institutions of the EU
Courts
The police
Science and scientists
Young people with populist attitudes are less likely to trust politics and public broadcasters than others.
43
How much do you trust the following organisations and groups?
Base: all respondents, n=6080
In %
71
64
62
52
46
45
44
39
37
36
32
18
6
8
17
17
22
29
23
30
26
27
34
40
58
76
I do not generally trust / not trust them at all
I do generally trust / trust them completely
Young europeans with populist
attitudes
61
52
47
42
50
44
43
42
33
28
26
19
7
8
18
19
21
20
15
24
17
23
33
38
51
70
Young europeans without populist
attitudes

Participated in an online petition
Posted a comment online about a political topic on social media (e.g. Facebook, Twitter)
Signed a petition
Reported a comment about a political topic on social media (e.g. Facebook, Twitter)
Been involved in an advocacy group at a school, university or company
Took part in a demonstration
Actively participated in a public initiative or a local project
Been involved in an non-governmental organisation (e.g. human rights group, environmental group, aid organisation)
Been involved in a church community or church-based group
Been involved in a group you organised yourself
Personally contacted a politician (by telephone, post, email or social media)
Donated to a political party or organisation
Publicly expressed my opinion in another manner
Young people with populist attitudes are more likely to talk about political topics in social networks.
44
If you think back over the last twelve months, which of the following things did you do to express your opinion?
Base: all respondents, n=6080
In %
42
38
31
30
28
26
25
21
17
13
11
9
41
45
34
35
29
27
23
21
19
14
12
11
9
39
Young europeans with populist attitudes
Young europeans without populist attitudes

Openness to the world
The rule of law
Intercultural understanding
Religion and faith
Shared culture
Political strength
None of these values
don't know/no response
Human rights
Peace
Safety and security
Tolerance
Individual freedom
Democracy
Solidarity
Prosperity and economic success
Stability and reliability
Peace, security and freedom are more important as social values to young Europeans with populist attitudes.
45
Which of these social values are most important to you personally? Please select up to 5 values.
Base: all respondents, n=6080
In %
61
63
56
39
38
39
28
27
26
62
56
48
49
42
36
27
26
23
Young europeans with populist attitudes
Young europeans without populist attitudes
21
16
16
16
9
7
1
1
23
17
14
12
8
7
1
2

There are no differences regarding usage of the Internet in general. Yet, sources used differ significantly.
46
Where do you generally obtain the most information about politics?
Base: all respondents, n=6080
In %
Websites of (daily) newspapersand news magazines
YouTube
News websites ofnon-journalistic service providers
Independent blogs
Forums
Websites of public broadcasters
Email newsletters
Websites of tabloid newspapers
Other sources
don't know / no response
The Internet is not used as a sourcefor political information
83
17
81
19
Use the Internet for political information
Do not use the Internet for political information
Young europeans with populist
attitudes
Young europeans without populist
attitudes
54
35
28
23
22
18
16
14
11
8
7
1
17
43
34
28
19
17
19
13
15
8
7
8
2
19
Young europeans with populist attitudes
Young europeans without populist attitudes

Donald Trump as President of the USA
Political parties that reject the EU
Immigration and emigration
The United Kingdom leaving the EU (“Brexit”)
Open borders within the EU
Single currency within the EU (Euro)
Globalisation
Digitalisation
Young Europeans with populist attitudes perceive immigration to a much larger extent as a threat than others.
47
Do you view the following phenomenon as a threat to or an opportunity for your own life?
Base: all respondents, n=6080
In %
54
44
43
34
26
23
20
14
15
16
25
16
52
46
44
59
Threat
Opportunity
Young europeans with populist
attitudes
58
44
26
35
18
16
16
9
11
11
31
13
53
46
44
55
Young europeans without populist
attitudes

MEDIA USAGE

Media Usage
49
Predominantly, young Europeans use the Internet (82 percent)
and TV 63 percent) for obtaining information about politics.
Other sources are less relevant (personal conversations: 41
percent, radio: 34 percent, newspapers and news magazines: 30
percent). Regarding information behaviour on the Internet, social
networks are highly relevant. Almost half of young people (44
percent) use Facebook for obtaining information about politics.
Websites of newspapers and news magazines (34 percent) are
ranked second, followed by YouTube (28 percent). Other online
sources are far less relevant.
In general, young people are skeptical towards media outlets.
Trust in public broadcasters is on average at best. In France,
Germany, Italy and the UK, trust in public broadcasters is on
average. In Greece, Poland and Spain, young people’s trust in
public broadcasters is below average. In Germany and the UK,
young people trust public broadcasters more than private media
(Germany: 35 percent vs. 16 percent, UK: 33 percent vs. nine
percent). In France, Spain, Italy and Greece, trust in public
broadcasters and private media is on the same level. In Poland,
however, young people show greater trust in private media (24
percent) than in public broadcasters (13 percent).
When it comes to trust in specific types of media, newspapers
and news magazines are still strong brands even in a digitized
age. Printed versions of newspapers and news magazines (37
percent, most trusted) and their respective websites (35 percent,
third most trusted) are trusted sources. Outlets of public
broadcasters are also highly trusted (radio: 36 percent, second
most trusted; TV: 33 percent, fourth most trusted; websites: 30
percent, fifth most trusted). However, trust in outlets by public
broadcasters varies by countries (highly trusted in France,
Germany and the UK; less trusted in Greece, Italy, Poland).
Given Facebook being highly relevant as a source for political
information, it is noteworthy that young Europeans do trust
Facebook only to a low extent (17 percent). In France. Germany,
Spain and the UK, Facebook is one of the least trusted source. In
Greece, Italy and Poland, trust in Facebook is on average.

28
14
9
7
5
3
6
43
38
30
27
20
20
15
17
26
30
31
28
34
24
4
12
17
17
25
20
20
3
7
10
13
18
14
29
5
3
5
6
4
9
5
I trust them completely I generally trust them Neither agree nor disagree
I do not generally trust them I do not trust them at all don't know / no response
FR DE GR IT PL ES UK
66 65 68 77 66 78 77
53 62 30 56 46 50 64
43 58 30 30 31 23 54
33 37 24 42 32 36 30
26 22 17 23 43 13 28
26 34 9 19 24 21 32
26 19 23 19 29 11 24
Trust in science, the police and courts is highest. European institutions are ranked fourth.
50
How much do you trust the following organisations and groups? Part 1/2
Base: all respondents, n=6080
In %; sorted by Top2Box total [„I trust them completely “ + „I generally trust them“]; Description: Top3 (green) und Bottom3 (purple) of the Top2Boxes of the respective country
Science and scientists
The police
Courts
Institutions of the EU
Banks
Trade unions
Churches

Young Poles distrust public broadcasters more strongly than private media outlets.
51
How much do you trust the following organisations and groups? Part 2/2
Base: all respondents, n=6080
In %; sorted by Top2Box total [„I trust them completely “ + „I generally trust them“]; Description: Top3 (green) und Bottom3 (purple) of the Top2Boxes of the respective country
3
3
3
3
3
2
18
16
16
15
14
7
31
35
27
24
33
25
25
27
27
27
26
32
18
14
23
27
18
31
4
5
5
4
6
4
I trust them completely I generally trust them Neither agree nor disagree
I do not generally trust them I do not trust them at all don't know / no response
FR DE GR IT PL ES UK
25 35 11 18 13 15 33
22 11 17 29 23 16 12
26 35 6 13 13 15 23
26 32 7 14 15 11 20
22 16 9 19 24 15 9
12 14 3 8 8 6 8
Public broadcasters
Large companies and corporations
Parliament
Government
Private media
Political parties

FR DE GR IT PL ES UK
76 82 88 83 90 79 74
66 57 56 73 65 75 48
32 47 50 17 54 47 40
36 42 29 27 54 25 25
34 34 18 43 28 36 17
5 9 8 5 8 8 7
5 5 6 7 9 5 7
6 4 1 2 3 2 11
When it comes to political information, the Internet is the most important source for young Europeans.
52
There are many ways to stay informed about current political events. Where do you generally obtain the most information about politics? Please
select all the sources that you use.
Base: all respondents, n=6080
In %; sorted by total; multiple answers possible; Description: Top3 (green) und Bottom3 (purple) of the respective country
82
63
41
34
30
7
6
4
Internet
Television
Personal conversations
Radio
(Daily) newspapers and news magazines (print
editions)
Other sources
Tabloid newspapers
don't know / no response

FR DE GR IT PL ES UK
45 29 58 51 62 36 29
26 39 34 30 37 40 33
27 27 32 30 35 27 15
13 18 28 21 23 21 14
25 12 10 13 12 37 25
9 10 39 23 20 15 9
6 25 11 5 23 10 25
Facebook is crucial as a source for political information.
53
Where online do you usually find the most information about politics? Part 1/2
Base: all respondents, n=6080
In %; sorted by total; multiple answers possible; Description: Top3 (green) und Bottom3 (purple) of the respective country
44
34
28
20
19
18
15
Websites of newspapers and news magazines
YouTube
News websites of non-journalistic service
providers
Independent blogs
Websites of public broadcasters

FR DE GR IT PL ES UK
10 8 21 16 19 14 6
10 8 14 9 6 7 7
8 9 9 8 10 6 8
4 6 9 4 11 4 10
2 2 1 2 3 0 2
24 18 12 17 10 21 26
Other sources are of far less importance when it comes to political information.
54
Where online do you usually find the most information about politics? Part 2/2
Base: all respondents, n=6080
In %; sorted by total; multiple answers possible; Description: Top3 (green) und Bottom3 (purple) of the respective country
13
9
8
7
2
18
Forums
Emails newsletters
Other sources
Websites of tabloid newspapers
don't know / no response
The Internet is not used as a source
for political information

Public broadcasters are highly trusted in France, Germany and the UK.
55
How much do you trust the following information sources in general? Part 1/2
Base: all respondents, n=6080
In %; sorted by Top2Box total [„I trust them completely “ + „I generally trust them“]; Description: Top3 (green) und Bottom3 (purple) of the Top2Boxes of the respective country
6
6
5
6
5
5
3
31
30
30
27
25
21
23
35
35
35
31
37
39
38
16
15
16
18
17
21
18
7
8
7
12
8
8
8
6
7
7
5
8
6
9
I trust them completely I generally trust them Neither agree nor disagree
I do not generally trust them I do not trust them at all don't know / no response
FR DE GR IT PL ES UK
50 54 26 38 28 32 29
43 53 24 30 26 27 43
40 51 25 30 33 30 32
44 53 14 28 22 24 48
34 47 21 19 21 24 40
31 18 27 32 34 23 17
34 28 21 25 34 23 20
(Daily) newspapers and news magazines
(print editions)
Public television broadcasters
Websites of newspapers and news
magazines
Public television broadcasters
Websites of public broadcasters
YouTube
Private radio broadcasters

3
3
4
3
2
2
20
18
16
14
12
10
37
39
34
35
30
32
21
22
22
26
25
26
12
9
13
16
20
19
7
9
11
5
10
10
I trust them completely I generally trust them Neither agree nor disagree
I do not generally trust them I do not trust them at all don't know / no response
FR DE GR IT PL ES UK
33 22 13 26 28 22 21
23 15 19 22 28 21 15
23 11 15 22 23 26 17
23 8 15 20 27 19 10
22 11 13 15 17 13 12
17 10 12 12 13 12 12
While using Facebook heavily as a source for political information, young Europeans have little trust in it.
56
How much do you trust the following information sources in general? Part 2/2
Base: all respondents, n=6080
In %; sorted by Top2Box total [„I trust them completely “ + „I generally trust them“]; Description: Top3 (green) und Bottom3 (purple) of the Top2Boxes of the respective country
Private television broadcasters
News websites of non-journalistic service
providers
Tabloid newspapers
Websites of tabloid newspapers

OUTLOOK INTO THE FUTURE

Outlook into the Future
58
In 2018, young Europeans perceive immigration less frequently
as an opportunity (2018: 30 percent, 2017: 34 percent) and more
frequently as a thread (2018: 29 percent, 2017: 29 percent) than
in the previous year. Especially in Germany, Spain, Italy, Greece
and Poland, attitudes have changed compared to 2017.
Regarding issues related to the EU, country-specific changes are
obeserved. Compared to 2017, the EURO is more likely to be
considered as an opportunity in Germany (2018: 67 percent,
2017: 56 percent), Greece (2018: 41 percent, 2017: 38 percent),
Italy (2018: 54 percent, 2017: 47 percent) and Spain (2018: 63
percent, 2017: 57 percent). Political parties that reject the EU are
evaluated more skeptical in France, Italy, Greece, Poland, Spain
and the UK. The share of young Europeans who think that
BREXIT is an opportunity has decreased. In Germany (2018: 38
percent, 2017: 33 percent) and in the UK (2018: 53 percent,
2017: 49 percent), more young people consider BREXIT as a
thread than in the previous year.
The perception of globalisation has also changed in specific
countries. While the perception of globalisation is consistent with
those of the previous year on an overall level (2018: 44 percent
opportunity, 16 percent threat; 2017: 43 percent opportunity, 19
percent threat), young Germans (2018: 53 percent opportunity,
2017: 47 percent opportunity) as well as young French (2018: 36
percent opportunity, 2017: 29 percent opportunity) are more
positive towards globalisation than in 2017. For young Greeks,
the globalisation has become less threatening (2018: 24 percent
threat, 2017: 37 percent threat). Young Poles, however, have
become far more insecure about the globalisation and perceive it
less frequently as an opportunity (2018: 40 percent opportunity,
2017: 48 percent opportunity).
The Trump presidency is consistently perceived as a threat
(eleven percent opportunity, 57 percent threat). Solely young
Poles think that the Trump presidency is rather an opportunity
(29 percent) than a threat (25 percent).

59
Do you view the following phenomenon as a threat to or an opportunity for your own life? Part 1/2
Base: all respondents, n=6080
In %
Globalisation
53 4656 47 52 59 62
48
19 20 18 26 19 19 12 22
Single currency within the EU (Euro)
Open borders within the EU
44 3653
3553
4053
39
16 19 1224 15 19 14 13
Opportunity Threat
Digitization is perceived as an opportunity, especially by young Germans, Italians, Poles and Brits.
Digitization
5645
66
38
7058 66
46
10 11 9 15 6 8 6 12
46 4967
4154
33
63
12
17 11 717 13
34
728

60
Do you view the following phenomenon as a threat to or an opportunity for your own life? Part 2/2
Base: all respondents, n=6080
In %
Immigration and emigration30
23
30
24 22 30
39 41
29
30
29
33 34 38
17 19
The United Kingdom leaving the EU (“Brexit”)
14 13 9 13 14 15 922
35 2838 28 30 34 36
53
Donald Trump as President of the USA
11 7 8 7 12
29
7 9
57 65 67 57 53
25
70 65
Opportunity Threat
Regarding immigration, young Europeans are divided. Except among young Poles, Trump is perceived as a threat.
Political parties that reject the EU
12 11 10 12 12 17 9 13
44 3949
3749 44 48 42

Compared to last year, digitization is more likely to be seen as an opportunity, immigration more as a threat.
61
Do you view the following phenomenon as a threat to or an opportunity for your own life?
Base: all respondents, 2018: n=6080, 2017: n=6000
In %
56 52 53 52 44 43 46 43
23 24 20 20 28 26 28 29
10 11 19 20 16 19 17 20
11 13 8 8 11 12 10 9
don't know / no response
Threat
Neither
Opportunity
30 3414 17 12 15 11
33 32
39 3731 31
23
29 2635 35
44 41 57
8 8 12 12 13 13 9
20172018 20172018 20172018 20172018
20172018 20172018 20172018 2018
DigitizationOpen borders within the EU
Immigration andemigration
The United Kingdom leaving the EU
Political parties that reject the EU
Donald Trump as President of the USA
Single currency within the EU (Euro)
Globalisation

Young French evaluate globalisation more positively than in 2017.
62
Do you view the following phenomenon as a threat to or an opportunity for your own life?
45 44 46 45 36 2949 52
30 28 25 24 3437
30 27
11 11 20 23 1917
11 1313 17 9 8 11 17 10 9
don't know / no response
Threat
Neither
Opportunity
23 2513 17 11 14 7
39 3446 41
37 33
21
30 32 28 3039 38
65
9 10 13 13 14 15 7
Base: all respondents from France, 2018: n=1025, 2017: n=1000
In %
20172018 20172018 20172018 20172018
20172018 20172018 20172018 2018
DigitizationOpen borders within the EU
Immigration andemigration
The United Kingdom leaving the EU
Political parties that reject the EU
Donald Trump as President of the USA
Single currency within the EU (Euro)
Globalisation

Young Germans are far more optimistic regarding digitization and the Euro than in the previous year.
63
Do you view the following phenomenon as a threat to or an opportunity for your own life?
6650 56 52 53 47
6756
18
26 19 21 2627
2127
915 18 18 12 15
7 86 9 7 9 10 12 6 8
don't know / no response
Threat
Neither
Opportunity
30 32
9 13 10 12 8
35 36
43 4129 30
19
29 2438 33
49 45 67
7 9 10 12 11 13 6
Base: all respondents from Germany, 2018: n=1000, 2017: n=1000
In %
20172018 20172018 20172018 20172018
20172018 20172018 20172018 2018
DigitizationOpen borders within the EU
Immigration andemigration
The United Kingdom leaving the EU
Political parties that reject the EU
Donald Trump as President of the USA
Single currency within the EU (Euro)
Globalisation

Young Greeks perceive immigration more as a threat than in the previous year.
64
Do you view the following phenomenon as a threat to or an opportunity for your own life?
Base: all respondents from Greece, 2018: n=510, 2017: n=500
In %
38 3847 49
35 34 41 38
32 32 20 2035
24
34 35
15 15 26 26 2437
17 2214 15 7 5 7 6 7 5
don't know / no response
Threat
Neither
Opportunity
24 3313 15 12 18
7
3634
46 4938
40
28
33 2728
2737
34
57
7 6 12 9 13 8 8
20172018 20172018 20172018 20172018
20172018 20172018 20172018 2018
DigitizationOpen borders within the EU
Immigration andemigration
The United Kingdom leaving the EU
Political parties that reject the EU
Donald Trump as President of the USA
Single currency within the EU (Euro)
Globalisation

Young Italians have become more skeptical towards immigration.
65
Do you view the following phenomenon as a threat to or an opportunity for your own life?
Base: all respondents from Italy, 2018: n=1025, 2017: n=1000
In %
70 6752 57 53 56 54 47
20 21
24 22 27 24 2831
6 719 15 15 15 13 17
4 5 5 5 5 5 5 5
don't know / no response
Threat
Neither
Opportunity
22 2814 19 12 17 12
40 3748 42
30 2929
34 30 30 3249 45 53
4 5 8 7 9 9 6
20172018 20172018 20172018 20172018
20172018 20172018 20172018 2018
DigitizationOpen borders within the EU
Immigration andemigration
The United Kingdom leaving the EU
Political parties that reject the EU
Donald Trump as President of the USA
Single currency within the EU (Euro)
Globalisation
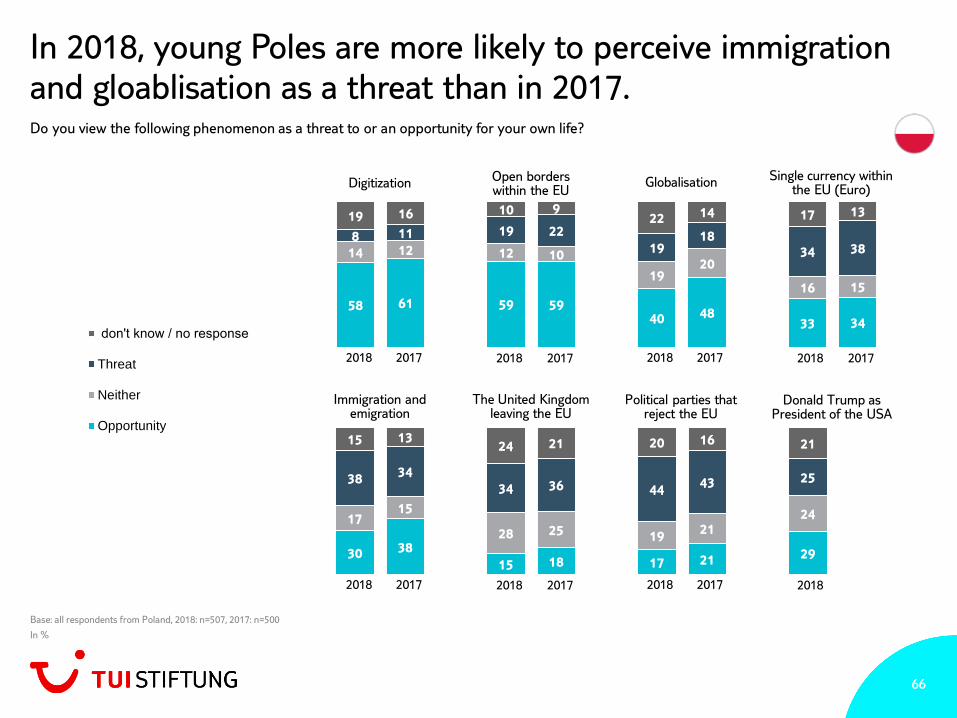
In 2018, young Poles are more likely to perceive immigration and gloablisation as a threat than in 2017.
66
Do you view the following phenomenon as a threat to or an opportunity for your own life?
Base: all respondents from Poland, 2018: n=507, 2017: n=500
In %
58 61 59 5940 48
33 34
14 12 12 10
1920
16 15
8 11 19 22
1918
34 38
19 16 10 922 14 17 13
don't know / no response
Threat
Neither
Opportunity
30 38
15 18 17 21 29
1715
28 25 1921
24
3834
34 36 4443 25
15 1324 21 20 16 21
20172018 20172018 20172018 20172018
20172018 20172018 20172018 2018
DigitizationOpen borders within the EU
Immigration andemigration
The United Kingdom leaving the EU
Political parties that reject the EU
Donald Trump as President of the USA
Single currency within the EU (Euro)
Globalisation

Perceiving immigration as an opportunity has decreased among young Spaniards.
67
Do you view the following phenomenon as a threat to or an opportunity for your own life?
Base: all respondents from Spain, 2018: n=1013, 2017: n=1000
In %
66 61 62 58 53 5163 57
25 26 21 23 28 29
2729
6 7 12 14 14 137 9
4 6 4 5 5 8 3 5
don't know / no response
Threat
Neither
Opportunity
39 46
9 12 9 11 7
4036
49 4335 36
20
17 13
36 3848 43
70
4 5 7 8 7 10 3
20172018 20172018 20172018 20172018
20172018 20172018 20172018 2018
DigitizationOpen borders within the EU
Immigration andemigration
The United Kingdom leaving the EU
Political parties that reject the EU
Donald Trump as President of the USA
Single currency within the EU (Euro)
Globalisation

Freedom of movement is more likely to be an opportunity for young Brits in 2018.
68
Do you view the following phenomenon as a threat to or an opportunity for your own life?
Base: all respondents from UK, 2018: n=1000, 2017: n=1000
In %
46 43 48 44 39 37
12 13
24 25 18 19 27 23
41 38
12 10 22 24 1315 28 32
19 2212 13 21 24 19 17
don't know / no response
Threat
Neither
Opportunity
41 3822 24
13 16 9
27 30
14 1625 26
17
19 21
53 4942 38 65
13 12 11 1120 21
9
20172018 20172018 20172018 20172018
20172018 20172018 20172018 2018
DigitizationOpen borders within the EU
Immigration andemigration
The United Kingdom leaving the EU
Political parties that reject the EU
Donald Trump as President of the USA
Single currency within the EU (Euro)
Globalisation

More than half of young Europeans are pessimistic regarding their living standard improving.
69
When you think about your parents’ generation: Do you think your own generation will be better or worse off in terms of income and quality of
life?
Base: all respondents, n=6080
In %
4
3
7
1
2
11
3
3
20
19
30
11
13
38
15
13
15
18
21
9
14
15
16
12
35
30
27
41
46
20
43
38
19
20
6
35
20
7
19
22
7
11
9
3
4
9
3
13
Much better Somewhat better It will remain the same Somewhat worse Much worse don't know/no response

Compared to 2017, Italians, Spaniards and Brits have become more pessimistic – young Poles more optimstic.
70
When you think about your parents’ generation: Do you think your own generation will be better or worse off in terms of income and quality of
life?
Base: all respondents, 2018: n=6080, 2017: n=6000
In %
4 5 3 4 7 7 1 2
20 21 19 1630 30
11 10
15 16 18 16
21 21
9 5
35 3530 38
27 28
4141
19 1720 17
6 535 41
7 6 11 8 9 9 3 2
don't know/no response
Much worse
Somewhat worse
It will remain the same
Somewhat better
Much better
2 4 11 11 3 3 3 513 18
38 36
15 21 1318
1415
15 22
1618
1212
4641
2021
4338
3839
20 17 76
19 16
2219
4 5 9 5 3 413 7
20172018 20172018 20172018 20172018
20172018 20172018 20172018 20172018

IMPRINT

Imprint
Editor
TUI Stiftung
Karl-Wiechert-Allee 4
30625 Hannover
www.tui-stiftung.de
Research
YouGov Deutschland GmbH
Gustav-Heinemann-Ufer 72
50968 Köln
www.yougov.de
72