Embed Size (px)
Citation preview

European TV market 2007 – 2013 Energy efficiency before and during the implementation of the Ecodesign and Energy Labelling regulations Second report, complemented with 2013 sales data Anette Michel, Sophie Attali, Eric Bush Topten International Services, Zurich, Switzerland 21th July 2014 Supported by the European Climate Foundation, The Hague, The Netherlands, and WWF Switzerland, Zurich, Switzerland

2
Index
ABBREVIATIONS 3
1. EXECUTIVE SUMMARY 4
2. INTRODUCTION 6
3. DATA AND METHODOLOGY 9
4. RESULTS AND INTERPRETATION 11
Sales development 11
Screen size developments 13
Price developments 15
On mode power developments 17
Technologies 23
From 2012: Energy Classes 26
Does efficiency lead to higher prices? 29
5. CONCLUSIONS 34
General 34
Evaluation of Ecodesign requirements and Energy Label 35
Recommendations for revision 37
6. REFERENCES 38
ANNEX: COUNTRY REPORTS (INCLUDING EU-‐24) 41
Germany 42
France 46
United Kingdom 50
Spain 54
Poland 58
Denmark 62
EU-‐24 66

3
Abbreviations CCFL Cold Cathode Fluorescent Lamp CRT Cathode Ray Tube EC European Commission EEI Energy Efficiency Index EU European Union EUR Euro GFK Gesellschaft für Konsumforschung, a professional market research institute HD High Definition IEC International Electrotechnical Commission LED Light Emitting Diode LCD Liquid Crystal Display MEPS Minimum Energy Performance Standard OLED Organic Light Emitting Diode TV Television Set W Watt “ Inches

4
1. Executive Summary In 2010 the first tier of the Ecodesign measures for TVs was implemented, since April 2012 tier 2 applies. The Energy Label has been compulsory since December 2011. Ecodesign and Labelling regulations are both being reviewed by the European Commission, and new Ecodesign requirements could be adopted before the end of 2014. In the first Ecodesign regulation for TVs, the basis for the decisions on the minimum efficiency requirements’ level was weak: the data was scarce, the information on energy consumption was not declared based on a defined standard, and the market was in a massive technological transformation process. For the coming revision, the chance to set ambitious Minimum Energy Performance Standards (MEPS) leading to effective energy savings should not be missed. Today all manufacturers declare the On mode power and energy efficiency of their TVs according to the Energy Label, and professional market research companies like GfK possess comprehensive and recent sales data including the Label information. The present market monitoring report analyses the developments on the European TV market regarding screen size, price, power in On mode and technologies for the years 2007 – 2013, based on sales data from GfK. For 2012 and 2013 the information on energy classes is included. The monitoring covers the EU-‐24 plus on country level: Germany, France, UK, Spain, Poland and Denmark. The results of this report support the decisions on limits for new Ecodesign requirements and possibly a new Label scale. The present report is based on a first version published in 2013 that has been updated with 2013 sales data. Two technology shifts can be observed from 2007 to 2010: the complete disappearance of CRT TVs, which were replaced by LCD-‐TVs, and later the shift from CCFL-‐backlit LCD TVs to LCD-‐TVs with LED backlight. The EU-‐sales reached a peak in 2010, when yet CCFL-‐LCD TVs were dominating. Average TV prices were reduced by 30% over the observed period, while the average screen size increased by 5.7 inches (14.5 cm, +20%). When looking at certain screen size categories instead of the entire market, the price reduction is even bigger: around 60%, depending on the screen size. Apart from TV prices also their average power in On mode was reduced. From 2008 to 2013 the average On mode power was reduced by 65% across all screen sizes, and up to 72% for large TVs (40”-‐50”). Because at the same time the average screen size increased, this actually means an impressive efficiency gain. The market monitoring report shows that these improvements were not mainly caused by the Ecodesign and Labelling regulations, but that they were the result of a ‘natural’ technology development, which happened much faster than the Commission expected when deciding on the Ecodesign requirements. The level of both tiers was much higher than the average On mode power, and the regulation was left with very limited effect. Still, the discussions leading to the measures might have lifted energy efficiency into focus and accelerated the process, especially since it became an aspect for marketing activities with the introduction of the Energy Label. In 2012, after the Label had been in place for one year, class A was the most important class regarding sales share. Across the EU, already 39% of the sales were in class A or better. By 2013 nearly 70% of the sales were in classes A and better, and 24% already in classes A+ and A++. The Energy Label continues to pull the market to higher efficiency: the number of A++ TVs on Topten lists is increasing, and also small A+ TVs have recently emerged on the market.

5
The reduction in average declared On mode power by 65% between 2008 and 2013 is impressive. Since 2008 the gains in efficiency on a power per screen area basis have been clearly stronger than the trend to larger screen sizes, and could realise considerable energy savings. How the effective electricity consumption by TVs has developed since 2008 and even before the market transformation to flat panel TVs is not clear. Several factors drive the electricity consumption to higher values than declared for single TVs or to higher values than some years ago for the entire EU. First, the actual time in On mode is not known. While it will be different for (larger) living room TVs than for (smaller) secondary TVs, due to increased functionality, it will be on average higher than before the technology shift. Second, once brightness, contrast or other settings have been changed by the user compared to the standardised settings, the actual energy consumption of TVs can easily be 30% higher than what is declared. And as a third point, the consequence of the massive sales peak is now installed in Europe’s living and also sleeping rooms and will continue to consume electricity for the next decade. The sales peak reached its maximum before the Ecodesign regulation applied (let alone the Energy Label) and before the gains in efficiency could compensate for the increased size and functionality of the new LCD technologies: while by 2012 the average On mode power was back at the level of the old CRT TVs (70W), during the boom years it had been between 30% (2011: 95W) and 100% (2009: 140W) higher than the 2012 average of 70W. In 2013 the average On mode power was 55W. In the revision, ambitious MEPS should be set, in order to make sure that the extra energy consumption caused by the huge sales peak due to the technology market shift to digital and LCD TVs can be compensated for by further efficiency improvements: class A should be defined as MEPS from 2015, A+ as future requirement, following soon. From an LLCC-‐point of view, strict MEPS are favourable: the price of TVs is not related to efficiency, but to screen size (and other functions). Additionally the efficiency approach should be improved so that stronger weight is given to absolute consumption. A progressive or even capped efficiency approach (requiring larger TVs to be of higher efficiency than smaller ones to reach the same energy class) for both the Ecodesign requirements and even more importantly for the Energy Label would stop supporting the trend to larger screen sizes. The present report also demonstrates the value of a market monitoring based on sound sales data. A systematic market monitoring in the EU for all products with an Energy Label in place is a relatively easy task, but would bring a lot: it would allow evaluating the impact of implementing measures, deciding on the need for a revision of Energy Labels or Ecodesign requirements in time, basing decisions on the actual design of these instruments on complete and recent market data, and, after a few years, it would provide a sound basis for stock and energy consumption models.

6
2. Introduction TVs: market development, standards and product policies The preparatory study on TVs was started in early 2006, and published in 2007. At the same time, the measurement standard was revised to introduce a different methodology to measure the TVs On mode power. The Ecodesign regulation for TVs was adopted in July 2009 (EC, July 2009), the Energy Labelling regulation in September 2010 (EC, September 2010). During these years and up to now the market changed dramatically: the formerly dominating Cathode Ray Tube (CRT) TVs completely disappeared from the market and were replaced by flat panel TVs – mainly by Liquid Crystal Display (LCD) TVs. This development was to a large extent drawn by the change from analogue to digital TV broadcasting, the trend to high resolution (HD) displays, and went hand in hand with a trend to larger screens (Stobbe et al., 2007). Since 2012 Light Emitting Diode (LED)-‐backlit LCD-‐TVs are dominating the market, and current driving forces to market development are trends towards internet connectivity, 3D or ultra high definition TVs (European Commission, 2012). It is expected that in the mid-‐term Organic Light Emitting Diode (OLED)-‐TVs will start the next fundamental market change. The most important steps in TV standardisation and policy making since 2007 are briefly presented below.
a) August 2007: preparatory study finalised Started in early 2006, the preparatory study on TVs was finalised in August 2007 (Stobbe et al., 2007). Sales data used in the study was from 2003 and 2004, when CRT TVs were still clearly dominating the market. The authors of the preparatory study stated that a fast development was happening at the time of research and that it was ‘difficult to give a precise evaluation of the mid to long term situation’ (Stobbe et al., 2007). LCD and Plasma TVs had newly entered the market and started to replace CRT TVs. The study recommended introducing an Energy Label and a maximum On mode power requirement. The authors suggested defining these requirements along the current average power level for different screen sizes, to gain experience based on the new measurement standard and to adapt the requirements later. A first energy labelling scheme was proposed in the preparatory study.
b) October 2008: Publication of IEC 62087:2008 measurement standard Already since 2004 experts from major TV manufacturers and independent international experts were involved in the development of the new IEC dynamic test signal methodology. IEC 63087:2008, published in October 2008, was the first international test standard to introduce a test methodology based on a dynamic broadcast signal for measuring the average On mode power of TVs (IEC, 2008). The authors of the preparatory study recommended basing the Ecodesign and Labelling declarations on this methodology (Stobbe et al., 2007). Before 2008, according to IEC 62087:2003, a static three-‐bar black & white test pattern was used. Many manufacturers however also declared maximum power, established for safety testing (Harrison, 2013).
c) October 2008: Consultation Forum A working document (WD) on Ecodesign requirements for TVs was discussed at a Consultation Forum (CF). This was not the first WD but a version that had already been updated (eceee, ‘products and status’).
d) March 2009: Final Ecodesign draft The Regulatory Committee approves the final draft of the Ecodesign regulation.
e) May 2009: Rejection of Energy Labelling draft The energy labelling proposal is rejected by the European Parliament. The labelling scale in the proposal was based on the ‘A-‐20%’ format. The Parliament claimed that the Labelling format was confusing to consumers (the same day however the Parliament adopted a new Energy Label for refrigerators and freezers based on the same format) (Euractiv, 2009).
7
f) July 2009: adoption of the Ecodesign regulation The European Commission adopts the Ecodesign regulation on TVs (EC, July 2009). It enters into force in August 2009, and after one year the requirements regarding maximum On mode power apply. The requirements on Standby and Off mode power (max. 1W / 2W) apply already from January 2010.
g) February 2010: new Energy Labelling draft A new Energy labelling draft is circulated for stakeholders’ comments. The labelling scale is now based on the A+ format, which is in line with the recast of the Energy Labelling Directive to be adopted in May 2010 (EC, May 2010). The A class limit has been shifted to a 20% more ambitious level compared to the proposal from 2009. Soon after (in March), a classification scale with an even more ambitious class limit is circulated. This scale will be adopted in September.
h) August 2010: tier 1 On mode power applies New TV models put on the market after this date are required to have a power consumption in On mode corresponding to class F or better (‘normal’ resolution). Full HD TVs can have higher power, as defined in the regulation. Thus, class G is partly banned from August 2010.
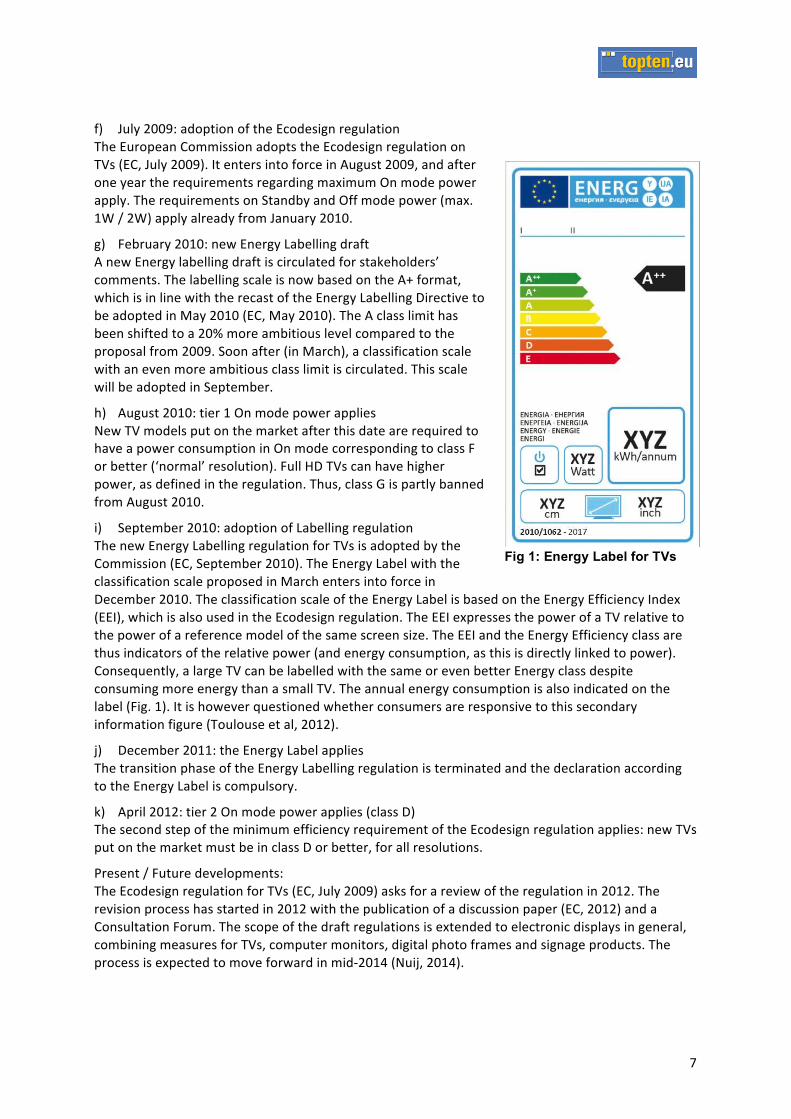
i) September 2010: adoption of Labelling regulation The new Energy Labelling regulation for TVs is adopted by the Commission (EC, September 2010). The Energy Label with the classification scale proposed in March enters into force in December 2010. The classification scale of the Energy Label is based on the Energy Efficiency Index (EEI), which is also used in the Ecodesign regulation. The EEI expresses the power of a TV relative to the power of a reference model of the same screen size. The EEI and the Energy Efficiency class are thus indicators of the relative power (and energy consumption, as this is directly linked to power). Consequently, a large TV can be labelled with the same or even better Energy class despite consuming more energy than a small TV. The annual energy consumption is also indicated on the label (Fig. 1). It is however questioned whether consumers are responsive to this secondary information figure (Toulouse et al, 2012).
j) December 2011: the Energy Label applies The transition phase of the Energy Labelling regulation is terminated and the declaration according to the Energy Label is compulsory.
k) April 2012: tier 2 On mode power applies (class D) The second step of the minimum efficiency requirement of the Ecodesign regulation applies: new TVs put on the market must be in class D or better, for all resolutions.
Present / Future developments: The Ecodesign regulation for TVs (EC, July 2009) asks for a review of the regulation in 2012. The revision process has started in 2012 with the publication of a discussion paper (EC, 2012) and a Consultation Forum. The scope of the draft regulations is extended to electronic displays in general, combining measures for TVs, computer monitors, digital photo frames and signage products. The process is expected to move forward in mid-‐2014 (Nuij, 2014).
Fig 1: Energy Label for TVs
8
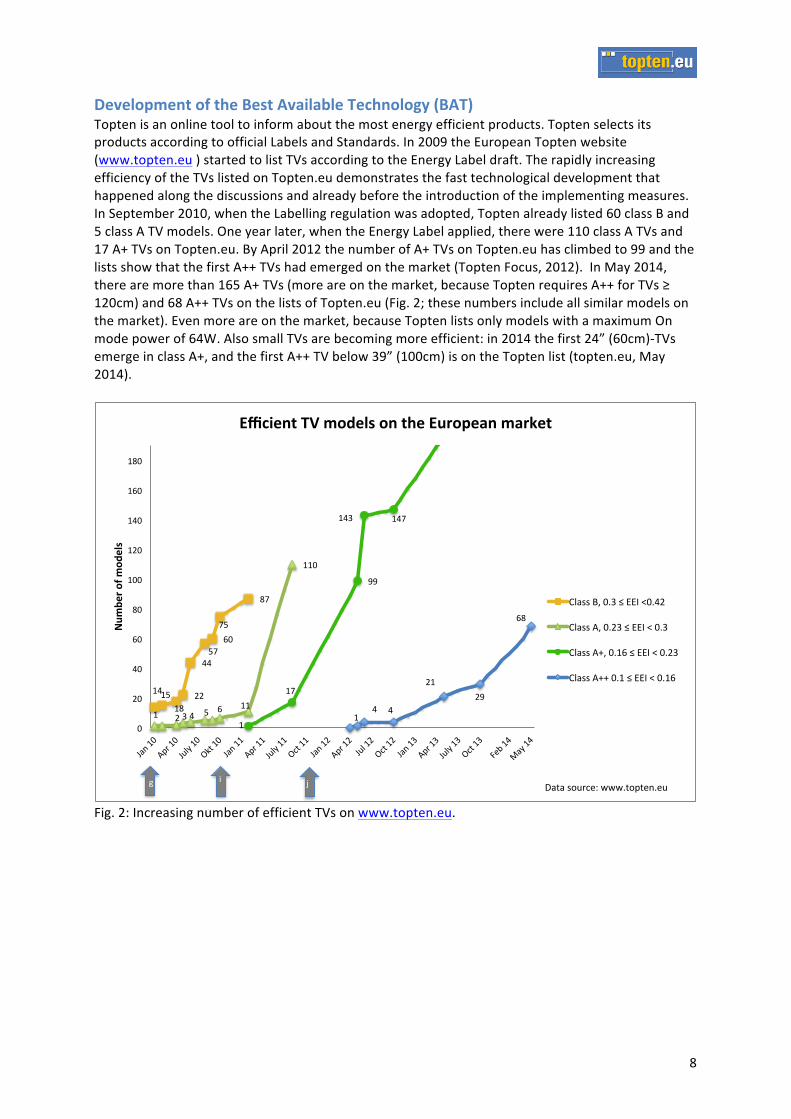
Development of the Best Available Technology (BAT) Topten is an online tool to inform about the most energy efficient products. Topten selects its products according to official Labels and Standards. In 2009 the European Topten website (www.topten.eu ) started to list TVs according to the Energy Label draft. The rapidly increasing efficiency of the TVs listed on Topten.eu demonstrates the fast technological development that happened along the discussions and already before the introduction of the implementing measures. In September 2010, when the Labelling regulation was adopted, Topten already listed 60 class B and 5 class A TV models. One year later, when the Energy Label applied, there were 110 class A TVs and 17 A+ TVs on Topten.eu. By April 2012 the number of A+ TVs on Topten.eu has climbed to 99 and the lists show that the first A++ TVs had emerged on the market (Topten Focus, 2012). In May 2014, there are more than 165 A+ TVs (more are on the market, because Topten requires A++ for TVs ≥ 120cm) and 68 A++ TVs on the lists of Topten.eu (Fig. 2; these numbers include all similar models on the market). Even more are on the market, because Topten lists only models with a maximum On mode power of 64W. Also small TVs are becoming more efficient: in 2014 the first 24” (60cm)-‐TVs emerge in class A+, and the first A++ TV below 39” (100cm) is on the Topten list (topten.eu, May 2014).
Fig. 2: Increasing number of efficient TVs on www.topten.eu.
!"#!$#!%#
&&#
""#$'#
()#'$#
%'#
!# &#*#"# $# (# !!#
!!)#
!#
!'#
++#
!"*# !"'#
!#"# "#
&!#&+#
(%#
)#
&)#
")#
()#
%)#
!))#
!&)#
!")#
!()#
!%)#
,-.#!)#
/01#!)#
,234#!)#
567#!)#
,-.#!!#
/01#!!#
,234#!!#
587#!!#
,-.#!&#
/01#!&#
,23#!&#
587#!&#
,-.#!*#
/01#!*#
,234#!*#
587#!*#
9:;#!"#
<-4#!"#
!"#
$%&'(
)'#(*
%+,'
-./0%12'34'#(*%+,'(1'25%'-"&(6%71'#7&8%2'
=3->>#?@#)A*#B#CCD#E)A"&##
=3->>#/@#)A&*#B#CCD#E#)A*#
=3->>#/F@#)A!(#B#CCD#E#)A&*#
=3->>#/FF#)A!#B#CCD#E#)A!(#
8#-# G# H# I-7-#>J218:K#LLLA7J07:.A:2#M#

9
3. Data and Methodology
Coverage GfK is a professional market analysis company present around the world. In Europe GfK covers over 90% of the markets in all 28 Member States, including major online shops. Sales data plus many product characteristics are obtained from retailers. GfK is an expert on market data, Topten has the expertise on Energy issues such as policy and standards. For this market monitoring, TV sales data were obtained from GfK, for the years 2007 – 2012, in the EU-‐24 plus sales at country level for six countries (table 1). In 2014 the report was complemented with 2013 sales data. Table 1: Countries covered and population Country Population1 Average persons per
household1 EU-‐24* 499.3 Mio 2.37 Germany 81.7 2.05 France 64.7 2.35 UK (without Northern Ireland)
62 2.22
Spain 46 2.65 Poland 38.1 2.81 Denmark 5.5 2.38 * EU-‐24 includes Germany, Denmark, United Kingdom, Italy, Poland, Spain, Austria, Belgium, Bulgaria, Estonia, Finland, France, Greece, Hungary, Ireland, Latvia, Lithuania, Netherlands, Portugal, Czech Republic, Romania, Slovakia, Slovenia and Sweden.
For the years 2007 – 2011 sales numbers, price and annual energy consumption as declared for different size categories and TV technologies were retrieved. As power was not available, it was re-‐calculated from annual energy consumption. From 2008 -‐ 2010 it is estimated that about 80% of the TVs power were declared according to the IEC 62087:2008 standard. Annual energy consumption was declared according to the calculation formula that was included in the Energy Labelling regulation later (E= P*1.46; E= Annual Energy Consumption, P= Power in On mode) (for more details on measurement and calculation methods see below). After November 2011 the Energy Label for TVs became compulsory (EC, Sep 2010). So, for the 2012 and 2013 datasets also the energy efficiency class was included. No information on brands or models is included.
On mode power – changing measurement methods Between 2007 and 2010 the declaration of the TVs On mode power changed, because a new measurement methodology was introduced. IEC 62087:2008 was the first international measurement standard to introduce a testing methodology based on a dynamic broadcast signal for measuring the On mode power of TVs. The Ecodesign regulation (EC, July 2009) refers to a dynamic measurement method. Since 2010 On mode power of TVs on the European market is declared according to this measurement method. Experts were developing the new test standard since 2004 already. Also the authors of the preparatory study recommended the new method based on the dynamic broadcast content signal to be referred to for the Ecodesign and Energy Labelling regulations in 2006/2007 (Stobbe et al., 2007). At the same time it was decided that annual energy consumption would be declared, based on an assumed daily use duration in On mode of four hours and not considering low power modes. Major manufacturers started to apply this methodology from 2008 (Harrison, 2013).
1 Data from Eurostat: http://epp.eurostat.ec.europa.eu/portal/page/portal/eurostat/home/

10
Which of the On mode power testing methods (static 3-‐bar signal of IEC 62087:2003, dynamic signal contained in IEC 62087:2008 or maximum On mode power as declared for safety testing) and which annual energy consumption calculation methods were used in the declarations before 2008 is not known. Additionally before 2010 there was no obligation to declare a power or energy consumption value according to a given test standard. Therefore the power values before 2009 / 2010 should be interpreted with caution. It is assumed that for 2008 – 2009 about 80% of the TVs were declared according to the measurement and calculation methods used today in the Energy Labelling regulation for TVs (Harrison, 2013).
Missing detail information for CRT TVs in Poland, Germany and Denmark Sales of CRT TVs are included in the total sales and in the average price, but no detail information such as size, price or power/energy consumption is available for CRT TVs sold in Poland, Germany and Denmark. This has an effect on the size related figures for the year 2007 – 2009, which therefore have to be interpreted with this gap in mind. After 2010, CRT sales were 0 in these countries, and the missing information concerns only the years before. For the EU, the information gap is partial: only for a part of the CRT sales the information is missing (2007: 41% of CRT, 2008: 36%, 2009: 25%). The table below shows for which countries and years the information is missing, and to what extent. Table 2: Missing detail information on CRT sales Proportion % of Total sales / % of CRT sales
Poland Germany Denmark EU-‐24
2007 78% / 100% 33% / 100% 8% / 100% 10.5% / 41% 2008 20% / 100% 10% / 100% 2% / 100% 4% / 36% 2009 4% / 100% 2% / 100% 0% 1% / 25% 2010 -‐ 2013 CRT sales near 0 – no gap remaining While for Denmark and, apart from 2007, for Germany, the effect of the missing data can be neglected in average figures, it is considerable for Poland. For 2007 for almost 80% of the sale the detail information on size, price and power is not available, and the concerned figures are therefore invalid.
Not included: Standby power and total energy consumption Information on Standby and Off mode power is not included in this TV market monitoring report. These were certainly relevant modes for the energy consumption before the TVs Ecodesign regulation became effective in 2010, which limited the power of these modes to maximally 2W. Before 2009 Standby and Off mode power were not declared in a standardised way, and since 2010 these low power modes are no longer crucial for the total energy consumption. The market monitoring report does not present total energy consumption values, even though this figure can be calculated from the On mode power and the sales – based on the calculation formula used for the Energy Label. The Labelling regulation assumes a daily On mode duration of 4 hours (EC, Sep 2009), based on the findings from the preparatory study (Stobbe et al., 2007). The authors of the preparatory study expected that the On mode duration per day would rise to an average of 5 hours in the future. Daily viewing time may differ between countries, but also for different TVs. The DEFRA study ‘Powering the nation’ from 2012 for instance found an average daily TV watching time of six hours in UK, the average household possessing 2.3 TVs (EST/DEFRA, 2012). The study does not differentiate between different TV sets. Assuming that larger TVs are used in the living room than in the sleeping room and that average viewing times for the two TV types differ, this influences the total energy consumption. Considering this, the different methods used for declaring the On mode power over the years plus the decreasing importance of the low power modes (without having information on it) it was decided to only present On mode power figures instead of annual energy

11
consumption. The data presented however allows deriving estimations on the evolution of TVs' energy consumption in Europe.
4. Results and Interpretation Sales development
Figure 3: Total annual TV sales in the EU-‐24 Data source: GfK From 2007 to 2010 the number of annually sold TVs increased by 50% -‐ from 37 million to 56 million units per year. These figures impressively show the impact the introduction of new technologies had (flat panel TVs, digital and HD TV). We don’t know exactly what motivation brought consumers to this increased buying activity: was it the wish to profit from the opportunities the new technologies offered, high definition (HD) picture quality, the slimmer flat panel TVs or additional functions provided by the new TV technologies? Or was it mainly the switch to digital TV, which put some pressure on consumers to replace their old TVs (whether this was necessary or not, certainly some people were afraid not to be able to receive their channels with the change to digital TV)? After 2010 the sales decreased at a similar pace – back to the level of 2007: 41 million units were sold in 2013.

12
Figure 4: TV sales per person – in countries and in the EU-‐24 Data source: GfK
Figure 5: TV sales per household – in countries and in the EU-‐24 Data source: GfK People do not show the same readiness to buy new TVs all over Europe; there are considerable differences between countries (Fig. 4). Most striking is the buying behaviour of UK consumers: in 2007 the British bought almost twice as many TV sets per person as the EU average. UK is considered a very mature TV market, with a penetration rate of 2.3 TV sets per household (EST/DEFRA, 2012). At the other end of the scale is Poland: from 2007 to 2011 Polish were around 50% less likely to buy a new TV than the EU average. Contrarily to the other countries however in Poland sales continued to increase until 2013.

13
When dividing the sales by the number of households instead of persons and thus considering for different household sizes, the outcome is not changed much, but some of the differences between countries become smaller (Fig. 5). For countries with rather large household sizes like Spain and Poland the relative sales are a bit higher when considered on a per-‐household than on a per-‐person basis, while for Germany, having the smallest household size of the EU, the relative sales become a bit smaller. Figures 4 and 5 cannot be interpreted without also looking at figures 6 and 7, which shows the trends in average screen size in the countries. These figures impressively show the strong and on-‐going trend towards larger screen sizes.
Screen size developments Screen sizes are in inches of the diagonal. The table below provides a translation into centimetres. Table 3: inches-‐cm conversion (1 inch = 2.54 cm) Inches (“) cm 20” 51 30” 76 40” 102 50” 127 60” 152
Figure 6: TV sales in the EU-‐24: percentage of different screen size categories Data source: GfK. ‘’ = inches. Because of rounding the total sales can sum up to 101%.
Not only more TVs were bought, but also larger ones: Figure 6 shows the on-‐going trend towards larger screens. Between 2007 and 2013 the sales have generally shifted to larger screen sizes. Figure 6 shows a constant decrease of the sales proportion of very small TVs (screen diagonal < 20 inches) and a constant increase for the large size categories (screen diagonal between 40 and 50 inches and 50 to 60 inches). TVs between 40 and 50 inches became very popular: the sales proportion of this size category more than doubled from 15% to 32% to become nearly equally popular as 30” – 40” TVs (35% in 2013). 30” – 40” TVs have remained the most popular size category during these years,

14
only showing some fluctuations over the observed years. TVs between 20 and 30 inches seem to become less popular after years without clear trend. This graph can be interpreted with the trend towards two or more TVs per household in mind. While living room TVs are clearly getting larger, TVs bought to be placed in bedrooms will usually be smaller but assumedly also with a trend to larger screens.
Fig. 7: TV sales in countries and EU – average screen size Data source: GfK.
Across the EU-‐24, the average screen diagonal increased from 29.3” (74.4cm) by 4.5 inches (+11.4 cm) to 35” (89 cm) between 2007 and 2013 – equalling an increase of 20%. Figure 7 also shows that in the UK, where people buy most TVs, they buy smaller TVs than in other countries (only in Spain and, in 2011 in France, people bought on average similarly small TVs). In the UK the smaller average size will be a result from a high sales percentage of secondary TVs, which are placed in the sleeping room or kitchen. These TVs are smaller than living room TVs. The contrary applies to Poland, where comparatively few but rather large TVs are sold. Are these mostly living room TVs, and therefore on average larger? The number of TVs Germans buy is close to the European average, but the average screen size is among the largest. In France the trend towards larger screen size stopped in 2009 for two years, and the sales per person remained near the EU-‐average. Also in Spain TV sales per person were near the EU-‐average, but dropped to lower values after 2010. The average screen size remained one of the smallest of the countries looked at here during all these years. Danish TV consumers compete with Germans and Polish for the largest average screen size, while sales per person increased to values a bit higher than the EU average. Looking at the detail screen sizes and the 2012 EU sales, 40’’ – 43’’ and especially 32” turn out to be by far the most popular screen sizes (Fig. 8): these two categories together accounted for 52% of the sales in 2013 (32’’: 30%; 40’’ – 43’’: 22%). A third sales peak is at around 20”, assumedly mostly secondary TVs, and increasingly so a fourth at 46” – 47”. In all countries these four screen sizes were most popular in 2013, but with different preferences for the two large size categories and different weight of the small TVs (see Annex with country reports).

15
Fig. 8: Sales of TV sizes in the EU-‐24, 2012 and 2013. Data source: GfK.
Price developments
Fig. 9: Average TV prices in EU and countries Data source: GfK Despite growing screen sizes, average TV prices in general decreased from 2007 to 2013, at a slowing rate which seems to have stopped in 2011. A look at prices of specific screen sizes however reveals that the increasing average screen size is responsible for the slowing of the price reduction (see below). Average price reduction in the EU was 30% from 2007 to 2013. The price decrease over these years was smallest in Poland (-‐21%) and Germany (-‐22%), and strongest in Denmark (-‐43%) and

16
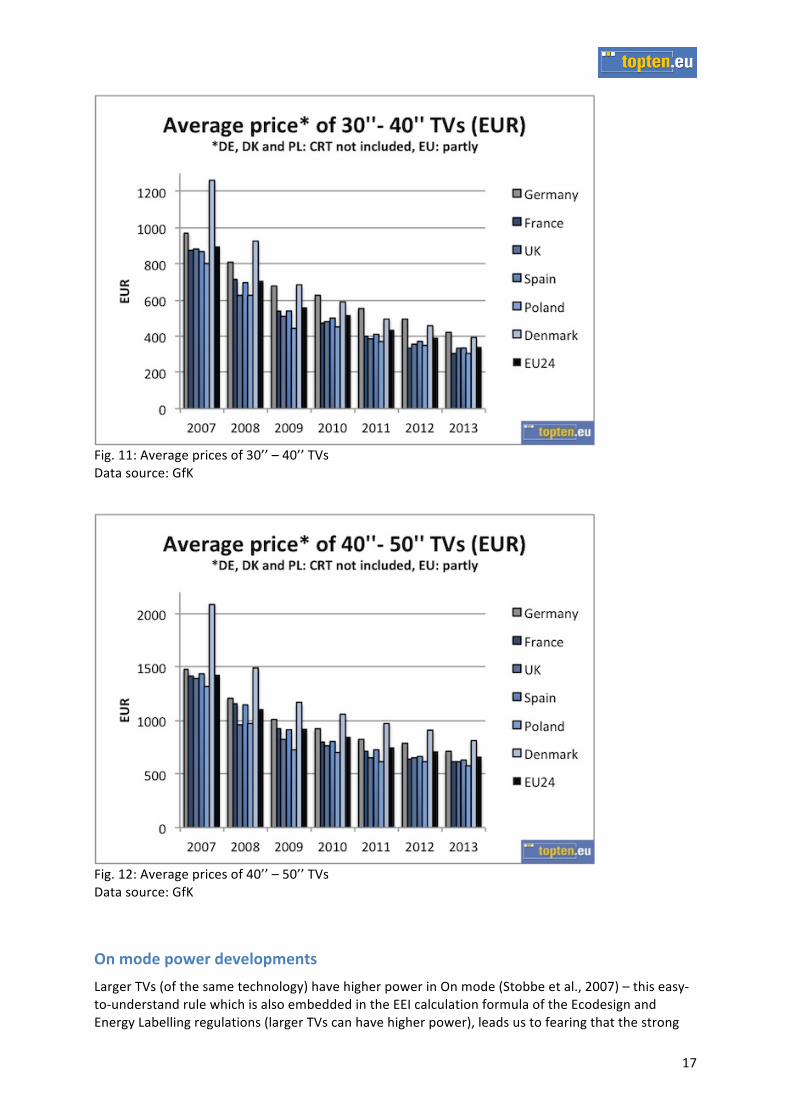
France (-‐40%). Not surprisingly, the two countries with lower average screen size, UK and Spain, also pay the lowest average prices for their new TVs. Prices in Poland have been similarly low, probably mostly due to the relative Purchasing Power (PP)2 compared to the other countries. French average prices decreased to be among the lowest after 2010, more or less in line with decreasing screen sizes. In Denmark, which has the highest PP of all EU Member States and where large TVs are favoured, the highest average TV prices are paid. TV prices became more levelled over the years. In 2007 and 2008 for some large TVs very high prices were paid: e.g. an average of almost 19’000 € for 278 Plasma TVs over 60” in Denmark in 2007, or an average of close to 44’000 € for 6 LED TVs larger than 60” across the EU-‐24 in the same year (22’200 € for 87 of the same category in 2008). A sensitivity analysis showed that the results on average price and power are not strongly influenced by these few models, so they were kept in the dataset for all calculations. Such very high average prices disappear completely after 2009. Looking at single screen size categories, the reduction in price is even more impressive and is continuing up to 2013: across the EU-‐24 prices for 20”-‐30” TVs were reduced by 54% from 2007 to 2013 (Fig. 10), by 62% for 30”-‐40” TVs (Fig. 11) and by 54% for 40”-‐50” TVs (Fig. 12). For small TVs below 20” the price reduction in this period was 40%, for large TVs (50”-‐60”) 44%. The price reduction was the strongest in the most popular screen size category of 30”-‐40” TVs. Figure 9 includes all screen sizes. The sales of large TVs (with higher average prices) getting higher over time lead to a smaller average price reduction than when looking at specific screen sizes. Figures 10-‐12 may still include a shift to larger screens within the 10”-‐categories, but the 50% price reduction in these figures are certainly closer to the ‘real’ price reduction than the 30% in figure 9.
Fig. 10: Average prices of 20’’ – 30’’ TVs Data source: GfK
2 Source: Eurostat http://epp.eurostat.ec.europa.eu/statistics_explained/index.php/Comparative_price_levels_of_consumer_goods_and_services
17
Fig. 11: Average prices of 30’’ – 40’’ TVs Data source: GfK
Fig. 12: Average prices of 40’’ – 50’’ TVs Data source: GfK
On mode power developments Larger TVs (of the same technology) have higher power in On mode (Stobbe et al., 2007) – this easy-‐to-‐understand rule which is also embedded in the EEI calculation formula of the Ecodesign and Energy Labelling regulations (larger TVs can have higher power), leads us to fearing that the strong
18
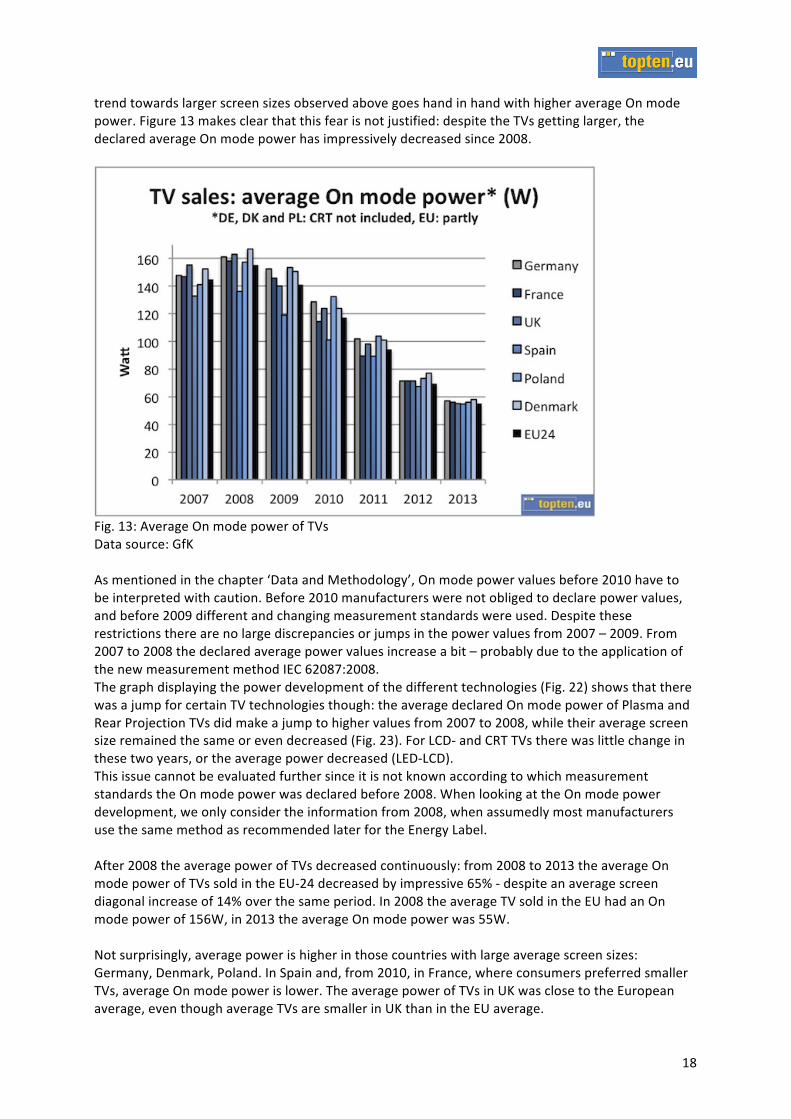
trend towards larger screen sizes observed above goes hand in hand with higher average On mode power. Figure 13 makes clear that this fear is not justified: despite the TVs getting larger, the declared average On mode power has impressively decreased since 2008.
Fig. 13: Average On mode power of TVs Data source: GfK As mentioned in the chapter ‘Data and Methodology’, On mode power values before 2010 have to be interpreted with caution. Before 2010 manufacturers were not obliged to declare power values, and before 2009 different and changing measurement standards were used. Despite these restrictions there are no large discrepancies or jumps in the power values from 2007 – 2009. From 2007 to 2008 the declared average power values increase a bit – probably due to the application of the new measurement method IEC 62087:2008. The graph displaying the power development of the different technologies (Fig. 22) shows that there was a jump for certain TV technologies though: the average declared On mode power of Plasma and Rear Projection TVs did make a jump to higher values from 2007 to 2008, while their average screen size remained the same or even decreased (Fig. 23). For LCD-‐ and CRT TVs there was little change in these two years, or the average power decreased (LED-‐LCD). This issue cannot be evaluated further since it is not known according to which measurement standards the On mode power was declared before 2008. When looking at the On mode power development, we only consider the information from 2008, when assumedly most manufacturers use the same method as recommended later for the Energy Label. After 2008 the average power of TVs decreased continuously: from 2008 to 2013 the average On mode power of TVs sold in the EU-‐24 decreased by impressive 65% -‐ despite an average screen diagonal increase of 14% over the same period. In 2008 the average TV sold in the EU had an On mode power of 156W, in 2013 the average On mode power was 55W. Not surprisingly, average power is higher in those countries with large average screen sizes: Germany, Denmark, Poland. In Spain and, from 2010, in France, where consumers preferred smaller TVs, average On mode power is lower. The average power of TVs in UK was close to the European average, even though average TVs are smaller in UK than in the EU average.
19
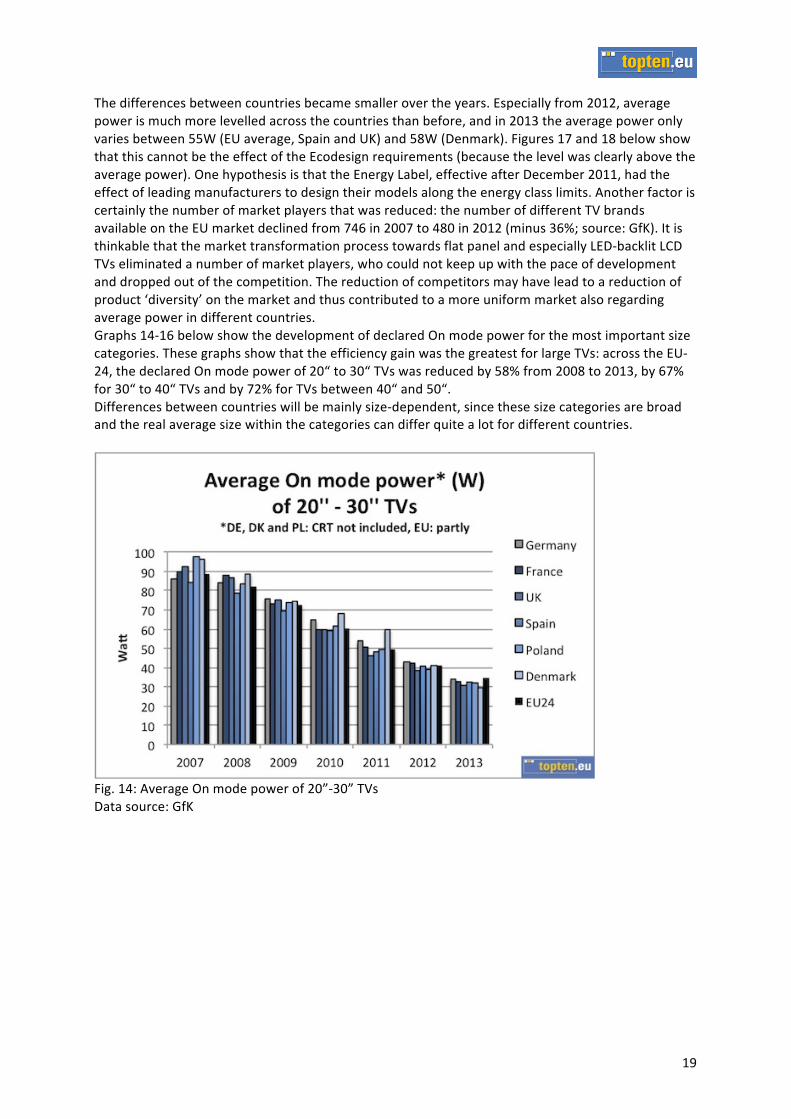
The differences between countries became smaller over the years. Especially from 2012, average power is much more levelled across the countries than before, and in 2013 the average power only varies between 55W (EU average, Spain and UK) and 58W (Denmark). Figures 17 and 18 below show that this cannot be the effect of the Ecodesign requirements (because the level was clearly above the average power). One hypothesis is that the Energy Label, effective after December 2011, had the effect of leading manufacturers to design their models along the energy class limits. Another factor is certainly the number of market players that was reduced: the number of different TV brands available on the EU market declined from 746 in 2007 to 480 in 2012 (minus 36%; source: GfK). It is thinkable that the market transformation process towards flat panel and especially LED-‐backlit LCD TVs eliminated a number of market players, who could not keep up with the pace of development and dropped out of the competition. The reduction of competitors may have lead to a reduction of product ‘diversity’ on the market and thus contributed to a more uniform market also regarding average power in different countries. Graphs 14-‐16 below show the development of declared On mode power for the most important size categories. These graphs show that the efficiency gain was the greatest for large TVs: across the EU-‐24, the declared On mode power of 20“ to 30“ TVs was reduced by 58% from 2008 to 2013, by 67% for 30“ to 40“ TVs and by 72% for TVs between 40“ and 50“. Differences between countries will be mainly size-‐dependent, since these size categories are broad and the real average size within the categories can differ quite a lot for different countries.
Fig. 14: Average On mode power of 20”-‐30” TVs Data source: GfK

20
Fig. 15: Average On mode power of 30”-‐40” TVs Data source: GfK
Fig. 16: Average On mode power of 40”-‐50” TVs Data source: GfK The reduction in average declared On mode power is impressive, and especially in combination with the increased average screen size it is proof of large gains in efficiency (on a power per screen area basis). The graph does however not answer the question on the role of the Ecodesign regulation in this development. Obviously most of the trends leading to higher efficiency (e.g. flat panel TVs, LED-‐backlight) had started a long time before the implementation of the Ecodesign regulation. So, does the graph above show a ‘natural’ market development that would have equally happened without implementing

21
measures, or did the Ecodesign regulation lead to the product improvements? Toulouse et al. (2012) state that the On mode power requirements of the Ecodesign regulation have had practically no impact on the market, because both tier 1 and 2 requirements were already met by most main manufacturers. Also the Evaluation of the Ecodesign Directive from 2012 (CSES, 2012) concludes that the Ecodesign requirements for TVs were at a lower level (in terms of energy efficiency) than many products already on the market, and that more ambitious requirements could have been introduced. The detail market data on power for specific screen sizes allows investigating this question further. In order to find out more about the effect of the Ecodesign regulation we need to look at certain screen sizes, since the ‘cut-‐off’ level of the Ecodesign regulation is dependent on the screen size. The two most popular screen sizes (32” and 40” – 43”) are selected for the detail analysis regarding On mode power development. The arrows in figures 15 and 16 indicate the progress in standardisation, policy making and implementation. It should be noted that before decisions were taken, yearlong discussions including the industry (and other stakeholders) took place. Most manufacturers were thus aware of the standards’ and regulations’ content some time before their publication.
Fig. 17: Average On mode power of 32” TVs, with Ecodesign requirements tier 1 (Aug 2010) and tier 2 (April 2012). Data source: GfK
Overview on steps in standardisation and policy making and implementation for TVs a) August 2007: preparatory study finalised b) October 2008: Publication of IEC 62087:2008 c) October 2008: Consultation Forum d) March 2009: Final Ecodesign draft e) May 2009: Rejection of Energy Labelling draft f) July 2009: adoption of Ecodesign g) February 2010: new Energy Labelling draft h) August 2010: application of tier 1 On mode power i) September 2010: adoption of Labelling regulation j) December 2011: application of Energy Label k) April 2012: application tier 2 On mode power (class D)

22
Fig. 18: Average On mode power of 40”-‐43” TVs, with Ecodesign requirements tier 1 (Aug 2010) and tier 2 (April 2012). Data source: GfK For the 40’’ – 43’’ TVs, the Ecodesign limits were calculated for a screen size of 41.5 inches. The average On mode power of 32’’ TVs shows an increase from 2007 to 2008, which is not the case for 40’’ to 43’’ TVs. Then the average On mode power started to drop continuously for both size categories, as for the total sales average (Fig. 8). Between 2008 and 2013 the average On mode power decreased by 68% to 48W for 32’’ and to 66W (-‐73%) for 40’’ – 43’’ TVs. Tier 1 of the Ecodesign requirements on On mode power applied from August 2010. For both screen sizes considered here, the level of tier 1 was close to the average power from 2008, but clearly higher than the average power in 2010. For 32” TVs the limits were 31% (full HD) and 18% (other resolutions) above the average power, for 40” – 43”-‐TVs 45% (full HD) and 31% (other resolutions). The percentage of full HD TV sales was not assessed in this study. In April 2012 the tier 2 On mode power requirement applied, corresponding to class D. A quick glance forward at fig. 24 shows that class D had almost entirely disappeared from the EU-‐market in 2012, and that this measure must have been of very little impact: only 1% of the TVs sold in the EU in 2012 were class D TVs – the least efficient class still allowed on the market. For both screen size categories in figs. 9 and 10 below the Ecodesign limit was even more above the average power of the complete 2012 sales than for tier 1: for 32’’ TVs than the second Ecodesign limit was 66% above the average On mode power, for 40’’ – 43’’ TVs it was even was even 105% higher. The average power of this latter size category was below the tier 2 limit in 2010 already. Based on these figures we can agree with the studies mentioned above (Toulouse et al, 2012, and CSES, 2012) and conclude that, for the two most important screen sizes, all On mode power limits of the Ecodesign regulation had practically no impact on the market. The efficiency development was happening anyway, the Ecodesign regulation did not have any effect on it. The discussions about energy efficiency may however have supported the technological development to focus also on this aspect, and not only on increasing screen size and additional functions. (The impact of the energy labelling regulation is discussed below).

23
Technologies From 2007 to 2012/13 two interesting market transformations regarding technology happened: Cathode Ray Tube (CRT) TVs disappeared completely from the market and were replaced by flat panel TVs (LCD and Plasma), and the first generation of Liquid Crystal Display (LCD)-‐TVs (with Cold Cathode Fluorescent Lamps (CCFL)-‐backlight) was replaced by the next LCD-‐generation, using Light Emitting Diodes (LED) for the backlight (Figs. 19 and 20). Yet in 2004 CRT TVs were dominating the market with 89% of the EU-‐sales, LCD TVs did only account for 8% of the sales (Stobbe et al., 2007). Three years later the market had changed completely and more than two thirds of the sold TVs were LCD-‐TVs. After 2008 CRT TVs were virtually gone from the EU market -‐ the last few CRT TVs were sold out in 2011. In 2009 the domination of CCFL-‐backlit LCD-‐TVs reached its peak with 87% of the sales. The first LCD-‐TVs with LED backlight had already been on the market in 2007: these were luxury products of large size (Fig. 23), high power (Fig. 22) and very high prices (Fig. 21). Screen size and especially the prices and the power of LED-‐LCD TVs were lowered in the coming years, and this technology started to replace CCFL-‐LCD TVs. Within four years the market transformation has been completed: in 2013 LCD-‐TVs with CCFL-‐backlight accounted only for 4% of the sales and LED-‐LCD TVs are dominating the market. What will the market look like in 2015 -‐ especially since the entry on the market of OLED back lighting products has been announced for some years but is not yet on the market? Where does this technology stand within the industry labs and production lines? In 2007, the Plasma technology was yet considered to have a promising future in the market segment of large TVs (36” and larger) (Stobbe et al., 2007). But this technology never reached the breakthrough and the sales share always remained below 10%. In 2012, mainly three brands were left on the market (Samsung, LG, Panasonic), and the number of models is going down. In October 2013, Panasonic announced to stop the production of Plasma TVs from March 2014 (theverge.com). Rear Projection (here: Rear Pro) TVs had been on the market already in 2000 (Stobbe et al., 2007), but it seems that the production was discontinued by the last manufacturer (Mitsubishi) in 2012. Rear Projection TVs had been of large screen size (Fig. 23), and never reached a noteworthy market share.
Fig. 19: Sales shares of different TV technologies Data source: GfK
!"#$%%#$
&#$
'#$&#$ '#$ (#$ )#$ *#$
(+#$'%#$
'&#$&)#$
"'#$
!*#$
"#$
*#$%&#$
")#$
&!#$
+!#$
,#$
!)#$
),#$
&)#$
%,,#$
!,,&$ !,,'$ !,,+$ !,%,$ !,%%$ !,%!$ !,%*$
!"#$%&'&()*+,'"+*+$,-"*.&-*!/+*012345*
-./0-1/$
-./0..2-$
3-4564$
.78$
7147$379$

24
Fig. 20: Sales of different TV technologies Data source: GfK
Fig. 21: Average price of different TV technologies Data source: GfK LCD-‐LED TVs were large and very expensive in the years of their appearance on the market (2007-‐2009), then with the new technology maturing prices came down quickly (Fig. 21). Prices of CCFL-‐LCD TVs have been at a lower level than those of LED-‐LCD TVs. Plasma TVs have still relatively high prices, but this may be linked to their large average screen size.
25
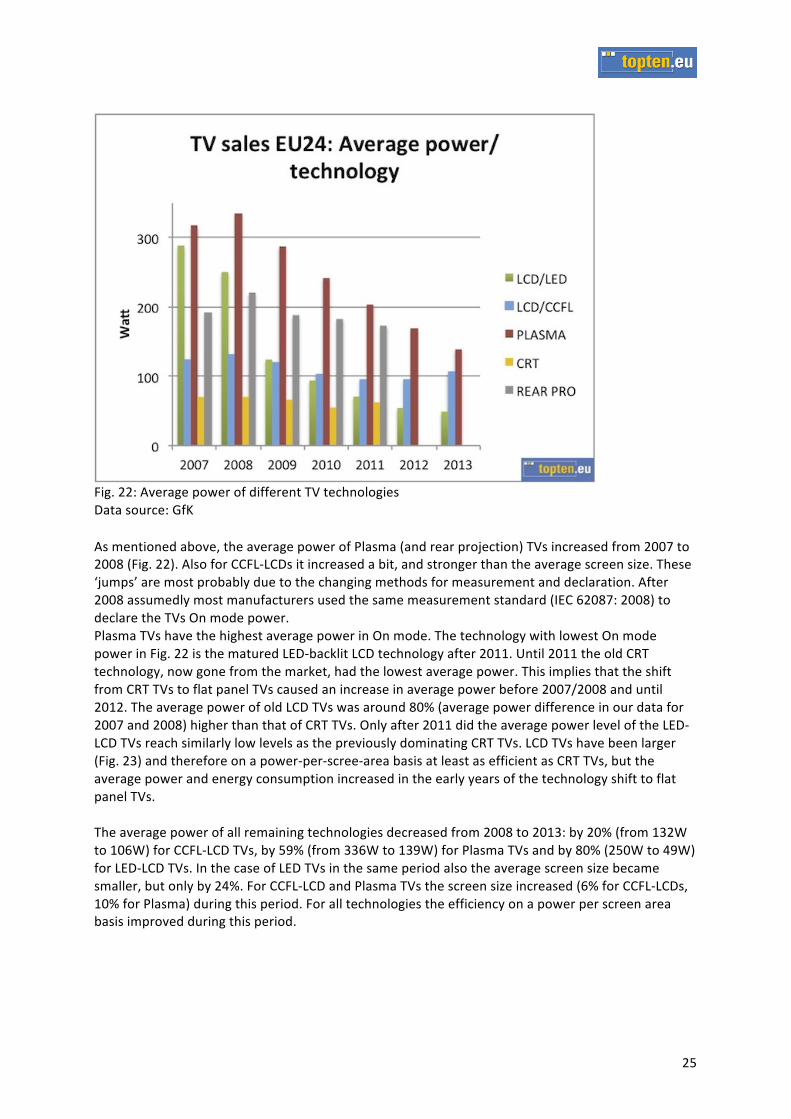
Fig. 22: Average power of different TV technologies Data source: GfK As mentioned above, the average power of Plasma (and rear projection) TVs increased from 2007 to 2008 (Fig. 22). Also for CCFL-‐LCDs it increased a bit, and stronger than the average screen size. These ‘jumps’ are most probably due to the changing methods for measurement and declaration. After 2008 assumedly most manufacturers used the same measurement standard (IEC 62087: 2008) to declare the TVs On mode power. Plasma TVs have the highest average power in On mode. The technology with lowest On mode power in Fig. 22 is the matured LED-‐backlit LCD technology after 2011. Until 2011 the old CRT technology, now gone from the market, had the lowest average power. This implies that the shift from CRT TVs to flat panel TVs caused an increase in average power before 2007/2008 and until 2012. The average power of old LCD TVs was around 80% (average power difference in our data for 2007 and 2008) higher than that of CRT TVs. Only after 2011 did the average power level of the LED-‐LCD TVs reach similarly low levels as the previously dominating CRT TVs. LCD TVs have been larger (Fig. 23) and therefore on a power-‐per-‐scree-‐area basis at least as efficient as CRT TVs, but the average power and energy consumption increased in the early years of the technology shift to flat panel TVs. The average power of all remaining technologies decreased from 2008 to 2013: by 20% (from 132W to 106W) for CCFL-‐LCD TVs, by 59% (from 336W to 139W) for Plasma TVs and by 80% (250W to 49W) for LED-‐LCD TVs. In the case of LED TVs in the same period also the average screen size became smaller, but only by 24%. For CCFL-‐LCD and Plasma TVs the screen size increased (6% for CCFL-‐LCDs, 10% for Plasma) during this period. For all technologies the efficiency on a power per screen area basis improved during this period.

26
Fig. 23: Average screen size of different TV technologies Data source: GfK
From 2012: Energy Classes From the beginning of December 2011 the Energy Label for TVs was compulsory, so for the sales in 2012 and 2013 the information on the Energy Class is available. Figure 24 shows the distribution of Energy Classes of the 2012 and 2013 sales in the countries and the EU-‐24. ‘Others’ include sales of models that were marketed before December 2011 and were not required to have a label, and new models, for which the label information was missing. For 2012 data was available showing only models marketed and sold in that year. These models were all required to have the Energy Label, and accordingly the share of TVs sold without label was lower for all countries – but still astonishingly high (Fig. 25). In 2013 the share of all TVs sold without Label was clearly lower than the year before in all countries.

27
Fig. 24: Distribution of Energy Classes of TV sales in 2012 and 2013. Data source: GfK
Fig. 25: Distribution of Energy Classes of TV sales in 2012 for new models put on the market in 2012 Data source: GfK
!"#$%#$
&'#$
!%#$
&(#$
!)#$
&&#$
*!#$!+#$
"#$
&+#$*+#$ *"#$
!(#$
!#$
!#$*#$
*#$
!#$!*#$
&#$
%#$
*#$
!(#$
(#$
(#$
*#$ !'#$
&#$
,#$
*#$
!'#$
&#$
*&#$
!*#$
**#$
!'#$
!,#$
!+#$
*)#$
!!#$
**#$
!!#$
!,#$
!*#$
*!#$
!&#$
&&#$
)*#$
&!#$
)"#$
*&#$
)+#$
*%#$
))#$
&%#$
)"#$
&)#$
&)#$
&!#$
)+#$
!)#$
&*#$
,#$
!%#$
(#$
*'#$
(#$
*'#$!!#$
*%#$
,#$
*(#$
"#$
*&#$
*#$ !#$ !#$ !#$ !#$
'#$
!'#$
*'#$
&'#$
)'#$
+'#$
('#$
,'#$
"'#$
%'#$
!''#$
$$$$$$-./0123$ $$$$$$4/125.$ $$$$$$$67$ $$$$891:2$ $$$;<=12>$ $$$$$?.201/@$ $$$$$A6*)$
!"#$%&'$#()*(#+#()*,-#'.'/01#2&%$$#34$5/46789.#
BCC$
BC$
B$
D$
E$
?$
FGH./I$
!"#
$%"# &'"# $("#
')"#$%"# $'"#("#
*"#
'*"#+"#
%"#
+"# !"#$'"#
'%"#
'*"#
'&"#
'!"#
'("# ',"#
&("#
*'"#&)"#
*'"#
*!"#
&!"# *)"#
$$"#''"# ("# '$"# '!"#
''"# '&"#
)"#
$)"#
*)"#
%)"#
!)"#
'))"#
-./0123# 4/125.# 67# 891:2# ;<=12># ?.201/@# A6$*#
!"#$%&'$#()*(#+,'-#./0'&$12##','345#6&%$$#07$8379:;/,#
BCC#
BC#
B#
D#
E#
?#
6F7FGHF#

28
Fig. 26: Energy Classes of TV technologies, sales 2012 and 2013 in EU-‐24. Data source: GfK. Table 4: Classification scale of the TV Energy Label. EEI = Energy Efficiency Index Class EEI A++ 0.16 A+ 0.23 A 0.30 B 0.42 C 0.60 D 0.80 Figures 24 to 26 show the following main results: • In 2012, the first full year of the new Energy Label, between 29% (UK) and 50% (Poland) of the
sold TVs were in class A or better. Across the EU 39% were classes A or better. In 2013 nearly 70% of the sold TVs in the EU were in classes A and better; between 61% (Denmark) and 78% (Poland) in the countries. Apart from a few Plasma TVs in 2013, only LED-‐backlit LCD-‐TVs are in classes A and better.
• The most important class regarding sales share in 2013 is class A in all countries observed. Across the EU, 45% of all TVs sold were in class A.
• In 2013 19% (France) to 32% (Germany) of the sales were in class A+; Across the EU A+ accounted for 23% of the sales. From 2012 to 2013 the sales share of A+ TVs nearly tripled, across the EU and in five of ‘our’ six countries. In Germany the share of A+ ‘only’ more than doubled – but with 32% A+ sales Germany is leading the A+-‐ranking anyway. This class was not expected to appear on the market before 2014; only for TVs that are placed on the market since 1. January 2014 the A+ class has to be shown on the Energy Label for all TVs, i.e. also less efficient TVs (EC, Sep 2010).
• Class D is the least efficient class still allowed on the market, but has completely disappeared from the market. With only 3% of the sales (between 2% and 6% in our countries) also class C is

29
nearly gone. This will leave classes B to A+++ on the market – two years after the introduction of the Energy Label.
• The share of TVs sold with missing Label information has been reduced since 2012. However, according to the data from GfK, in 2013 still nearly every sixth TV in Europe was sold without information on the Energy class. The Intelligent Energy Europe (IEE)-‐project ‘Come On Labels’ found in shop visits between 2011 and 2013 57% of correctly labelled TVs. 33% were not at all labelled, 10% only partly (Come On Labels, 2013). ‘Market Watch’ found a share of missing Energy Labels for TVs of 16% in shop visits in 11 EU countries between December 2013 and February 2014 (Krivošík, 2014), which is in line with the missing Label information in the GfK sales data used here. Another IEE-‐project ‘ComplianTV’ has found missing TV Energy Labels in 36% of the cases in shop visits in Austria, UK, France, Czech Republic, Germany and Belgium. In an additional 5% of the cases the Label was wrong or not visible (Faninger, 2014).
• LED-‐LCD TVs are responsible for the importance of class A, but also cover classes B and A+.
Plasma and CCFL-‐LCD TVs are mainly in classes C and B. Interestingly, first Plasma TVs made it into class A in 2013, while not many efforts seem to be allocated to the development of CCFL-‐LCD TVs. If the technology development observed in fig. 19 continues, the disappearing of CCFL-‐LCD and Plasma TVs will automatically lead to a phase-‐out of class C. If LED-‐LCD TVs continue developing towards higher efficiency, soon only classes A and better will remain ‘active’.
• Once again, differences between countries are considerable. Quite surprising is the high sales share of A and A+ TVs in Poland, and the comparatively few sales without Label. The explanation might be linked to the findings above that consumers in Poland buy larger (but fewer) TVs than in other countries. Larger TVs reach better efficiency classes (see below). Many efficient TVs are also sold in Germany, which meets our expectations from an economically stable country with a high sensitivity to environmental issues and quality. A bit surprising is Denmark, where a similarly high sales share of efficient TVs as in Germany would have been expected, especially when considering the high average screen size. Especially the high share of TVs without Label is surprising (25% in 2013). This is much more than the EU-‐average. Regarding efficient TVs, France, Spain and the UK are pretty close to the EU average. The strongest improvement in efficiency between 2012 and 2013 can be observed for the sales in UK. Also the high share of missing Label information could be reduced to average.
• The presence of an Energy Label provides the possibility to easily observe the market evolution based on the sales shares of the different energy classes. Labels force the industry to declare values (more market transparency) based on the same measurement methods (data more comparable). Observing the efficiency development with up-‐to-‐date sales data allows evaluating policy measures, deciding on the good timing of Label revisions, deciding on thresholds of new Labels and MEPS in revision processes, and, after some years, provides a good basis for stock and energy consumption models.
Does efficiency lead to higher prices? Figs. 9 – 12 show that TV prices have been strongly reduced since 2007, a development which slowed down after 2011. Fig. 27 shows the average price development of TVs in different Label classes from 2012 to 2013: efficient TVs (classes A to A++) experienced a strong price reduction even from 2012 to 2013, while for less efficient TVs the prices remained at the same level or even increased a bit (class C). The current, weak Ecodesign requirements that applied from August 2010 and April 2012 certainly have not lead to a price increase. But will consumers have to pay more for their TVs if new, ambitious Ecodesign requirements on efficiency are introduced during the revision of the Ecodesign regulation for TVs, which is currently on-‐going and expected to lead to a new regulation in 2014? Fig. 27 may suggest ‘Yes’ at the first glance: the average price of TVs in efficient classes was clearly higher than of

30
less efficient TVs in 2012 and 2013, except for class C. But, as figure 28 shows: efficient TVs are larger than less efficient TVs. From class B to A++ the average screen size increases by 18 inches (close to half a meter!). Figure 29 shows that the price is not only getting higher with better efficiency, but more importantly with increasing size.
Fig. 27: TV average price according to energy classes in 2012 and 2013 Data source: GfK
Fig. 28: TV average screen size according to energy classes in 2012 and 2013 Data source: GfK

31
Fig. 29: TV average price according to screen sizes in 2012 and 2013 Data source: GfK Figures 30 and 31 explore if there is a price correlation with energy efficiency for certain size categories. For 30”-‐40” TVs A++ TVs emerged on the market only in 2013. In 2012, the highest average price was paid for A+ TVs, which was clearly higher than for less efficient TVs (Fig. 30). In 2013 however, the average price of class B TVs in this size category was higher than for A+ and even the new A++ TVs.
Fig. 30: 30”-‐40” TV average price according to energy classes in 2012 and 2013 Data source: GfK For the screen size category of 40”-‐50” there are already A++ TVs on the market in 2012. But instead of these, A+ TVs obtained the highest prices in 2012. In 2013 these roles were changed, but class B sold on average for a higher price than A+. The lowest average prices were not paid for class D TVs,

32
but for class C. Summing up the two graphs: there is no clear correlation between energy efficiency and the price in the case of TVs.
Fig. 31: 40”-‐50” TV average price according to energy classes 2012 and 2013 Data source: GfK The figures 32 and 33 look at the size dependency of the TV prices for certain energy classes. For class A, there is a very clear correlation between the screen size and the price of the TVs. Figure 33 shows the same clear correlation for A+ TVs. For class B the graph looks the same, at a lower price level.
Fig. 32: A class TV average price for different screen sizes in 2012 and 2013 Data source: GfK

33
Fig. 33: A+ class TVs average price for different screen sizes in 2012 and 2013 Data source: GfK The series of figures above (27 to 33) let us conclude that energy efficiency is not affecting the price of TVs, but size is. So, unless the definition of efficiency and the level of requirements only allow large TVs on the market, ambitious efficiency requirements should not lead to increasing TV prices and make life harder for consumers. But this discussion leads to question another aspect: the correlation of size and efficiency. The European Commission expresses the TV efficiency with the Energy Efficiency Index EEI, which compares the On mode power of a TV to the power of a reference TV of the same size. Thus, TV efficiency is On mode power relative to screen size: larger TVs can have higher power and are still considered more efficient than smaller TVs with lower power. Class A has lower average power than classes A+ and A++ Figure 34 shows which TVs are the ones with lowest declared power: they are of class A. A+ and A++ TVs are more efficient according to the definition used in the Ecodesign and Labelling regulations for TVs (EC, July 2009 and September 2010), but have higher power because of the larger average screen size. Class B is on average smaller but less efficient, while classes C and D are both less efficient and on average larger than class A (see also Fig. 28). Declaration problems with new Label Graph 34 on average TV On mode power left us initially with a large question mark: the average power of classes A++, B and C did not match the reported classes for the given average screen size. Looking at the manufacturers’ declaration and discussing with GfK, it became clear that the problem came from wrong power declarations by manufacturers. GfK reports power values that are declared by manufacturers. The disaggregated GfK data could be compared with actual online declarations for the problematic classes. Some of the declared power values had been corrected by manufacturers in the meantime, while for other models still impossible combinations of size, power and efficiency class were declared when this report was written. GfK provided updated figures based on current online declarations by manufacturers, and the graphs for this report were adapted accordingly. The updated values seem more plausible, but the question marks could not be eliminated: At least for the 2012 class B and 2013 class C data, the resulting average power values are still too high. Class B in 2013 has an appropriate average power now, while for classes A++, B and C in 2012 it is still too high, but might be explained by uncertainties regarding average screen size. The reason is that most screen sizes were not indicated exactly, but as a range (e.g. 40” – 43”).

34
Fig. 34: TV average On mode power according to energy classes in 2012 and 2013 Data source: GfK Certainly the new Label posed a challenge for some manufacturers including large ones. When investigating the data problems, our research revealed especially confusing declaration regarding On mode power and annual energy consumption. It seems that a new Energy Label needs some time to be properly understood and implemented by industry. Assumedly most of the declaring problems will disappear with the Label being on the market for some years. Difficulties with the Labels are confirmed by two on-‐going European projects, MarketWatch and ComplianTV. In its first round of shop visits to check the Energy Label, the Intelligent Energy Europe (IEE) project MarketWatch found that TVs had a rather high share of missing Labels (16%), but also a high share of correct Labels (62 %) compared to other product groups (Krivošík, 2014). Another IEE-‐project ‘ComplianTV’ has found missing TV Energy Labels in 36% of the cases in shop visits in Austria, UK, France, Czech Republic, Germany and Belgium. In an additional 5% of the cases the Label was wrong or not visible (Faninger, 2014). More details will be published soon.
5. Conclusions General The reduction in average declared On mode power by 65% between 2008 and 2013 is impressive. Since 2008 the gains in efficiency on a power per screen area basis have been clearly stronger than the trend to larger screen sizes, and could realise considerable energy savings. How the effective electricity consumption by TVs has developed since 2008 and even before the market transformation to flat panel TVs is not clear. Several factors drive the electricity consumption to higher values than declared for single TVs or to higher values than some years ago for the entire EU: • Use duration in On mode: For the TV declaration of the annual electricity consumption on the
Energy Label, a daily On mode duration of four hours is assumed (EC, September 2010). Several studies suggest a longer TV use duration in On mode: the preparatory study from 2007 (Stobbe et al., 2007) expected the On mode duration to rise to five hours in the future, a recent study from the UK (EST/DEFRA, 2012) found an average daily TV watching time of six hours. Additional

35
functions in TVs certainly lead to more usage opportunities, e.g. looking at pictures, surfing on the internet, streaming online videos or music etc. and to longer On mode times. Average time in On mode is likely to be different for TVs in livings rooms, in sleeping rooms or kitchens, which are also of different size typically.
• Power depends on settings: a TV test in 2012 showed that manufacturers optimise their products very much to standards and labels, and that changing settings such as brightness or contrast can lead to a power increase by 30% compared to the test settings (Michel et al, 2013). TVs are measured and declared the way they are shipped, which in most cases combines the settings ensuring the lowest possible power in On mode. Often the brightness is rather low in these factory settings, close to the minimum of 65% of the maximum brightness which is stipulated by the Ecodesign regulation (EC, July 2009). Still, for many viewers the factory settings will be considered suboptimal, and all changes will most probably lead to an increase in power. So, the real-‐life On mode power is likely to be higher in most cases than the declared value, by up to around 30%.
• Sales peak of energy hungry TVs before implementing measures: The sales peak around 2010 mostly occurred before the Ecodesign regulation applied (tier 1: August 2010), let alone the Energy Label (December 2011). Most of the TVs sold in those boom years 2009 – 2011 have more than twice the average power of 2013 models – and around 70% higher power than the old CRT TVs had. Only in 2012 the average power was back at the power level of the average CRT TV in 2007 (70W, Fig. 22), and, considering such a longer term perspective, only starting from 2013 TVs have lower power than the old technologies. The sales peak occurred some years before the new technologies could compensate for their larger screen size and increased functionality with higher efficiency. These boom years are responsible for an increased stock of energy-‐hungry TVs in European households.
Evaluation of Ecodesign requirements and Energy Label
Ecodesign requirements on On mode power: too cautious According to the Ecodesign Directive (EC, 2005) the minimum requirements should be placed at a level aiming at the Least Life Cycle Cost (LLCC) for consumers. Because the question on the credibility of the data provided by the industry lead to intense discussions and because it was difficult to predict the market development based on available data, the Commission decided to define cautious minimum requirements but to include an early revision date (Toulouse et al., 2012). No impact The results of this study show that the development towards lower On mode power has started in 2008 / 2009 and that the development was much faster than the European Commission had anticipated. The development towards better efficiency seems mainly to be linked to the new technologies that were introduced, especially LED-‐backlit LCD-‐TVs. The efficiency development clearly outran the Ecodesign regulation, which was left without impact. The average market provides lower life cycle costs to consumers than the level of the Ecodesign regulation, because the average market is more efficient and leads to lower electricity costs than the level of the Ecodesign limit, while more efficient TVs are not more expensive than less efficient ones. Least Life Cycle Cost: for TVs at lowest power The discussion about the good level for future minimum efficiency requirements must also include the method for defining the Least Life Cycle Cost. A recent paper suggests to consider experience (or learning) curves when predicting the price level of a product: taking into account the decreasing product cost with cumulative production leads to lower prices and would allow for much more ambitious minimum efficiency performance standards (MEPS) (Siderius, 2013). Market data in our report shows that actual TV prices have decreased by 50% -‐ 60% from 2007 to 2013 (Figs. 10 -‐12), but also that the product price is mainly linked to screen size and not to the efficiency of TVs (Figs. 27 –

36
33). Consequently, the lower a TV’s power, the lower the resulting Life Cycle Cost. The authors of the preparatory study (Stobbe et al., 2007) did already report decreasing prices and found that all options for improving the energy efficiency would be cost-‐neutral. In the case of TVs, lack of data and the difficulty to predict a fast and completely changing market were the main barriers for setting more precise and more ambitious MEPS, and not so much too high price estimations. However, for the future of the TV market and for other products where prices are more linked to efficiency, the consideration of experience curves in policy making or revising processes would allow for more energy savings in many cases. Information on market trends was hardly available, but is today Would the Commission have been able to define more appropriate Ecodesign limits, had sound market data been at hand, like what is presented here? It seems not, since when the Ecodesign regulation was adopted in mid-‐2009, the trend towards lower power started only in that year, and because of changing measurement standards and no obligation to declare standardised power values, also the data up to 2008 would not have allowed to predict the fast development of the years to come. Only manufacturers might have been able to make more adequate estimations. The situation is very different today: there is a declaration obligation based on one measurement standard, and the Energy Label provides clear information that can be used for monitoring the market.
Energy Label: 24% in classes not yet expected With the Energy Label for TVs, a brand new Label was designed. Since there was no existing older Label, there was no resistance about possible downgrading of existing products, and clearly the original A to G scale should have been aimed at. This is what the Energy Labelling Directive (EC, May 2010) stipulates: “The format of the label shall retain as a basis the classification using letters from A to G (…)”. And only the next paragraph adds the possibility to go beyond A if needed: “ Three additional classes may be added (…) if required by technological progress. Those (…) will be A+, A++ and A+++ …” (p. 7). However, already in the first year of the Label being compulsory, 8% of the products were in class A+ across the EU and 39% of the sold products in classes A or better. In 2013 nearly 70% of the sold TVs were in classes A and better, 24% in classes A+ and A++. A+ was not expected to be reached before 2014 and therefore has to be displayed on all Labels only since January 2014 (EC, September 2010). Obviously the development towards higher efficiency has been faster than anticipated when the Energy Label was designed in 2010. However, also when the Energy Label was adopted, the rate of improvement to come was difficult to predict – even if more up-‐to-‐date data had been at hand. With data up to 2009, only the beginning of the efficiency development could have been observed; the sales share of LED-‐LCD-‐TVs was only 3% in that year and just starting to grow. The number of TV models on the Topten.eu product lists published on-‐line and in a Topten Focus (June 2012) shows that a rising number of models met the class B limit, but only very few the class A limit at the time of adoption. Label is still effective and provides a basis for market monitoring A positive point is that, contrarily to the situation for most Labels that have been recently revised (refrigerators, washing machines, dishwashers, tumble driers), the top class of the TV energy Label is still empty by today (Topten.eu; best TVs are in A++). Also the A++ limit seems yet to require a lot of technological efforts and the use of the bonus granted for Automatic Brightness Control (ABC) (Michel et al., 2013). The current Energy Label continues to provide an incentive for further efficiency developments. In addition the Label now provides a basis for a continuous and easy market monitoring, and it will be interesting to see if the market continues to evolve at the current pace – or even faster, now that the Label is in place. Correct declaration according to new Label needs some time

37
Our investigations around the data problems (page 33-‐34) revealed that the new Energy Label seemed to pose a challenge for some manufacturers, even for large ones. In some cases, wrong or strange power declarations not compatible with the declared class or the Labelling regulation were found online. Some of these mistakes were corrected by manufacturers when the data for this report was analysed and the report was written. Also the share of TVs sold without Label has been reduced from 2012 to 2013 –not only because less old TVs that were marketed before 2012 and therefore don’t need an Energy Label were sold, but also because the share of new TVs with missing Label is decreasing. The conclusion from this is: a new Energy Label needs some time to be properly understood and implemented by industry. Therefore pragmatic Labels should be adopted, based on simple, transparent energy efficiency calculation formulas.
Combined effect The Ecodesign regulation had nearly no influence on reducing TVs’ energy consumption. Also the Energy Label’s effect on the strong reduction in average power of flat panel TVs that is observed in the present report was probably of minor relevance – most of the development happened anyway and much faster than expected. It can however be questioned whether without power and energy consumption of TVs being a topic of interest, information obligation, minimum requirements, and the possibility to market high efficiency TVs with a good label class, manufacturers would have used the new technologies to improve the efficiency of TVs to the same extent. The improved measurement standard combined with the introduction of the implementing measures will at least have supported the market development towards better efficiency. And the Energy Label does its job up to today: it keeps driving the market towards higher efficiency.
Recommendations for revision New MEPS: A now, A+ soon The revised Ecodesign regulation for TVs must avoid setting not ambitious enough requirements only leading to administrative efforts without effect. The market overview provided in the present report can be used for more precise prognoses about the future market development. The insights gained here can support the setting of ambitious minimum requirements. In 2013 most of the sold TVs were in classes A and better across the EU and in all countries considered here (Fig. 24) -‐ class A level should be defined as minimum requirement from 2015, and class A+ level announced as next future step which can follow soon. Topten.eu product lists show that since late 2013 there are also small A+ TVs on the market (60 cm/ 23 inches). Once more ambitious MEPS are announced, industry will be motivated to also invest more development resources to even smaller TVs. Label revision: A to G with ambitious classes At the current development rate, soon only classes A and better will remain on the market without any additional measures. Therefore the Energy Label should be revised to restore the original A to G scale. Several studies show that classes like A+, A++ and A+++ have only little effect on consumers’ decisions. Consumers perceive the efficiency gains between similarly looking (similar colour, same letter) classes to be only small and not worth the extra cost, and manufacturers get a lower return on their R&D investments with products in A+-‐classes (e.g. Heinzle, Wüstenhagen, 2011; Meissner et al., 2013; Waide and Watson, 2013). Also the Energy Label Evaluation study found that no way leads around rebasing the current efficiency classes, and the ‘original’ closed A to G scale confirmed to be the easiest to comprehend (Ecofys, 2014). Class A could be the ‘incentive’ to be reached by future, even more efficient TVs, and correspond to today’s class A+++ or even beyond. Today’s best TVs are in A++ (www.topten.eu ). Considering the fast efficiency development of the last few years and the even more efficient OLED technology, which is expected to enter the market in the future, a future-‐oriented labelling scale is needed. EEI formula: digressive or capped reference line needed for both Label and Ecodesign Another point that should be tackled is the strictly linear relative efficiency approach (power can grow linearly with screen area). The current EEI formula and Labelling classification scale allow large

38
TVs to reach a good Energy Class despite consuming more energy than smaller TVs (which can get a worse classification). This approach does nothing to stop the continuing trend towards larger screen sizes, which is shown in figures 6 and 7. Since 2007 and up to now, the increasing efficiency of the products has the stronger effect on average power than the growing screen sizes, and the average declared power has been decreasing dramatically in the last few years despite TVs getting larger. At some point however the efficiency potential will become smaller, and a Labelling / Ecodesign approach favouring large TVs leads to missed energy savings. Therefore a digressive or even capped reference line should be considered for this revision, for the Ecodesign requirements, and most importantly for the Energy Label. (Examples and suggestions in: Spengler, 2014.) A progressive efficiency approach for the Energy Label is key, because it is this instrument that is driving the market. At the same time the declaration problems show that it is important to keep the measures as simple and transparent as possible.
6. References S. Attali, E. Bush, A. Michel for Defra / the Market Transformation Programme: Factors influencing the penetration of energy efficient electrical appliances into national markets in Europe. June 2009. Presented at EEDAL 2011, Copenhagen. http://www.topten.eu/uploads/File/Factors%20influencing%20the%20penetration%20of%20energy%20efficient%20electrical%20appliances%20into%20national%20markets%20in%20Europe-‐1.pdf
Come On Labels: www.come-‐on-‐labels.eu ComplianTV: http://www.compliantv.eu CSES, 2012: Evaluation of the Ecodesign Directive (2009/125/EC), Final Report.
eceee, Ecodesign and Labelling, products and status: http://www.eceee.org/Eco_design/products/televisions
ECOFYS: Evaluation of the Energy Labelling Directive and specific aspects of the Ecodesign Directive: First findings and recommendations. February 2014. www.energylabelevaluation.eu/
Euractiv, 7 May 2009: http://www.euractiv.com/energy-‐efficiency/parliament-‐muddles-‐energy-‐labels-‐news-‐221877
European Commission: Directive 2005/32/EC of the European Parliament and of the Council of 6 July 2005 establishing a framework for the setting of ecodesign requirements for energy-‐using products
European Commission: Commission regulation (EC) No 642/2009 of 22 July 2009 implementing Directive 2005/32/EC of the European Parliament and of the Council with regard to ecodesign requirements for televisions
European Commission: Directive 2009/125/EC of the European Parliament and of the Council of 21 October 2009 establishing a framework for the setting of ecodesign requirements for energy-‐related products
European Commission: Directive 2010/30/EU of the European Parliament and of the Council of 19 May 2010 on the indication by labelling and standard product information of the consumption of energy and other resources by energy-‐related products

39
European Commission: Commission delegated regulation (EU) No 1062/2010 of 28 September 2010 supplementing Directive 2010/30/EU of the European Parliament and of the Council with regard to energy labelling of television
European Commission: Discussion paper on the review of the Ecodesign and Energy Labelling Regulations for televisions and on the draft Regulation on electronic displays, including computer monitors. August 2012.
Energy Saving Trust (EST) / DEFRA: Powering the nation. Household electricity-‐using habits revealed. London, 2012. http://www.energysavingtrust.org.uk/Publications2/Corporate/Research-‐and-‐insights/Powering-‐the-‐nation-‐household-‐electricity-‐using-‐habits-‐revealed
Energy Star Product Criteria: TVs. Version 5.3, effective since September 30, 2011. http://www.energystar.gov/index.cfm?c=tv_vcr.pr_crit_tv_vcr
Faninger Thibault: ComplianTV. Introduction to the project & First results. Presentation at EUSEW, Brussels, June 25th 2014.
GfK: www.gfk.com
Harrison Bob: personal communication in April 2013.
Heinzle S. and Wüstenhagen R.: Dynamic adjustment of Eco-‐labeling schemes and consumer choice – the revision of the EU Energy Label as a missed opportunity? Bus. Strat. Env. 21, 60-‐70 (2012).
Intelligent Energy Europe IEE: http://ec.europa.eu/energy/intelligent/ International Electrotechnical Commission (IEC): IEC 62087:2008 Methods of measurement for the power consumption of audio, video and related equipment. October 2008. Withdrawn and replaced by IEC 62087:2011.
Krivošík Juraj: Market Watch. 1st round results: Energy Label Display in Shops. WP4, June 2014.
Market Watch, IEE project: www.market-‐watch.eu
Meissner M., Heinzle S., Decker R.: Not worth the extra cost? Diluting the differentiation ability of highly rated products by altering the meaning of rating scale levels. J. Consumer Behav. (2013).
Michel, Bush, Hu Bo: Finding the most energy efficient TV in China and in Europe: not such an easy job… Presented at eceee 2013, France.
Nuij Robert: personal communication in March 2014.
Siderius Hans-‐Paul: The role of experience curves for setting MEPS for appliances. April 2013. Energy Policy, DOI information: 10.1016/j.enpol.2013.04.032 Spengler Laura, Jepsen Dirk, Ausberg Laura: Beyond efficiency. Anchoring absolute energy savings in the Ecodesign Directive and the Energy Labelling Directive. Ökopol, Hamburg, May 2014. Stobbe et al.: EuP Preparatory Studies ‘Televisions’ (Lot 5). Tasks 1-‐8. Deutsche Umwelthilfe and Fraunhofer IZM. Berlin, August 2007.
Panasonic announces to stop Plasma TV production: http://www.theverge.com/2013/10/31/5050038/panasonic-‐plasma-‐tv-‐production-‐end
Topten, Best products of Europe: www.topten.eu

40
Topten Focus, June 2012: Televisions: Energy Label speeds up efficiency development. http://www.topten.eu/uploads/File/Newsletters/Topten%20Focus%20TVs%20June%2012.pdf
Toulouse, Sivitos, Arditi et al.: EU Ecodesign and Labelling regulations for TVs: is the picture half full or half empty? Presented at the EGG conference, September 2012.
VZBV and BUND, shop inspection of TV declaration: www.vzbv.de/12889.htm (in German)
Waide P., Watson R.: Energy Labelling. The new European Energy Label: Assessing consumer comprehension and effectiveness as a market transformation tool. In collaboration with CLASP. May 2013.

41
European TV market 2007 – 2013 Development of energy efficiency before and during the implementation of the Ecodesign and Energy Labelling regulations Second report, complemented with 2013 sales data
Annex: Country reports (including EU-‐24) A set of 8 figures is included here for each of the countries that are considered, plus a short description which is pointing out the main differences of the countries to the EU average. Figures for comparison are those for the EU-‐24, included in the last chapter of the Annex. Many of these Figures are also included in the main report.
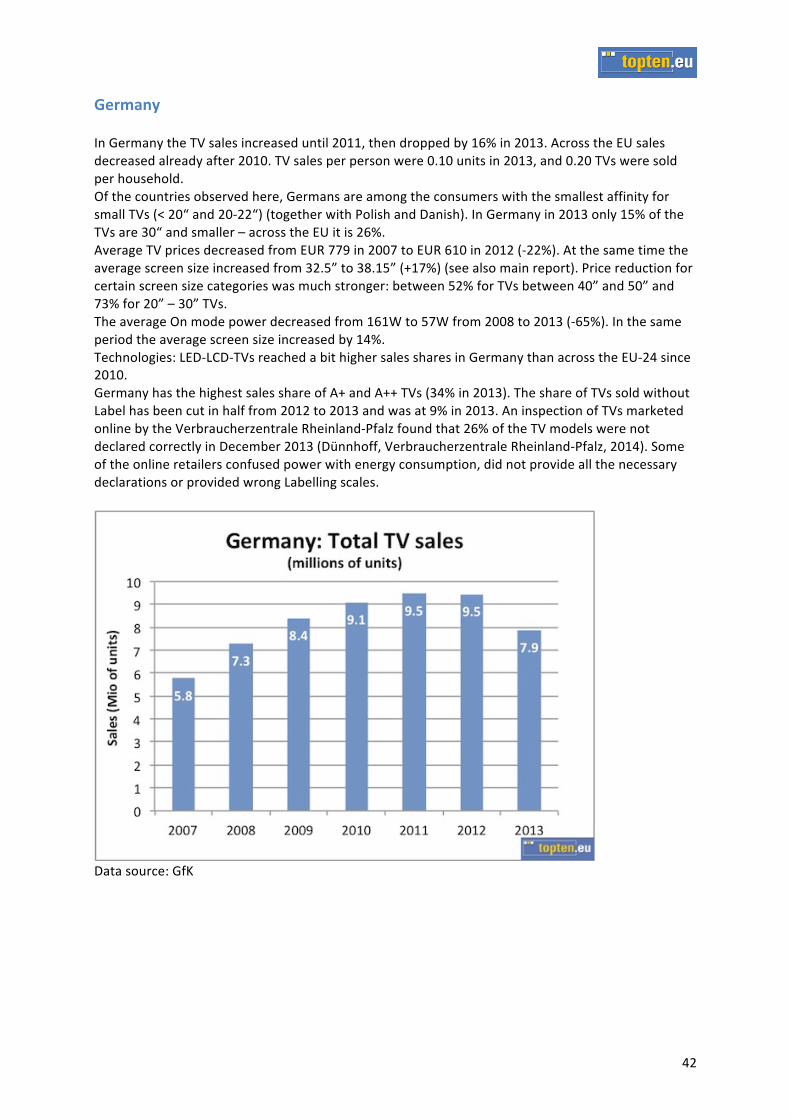
42
Germany In Germany the TV sales increased until 2011, then dropped by 16% in 2013. Across the EU sales decreased already after 2010. TV sales per person were 0.10 units in 2013, and 0.20 TVs were sold per household. Of the countries observed here, Germans are among the consumers with the smallest affinity for small TVs (< 20“ and 20-‐22“) (together with Polish and Danish). In Germany in 2013 only 15% of the TVs are 30“ and smaller – across the EU it is 26%. Average TV prices decreased from EUR 779 in 2007 to EUR 610 in 2012 (-‐22%). At the same time the average screen size increased from 32.5” to 38.15” (+17%) (see also main report). Price reduction for certain screen size categories was much stronger: between 52% for TVs between 40” and 50” and 73% for 20” – 30” TVs. The average On mode power decreased from 161W to 57W from 2008 to 2013 (-‐65%). In the same period the average screen size increased by 14%. Technologies: LED-‐LCD-‐TVs reached a bit higher sales shares in Germany than across the EU-‐24 since 2010. Germany has the highest sales share of A+ and A++ TVs (34% in 2013). The share of TVs sold without Label has been cut in half from 2012 to 2013 and was at 9% in 2013. An inspection of TVs marketed online by the Verbraucherzentrale Rheinland-‐Pfalz found that 26% of the TV models were not declared correctly in December 2013 (Dünnhoff, Verbraucherzentrale Rheinland-‐Pfalz, 2014). Some of the online retailers confused power with energy consumption, did not provide all the necessary declarations or provided wrong Labelling scales.
Data source: GfK

43
Data source: GfK
Data source: GfK
Data source: GfK

44
Data source: GfK
Data source: GfK
Data source: GfK

45
Data source: GfK

46
France Many characteristics of the French TV market from 2007 to 2012 resemble the average developments across the EU. With a few exceptions: while across the EU TV sales started to decrease after 2010, in France they increased until 2011. The sales reduction from 2011 to 2012 however was impressive, and in 2013 it reached a lower level than in 2007. In 2013 TV sales per person were 0.09 units, and 0.20 TVs were sold per household. The sales share of the screen size categories looks similar to that of the European average. Average TV prices decreased from EUR 728 in 2007 to EUR 435 in 2013 (-‐40%) – this is (together with with Denmark) the strongest price reduction we can observe in this study. From 2012 to 2013 however, the average price increased by EUR 5.-‐. (a stronger increase was observed in UK.) From 2007 to 2013 the average screen size increased from 29.6” to 34.6” (+17%). In 2012 the average screen size was 33.3”. The average On mode power decreased from 158W to 56W (-‐64%) from 2008 to 2013. In the same period the average screen size increased by 9%. The development regarding technology looks similar as across the EU. In 2007 Plasma TVs had a bit a higher sales share in France than across the EU. Also the Energy Classes distribution in 2012 looks similar in France as across the EU. The share of sold TVs in classes A and better was at the same level as in rest of the EU. The share of non-‐labelled TVs was reduced from 30% to 19% from 2012 to 2013. Also France’s screen size profile for 2012 and 2013 looks very similar to the EU average.
Data source: GfK
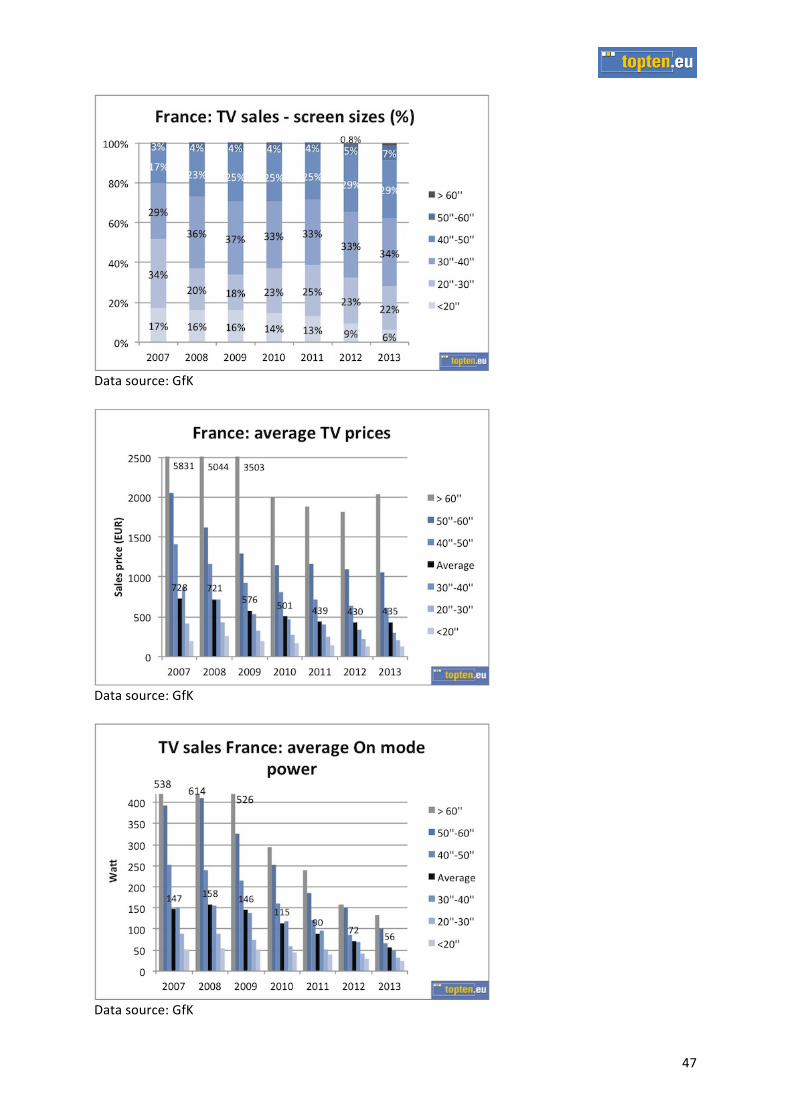
47
Data source: GfK
Data source: GfK
Data source: GfK
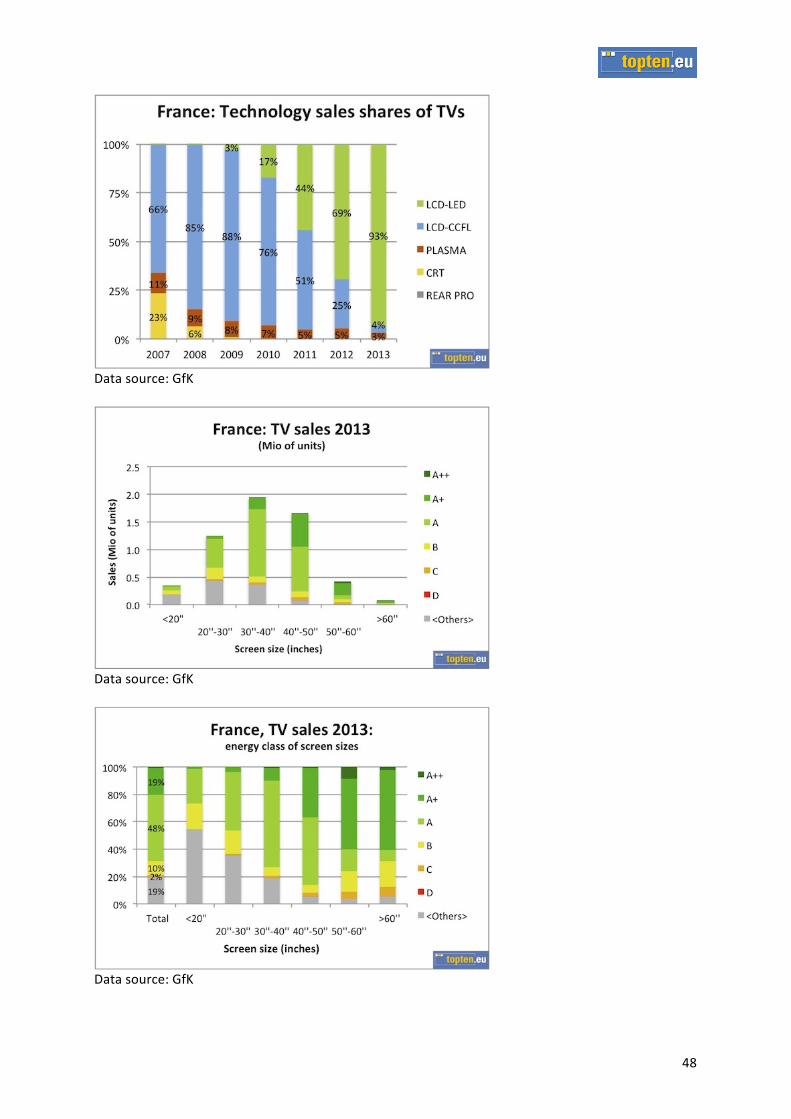
48
Data source: GfK
Data source: GfK
Data source: GfK

49
Data source: GfK

50
United Kingdom In the UK TV sales reached a peak a year earlier than in most other countries, but they remained at a relatively high level on a per person scale (see also main report). TV sales per person were 0.11 units in 2013, and 0.24 TVs were sold per household – clearly the highest relative sales of the countries included here (EU average: 0.08 / 0.19). The UK TV market is very mature with a penetration rate of 2.3 TVs per household (EST/DEFRA, 2012). The high sales are combined with a small average screen size – assumedly due to a high share of (smaller) secondary TVs that are not placed in living rooms, but in kitchens and sleeping rooms. With its stronger preference for smaller TVs the UK has a more balanced screen size distribution than the EU average. Average TV prices decreased from EUR 661 to EUR 432 by 35% from 2007 to 2013. Like in France, the average price increased a bit from 2012 (EUR 414) to 2013. Until 2012 UK consumers paid the lowest prices for TVs of all countries included here. In 2013, Spanish TV buyers paid less, but also bought on average smaller TVs for the first time. Average TV size increased from 27.8” in 2007 to 33.7” in 2013 (+ 21%), but was in 2013 still smaller than the EU average (35”). Average power decreased from 163W to 55W (-‐66%) from 2008 to 2013. Over the same period the average screen size increased by 16%. Technologies: CRT TVs disappeared faster from the market than across the EU, while CCFL-‐LCD TVs are replaced by LED-‐LCD TVs a bit slower than in other countries. In an earlier study the UK TV market was found to be characterised by low average prices and rather low energy efficiency (S. Attali, E. Bush, A. Michel for Defra, June 2009). In 2012 the share of efficient TVs was yet smaller than in other countries and across the EU, while more TVs of class C or without Label were sold. By 2013 the UK market has improved considerable regarding efficiency: the sales share of TVs in classes A and better has increased more than in any other country considered here, to reach a similar level as the EU average. Also the share of TVs sold without Label was reduced to meet the average level.
Data source: GfK
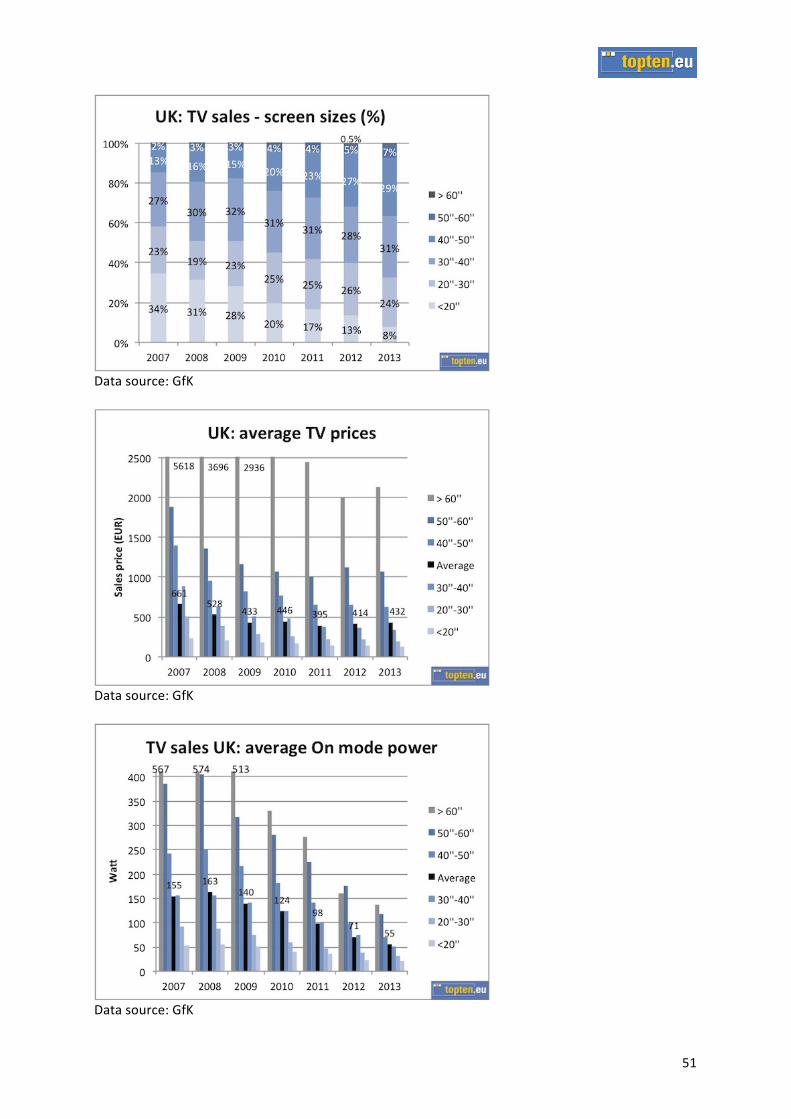
51
Data source: GfK
Data source: GfK
Data source: GfK

52
Data source: GfK
Data source: GfK
Data source: GfK

53
Data source: GfK

54
Spain TV sales in Spain from 2007 to 2013 show the ‘classic’ sales pyramid with a clear peak in 2010. After 2010 the sales dropped stronger than in other countries – we suppose that the economic crises is reflected in this development. TV sales per person were 0.07 units in 2013, and 0.20 TVs were sold per household. With the sales decrease after 2010 TVs of 40” to 50” became much more popular. While across the EU the sales share of this category doubled, in Spain it even tripled. In 2007 -‐2010 the share of small TVs (<20”) had been higher than across the EU (around 25%, EU: around 18%). Did people mainly stop to buy secondary TVs? Or had people increasingly bought small TVs because they were fearing not to be able to receive their TV channels after the digital switch-‐over, but had not enough money to buy large TVs? Average TV prices have decreased from EUR 619 to EUR 422 (-‐32%) from 2007 to 2012, while at the same time the average screen size increased from 27.5” (the lowest in 2007) to 32.3” by 18%. Except for 2012, when British consumers bought smaller TVs, TVs sold in Spain between 2007 and 2013 were on average smallest of the countries considered here. The average On mode power decreased from 126W to 55W (-‐60%) from 2008 to 2013, while the average screen size increased by 13%. Until 2012 Spanish TVs had the lowest average power among the countries looked at in this monitoring, by 2013 the average power became very balanced across the countries. The share of TVs sold without Label remains relatively higher in 2013 (21%). Similar to France, the share of small TVs is high in 2013, and among these the share of TVs sold without label is very high. The peak for small TVs (20’”-‐22”) is higher than in other countries.
Data source: GfK

55
Data source: GfK
Data source: GfK
Data source: GfK

56
Data source: GfK
Data source: GfK
Data source: GfK
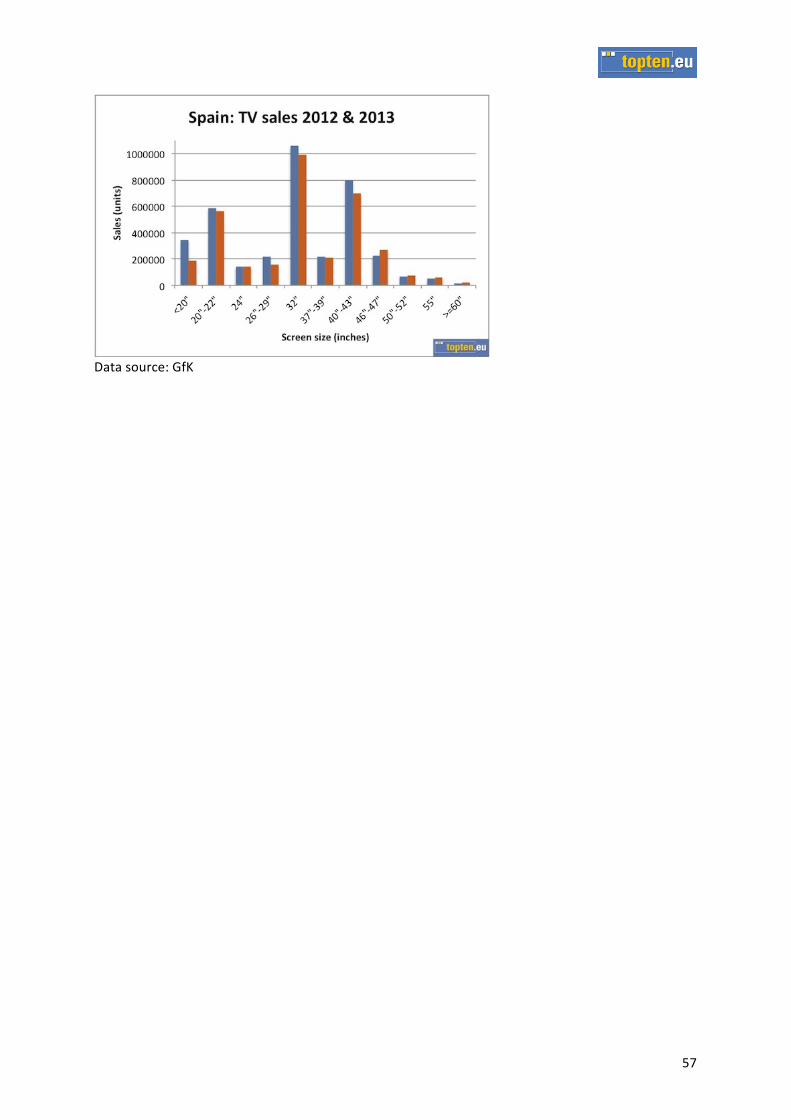
57
Data source: GfK

58
Poland In Poland the TV sales kept increasing until 2013, while most other countries saw a reduction after 2010. In 2013 TVs sales per person were at the EU average (0.08); before they had been below average. TV sales per household climbed even higher than the average: 0.21 TVs were sold per Polish household in 2013 (EU-‐average: 0.19). Even now that Polish consumers buy more TVs, they still buy comparatively large TVs. Assumedly the market penetration is still rather lower than in other EU-‐countries and a low share of (small) secondary TVs for sleeping rooms or kitchens are bought: Almost 80% of the sales are TVs with screen sizes between 30” and 50”. Smaller TVs are unpopular in Poland – less popular than in any other country considered here. In 2007 30”-‐40” were dominating, by 2012 these and the larger category (40”-‐50”) were almost equally popular. From 2012 to 2013 a light shift back to 30”-‐40” TVs can be observed. The average TV price decreased from EUR 560 in 2007 to EUR 441 in 2013 – a reduction of 21%, which is the smallest reduction in price of the countries looked at here. At the same time the average screen size increased from 32.3” (only Germany was larger) to 36.2 (similar to DE and DK) by 12% over this period. The average power decreased from 157W in 2008 to 56W in 2013 (-‐64%). During this period the average screen size increased by 9%. TV technology: CRT TVs had a much higher sales share back in 2007 than across the EU, and from 2009 to 2011 Plasma TVs were more popular than in other European countries. Apart from that, the technology sales shares correspond more or less to the EU average. Poland has few sales in the size categories that are in danger to have a high percentage of missing labels, but also for the popular screen sizes (30”-‐40”, 40”-‐50”) Poland has a low share of non-‐labelled sales. The preference for certain screen sizes is most obvious in Poland: TVs of 32” and 40”-‐43” are the clear favourites. The peak for small TVs can hardly be called a ‘peak’ for Poland – in 2013 TVs of 46”-‐47” have more sales than those of 20”-‐22”.
Data source: GfK
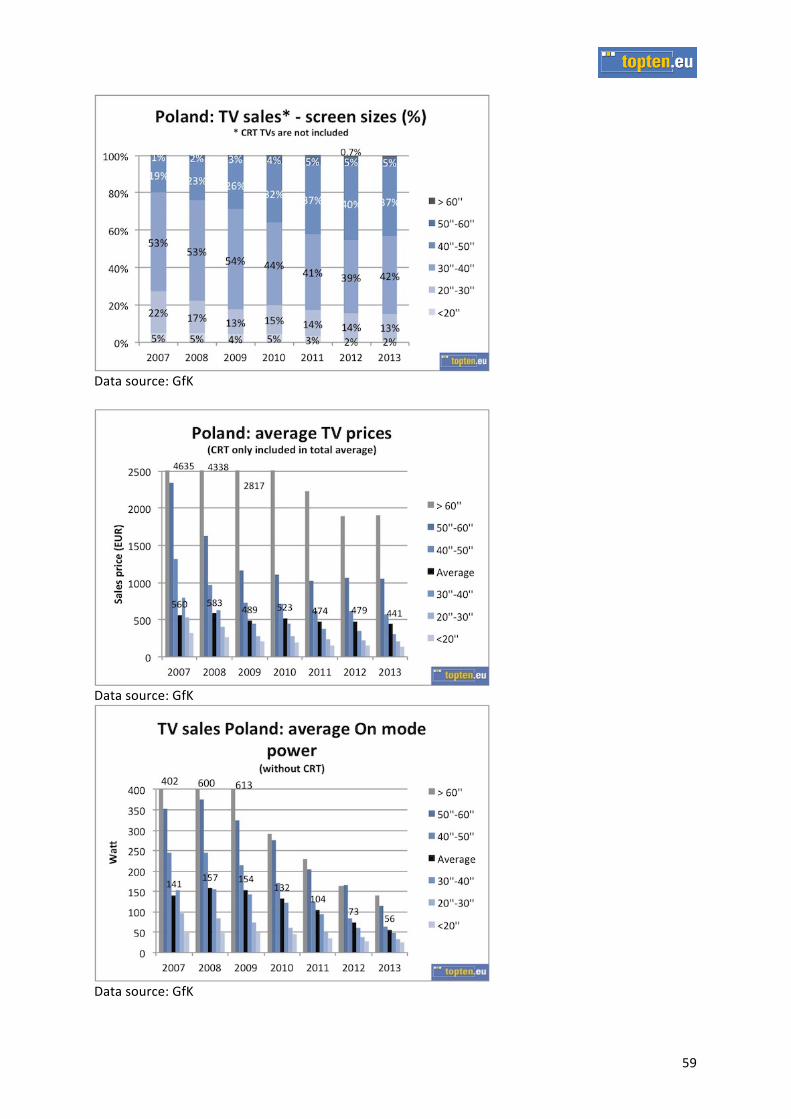
59
Data source: GfK
Data source: GfK
Data source: GfK

60
Data source: GfK
Data source: GfK
Data source: GfK

61
Data source: GfK

62
Denmark Like in most countries TV sales in Denmark started to decrease in 2011, but slowly. In 2013 TV sales per person were 0.11 units, and 0.27 TVs were sold per household. In 2013 sales were still higher than in 2008, while across the EU sales had reached the level from 2007. Large TVs are more popular in Denmark than in any other country considered here: 47% of the sales are TVs between 40” and 50”, also the even larger ones hold larger shares in Denmark than in other countries: 7% (50” – 60”) and 1.3% (>60”). Average TV prices decreased from EUR 1230 in 2007 to EUR 704 in 2013 (-‐43% -‐ the strongest reduction observed in this monitoring). The prices however still remain at a high level: 48% higher than across the EU. The average screen size increased from 31.6” to 38.9” by 23% over this period. Danish buy the largest TVs from the countries looked at here: on average they’re 3.8” (9.6cm; 11%) larger than across the EU in 2013. The average power decreased from 167W in 2008 to 58W in 2013 (-‐56%). Over the same period the average screen size increased by 17%. Denmark has the largest average screen sizes and the highest average power of the countries considered here, at least in 2012 and 2013. CRT TVs disappeared from the Danish market faster than from other countries’ markets. LED-‐LCD TVs were taken up a bit faster here than across the EU. Denmark has an astonishingly high share of non-‐labelled sales across all screen size categories. The market is less efficient than what would be expected: of the countries looked at here, Denmark even has the lowest sales share of the classes A to A++ (61%, EU average: 69%). The sales share of A+ and A++ TVs however is slightly above average: 27% (EU: 24%). Unlike most other countries Danish prefer TVs of 40”-‐43” to those of 32”. And large TVs (46”-‐47”) are more popular here than across the EU.
Data source: GfK

63
Data source: GfK
Data source: GfK
Data source: GfK

64
Data source: GfK
Data source: GfK
Data source: GfK

65
Data source: GfK

66
EU-‐24 Most results for the EU-‐24 are presented in the main report. Average sales per person across the EU in 2013 was 0.08, and 0.19 TVs were sold per household. Across the EU average TV prices decreased from EUR 679 in 2007 to EUR 476 in 2013 by 30%. At the same time the average screen size increased from 29.3” to 35” by 20%. From 2008 to 2012 the average On mode power decreased from 156W to 55W (-‐65%), while at the same time the average screen size increased by 14%.
Data source: GfK
Data source: GfK

67
Data source: GfK
Data source: GfK
Data source: GfK

68
Data source: GfK
Data source: GfK
Data source: GfK