Embed Size (px)
Citation preview

TABB Group Credit Default Swaps: Industry Projections | March 2009 1
European Trading of US Listed Equity Options 2014:
Shifting Demand in a Changing Market Landscape
Andy Nybo
V12:020 | March 2014 | www.tabbgroup.com

TABB Group European Trading of US Listed Equity Options 2014 | March 2014 2
Executive Summary
• Growing sophistication of European investors; solid growth in directional, premium-generating and
volatility strategies.
• Competitive market structure, deep liquidity and transparency continue to attract European
customers.
• European demand for US listed options remains strong, with order flow from Europe accounting
for an estimated 9% of total trading in 2013.
• Post-crisis shift in institutional demand as European financial markets begin to recover and global
investment allocations are adjusted.
• Proprietary accounts and sell-side desks remain active users but are shifting activity to the US as
volumes rise and US expertise becomes more important.
• Strong increase in value of US equity assets held in the UK, Luxembourg and Switzerland.
• Private wealth managers expand use of US listed options, driven by rising client AuM and
electronic access.
• Rising interest from European retail clients to trade US options with transparency and ease of
access driving demand.
TABB Group European Trading of US Listed Equity Options 2014 | March 2014 3
Study Methodology
• TABB Group interviewed 31 US and European market participants representing 27
different firms supporting US listed options trading activities.• All interviews were conducted on an anonymous basis.
• In certain instances, the interviews included multiple participants from one firm.
• The interviews were conducted in February 2014 with a focus on changes in European
attitudes toward US listed options markets since 2011.
• Responses from the interviews are represented graphically within the report.• The interviews were conducted in an open-ended manner and often included multiple
responses to a single question (hence, totals may add up to more than 100%).
• Response percentages are calculated as a percentage of total responses for each question.
• As defined in this report, European trading of US listed options includes trades
executed by a firm domiciled in the UK or continental Europe.• Trading activity by US-based subsidiaries of European firms were not included in the total.
• No attempt was made to identify the ultimate beneficiary of fund investors that may be located
outside Europe.
• This report represents the third in a series of TABB Group reports examining the use
of US listed equity options by European investors. The first report, “European Demand
for US Listed Options,” was published in 2011, with the second report “European
Interest in US Options: Factors Driving Renewed Demand” published in 2013. Both
reports are available for download at www.optionseducation.org.

TABB Group European Trading of US Listed Equity Options 2014 | March 2014 4
39%
32%
13%
10%6%
Broker-Dealers Institutional Investors Retail Brokers Vendors Exchanges
The interview set included 31 participants from a cross section of US and
European firms active in the US listed options industry
• The firms in the sample included broker-dealers, market makers, retail brokers, data providers,
execution management system providers, US options exchanges, hedge funds and traditional
asset managers.
• Respondents were geographically dispersed and included firms based in the US, UK and
continental Europe.
• The majority of interviews were conducted with individuals in the UK and continental Europe,
representing 61% of the total with individuals in the US accounting for the remaining 39%.
Respondent Profiles Regional Segmentation
26%
58%
53% 11%
17% 17%
10%
8%
Europe
US
Source: TABB Group Interviews

Key Findings

TABB Group European Trading of US Listed Equity Options 2014 | March 2014 6
European investors accounted for an estimated 9% of total US listed options
trading volume in 2013
58%
18%
15%
5%
4%
55%
21%
14%
6%
4%
Hedge funds
Private wealth management
Proprietary accounts
Investment managers
Other
2011 2014
Proportion of US Listed Options Order
Flow Executed in Europe
Source: TABB Group estimates
• Hedge funds domiciled in Europe represent the
largest source of demand for US listed options.
• Demand has declined since 2011 as the focus of
strategies has shifted away from the US.
• Lower correlation has hit flows.
• Private wealth accounts are a growing source of
order flow.
• High levels of US equity exposure have risen in value.
• Focus on overwriting and risk management has led to
rising activity.
• Proprietary accounts and sell-side desks remain
active users but are shifting activity to the US.
• Need to access local expertise and operate during US
hours drives decision to establish US presence.
• Traditional asset managers represent a small but
growing proportion of activity.
• Increasing adoption amid greater focus on reducing
risk and improving returns.
• Deep liquidity is a powerful factor driving demand.
• Other investor segments including retail and
corporations represent a small amount of activity.
• Retail brokers have identified and are targeting
growing demand from active traders.
• Challenged to shift demand away from local
instruments.

TABB Group European Trading of US Listed Equity Options 2014 | March 2014 7
European investors actively embrace US options across multiple strategies;
deep liquidity, transparency and electronic access support growing demand
13%
13%
13%
17%
17%
17%
17%
25%
29%
38%
54%
Lower commissions
More listed products
Focus on pricing
Best execution focus
Refined strategies
Greater understanding
Focus on Europe
ETF demand
Volatility focus
More electronic trading
Growing demand
Increased93%
Decreased7%
How has demand for US options
products changed since 2011?
What are the biggest changes in US options trading
activity originating from Europe?
• Brokers report rising demand for US listed
options.
• Electronic access growing in importance.
• Strong growth and future demand forecast for
hedging with ETF and volatility products.
• Countering demand is the de-emphasis on US
exposure from macro strategies as European
equity markets recover.
Source: TABB Group Interviews
Response percentages
are calculated as a
percentage of total
responses for each
question.

TABB Group European Trading of US Listed Equity Options 2014 | March 2014 8
European investors are becoming more sophisticated in how they use options;
directional and volatility strategies are expanding across the user base
41%
6%
71%
62%
62%
100%
Premium/Overwriting
Volatility
Directional/Hedging
2014 2011
• European institutional investors are expanding the
diversity of options strategies.
• Asset managers and pension funds using more
options in directional and hedging strategies.
• Private wealth managers implementing more
sophisticated strategies.
• There is rising interest from European retail investors to
trade US options.
• Retail brokers improving electronic access to meet
rising client interest.
• Transparency and ease of access driving demand
• Volatility strategies using US listed options and futures
products are becoming more popular.
• Regulation forcing investors to use listed rather than
OTC products.
• Hedging strategies continue to focus on ETF and sector
index products.
• Sector hedging strategies rely on liquid products to
ensure ability to exit a position.
• Declining correlation is raising investor focus on single
stock options.
• Directional strategies focusing on corporate actions.
• Short term expirations a popular tool.
What types of strategies are European investors
employing with US equity options?
Source: TABB Group Interviews
“Correlations between indices and single names
were fairly high and that is changing, with more
focus on single stock options especially around
earnings.”
-US Broker

TABB Group European Trading of US Listed Equity Options 2014 | March 2014 9
The use of ETF options has become more important in hedging strategies while
declining correlation is shifting focus to single stock options
Where Do You See the Greatest Growth Potential?
Source: TABB Group Interviews
39%
70%
91%
65%
55%
90%
Singlestock
ETF
Index
2014 2011
What Types of Options Are Currently Being Traded?• In 2011, European investors were just beginning to
see opportunities in ETF products.
• ETF growth potential remains bright.
• Sector-specific hedging strategies driving
adoption.
• Volatility exposure is becoming a larger focus.
• Clients are leveraging technology to support multi-
asset trading strategies.
• Falling correlations will favor use of single stock
options.
31%
37%
50%
56%
ETF
Multi-assettrading
Volatilityproducts
Weeklyexpirations
2011 2014
13%
25%
38%
38%
50%
Single stock
Index
Weeklyexpirations
Volatilityproducts
ETF
Source: TABB Group Interviews
Source: TABB Group Interviews

TABB Group European Trading of US Listed Equity Options 2014 | March 2014 10
Rising demand for listed volatility products has accelerated as regulators push
for centrally-cleared products
1.9 2.2 2.85.2
8.2 9.211.9
16.5
0.5
2.14.0
7.0
7.0
1.9 2.2 2.8
5.7
10.3
13.2
18.9
23.4
VIX VXX
• The use of US listed options as part of volatility strategies has
grown considerably.
• Increasing liquidity in listed markets is attracting greater
interest.
• OTC volatility products are important but investor
preference is shifting toward listed products.
• The two most active volatility options represent $1.5 billion in
daily notional value traded.
• High volume days exceed $5 billion notional traded.
Average Monthly Volume in
millions of options contractsBarclays iPath S&P 500 VIX ST Futures ETN (VXX)
• Open interest: 4.4 million contracts
• Average daily trading volume: 175,000
• Average daily notional value traded: $265M
CBOE Volatility Index® (VIX)
• Open interest : 10.1 million contracts
• Average daily trading volume in 2014: 412,000
• Average daily notional value traded: $1.2B
Source: CBOE, OCC, TABB Group estimates
“Accounts that like to trade volatility
love the US options markets due to the
deep liquidity in the volatility products.”
-European Broker

TABB Group European Trading of US Listed Equity Options 2014 | March 2014 11
European investors are still using the phone to trade larger orders; adoption
of electronic trading channels for smaller orders is growing
• Large institutional investors generally execute by phone
to access capital and get market color.
• Small transactions are transitioning to low touch.
• Financial Information eXchange (FIX) connections are
being adopted broadly to meet compliance burdens.
• Best execution documentation for high touch trades
driving demand.
• Direct market access (DMA ) support for options is not a
focus; regional diversity and number of accounts dilutes
direct efforts.
• Cost to promote platforms is prohibitive.
• Incremental upside for front-end vendors is low due to
lack of existing trading constituency.
• Brokers and data vendor efforts are more successful
due to sales presence and client relationships.
• Smaller funds are embracing electronic tools to execute
smaller orders.
• Workflow efficiencies and lower commissions are
driving adoption.32%
90%
86%
68%
10%
14%
US
2010
2014
High touch Low touch
Europe
What order channels do European investors
use to access US options markets?
Source: TABB Group estimates
“European clients are using low touch
channels to trade. They are becoming
more comfortable trading electronically
in US markets.”
-US Broker

TABB Group European Trading of US Listed Equity Options 2014 | March 2014 12
Lack of understanding of US market structure and trading protocols create the
biggest barrier for European institutional investors
17%
25%
33%
58%
Market access
Lack of crossingfacility
Different tradingprotocol
Market structure
What is the biggest challenge facing buy
side accounts trading US options?
• Understanding of US options market structure
has improved in recent years but the fragmented
exchange landscape is confusing.
• Investors are using more complex strategies
and testing low touch order channels.
• Complex exchange pricing schema inhibits
low touch electronic trading for less
sophisticated investors.
• Inexperienced users look to brokers to support
operational complexities that differ from
European markets.
• Lack of block crossing capabilities fosters use
of broker capital.
• Inability to delta hedge as part of execution
incurs leg risk for clients trading high touch.
• Dedicated technology to support options trading
is not broadly available.
• Large firms with multi-asset capabilities will
invest if magnitude of activity supports need.
• Smaller firms do not have technological
resources to support efficient access.
Source: TABB Group Interviews
“One thing we can do significantly better
is to educate European accounts on
market structure and the amount of
liquidity that is available in US markets.”
-US Broker

TABB Group European Trading of US Listed Equity Options 2014 | March 2014 13
Although regulatory initiatives do not specifically target US options instruments,
many have an ancillary impact on demand
• Direct European regulation has very little negative impact on trading of US options by European investors.
• Adhering to global patchwork by creating compliance programs raises costs for all market participants.
• European regulations and reporting requirements are resulting in exponential rise in compliance costs.
• Regulations designed to increase transparency and reduce risk are shifting demand away from OTC products to
listed instruments.
• US regulations intended to address fraud and improve reporting are shifting demand away from US assets.
Initiative Region Intent Impact Impact on US listed options
Basel III Global
Improve capital adequacy of
banks by reducing risk
exposures
Lowers risk capital to facilitate transactions
in listed options and OTC derivatives
Will drive greater demand for listed
options
Foreign Account Tax
Compliance Act
(FATCA)
US
Identify US financial assets
held in foreign accounts to
reduce tax evasion
Brokerage firms required to request detailed
identifying information from clients trading in
US instruments
Reduces demand from clients not
wanting to report financial information
to US regulators
Markets in Financial
Instruments Directive
(MiFID)
Europe
Harmonize regulation across
European Economic Area
Increase oversight; allows cross border
operation; increases transparency and
mandates best execution requirements
Minimal but raises overall compliance
spend for brokers and investment
firms
European Market
Infrastructure
Regulation (EMIR)
Europe
Increase the safety of the
OTC derivatives market in
Europe
Requires standardized OTC derivatives
contracts be traded on exchanges, centrally
cleared and reported
Minimal but raises overall compliance
spend for brokers and investment
firms
Camp ProposalUS
Change tax treatment of
options transactions
Premium and hedging options strategies
become taxable events
Significant negative impact on US
options market liquidity
Financial Transaction
TaxEurope
Raise revenues Raises the cost of trading, especially for high
volume trading accounts
Will drive trading interest into non-
impacted markets and instruments
UK Bribery Act UK
Eliminate inappropriate
payments intended to solicit
business
Requires firms to institute internal
procedures to demonstrate compliance with
the Act
Minimal but raises overall compliance
spend for brokers and investment
firms

US Options Market Structure

TABB Group European Trading of US Listed Equity Options 2014 | March 2014 15
US options markets volume has seen strong growth since 2000, with trading
increasing 2.7% in 2013, the second highest annual level on record
ETF36%
Index9%
Single Stock55%
Share of 2013 volume by type of option
Source: OCC Source: OCC
0.7 0.8 0.80.9
1.2
1.5
2.0
2.9
3.6 3.63.9
4.6
4.0 4.1
2000 to 2013
CAGR: 14%
Billions of contracts
• US options volume increased 2.7% in 2013, with
the 2000 to 2013 compound annual growth rate
(CAGR) reaching 14%.
• Strong trading in index and ETF products.
• Political uncertainty in the second half of the
year propelled use of index products.
• Hedging strategies surfaced in second half
of year as investors protected gains.
• Volume in options with short term expirations
contributed to the increase.
• Weeklies accounted for 19% of total in 2013,
up from 13% in 2012.
Annual US Options Trading Volume
2000 to 2013

TABB Group European Trading of US Listed Equity Options 2014 | March 2014 16
Liquidity in US options markets is highly concentrated in large capitalization
names with the majority of trading occurring in short term expirations
30% 35% 36% 36% 40% 39% 40%
21%22% 21% 22% 22% 22% 21%
12%10% 11% 11% 10% 11% 10%
26% 23% 23% 22% 20% 21% 21%
12% 9% 9% 9% 8% 7% 8%
2007 2008 2009 2010 2011 2012 2013
Top 10 names 11 to 50 51 to 100
101 to 500 501 and above
• Liquidity in US option markets is concentrated, with 71%
of trading occurring in the top 100 names.
•Index and ETF options dominate most active symbols.
•Most active single stock names include large
capitalization companies and story stocks.
• Volume in short term expirations account for the majority
of trading.
•Weekly expirations accounted for 24% of volume in
January 2014 (July 2010 = 4%).
•Options with weekly expirations are available for 340
symbols.
Concentration of Liquidity by Volume Tier
4%6%
3%
7% 9%12%
8%
12%15%
12%
16%14%
18%22%
24%
0%
5%
10%
15%
20%
25%
30%
0
50
100
150
Weeklys Volume (Left Axis) Weeklys as a % of total volume (Right Axis)
Weekly Expiration Volume
Source: OCC, Hanweck Associates, TABB Group estimates

TABB Group European Trading of US Listed Equity Options 2014 | March 2014 17
-
10
20
30
40
50
60
70
SPY SPX VIX EEM VXX XLF FXI EWZ
2007 2008 2009 2010 2011 2012 2013 2014:FEB
Trading in Active ETF and Index Options
iShares
Emerging
Markets ETF
CBOE VIX
IndexState Street
S&P 500 ETF
CBOE S&P
IndexBarclays S&P
Volatility ETNState Street
Financial ETF
iShares
China ETFiShares Latin
America ETF
Index and ETF options are increasingly favored tools for hedging and
directional strategies
Average monthly volumes
In millions of contracts
• Index and ETF options account for a growing share of
total volume.
• 7 of top 10 most actively traded options are index or
ETF products.
• Represented 81% of total top 10 volume.
• Favored product for investors seeking to hedge sector
exposure.
Rank SymbolVolume
2013 2012
1 SPY 596,304,426 585,945,819
2 SPX 207,488,939 174,457,138
3 VIX 142,999,960 110,739,796
4 IWM 134,857,623 124,525,874
5 AAPL 133,565,372 191,865,563
6 QQQ 94,302,472 113,719,614
7 FB 87,221,967 33,598,749
8 VXX 83,532,121 47,710,104
9 BAC 83,119,984 105,062,041
10 EEM 82,452,022 64,284,148
Top Ten Options Traded by Total Volume
Source: OCC

TABB Group European Trading of US Listed Equity Options 2014 | March 2014 18
Customer order flow accounts for 40% of all US listed options trading with
market makers quoting two-sided markets across all options series
27% 25% 24% 24% 23% 22%
13%12% 13% 15% 15% 15%
1%1% 1%
2% 3% 3%
15%15% 14%
13% 13% 14%
45% 47% 48% 46% 46% 46%
2010 2011 2012 2013 2014 2015
Institutions Retail (Individuals) RIA
Firm Market makers
• Customer order flow accounts for 40% of all trading
in US listed options markets(1).
• Active institutional participants include hedge
funds and proprietary trading accounts.
• Asset managers are expanding their activity.
• Retail investors provide significant order flow in US
options markets.
• Account for 15% of total daily cleared volume.
• Most trading executed through electronic tools.
Trading in US Options Markets
by Type of Account(1)
Source: TABB Group estimates, OCC
100%
55%
18%
64%
42%
42%
65%
27%
Generatepremium
Directionalstrategy
Volatility related
Hedging
Asset managers Hedge funds
Why do you trade options?
(US investors)
(1) Updated March 2016 to include revised estimates.

Market Structure Comparison

TABB Group European Trading of US Listed Equity Options 2014 | March 2014 20
European market’s limited listed liquidity and preferred trading procedures
encourage use of European OTC instruments
• Trading preferences of European institutional investors
favor trading “in the dark”.
• European block crossing mechanisms favor
upstairs trading.
• Investors are comfortable trading in OTC
markets.
• Lower cost and easier trading.
• Regulatory pressure to move OTC trading into central
clearing mechanisms will drive listed adoption.
• Financial crisis of 2008 caused investors to
revaluate credit of counterparties.
• Financial stability has caused credit fears to
recede.
• Limited liquidity in listed products forces investors to
use brokers to provide liquidity.
• Vertical clearing models inhibit liquidity.
• Market structure deters quoting.
66%46%
34%54%
Europe USOTC Listed
Proportion of Notional Trading Value
OTC vs. Listed
0%
20%
40%
60%
80%
100%
Europe US
Proportion of Notional Trading Value in OTC Instruments
Source: Bank for International Settlements
“European investors are used to a very
different market fragmentation. In
Europe it is geographic whereas in the
US it is fragmented at the exchange
level.”
-European investment manager

TABB Group European Trading of US Listed Equity Options 2014 | March 2014 21
Vertical clearing infrastructure at European options exchanges raises the cost
of trading and creates isolated pools of liquidity
• European equity options trading is fragmented by
country and clearing facility.
• Lack of fungibility among clearing houses inhibits
market growth and liquidity creation.
• Fragmented clearing structure impedes capital
allocation and reduces margin efficiencies.
Exchange Country/Region Clearinghouse
Eurex Germany Eurex Clearing
NYSE Liffe UK ICE Clear Europe
OMX Exchanges Nordic/Baltic NASDAQ OMX
Clearing
Meff Renta Variable Spain BME Clearing
Italian Derivatives
Market
Italy Cassa di
Compensazione e
Garanzia
Turquoise Derivatives United Kingdom LCH Clearnet
TOM, The Order
Machine
Holland Holland Clearing
House
Oslo Stock Exchange Norway Oslo Clearing, LCH
Clearnet
Warsaw Stock
Exchange
Poland KDPW_CCP
Clearing House
Athens Derivatives
Exchange
Greece Athex Clear
Wiener Bourse Austria CCP Austria
Budapest Stock
Exchange
Hungary Hungary Central
Clearing House and
Depository0.1
0.2
0.8
4.5
13.7
16.1
22.2
32.1
35.5
140.2
523.4
Wiener Bourse
Athens Der. Exchange
Warsaw Exchange
Oslo Stock Exchange
TOM, The Order Machine
Turquoise Derivatives
Italian Der. Market
Meff Renta Variable
OMX Exchanges
NYSE Liffe
Eurex
US Options Markets
Equity Options Trading Volume by Selected
Exchanges in 2013
(Millions of contracts)
Source: Futures Industry Association, Exchanges
4,111.3

TABB Group European Trading of US Listed Equity Options 2014 | March 2014 22
Automated
Market
Makers
Institutional
Investors
Retail Investors
Voice
Instant Message
FIX
Electronic DMA
Clearing Through
Floor-based
Market
Makers
Broker-
Dealer OCC
Clearing
Member
US options trading is fragmented across 12 exchanges but its horizontal
clearing structure provides margin efficiencies and concentrated liquidity
• US broker-dealers spend significant resources on technology to support access to all exchanges.
• Smart order routing allows brokers to achieve best execution for clients.
• Burden of exchange fee complexity is managed by brokers.
• Horizontal clearing allows investors to direct order flow to exchanges with most advantageous trading model.
• Order flow is primarily directed at available liquidity.
• Low latency strategies prefer price/time priority exchanges.
• More passive retail flow generally routed to pro-rata exchanges.
Source: TABB Group

Profile of European Investment
TABB Group European Trading of US Listed Equity Options 2014 | March 2014 24
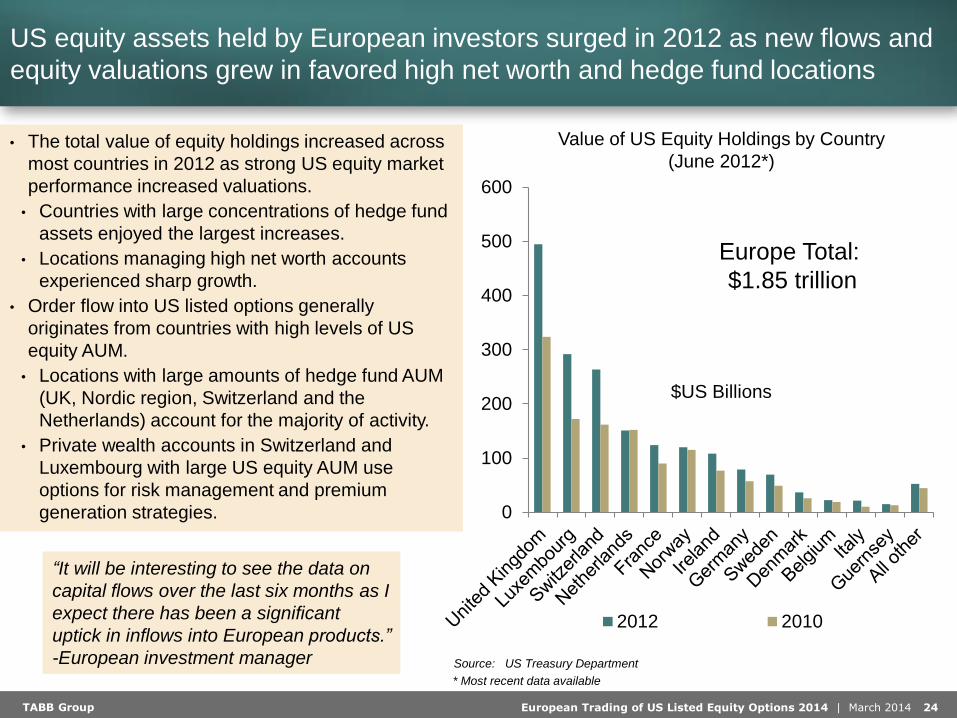
US equity assets held by European investors surged in 2012 as new flows and
equity valuations grew in favored high net worth and hedge fund locations
0
100
200
300
400
500
600
2012 2010
Value of US Equity Holdings by Country
(June 2012*)
$US Billions
Source: US Treasury Department
• The total value of equity holdings increased across
most countries in 2012 as strong US equity market
performance increased valuations.
• Countries with large concentrations of hedge fund
assets enjoyed the largest increases.
• Locations managing high net worth accounts
experienced sharp growth.
• Order flow into US listed options generally
originates from countries with high levels of US
equity AUM.
• Locations with large amounts of hedge fund AUM
(UK, Nordic region, Switzerland and the
Netherlands) account for the majority of activity.
• Private wealth accounts in Switzerland and
Luxembourg with large US equity AUM use
options for risk management and premium
generation strategies.
* Most recent data available
Europe Total:
$1.85 trillion
“It will be interesting to see the data on
capital flows over the last six months as I
expect there has been a significant
uptick in inflows into European products.”
-European investment manager

TABB Group European Trading of US Listed Equity Options 2014 | March 2014 25
Equity Index Market Returns
Jan-10 to Dec-14
The magnitude of European investment in US equity assets fell in 2013 as
returns boosted valuations and global allocations shifted to other regions
60
80
100
120
140
160
180
Europe
(Ex. UK)
19.5%
UK
27.3%
US
66.6%
$55
-$32
$73
$7
2010 2011 2012 2013
European Purchases of US Equity Securities
Net Annual Totals
$US Billions
• European investors significantly reduced the value of investment into US equity securities in 2013.
• Rising US equity valuations increased total valuations, resulting in profit taking and more hedging activities
• Net 2013 US equity flows totaled $7 billion, one tenth of 2012 level.
• Economic recovery in Europe is attracting rising investor interest from international and European investors.
• However, global economic and political uncertainty will drive flows back to the US
• Exposure to dollar-denominated assets will climb as investors execute a flight to safety.
• Volatility product adoption will increase as investors seek uncorrelated hedges.
Source: MSCI Source: US Treasury Department

TABB Group European Trading of US Listed Equity Options 2014 | March 2014 26
European institutional investors represent a large pool of capital with the
potential to expand the use of listed derivatives in equity-related strategies
Investment managers
$13.6
Pension funds$2.2
High net worth$12.4
Hedge funds$0.4
Selected European Institutional Investor Sectors
By Assets Under Management (AuM)
2013
All amounts in $US Trillions
Source: OECD, EFAMA, Capgemini, TABB Group estimates
• Investment funds saw a 8.9% increase in
assets under management in 2013
• Undertakings for Collective Investment in
Transferable Securities Directives (UCITs)
funds accounted for $9.5 trillion in AuM,
up 9% from 2012.
• Non-UCITs AuM increased by 8.8% to
$4.0 trillion.
• High net worth AuM reached an estimated
$12.4 trillion in 2013 as rising equity market
valuations increased valuations by 13.8%
from 2012.
• Concentration of high net worth accounts
in Germany, UK, France and Switzerland.
• Pension fund assets are concentrated in the
Nordic region.
• Investment strategies are driven by
asset/liability relationships and focus on
managing risk.

Conclusions

TABB Group European Trading of US Listed Equity Options 2014 | March 2014 28
Conclusions
• TABB Group estimates 9% of US listed options trading volume originates
from investors domiciled in the UK and continental Europe.• European investors turn to US options markets to hedge exposures, with significant
interest in index and ETF products in times of market volatility.
• Investors will continue to be attracted to the competitive US market structure, deep
liquidity and transparency.
• European-based hedge funds account for the largest share of demand,
representing 55% of total European order flow.• Private wealth managers are using more options in their strategies, accounting for 21% of
total order flow, as US equity assets under management have risen in value.
• Proprietary trading firms accounted for 14% of total order flow, with investment managers
accounting for 6% of total.
• European investor strategies are becoming more diverse and sophisticated
with an increased focus on volatility strategies.• Institutional investors are becoming more sophisticated in how they use US listed options,
with multi-legged strategies becoming increasingly common.
• Low touch trading will continue to gain in importance, especially for smaller-sized orders
originating from the retail and private wealth community.