Embed Size (px)
Citation preview

Consumers Valuations and Choice Processes of Food Safety Enhancement Attributes: An International Study of Beef Consumers
Glynn T. Tonsor
Assistant Professor, Dept. of Agricultural Economics Michigan State University
213D Agriculture Hall East Lansing, MI 48824-1039
Phone: (517) 353-9848 [email protected]
Ted C. Schroeder
Professor, Dept. of Agricultural Economics Kansas State University
Manhattan, KS
Joost M.E. Pennings Associate Professor, Dept. of Agricultural and Consumer Economics,
University of Illinois at Urbana-Champaign AST Professor of Marketing & Decision Science,
Wageningen University, The Netherlands
and
James Mintert Professor, Dept. of Agricultural Economics
Kansas State University Manhattan, KS
Working paper being prepared for presentation at the American Agricultural Economics Association Annual Meetings
Portland, OR, July 30 - August 1, 2007
Copyright 2007 by Glynn T. Tonsor, Ted C. Schroeder, Joost M.E. Pennings, and James Mintert. All rights reserved. Readers may make verbatim copies of this document for non-commercial purposes by any means, provided that this copyright notice appears on all such copies.

Consumers Valuations and Choice Processes of Food Safety
Enhancement Attributes: An International Study of Beef Consumers Abstract
Food safety concerns have had dramatic impacts on food and livestock markets in recent
years. Here we examine consumer preferences for various beef food safety assurances. In
particular, we evaluate the extent to which such preferences are heterogeneous within and across
country-of-residence defined groups and examine the distributional nature of these preferences
with respect to marginal improvements in food safety. We collected data from over 4,000 U.S.,
Canada, Japan, and Mexican consumers. Using mixed logit models we find that Japanese and
Mexican consumers have WTP preferences that are nonlinear in the level of food safety risk
reduction. Conversely, U.S .and Canadian consumers appear to possess linear preferences. These
results suggest that optimal food safety investment strategies hinge critically upon consumer
perception of actual food safety improvements, the distributional relationship describing the
targeted consumer segment’s tradeoff function between WTP premiums and risk reduction
levels, and the cost structure of these investments.
Keywords: consumer beef preference, food safety, investment decision, mixed logit, willingness-
to-pay
1

1. Introduction
Food safety is a growing global concern. Maintaining and gaining market access is
increasingly requiring more substantial assurance and demonstration of food safety protocols by
food production and processing industries. Food safety management and regulation is receiving
more direct involvement by government regulatory and inspection agencies and has gained
considerable attention of policy makers. Consumers are demanding increased food safety
assurances as even very isolated food safety events have caused major market disruptions. Beef
markets have been particularly adversely affected by food safety concerns in recent years. For
example, discovery of a single beef cow in the U.S. infected with bovine spongiform
encephalopathy (BSE) in 2003 caused immediate and long-lasting closure of virtually all U.S.
beef export markets.1 Regaining global market access has required major changes in animal age
verification, costly alterations to beef processing, product losses, and careful segregation of meat
products (Coffey et al., 2005). Furthermore, intensive inspections coupled with zero tolerance for
a variety of food safety related concerns, have made maintaining market access, even with a host
of added food safety protocols, regulations, and frequent audits, a major challenge.
Enhancing food safety requires increased food production, processing, and handling
costs. Therefore, before large investments in food safety protocols, policies, and inspections are
made, more information is needed regarding the probable return from these investments. That is,
we need to know how concerned consumers are about beef food safety and how much they are
willing to pay for an increase in food safety assurances in order to determine appropriate
investments in food safety management and monitoring. The purpose of this study is to estimate
consumer valuation for food safety enhancements in beef steak relative to the valuation of other
1 A similar discovery a few months earlier in Canada caused a similar but economically even more dramatic impact because of the greater dependence of the Canadian industry on beef exports.
2

product attributes. This research focuses on increasing our understanding of similarities and
differences in consumer perceptions and valuations for beef attributes in Canada, U.S., Japan,
and Mexico. These four countries were, historically, the largest markets for North American
beef. Furthermore, given the markedly different reactions in these countries to beef food safety
events, they warrant more investigation regarding differences in preferences. The approach taken
here provides an empirical examination of the extent of consumer heterogeneity in preferences
within and across countries. Furthermore, the derived model is used to draw conclusions about
the value of investments that could be made in enhancing food safety for beef destined for these
four markets.
2. Previous Research
Several studies have investigated what consumers are willing to pay to avoid or obtain
various food attributes (McCluskey et al., 2003; Grannis and Thilmany, 2002; Misra, Grotegut,
and Clem, 1997; Misra, Huang, and Ott, 1991; Roosen, Lusk, and Fox, 2003; Burton et al., 2001;
Lusk, Roosen, and Fox, 2003; Roosen, 2003; Alfnes, 2003; Tonsor et al., 2005). A few studies
have focused on consumer willingness to pay for food safety assurances or risk reductions
(Brown, Cranfield, and Henson, 2005; Goldberg and Roosen, 2005; McCluskey et al., 2005).
Brown, Cranfield, and Henson (2005) employed an experimental auction to value Canadian
consumers’ willingness to pay for reductions in risk of becoming ill from exposure to
Campylobacter from a chicken sandwich. Using Vickrey 2nd price auctions, the authors found
consumer willingness to pay for lower Campylobacter risk to be decreasing functions of the
individual’s risk tolerance.
3

In a study among German consumers, Goldberg and Roosen (2005) used both contingent
valuation and choice experiment methods to examine consumer willingness to pay for reductions
in Salmonellosis and Campylobacter risk. Willingness to pay was highly convex in the level of
each risk reduction. That is, WTP increased more than proportionally with risk reductions.
McCluskey et al. (2005) examined Japanese consumer reluctance to exchange money for BSE-
tested beef. Using choice contingent valuation methods the authors’ findings suggested that
representative Japanese consumers were willing to pay a 56% price premium for BSE-tested
beef.
Each of these studies (Brown, Cranfield, and Henson, 2005; Goldberg and Roosen, 2005;
McCluskey et al., 2005) contributes to our understanding of consumer perceptions of food safety
risk in the meat industry. However, significant need to extend this work motivated our study. In
particular, each of these prior studies assumed homogeneous preferences across consumers,
analyzed a single country-of-residence based consumer group, and did not utilize data collection
methodologies that would allow consumers to reveal tradeoffs between non-monetary product
attributes and food safety. Each of these issues are addressed in this research. In particular,
heterogeneous preferences are evaluated (utilizing mixed logit models), in a multinational study
which allows for cross-country comparisons vital in understanding the international meat market
complex. In addition, the employed choice experiment facilitates an evaluation of consumer
willingness to trade food safety attributes for both monetary and non-monetary traits.
3. Research Design: Data Collection and Choice Experiment
This study uses a choice experiment to estimate WTP for beef steak attributes. Our
sample, drawn from consumers in the U.S., Canada, Japan, and Mexico, represents a broader
4

sample of consumers than in prior studies. Furthermore, we empirically compare Mexican
consumer preferences for beef attributes with consumers from other countries. Given the
growing importance of the Mexican market for Canadian and U.S. beef producers, this is an
additional, timely contribution.
To collect information about consumer perceptions and preferences we conducted an on-
line computer survey of consumers from households located in Canada (N=1002), the U.S.
(N=1009), and Japan (N=1001). The same survey was conducted via in-person interviews in
Mexico (N=993). The Mexico surveys were completed in-person because of limited computer
access and/or use among the general population in Mexico.2 The survey was translated into
French (primarily for use in Quebec), Spanish (for Mexico), and Japanese to accommodate
different respondent languages across countries.
The surveys were conducted through TNS NFO, a global market research company. TNS
NFO has a vast consumer panel, with more than 5 million individuals worldwide in their data
bank. For our surveys, TNS NFO targeted one adult per household who was familiar with
shopping habits. Target respondents were older than 18 years of age and overall came from a
representative distribution of household income levels. Ranking and choice questions were
presented in randomized order across respondents to reduce question ordering biases. All surveys
were completed between late February and early March 2006. Respondents were assured their
answers would be anonymous and we were not supplied with information about specific
respondent identities beyond socio-demographic data.
In addition to socio-demographic information about each respondent, meat consumption
habits, perceptions of food safety risk present when consuming beef, and a multitude of other
factors were collected. Each respondent also completed a choice experiment designed to 2 A copy of the survey instrument is available upon request.
5

determine the amount consumers were willing to pay for various beef steak production, food
safety, and product quality attributes. Combined, this information provides a comprehensive
assessment of views and preferences of consumers from four different countries about beef
products and attributes.
Choice experiments simulate real-life purchasing situations and permit multiple attributes
to be evaluated, thus allowing researchers to estimate tradeoffs among different alternatives
(Lusk, Roosen, and Fox, 2003). In this choice experiment, consumers were presented with a set
of 21 simulated shopping scenarios, each of which involved choosing a preferred alternative
from two beef strip loin steaks and a no purchase option.
Steaks were offered at four different price levels selected to be consistent with local retail
prices. In addition to price, the steaks varied by country of origin, production practice, tenderness
level, and food safety assurance (see table 1). An orthogonal fractional design (Kuhfeld, Tobias,
and Garratt, 1994) was used to select scenarios in which steak prices are uncorrelated, and which
allows for identification of own-price, cross-price, and alternative specific effects. This process
also allows the choice experiment to be of reasonable size for survey participants. An example of
choice scenario included in the choice experiment is:
Steak Attribute Option A Option B Option C
Price ($/lb.) $14.00 $11.00
Country of Origin USA Canada
Production Practice Natural Natural
Tenderness Assured Tender Uncertain
Food Safety Assurance Enhanced 80% Enhanced 40%
Neither A nor
B is preferred
I choose …
6

Though the choice experiments were hypothetical in that they did not include actual
money or actual steak products, our instructions specifically stated “It is important that you make
your selections like you would if you were actually facing these choices in your retail purchase
decisions.” This statement was included as part of a “cheap-talk” strategy at reducing
hypothetical bias by informing survey participants of the concept prior to conducting the choice
experiment (Lusk, 2003; Cummings and Taylor, 1999). Furthermore, given that our principal
interest is differences in marginal willingness-to-pay amounts, we are less concerned with the
hypothetical nature of our survey. This reassurance is based upon Lusk and Schroeder’s (2004)
research, which suggests that hypothetical willingness-to-pay for marginal changes in desirable
attributes are not significantly different from non-hypothetical valuations. Descriptions included
in the choice experiments of the specific product attributes were:
Country of Origin refers to the country in which the cow was raised and includes Canada, Japan, Mexico, or USA. Production Practice is the method used to produce the cow where Approved Standards means the cow was raised using scientifically-determined safe and government-approved use of synthetic growth hormones and antibiotics (typical of cattle production methods used in USA and Canada); Natural is the same as typical except the cow was raised without the use of synthetic growth hormones or antibiotics. Tenderness refers to how tender the steak is to eat and includes Assured Tender which means the steak is guaranteed tender by testing the steak using a tenderness measuring instrument and Uncertain means there are no guarantees on tenderness level of the steak and the chances of being tender are the same as typical steaks you have purchased in the past. Food Safety Assurance refers the level of food safety assurance with the steak. Typical food safety means the steak meets current minimum government standards for food safety. Enhanced 40% means measures have been taken to reduce risks of illness associated with food safety from consuming the product by 40% relative to typical. Enhanced 80% means measures have been taken to reduce risks of illness associated with food safety from consuming the product by 80% relative to typical.
A total of 4,005 respondents completed the survey across all four countries. Summary
data of selected demographic attributes of survey respondents are provided in table 2. In Canada
7
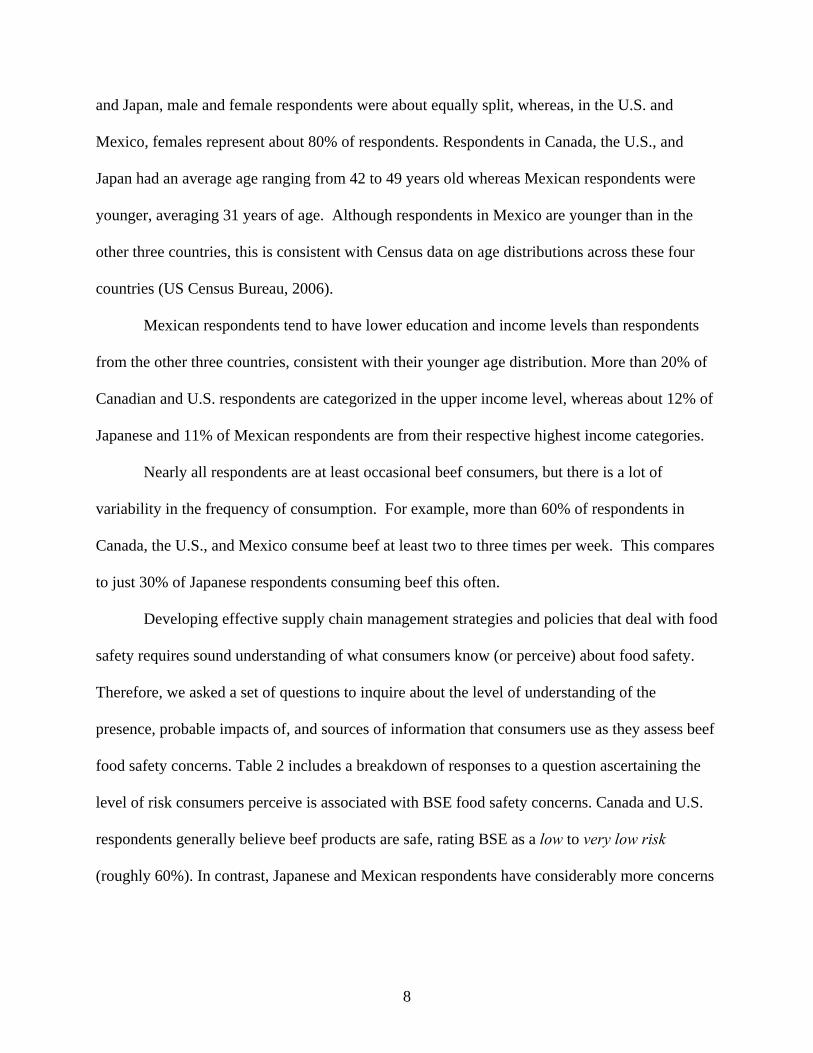
and Japan, male and female respondents were about equally split, whereas, in the U.S. and
Mexico, females represent about 80% of respondents. Respondents in Canada, the U.S., and
Japan had an average age ranging from 42 to 49 years old whereas Mexican respondents were
younger, averaging 31 years of age. Although respondents in Mexico are younger than in the
other three countries, this is consistent with Census data on age distributions across these four
countries (US Census Bureau, 2006).
Mexican respondents tend to have lower education and income levels than respondents
from the other three countries, consistent with their younger age distribution. More than 20% of
Canadian and U.S. respondents are categorized in the upper income level, whereas about 12% of
Japanese and 11% of Mexican respondents are from their respective highest income categories.
Nearly all respondents are at least occasional beef consumers, but there is a lot of
variability in the frequency of consumption. For example, more than 60% of respondents in
Canada, the U.S., and Mexico consume beef at least two to three times per week. This compares
to just 30% of Japanese respondents consuming beef this often.
Developing effective supply chain management strategies and policies that deal with food
safety requires sound understanding of what consumers know (or perceive) about food safety.
Therefore, we asked a set of questions to inquire about the level of understanding of the
presence, probable impacts of, and sources of information that consumers use as they assess beef
food safety concerns. Table 2 includes a breakdown of responses to a question ascertaining the
level of risk consumers perceive is associated with BSE food safety concerns. Canada and U.S.
respondents generally believe beef products are safe, rating BSE as a low to very low risk
(roughly 60%). In contrast, Japanese and Mexican respondents have considerably more concerns
8

about beef food safety related to BSE risk with more than 50% of respondents from each country
perceiving high or very high risk.
4. Research Method: Random Parameters Logit and WTP Analysis
A random parameters logit (RPL) model (also known as a mixed logit) was used to
determine consumer willingness to pay for the various steak attributes of interest. The RPL
model allows for random taste variation within the surveyed population, is free of the
independence of irrelevant alternatives (IIA) assumption, and allows correlation in unobserved
factors over time, thus eliminating three limitations of standard logit models (Train, 2003; Revelt
and Train, 1998). Use of RPL models, rather than standard multinomial logit models, is
relatively recent but increasing in popularity. In the context of our study, the RPL is appealing
for a number of reasons. First, some of the steak alternatives presented in our choice experiment
are similar, possibly making the IIA assumption overly restrictive. Secondly, a growing amount
of research suggests consumers possess heterogeneous preferences, so employing a model that
allows for and evaluates preference heterogeneity is appropriate (Lusk, Roosen, and Fox, 2003;
Alfnes and Rickertsen, 2003; Alfnes, 2004; Tonsor et al., 2005).
Underlying the random parameters logit model is the consumer’s random utility (U), in
which the utility of option j for individual i in choice situation t is described by:
++= ][ V U ijtijt ijtij ευ (1),
where Vijt is the systematic portion of the utility function, ijυ is an error term distributed normally
over individuals and alternatives (but not choice situations), and εijt is the stochastic error
component i.i.d. over all individuals, alternatives, and choice situations. As noted by Alfnes
(2004), this describes a panel data model where the cross-sectional element is individual i and
9

the time-series component is the t choice situations. Important to note is that failure to utilize a
panel data specification in this context would result in a mis-specified model. This arises from
the perfect correlation of demographic variables across choice situations that would be ignored
by assuming 0=ijυ (as in the traditional multinomial logit).3 The probability that subject i
chooses option j in choice situation t is given by:
k ) V P(V)UP(U iktijtiktijt ∀ ++≥ ++=≥ iktikijtij ευευ (2).
Assuming the observable portion of utility is linear in parameters, we initially specify
as:
ijtV
BAjFoodSafetyFoodSafetyTender
NaturalMexicoJapanUSCanadaPV
jtjtjt
jtjtjtjtjtjtijt
,8040 876
543210
=∀+++
+++++=
βββ
βββββα (3),
CjVijt == 0 (4),
where is the price of alternative j (A, B, or C) in choice situation t, , , ,
and are dummy variables equal to one if the beef steak is labeled as originating from
Canada, the U.S., Japan, or Mexico, respectively (0 otherwise), , ,
, and denote dummy variables equal to one if the alternative is
labeled as being naturally produced, assured to be tender, has 40% enhanced food safety relative
to standard practices, and has 80% enhanced food safety, respectively (0 otherwise), and
jtP jtCanada jtUS jtJapan
jtMexico
jtNatural jtTender
jtFoodSafety40 jtFoodSafety80
0α and kβ (k=1, … ,8) are parameters to be estimated.
The model as specified in equations (3) – (4) fails to incorporate information about
survey participants such as demographic variables or behavior observed from separate survey
questions. Recent research (e.g., Nahuelhual, Loureiro, and Loomis, 2004) has demonstrated the 3 Consequently, our model estimation procedures are carried out in LIMDEP (Greene, 2002) utilizing the program’s panel data specification.
10

possible adverse implications of this omission. In essence, including individual specific
information reduces possible omitted variable bias and allows us to determine if preference
heterogeneity persists beyond typically observed factors. Furthermore, this results in derived
willingness-to-pay estimates being functions of the included individual characteristics. This is
more consistent with economic theory than classical WTP approaches that assume WTP is
simply a function of product attributes (e.g., Lusk, Roosen, and Fox, 2003).
To incorporate observed individual characteristics, equation (3) is re-specified as:
BAjFoodSafetyFoodSafety
TenderNaturalMexico
JapanUSCanadaPV
jtFoodSafetyjtFoodSafety
jtTenderjtNaturaljtMexico
jtJapanjtUSjtjtijt
,80*)(40*)(
*)(*)(*)(
*)(*)(*)(
808407
654
3210
=∀′++′++
′++′++′++
′++′++′++=
ii
iii
iiiCanada
ZγZγ
ZγZγZγ
ZγZγZγ
ββ
βββ
βββα (5),
where the variables in equation (5) are defined as in equation (3),
is a vector of individual i’s
characteristics, , , , , and are demographic
variables as defined in table 2, and
][ iiiiii BSE_Risk,Consume,Income,Education,FemaleZ =
iFemale iEducation iIncome iConsume iRiskBSE _
0α , kβ (k=1, ... ,8), and lγ′ ( l = Canada, … , FoodSafety80)
are parameters to be estimated.
Following Nahuelhual, Loureiro, and Loomis (2004), models defined by equation (5) are
estimated with the steak attribute constants ( kβ ) allowed to vary randomly and with the price
coefficient ( 0α ) fixed to keep it from varying within each population. The “population” from
which the parameters are drawn from refers to either the sample of U.S., Canadian, Japanese, or
Mexican participants. The normally distributed parameters can be more formally represented as:
ikkk uBBik *σ+= (6),
11

where kB is the mean estimate of kβ across all individuals, kσ is a diagonal matrix containing the
standard deviations of kB , and is a vector of independent normal deviations for each
individual within the population (e.g., within each country). If
iku
kσ is not statistically different from
zero, the estimate of kB sufficiently describes the population’s preferences implying preference
homogeneity within a country. However, statistical significance of kσ suggests significant
preference heterogeneity for attribute k.4
Random parameters logit model estimated coefficients themselves have little interpretive
value. However, relative combinations of select coefficients provide economically meaningful
insights on consumer preferences. In particular, the willingness to pay for steak attributes can
easily be calculated. Following Nahuelhual, Loureiro, and Loomis (2004) mean WTP for
respondents from each country are calculated for each non-price attribute listed in equation (5) at
the means of (denoted Z Z ). For example, mean WTP for assurance of steak tenderness is given
by:
0
6 ])[(
α
βNWTPMean
iTender
Tender
∑ ′+−
=
Zγ
(7).
Not allowing the price coefficient ( 0α ) to vary randomly ensures a negative price
coefficient for all respondents (Lusk, Roosen, and Fox, 2003) and ensures that willingness to pay
estimates are normally distributed. To test if the estimated average WTP premiums are
statistically different from zero, a Krinsky-Robb (1986) bootstrapping procedure was employed.
More specifically, by utilizing the estimated parameter vector and covariance matrix, 1,000 WTP
4 The resulting model contains 57 parameters to estimate. This estimation, while computationally cumbersome, is feasible given the large data set collected in this study.
12

estimates were generated from 1,000 randomly drawn parameter vectors. Given these 1,000
WTP estimates, 95% confidence intervals are constructed.
The Krinsky-Robb bootstrapped WTP estimates are further utilized to empirically test for
differences in WTP preferences. In particular, a combinational technique suggested by Poe,
Giraud, and Loomis (2005) was used to provide a simple nonparametric evaluation of differences
in WTP distributions. The difference between two Krinsky-Robb bootstrapped WTP series is
evaluated with this difference being calculated for all possible combinations of the two
bootstrapped series. In other words, 1,000,000 differences
( 000,11and000,11where;,,e.g. −=−=∀− babaWTPWTP ba ) are calculated for each test. The
proportion of simulated differences less than zero represents the probability that .
In other words, this proportion is analogous to a p-value associated with the one-sided test of
. This combinational approach is more precise than simply evaluating if the
95% confidence intervals previously mentioned overlap (Poe, Giraud, and Loomis, 2005).
ba WTPWTP <
abo WTPWTPH >:
5. Results
Prior to settling on the random utility model as specified in equations (4) – (6), a wide
array of alternative model specifications were considered. While the multitude of model
specification tests are not presented here for brevity; log likelihood tests consistently reject the
hypothesis that preferences are jointly homogeneous (e.g. kk ∀= 0σ ) and the hypothesis that the
consumer characteristic interaction terms are jointly insignificant (e.g ll ∀=′ 0γ ). Overall,
model fit of the utilized models (table 3) was strong and consistent with other applications of
random parameters logits (e.g., Lusk, Roosen, and Fox, 2003).
13
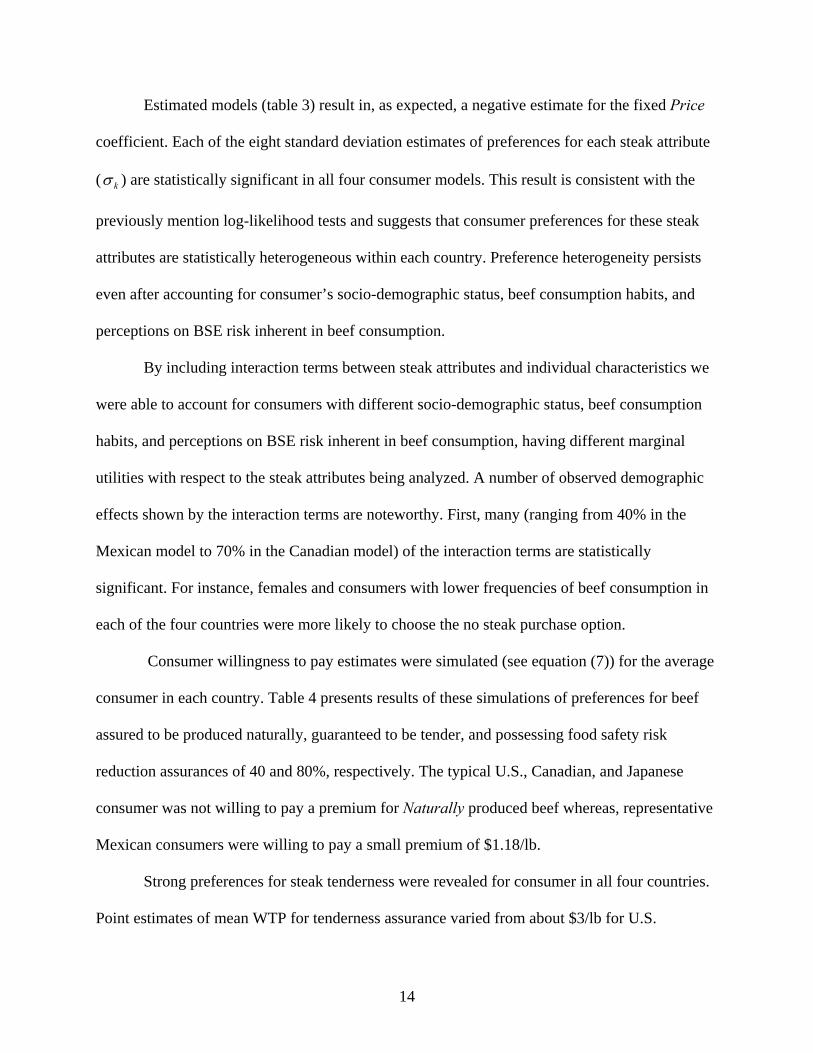
Estimated models (table 3) result in, as expected, a negative estimate for the fixed Price
coefficient. Each of the eight standard deviation estimates of preferences for each steak attribute
( kσ ) are statistically significant in all four consumer models. This result is consistent with the
previously mention log-likelihood tests and suggests that consumer preferences for these steak
attributes are statistically heterogeneous within each country. Preference heterogeneity persists
even after accounting for consumer’s socio-demographic status, beef consumption habits, and
perceptions on BSE risk inherent in beef consumption.
By including interaction terms between steak attributes and individual characteristics we
were able to account for consumers with different socio-demographic status, beef consumption
habits, and perceptions on BSE risk inherent in beef consumption, having different marginal
utilities with respect to the steak attributes being analyzed. A number of observed demographic
effects shown by the interaction terms are noteworthy. First, many (ranging from 40% in the
Mexican model to 70% in the Canadian model) of the interaction terms are statistically
significant. For instance, females and consumers with lower frequencies of beef consumption in
each of the four countries were more likely to choose the no steak purchase option.
Consumer willingness to pay estimates were simulated (see equation (7)) for the average
consumer in each country. Table 4 presents results of these simulations of preferences for beef
assured to be produced naturally, guaranteed to be tender, and possessing food safety risk
reduction assurances of 40 and 80%, respectively. The typical U.S., Canadian, and Japanese
consumer was not willing to pay a premium for Naturally produced beef whereas, representative
Mexican consumers were willing to pay a small premium of $1.18/lb.
Strong preferences for steak tenderness were revealed for consumer in all four countries.
Point estimates of mean WTP for tenderness assurance varied from about $3/lb for U.S.
14
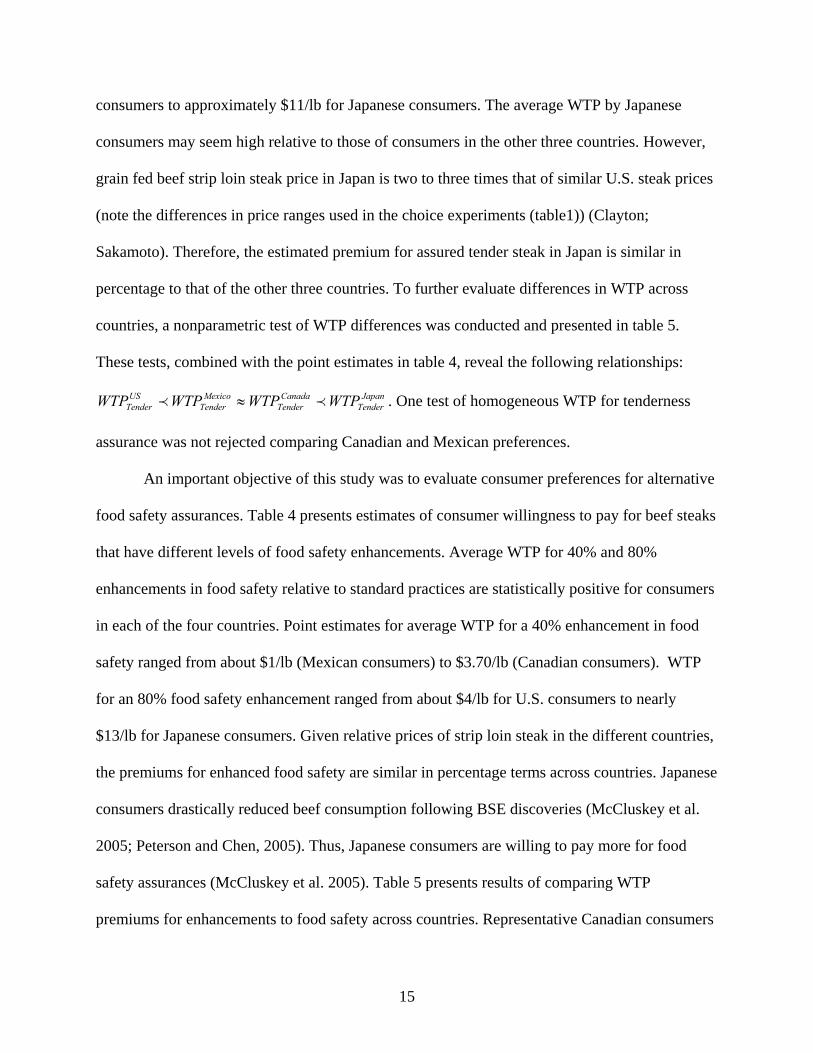
consumers to approximately $11/lb for Japanese consumers. The average WTP by Japanese
consumers may seem high relative to those of consumers in the other three countries. However,
grain fed beef strip loin steak price in Japan is two to three times that of similar U.S. steak prices
(note the differences in price ranges used in the choice experiments (table1)) (Clayton;
Sakamoto). Therefore, the estimated premium for assured tender steak in Japan is similar in
percentage to that of the other three countries. To further evaluate differences in WTP across
countries, a nonparametric test of WTP differences was conducted and presented in table 5.
These tests, combined with the point estimates in table 4, reveal the following relationships:
. One test of homogeneous WTP for tenderness
assurance was not rejected comparing Canadian and Mexican preferences.
JapanTender
CanadaTender
MexicoTender
USTender WTPWTPWTPWTP pp ≈
An important objective of this study was to evaluate consumer preferences for alternative
food safety assurances. Table 4 presents estimates of consumer willingness to pay for beef steaks
that have different levels of food safety enhancements. Average WTP for 40% and 80%
enhancements in food safety relative to standard practices are statistically positive for consumers
in each of the four countries. Point estimates for average WTP for a 40% enhancement in food
safety ranged from about $1/lb (Mexican consumers) to $3.70/lb (Canadian consumers). WTP
for an 80% food safety enhancement ranged from about $4/lb for U.S. consumers to nearly
$13/lb for Japanese consumers. Given relative prices of strip loin steak in the different countries,
the premiums for enhanced food safety are similar in percentage terms across countries. Japanese
consumers drastically reduced beef consumption following BSE discoveries (McCluskey et al.
2005; Peterson and Chen, 2005). Thus, Japanese consumers are willing to pay more for food
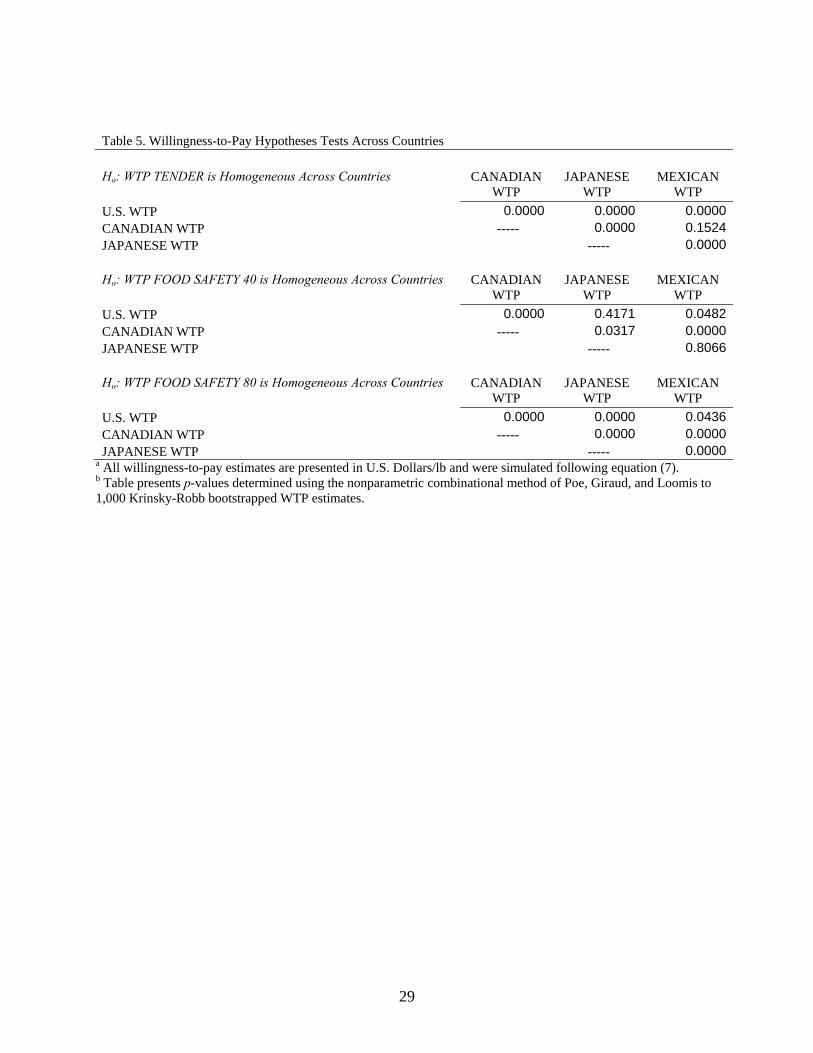
safety assurances (McCluskey et al. 2005). Table 5 presents results of comparing WTP
premiums for enhancements to food safety across countries. Representative Canadian consumers
15

are willing to pay more for a 40% enhanced food safety than consumers in the other three
countries. Conversely, with respect to an 80% enhancement in food safety, Japanese consumers
are willing to pay more than typical consumers in the other three countries. All six pair-wise tests
of equal premiums reveals a statistically significant (at the 0.05 level) ranking for the 80%
enhanced food safety assurance of:
JapanFoodSafety
CanadaFoodSafety
MexicoFoodSafety
USFoodSafety WTPWTPWTPWTP 80808080 ppp .
To further investigate consumer preferences regarding non-monetary tradeoffs, we
compare consumer WTP for tenderness with each level of food safety enhancement assurance
and evaluate the distribution of marginal preferences for incremental adjustments in food safety
risk reduction. Table 6 presents results of corresponding nonparametric tests comparing WTP
series to facilitate these evaluations.
The typical consumer in all four countries is willing to pay significantly more for assured
tender steak than for a 40% enhancement in food safety. However, as food safety is enhanced
further to 80%, consumers in the U.S. and Canada are statistically willing to pay more for the
enhanced food safety than for tenderness assurances at the 0.05 significance level and Japanese
consumers are marginally willing to pay more for the safety enhancement (0.055 significance
level). On the other hand, Mexican consumers are statistically indifferent between the 80%
enhanced food safety and tenderness assurances. From a demand stand point, if consumers deem
that only partial success in food safety risk enhancement is achieved (as simulated here by 40%
versus 80% enhancements), demand for beef may actually be strengthened more by
improvements in tenderness than by what might be perceived as small improvements in food
safety management. Conversely, if consumers view improvements in food safety to be more
16
substantial (as in a 80% improvement rather than 40%), consumer beef demand would respond
more to food safety improving investments then to assuring steak tenderness.
Table 6 also provides insight into the distribution of marginal utilities for the typical
consumer in each country for food safety enhancements. In particular, we tested whether
consumer WTP for an 80% enhancement in food safety was greater than twice the premium
consumers would pay for a 40% enhancement. This test reveals whether WTP for food safety
enhancements are convex, linear, or concave in the level of safety enhancement.
Representative Japanese and Mexican consumers are willing to pay an amount for 80%
food safety enhancements that are significantly more than twice what they would pay for a 40%
enhancement. That is, their preferences are convex in the level of food safety enhancement.
Conversely, the typical U.S. and Canadian consumer have no statistical difference between WTP
for 80% and twice the premium for 40% food safety enhancements, suggesting a linear WTP
food safety enhancement relationship. These differences are illustrated in Figure 1 using
smoothed functions of the WTP point estimates at 0%, 40%, and 80% food safety enhancements
to reveal the relationships for each country. Figure 1 (along with table 4) also suggests that if
constraints (e.g., state of technology, capital, etc.) are restricting such that only a 40% food
safety enhancement is feasible, then investments targeting Canadian consumers may be most
advisable. Conversely, if 80% enhancements in food safety are possible, investment targeting
Japanese and then Canadian consumers may provide the most opportunity.
6. Managerial Implications
The value of investing in additional food safety assurances rests heavily on the preference
structures of heterogeneous consumers being targeted, the relative amount and effectiveness of
17

food safety enhancement consumers perceive by the investment, and the cost structure associated
with implementing the proposed food safety enhancement procedures. Our analysis indicates
U.S. and Canadian consumers have linear preferences for food safety enhancement whereas
Japanese and Mexican consumers have convex preferences. These differences, especially when
operating with incomplete information regarding the cost structure associated with food safety
enhancement, are vital to note in making optimal food safety enhancement investment decisions.
Given differences in preference structures of targeted consumer groups identified in our
research, the optimal decision regarding food safety enhancement will vary both across and
within each country. Estimates of “food safety enhancement” costs are difficult to obtain as one
would need, at the minimum, a thorough understanding of the procedures enacted to enhance
food safety vertically throughout the supply chain and how effective targeted consumers would
perceive such procedural changes. Future advancements on these and related critical issues will
further enhance the contributions of this study. The general point is that the value of investing in
additional food safety assurances rests heavily on the preference structures of heterogeneous
consumers being targeted, the relative amount and effectiveness of food safety enhancement
consumers perceive by the investment, and the cost structure associated with implementing the
proposed food safety enhancement procedures.
7. Conclusion
Food safety concerns have had dramatic impacts on food and livestock markets in recent
years. Furthermore, food safety assurances deemed to stabilize these markets and satisfy
consumer demand are costly endeavors to implement. Despite this, relatively little research has
examined consumer preferences for various beef food safety assurances. In particular, the
18

literature is sparse in evaluating the extent to which such preferences are heterogeneous within
and across country-of-residence defined groups and in examining the distributional nature of
these preferences with respect to marginal improvements in food safety.
This article addresses these issues by examining an array of beef steak preferences among
consumers in the U.S., Canada, Japan, and Mexico. Particular attention is devoted to evaluating
how much representative consumers in each country are willing to pay for marginal
improvements in food safety while also examining the extent of preference heterogeneity and
allowing for non-monetary tradeoffs with food safety.
Representative Japanese and Mexican consumers have preferences that are nonlinear in
the level of beef steak food safety enhancement. Conversely, typical U.S. and Canadian
consumers appear to possess principally linear preferences. These findings suggest that optimal
investment strategies hinge critically upon both consumer perception of actual food safety
improvements and the distributional relationship describing the targeted consumer segment’s
tradeoff function between WTP premiums and risk reduction levels.
If consumers view proposed investments as only marginally improving food safety, the
beef industry is better off investing in product eating characteristics such as improved tenderness.
Conversely, if the targeted consumer group perceives food safety investments as significantly
reducing the level of food safety risk, such investments become more viable options. Care should
be taken to note that these comments are made in the absence of policy or other externality
factors intervening. This is important given the public good debate and history of various
methods of governmental regulation in issues pertaining to food safety.
Here, we discussed the results in terms of a representative consumer for each country.
Such an analysis is helpful in understanding how consumers in different countries value food
19

enhancement attributes in relation to other food attributes and will be helpful in developing
country specific investments for the food industry. However, it is important to note that the
results showed that within a country there is significant heterogeneity in consumer preferences
regarding food safety assurance attributes. Further research may help identify observable factors
driving this heterogeneity. Improved knowledge of factors motivating consumer behavior with
respect to food safety would help policy makers (e.g., governments and industry) identify
segment specific food safety activities which would be far more effective than a one size fits all
strategy. Pennings and Garcia (2004) made a first attempt to profile segments of decision makers
based upon their decision processes. Combining their methodology with that employed in our
research increases our knowledge about heterogeneous preferences for food safety attributes.
Improved knowledge of the costs that will be incurred by the beef industry to provide
additional food safety assurances could set the stage for valuable extensions of this research. An
array of challenges exist in obtaining such information, which are further compounded by the
fact that diverse consumer segments perceive alternative food safety risk to be of varying
importance. Nonetheless, future work could seek to enhance the understanding of factors
influencing the supply of additional food safety assurances utilizing the results presented here
pertaining to consumer demand for these attributes.
20

References Alfnes, Frode. (2004). Stated Preferences for Imported and Hormone-Treated Beef: Application
of a Mixed Logit Model. European Review of Agricultural Economics. 31:19-37. Alfnes, Frode and K. Rickertsen. (2003). European Consumers’ Willingness to Pay for U.S.
Beef in Experimental Auction Markets. American Journal of Agricultural Economics. 85: 396-405.
Brown, J., J.A.L. Cranfield, and S. Henson. (2005). Relating Consumer Willingness-to-Pay for
Food Safety to Risk Tolerance: An Experimental Approach. Canadian Journal of Agricultural Economics. 53:249-263.
Burton, M., D. Rigby, T. Young, and S. James. (2001). Consumer Attitudes to Genetically
Modified Organisms in Food in the U.K. European Review of Agricultural Economics. 28:479-498.
Clayton, P. (2006). U.S. Meat Export Federation, e-mail correspondence. Coffey, B., J. Mintert, J. Fox, T. Schroeder, and L. Valentin. (2005). The Economic Impact of
BSE on the U.S. Beef Industry: Product Value Losses, Regulatory Costs, and Consumer Reactions. (Extension Bulletin MF-2678). Manhattan, KS: Kansas State University Agricultural Experiment Station and Cooperative Extension Service.
Cummings, R.G. and L.O. Taylor. (1999). Unbiased Value Estimates for Environmental Goods:
A Cheap Talk Design for the Contingent Valuation Method. American Economic Review. 89:649-665.
Goldberg, I. and J. Roosen. (2005). Measuring Consumer Willingness to Pay for a Health Risk
Reduction of Salmonellosis and Campylobacteriosis. Paper presented at the European Association of Agricultural Economists annual meeting. Copenhagen, Denmark. August 24-27.
Grannis, J. and D. Thilmany. (2002). Marketing Natural Pork: An Empirical Analysis of
Consumers in the Mountain Region. Agribusiness: An International Journal. 18: 475-489.
Greene, W. (2002). NLOGIT Version 3.0 Reference Guide. Econometric Software, Inc. Krinsky, I. and A. Robb. (1986). On Approximating the Statistical Properties of Elasticities.
The Review of Economics and Statistics. 64:715-719. Kuhfeld, W.F., R.D. Tobias, and M. Garratt. (1994). Efficient Experimental Design with
Marketing Research Applications. Journal of Marketing Research. 31:545-557.
21

Lusk, J. (2003). Effects of Cheap talk on Consumer Willingness-to-Pay for Golden Rice.
American Journal of Agricultural Economics. 85: 840-856. Lusk, J., J. Roosen, and J. Fox. (2003). Demand for Beef from Cattle Administered Growth
Hormones or Fed Genetically Modified Corn: A Comparison of Consumers in France, Germany, the United Kingdom, and the United States. American Journal of Agricultural Economics. 85: 16-29.
Lusk, J.L. and T. C. Schroeder. (2004). Are Choice Experiments Incentive Compatible? A Test
with Quality Differentiated Beef Steaks. American Journal of Agricultural Economics. 86:467-482.
McCluskey, J.J., K.M. Grimsrud, H. Ouchi, and T.I. Wahl. (2003). Consumer Response to
Genetically Modified Food Products in Japan. Agricultural and Resource Economics Review. 32: 222-231.
McCluskey, J.J., K.M. Grimsrud, H. Ouchi, and T.I. Wahl. (2005). Bovine Spongiform
Encephalopathy in Japan: Consumers’ Food Safety Perceptions and Willingness to Pay for Tested Beef. Australian Journal of Agricultural and Resource Economics. 49: 197-209.
Misra, S., D. Grotegut, and K. Clem. (1997). Consumer Attitude Toward Recombinant Porcine
Somatotropin. Agribusiness. 13: 11-20. Misra, S.K., C.L. Huang, and S.L. Ott. (1991). Consumer Willingness to Pay for Pesticide-Free
Fresh Produce. Western Journal of Agricultural Economics. 16: 218-227. Nahuelhual, L., M.L. Loureiro, and J. Loomis. (2004). Using Random Parameters to Account
for Heterogeneous Preferences in Contingent Valuation of Public Open Space. Journal of Agricultural and Resource Economics. 29:537-552.
Pennings, J.M.E. and P. Garcia. (2004). Hedging Behavior in Small and Medium-sized
Enterprises: The Role of Unobserved Heterogeneity. Journal of Banking & Finance. 28: 951-978.
Peterson, H.H. and Y.-J. Chen. (2005). The Impact of BSE on Japanese Retail Meat Demand.
Agribusiness: An International Journal. 21:313-327. Poe, G.L., K.L. Giraud, and J.B. Loomis. (2005). Computational Methods for Measuring the
Difference of Empirical Distributions. American Journal of Agricultural Economics. 87:353-365.
Revelt, D. and K.Train. (1998). Mixed Logit with Repeated Choices: Households’ Choices of
Appliance Efficiency Level. The Review of Economics and Statistics. 80:647-657.
22

Roosen, J. (2003). Marketing of Safe Food Through Labeling. Journal of Food Distribution Research. 34:77-82.
Roosen, J., J.L. Lusk, and J.A. Fox. (2003). Consumer Demand for and Attitudes Toward
Alternative Beef Labeling Strategies in France, Germany, and the UK. Agribusiness: An International Journal. 19:77-90.
Sakamoto, T. (2005). Canadian Beef Export Federation – Japan, e-mail correspondence. Serecon Management Consulting Inc. (2003). Economic implications of BSE in Canada. Final
report prepared for the Canadian Animal Health Coalition. Edmonton. http://www.animalhealth.ca.
Tonsor, G.T., T.C. Schroeder, J.A. Fox, and A. Biere. (2005). European Preferences for Beef
Steak Attributes. Journal of Agricultural and Resource Economics. 30:367-380. Train, K.E. (2003). Discrete Choice Methods with Simulation. Cambridge, MA: Cambridge
University Press. US Census Bureau. (2006). International Database Summary Demographic Data. Available at:
http://www.census.gov/ipc/www/idbsum.html.
23
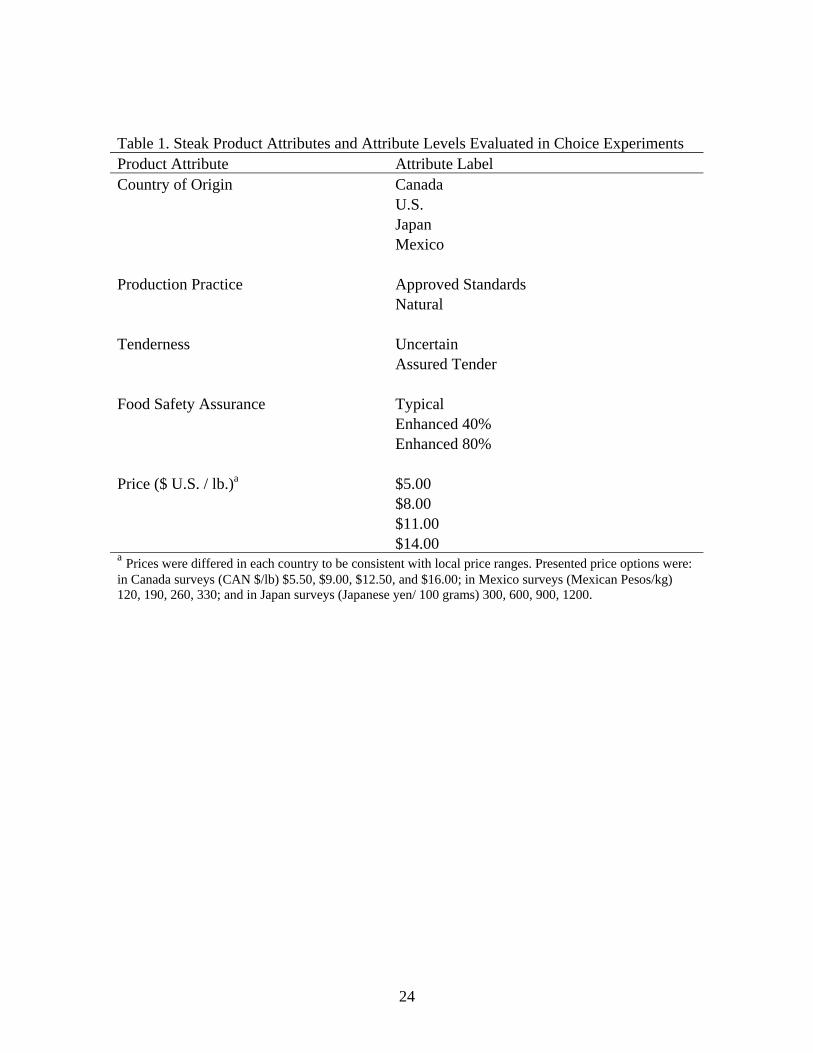
Table 1. Steak Product Attributes and Attribute Levels Evaluated in Choice Experiments Product Attribute Attribute Label Country of Origin Canada U.S. Japan Mexico Production Practice Approved Standards Natural Tenderness Uncertain Assured Tender Food Safety Assurance Typical Enhanced 40% Enhanced 80% Price ($ U.S. / lb.)a $5.00 $8.00 $11.00 $14.00 a Prices were differed in each country to be consistent with local price ranges. Presented price options were: in Canada surveys (CAN $/lb) $5.50, $9.00, $12.50, and $16.00; in Mexico surveys (Mexican Pesos/kg) 120, 190, 260, 330; and in Japan surveys (Japanese yen/ 100 grams) 300, 600, 900, 1200.
24

Table 2. Demographic Variables and Summary Statistics of Choice Experiment Participants
Variable Definition
U.S. Consumers (N =1009)
Canadian Consumers (N =1002)
Japanese Consumers (N =1001)
Mexican Consumers (N =993)
Gender 1 = Female; 0 = Male 0.83 0.52 0.49 0.80 Age Average age in years 48.9 47.7 41.8 31.1 Education (Highest Level Completed) 1 = Less than High School Graduate 2.30% 1.70% 2.60% 31.01% 2 = High School Graduate 19.50% 30.40% 32.70% 16.72% 3 = Some College or Technical (No Bachelor's) 38.80% 40.20% 25.40% 17.92% 4 = College Bachelor's Graduate 25.40% 17.00% 33.70% 25.98% 5 = Post-College Graduate 13.80% 7.30% 2.90% 8.26% No Response 0.30% 3.40% 2.60% 0.10% Household Incomea 1 = lower 18.40% 10.20% 33.10% 35.70% 2 = lower-middle 17.90% 23.10% 21.10% 39.00% 3 = middle 14.60% 25.50% 21.20% 14.10% 4 = middle-upper 22.20% 19.20% 12.20% 11.30% 5 = upper 26.90% 22.10% 12.50% 0.00% Beef Consumption Frequency (Consume) 1 = 4 or more times per week 17.74% 12.38% 3.10% 21.55% 2 = 2-3 times per week 45.39% 47.80% 26.97% 45.62% 3 = Once per week 20.32% 18.46% 29.37% 21.75% 4 = 2-3 times per month 8.72% 9.98% 22.28% 7.45% 5 = Once per month or less 5.35% 6.99% 16.08% 2.42% 6 = Never 2.48% 4.39% 2.20% 1.21% Perceived Risk of BSE ("Mad Cow") Related Diseases (BSE_Risk) 1 = Very High Risk 3.96% 4.99% 28.07% 38.77% 2 = High Risk 8.13% 4.99% 24.88% 26.08% 3 = Moderate Risk 18.33% 17.56% 18.58% 16.92% 4 = Low Risk 24.08% 25.25% 12.39% 7.65% 5 = Very Low Risk 36.17% 41.02% 8.19% 5.44% Don't Know 9.32% 6.19% 7.89% 5.14%
a The income groups have country specific ranges: Canada (Canadian Dollars): 1: ≤ $15,000, 2: $15,000-$34,999, 3: $35,000-$59,999, 4: $60,000-$79,999, 5: $80,000; U.S. (U.S. Dollars): 1: ≥ ≤ $22,500, 2: $22,500-$39,999, 3: $40,000-$59,999, 4: $60,000-$89,999, 5: $90,000; Japan (Japanese Yen): 1: ≥ ≤ 2,000,000, 2: 2,000,000-3,999,999, 3: 4,000,000-5,999,999, 4: 6,000,000-7,999,999, 5: 8,000,000; Mexico (Mexican Peso): 1: ≥ ≤ 4,000-6,000, 2: 7,000-21,000, 3: 22,000-54,000, 4: 55,000. ≥
25

Table 3. Random Parameters Logit Estimates
U.S. Consumers
Canadian Consumers
Japanese Consumers
Mexican Consumers
Variable/Description Parametera CANADA Mean 0.8738* 2.6061* 0.9943* 0.4281 Std Dev 2.9636* 2.7309* 2.8371* 2.2733* U.S. Mean 3.7294* 0.0226 -0.8651* 0.1660 Std Dev 2.3536* 2.7506* 3.1761* 2.3629* JAPAN Mean -1.1402* -1.9656* 2.9157* -0.3619 Std Dev 3.2786* 3.4784* 3.2321* 2.5769* MEXICO Mean -1.0254* -1.8500* -0.0183 1.1878* Std Dev 4.6322* 3.6745* 3.2288* 2.7055* NATURAL Mean -0.9156* -0.5324* 0.4007* 0.0681 Std Dev 1.0689* 0.9312* 0.5449* 0.4308* TENDER Mean 1.3951* 1.2462* 0.8683* 0.5532* Std Dev 0.6824* 0.7729* 0.2986* 0.6311* FOOD SAFETY 40 Mean -0.0608 0.5006* 0.0953 -0.1293 Std Dev 1.0151* 0.7460* 0.6176* 0.5325* FOOD SAFETY 80 Mean 0.5425* 0.7823* 0.9204* 0.0916 Std Dev 1.6277* 1.5289* 0.6635* 0.8699* PRICE Mean -0.2948* -0.1740* -0.0544* -0.0989* CANADA*FEMALE Mean -0.9386* -0.4566* -0.5405* -0.1854 CANADA*EDUCATION Mean 0.3943* 0.3002* 0.0529 0.0390 CANADA*INCOME Mean 0.0574 0.2695* 0.3539* 0.3846* CANADA*CONSUME Mean -0.4903* -0.6468* -0.6743* -0.1321* CANADA*BSE_RISK Mean 0.4088* 0.2445* 0.4637* -0.0310 U.S.*FEMALE Mean -0.5996* -0.5647* -1.0784* -0.1833 U.S.*EDUCATION Mean 0.1093 0.3950* -0.0714 -0.0221 U.S.*INCOME Mean -0.1484* 0.2683* 0.3447* 0.3471* U.S.*CONSUME Mean -0.3061* -0.5109* -0.8609* -0.1303* U.S.*BSE_RISK Mean 0.2996* 0.3250* 0.8205* 0.0715 JAPAN*FEMALE Mean -1.2626* -1.1279* 0.1098 -0.0659 JAPAN*EDUCATION Mean 0.9277* 0.5445* 0.1338 0.0134 JAPAN*INCOME Mean 0.3082* 0.2722* 0.2551* 0.2567* JAPAN*CONSUME Mean -0.6554* -0.4169* -0.4906* -0.1594* JAPAN*BSE_RISK Mean 0.1868* 0.2695* 0.0386 -0.0225 MEXICO*FEMALE Mean -1.3665* -0.6899* -0.9480* -0.4616* MEXICO*EDUCATION Mean 0.8763* 0.3656* 0.0909 0.0267 MEXICO*INCOME Mean 0.4007* 0.2054* 0.3620* 0.3546* MEXICO*CONSUME Mean -1.1078* -0.4631* -0.7121* 0.0210 MEXICO*BSE_RISK Mean -0.0704 0.2733* 0.5523* 0.1144*
a For normally distributed terms, parameters labeled as Mean and StdDev correspond to and kσ in kBequation (6), respectively. The PRICE and interaction terms are fixed (e.g., 0=σ ). b One asterisk indicates statistical significance at the 0.05 level.
26

Table 3. Random Parameters Logit Estimates (continued)
U.S.
Consumers Canadian
Consumers Japanese
Consumers Mexican
Consumers Variable/Description Parameter NATURAL*FEMALE Mean 0.2064 0.1287 -0.2488* 0.2138* NATURAL*EDUCATION Mean 0.0744* 0.0731 -0.0188 -0.0140 NATURAL*INCOME Mean -0.0063 0.0225 -0.0675* -0.0279 NATURAL*CONSUME Mean 0.1893* 0.1049* 0.0325 -0.0104 NATURAL*BSE_RISK Mean 0.0068 -0.0496 -0.0344 -0.0013 TENDER*FEMALE Mean -0.1303 0.1407 -0.0830 -0.1586* TENDER*EDUCATION Mean -0.1514* -0.1608* -0.0781* 0.0231 TENDER*INCOME Mean -0.0016 0.0392 -0.0174 0.0336 TENDER*CONSUME Mean 0.0737* 0.0605 0.0018 -0.0935* TENDER*BSE_RISK Mean -0.0119 -0.0637* 0.0210 0.0442* FOOD SAFETY 40*FEMALE Mean 0.3153* 0.4689* -0.0933 -0.0371 FOOD SAFETY 40*EDUCATION Mean 0.0699 0.0811 -0.0534 0.0098 FOOD SAFETY 40*INCOME Mean 0.0809* 0.0089 0.1293* 0.0585 FOOD SAFETY 40*CONSUME Mean 0.0170 -0.0055 -0.0497 -0.0201 FOOD SAFETY 40*BSE_RISK Mean -0.0557 -0.0856* 0.0236 0.0677* FOOD SAFETY 80*FEMALE Mean 0.4047* 0.6761* -0.0233 -0.0798 FOOD SAFETY 80*EDUCATION Mean 0.0212 0.1785* -0.1239* 0.0213 FOOD SAFETY 80*INCOME Mean 0.2418* 0.0412 0.0549 0.1439* FOOD SAFETY 80*CONSUME Mean -0.0005 -0.1428* 0.0339 -0.0323 FOOD SAFETY 80*BSE_RISK Mean -0.1422* -0.0177 -0.0230 0.0739* Log Likelihood -14,066.83 -12,854.01 -12,777.66 -17,808.68 Pseudo R2 0.39 0.42 0.43 0.22
a For normally distributed terms, parameters labeled as Mean and StdDev correspond to kB and kσ in
equation (6), respectively. The PRICE and interaction terms are fixed (e.g., 0=σ ). b One asterisk indicates statistical significance at the 0.05 level.
27

Table 4. Willingness-to-Pay Estimates from Random Parameters Logit Attribute:
U.S. Consumers
Canadian Consumers
Japanese Consumers
Mexican Consumers
NATURAL Upper 95% Confidence Interval $ 0.16 $ (0.09) $ 2.64 $ 1.84 Point Estimate $ (0.10) $ (0.58) $ 1.20 $ 1.18 Lower 95% Confidence Interval $ (0.35) $ (1.08) $ (0.20) $ 0.52 TENDER Upper 95% Confidence Interval $ 3.33 $ 5.41 $ 12.31 $ 5.22 Point Estimate $ 3.11 $ 4.97 $ 11.06 $ 4.52 Lower 95% Confidence Interval $ 2.89 $ 4.52 $ 9.70 $ 3.90 FOOD SAFETY 40 Upper 95% Confidence Interval $ 2.00 $ 4.27 $ 3.65 $ 1.78 Point Estimate $ 1.71 $ 3.72 $ 1.88 $ 0.97 Lower 95% Confidence Interval $ 1.40 $ 3.17 $ 0.05 $ 0.18 FOOD SAFETY 80 Upper 95% Confidence Interval $ 4.18 $ 8.32 $ 14.71 $ 5.82 Point Estimate $ 3.87 $ 7.73 $ 12.93 $ 4.78 Lower 95% Confidence Interval $ 3.52 $ 7.10 $ 11.02 $ 3.73
a All willingness-to-pay estimates are presented in U.S. Dollars/lb and were simulated following equation (7). b Confidence intervals were derived using 1,000 repetitions of the Krinsky-Robb bootstrapping method.
28
29
Table 5. Willingness-to-Pay Hypotheses Tests Across Countries Ho: WTP TENDER is Homogeneous Across Countries
CANADIAN WTP
JAPANESE WTP
MEXICAN WTP
U.S. WTP 0.0000 0.0000 0.0000CANADIAN WTP ----- 0.0000 0.1524JAPANESE WTP ----- 0.0000 Ho: WTP FOOD SAFETY 40 is Homogeneous Across Countries
CANADIAN WTP
JAPANESE WTP
MEXICAN WTP
U.S. WTP 0.0000 0.4171 0.0482CANADIAN WTP ----- 0.0317 0.0000JAPANESE WTP ----- 0.8066 Ho: WTP FOOD SAFETY 80 is Homogeneous Across Countries
CANADIAN WTP
JAPANESE WTP
MEXICAN WTP
U.S. WTP 0.0000 0.0000 0.0436CANADIAN WTP ----- 0.0000 0.0000JAPANESE WTP ----- 0.0000
a All willingness-to-pay estimates are presented in U.S. Dollars/lb and were simulated following equation (7). b Table presents p-values determined using the nonparametric combinational method of Poe, Giraud, and Loomis to 1,000 Krinsky-Robb bootstrapped WTP estimates.

Table 6. Willingness-to-Pay Hypotheses Tests Hypothesis Test:
U.S. Consumers
Canadian Consumers
Japanese Consumers
Mexican Consumers
Ho: WTP TENDER = WTP FOOD SAFETY 40 Difference in WTP Point Estimates $ 1.40 $ 1.25 $ 9.18 $ 3.55 p-value of Hypothesis Test 0.0000 0.0004 0.0000 0.0000 Ho: WTP FOOD SAFETY 80 = WTP TENDER Difference in WTP Point Estimates $ 0.76 $ 2.76 $ 1.87 $ 0.26 p-value of Hypothesis Test 0.0001 0.0000 0.0548 0.3481 Ho: WTP FOOD SAFETY 80 = 2*WTP FOOD SAFETY 40 Difference in WTP Point Estimates $ 0.45 $ 0.28 $ 9.18 $ 2.84 p-value of Hypothesis Test 0.1019 0.3201 0.0001 0.0026
a All willingness-to-pay estimates are presented in U.S. Dollars/lb and were simulated following equation (7). b Table presents p-values determined using the nonparametric combinational method of Poe, Giraud, and Loomis to 1,000 Krinsky-Robb bootstrapped WTP estimates.
30

Figure 1. Consumer WTP for Enhanced Food Safety
Consumer WTP for Enhanced Food Safety
$0
$2
$4
$6
$8
$10
$12
0 40Food Safety Enhancement Level (%)
WT
P (U
S $/
lb)
80
US ConsumersCanada ConsumersJapanese ConsumersMexico Consumers
31