Embed Size (px)
Citation preview

European critical loads work by ICP Forests and ICP Modeling and Mapping
Outline of presentation
• Background of Convention on Long-range Transboundary Air Pollution (CLRTAP) and ICP Forests
• Data management of ICP Forests
• Example of new results of ICP Forests: Spatial and temporal variation of pollutant concentrations in bulk deposition
• Introduction to ICP Modelling and Mapping (Spranger)
• Critical loads work: Hans-Dieter Nagel

Convention on Long-range Transboundary Air Pollution
(CLRTAP)
History:
• Acidification of Scandinavian lakes by sulphur depositions (1960)
Evidence of damage by air pollutants transported thousands of kilometers (mid 1970s)
Necessity of international cooperation
High level meeting under UNECE (Geneva 1979)
Signature of CLRTAP by 35 Parties

Convention on Long-range Transboundary Air Pollution
(CLRTAP)
Today 49 Parties:
• Principles of international cooperation for air pollution abatement
• Institutional framework bringing together science and policy
• Scientific cooperation and political negotiation
CLRTAP was extended by protocols identifying obligationsand measures to be taken by Parties

Protocols in force
• The 1985 Protocol on the Reduction of Sulphur Emissions or their Transboundary Fluxes by at least 30% (22 Parties)
• The 1988 Protocol concerning the Control of Nitrogen Oxides or their Transboundary Fluxes (28 Parties)
• The 1991 Protocol comcermimg the Control of Emission of Volatile Organic Compounds or their Transboundary Fluxes (21 Parties)
• The 1994 Protocol on Further Reduction of Sulphur Emissions (25 Parties)
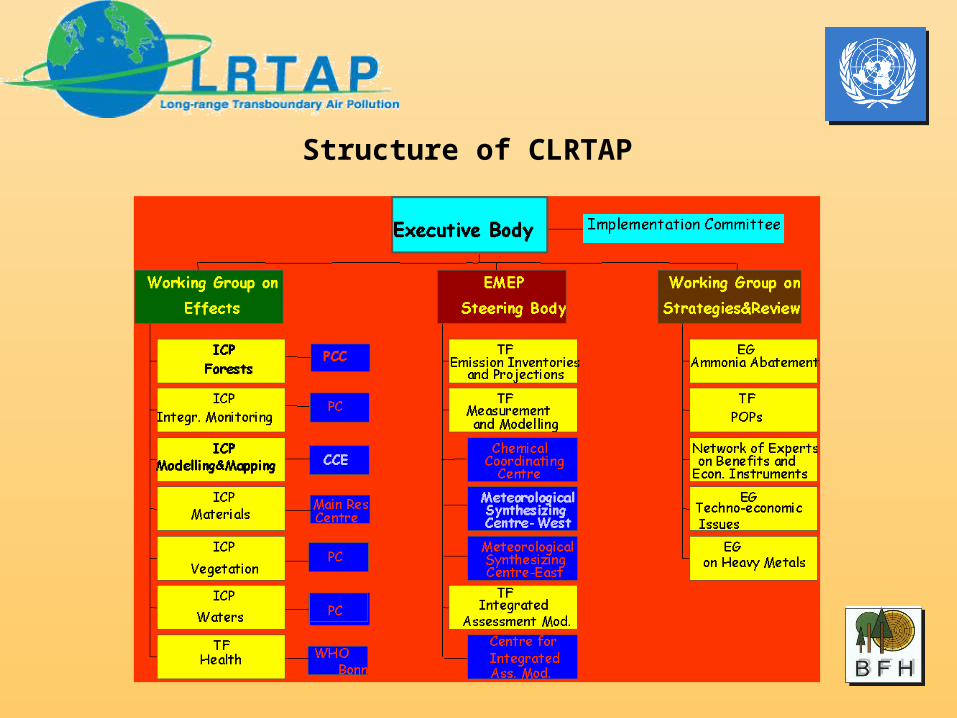
Structure of CLRTAP
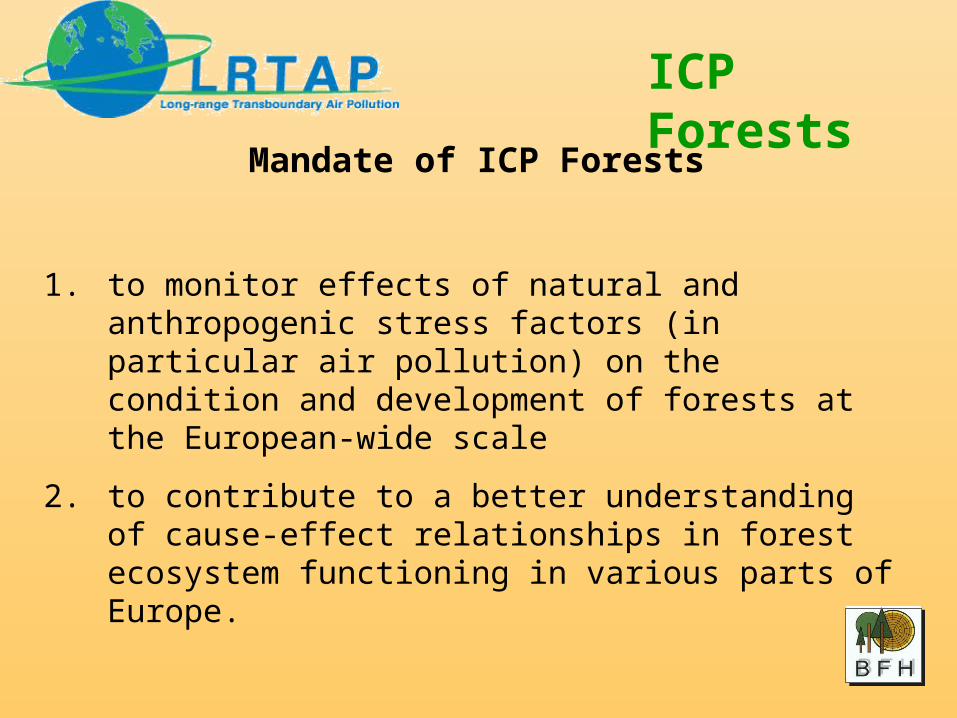
Mandate of ICP Forests
1. to monitor effects of natural and anthropogenic stress factors (in particular air pollution) on the condition and development of forests at the European-wide scale
2. to contribute to a better understanding of cause-effect relationships in forest ecosystem functioning in various parts of Europe.
ICP Forests

Large-scale monitoring(Level I ●)
• Many plots• European-wide systematic
grid (16 x 16 km)• 6 000 monitoring plots
• Low monitoring intensity• Crown condition assessment
(all plots)• Soil survey (5 300 plots)• Foliar survey (1 500 plots)
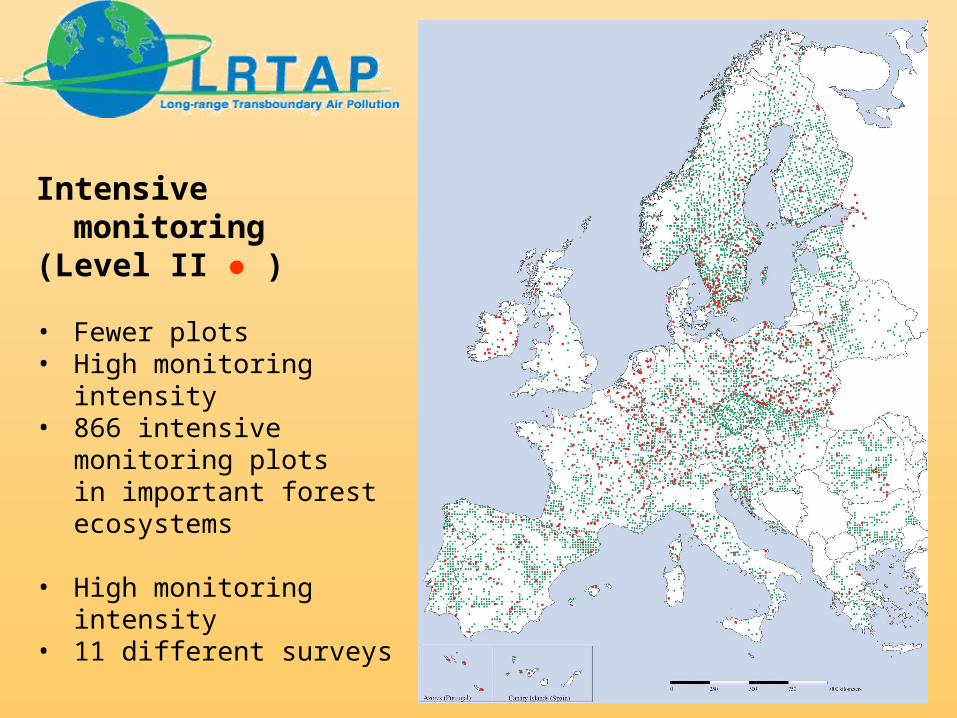
Intensive monitoring(Level II ● )
• Fewer plots• High monitoring intensity• 866 intensive monitoring plots
in important forest ecosystems
• High monitoring intensity• 11 different surveys

Level II core surveys
Survey Frequency Number of plots
Crown condition Annually 866
Soil condition Every ten years 865
Foliar condition Every two years 855
Tree growth Every five years 859
ICP Forests

Further Level II surveys
Survey Frequency Number of plots
Ambient air quality Continuously 133
Atmospheric deposition Continuously 499
Soil solution chemistry Continuously 243
Ground vegetation Every five years 730
Meteorological condition Continuously 202
Phenology According to phenophases
59
ICP Forests

Data management
Data flow within ICP Forests
Level I and Level II plots
National Focal Centre
Programme Coordinating Centre
Data checks
Level I data bank (ORACLE)
Level II data bank (end 2005)
ICP Forests

Data management
Data ownership
• Participating countries
Free data access
• Parties to CLRTAP
Authorization procedure for third parties
• Submission of project description and request for data to PCC
• Request by PCC to each country for release of data
• Submission of released data to third party, exclusively for the use for the described project
ICP Forests
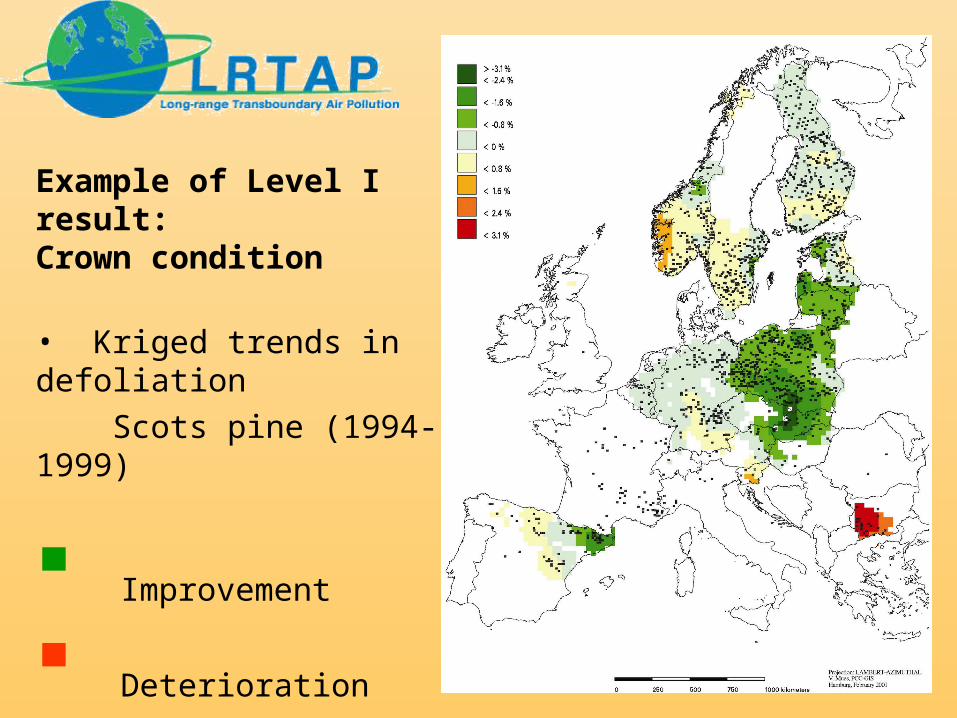
Example of Level I result: Crown condition
• Kriged trends in defoliation
Scots pine (1994-1999)
Improvement
Deterioration

N-NO3 (409 Level II plots)
Volume weighted mean concentration [mg/l]1996-2001
Highest concentrations in• Poland• East Germany
Clear spatial pattern
Example of Level II result:Bulk deposition
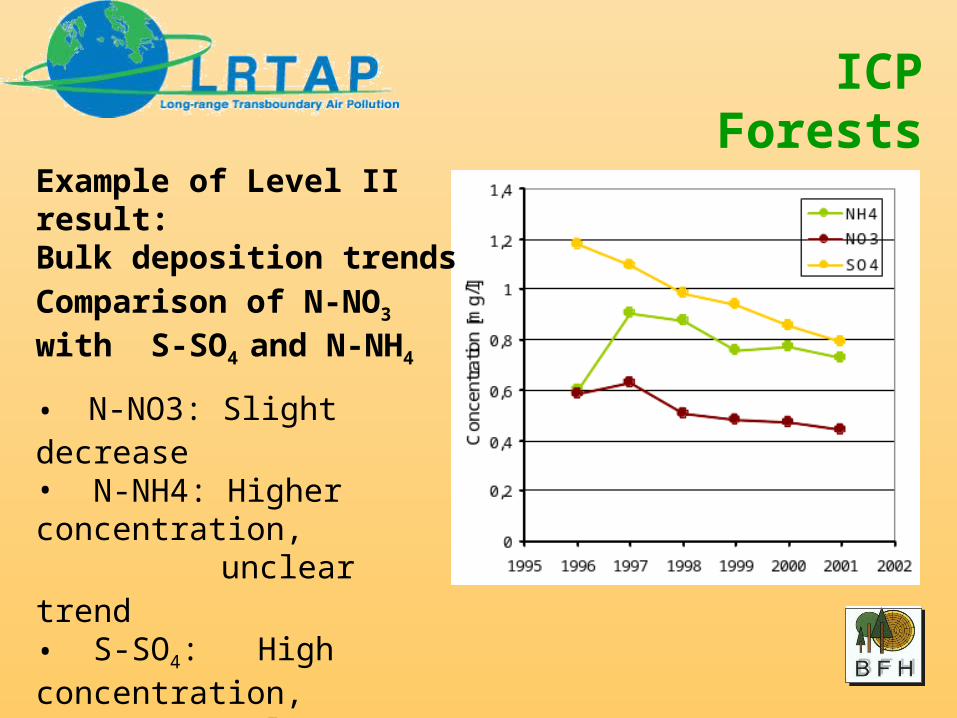
Comparison of N-NO3 with S-SO4 and N-NH4
• N-NO3: Slight decrease• N-NH4: Higher concentration,
unclear trend• S-SO4: High concentration,
clear decrease
Example of Level II result:Bulk deposition trends
ICP Forests

Critical loads
• long-term ecosystem capacity (steady state)
• defined for specific combinations of pollutants, effects, and receptors
• Acidification (N, S), eutrophication (N), HMs
• terrestrial and (non-marine) aquatic ecosystems
• based on chemical criteria linked to biological effects
• spatially variable, thus leading to regionally differentiated emission reduction needs
• used as sustainability indicators for policy guidance
ICP M&M

National CL data/maps
European CL
data/maps
compare
European CL exceedance data/maps
Optimized emission reduction scenarios
National emission
abatement costs
EMEP deposition data/maps
European emission
data/maps
EMEP Unified Model
Nat´l Emission Ceilings
Integrated Assessment
Models
ICP M&M

CLnut(N): Europeaggregated to 50*50 km²2004 dataset – to be revised!
ICP M&M

CLacid (Clmax(S)): Europeaggregated to 50*50 km²2004 dataset – to be revised!
ICP M&M

Exceedance of CLnut(N)in 2000
33% area exceeded(77% in EU25)
ICP M&M

Exceedance of CLacid
in 2000
11% area exceeded(23% in EU25)
ICP M&M

Main results of CLRTAP negotiations
• Emission reductions 1990 - 2010: SO2 - 60%; NOx - 40%; NH3 - 17%
• Eutrophication of terrestrial ecosystems will remain a risk to biodiversity and other environmental targets in Europe
• Acidification has been slowed but not stopped through emission abatement; Nr (especially NH3) emissions more relevant than sulphur emissions
• Highest remaining exceedances dominated by NH3 emissions from intensive animal husbandry
ICP M&M
Participation of the USA in ICP Forests and ICP M & M
The United States of America is
• Party to the CLRTAP
• Participating country of ICP Forests
• Not yet a participating country of ICP M & M
ICP M&MICP Forests

Participation of the USA in ICP Forests and ICP M & M
The United States of America is invited to participate in
21st ICP M&M Task Force meeting and 15th CCE Workshop25 – 29 April, Berlin, GermanyPlease contact [email protected] for more information
21st ICP Forests Task Force meetingand 20 years ICP Forests anniversary celebration23 – 26 May, Rome, ItalyInvitations were sent to USDA and the NFC

Participation of the USA in ICP Forests and ICP M & M
The United States of America is invited to have its Level II data managed as part of the ICP Forests data bank. This includes
• Plausibility checks of US data
• Storage of US data in the Level II data bank (ORACLE)
• Access to US data and all other ICP Forests data
US data are being made available to the bodies under CLRTAP upon request, but will be submitted to third parties only by permission of the USA.
ICP M&MICP Forests

Websites
UNECE www.unece.org
CLRTAP www.unece.org/env/lrtap
EMEP www.emep.int
WGE www.unece.org/wge
ICP Forests www.icp-forests.org
ICP M & M www.icpmapping.org
ICP M&MICP Forests