Embed Size (px)
Citation preview
European Commission /
Taxation and Customs Union
Taxation trends in the
European Union
Edition 2010
Marco FantiniHead of Sector “Quantitative Analysis of Taxation”
Taxation and Customs Union DGEuropean Commission
European Commission /
Taxation and Customs Union
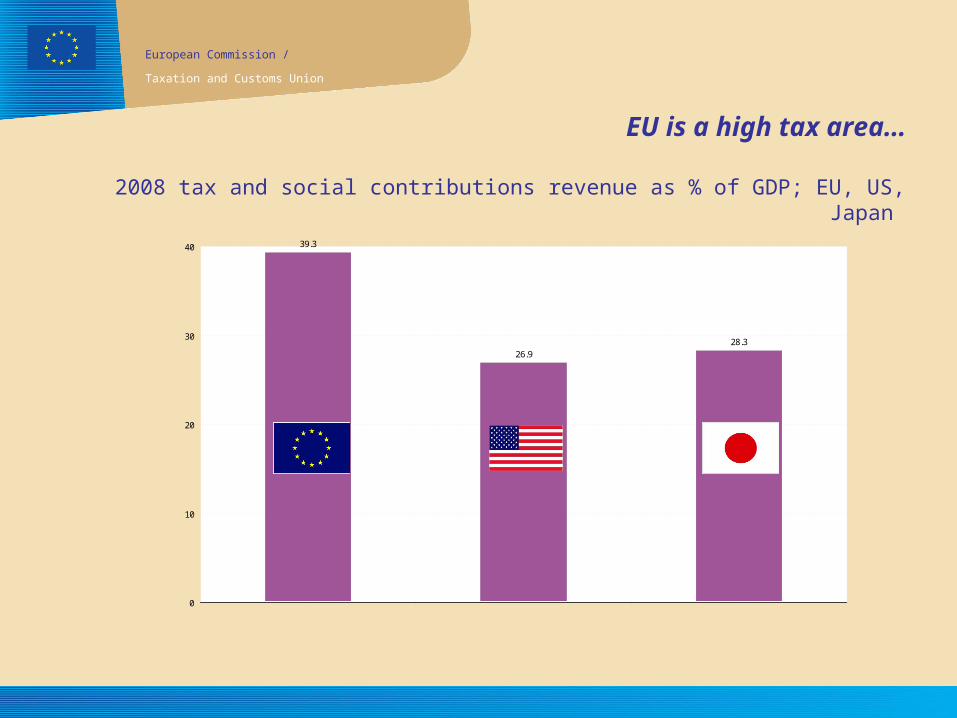
EU is a high tax area…
2008 tax and social contributions revenue as % of GDP; EU, US, Japan
39.3
26.928.3
0
10
20
30
40
E U -2 7 U S JP
European Commission /
Taxation and Customs Union
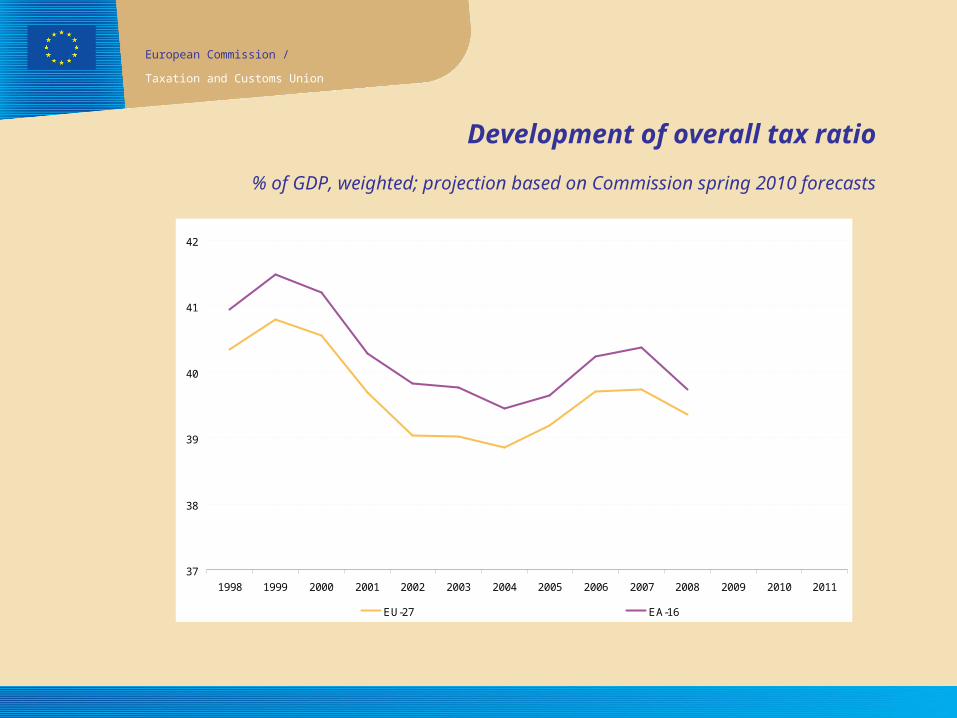
Development of overall tax ratio
% of GDP, weighted; projection based on Commission spring 2010 forecasts
37
38
39
40
41
42
1998 1999 2000 2001 2002 2003 2004 2005 2006 2007 2008 2009 2010 2011
EU-27 EA-16
%
European Commission /
Taxation and Customs Union
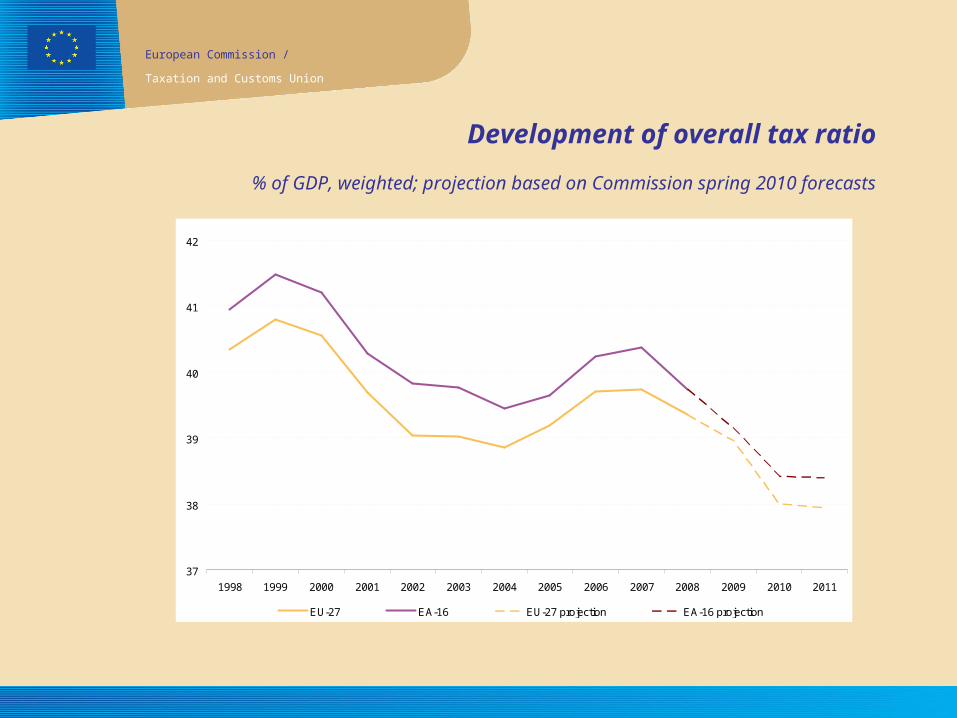
Development of overall tax ratio
% of GDP, weighted; projection based on Commission spring 2010 forecasts
37
38
39
40
41
42
1998 1999 2000 2001 2002 2003 2004 2005 2006 2007 2008 2009 2010 2011
EU-27 EA-16 EU-27 projection EA-16 projection
%
European Commission /
Taxation and Customs Union
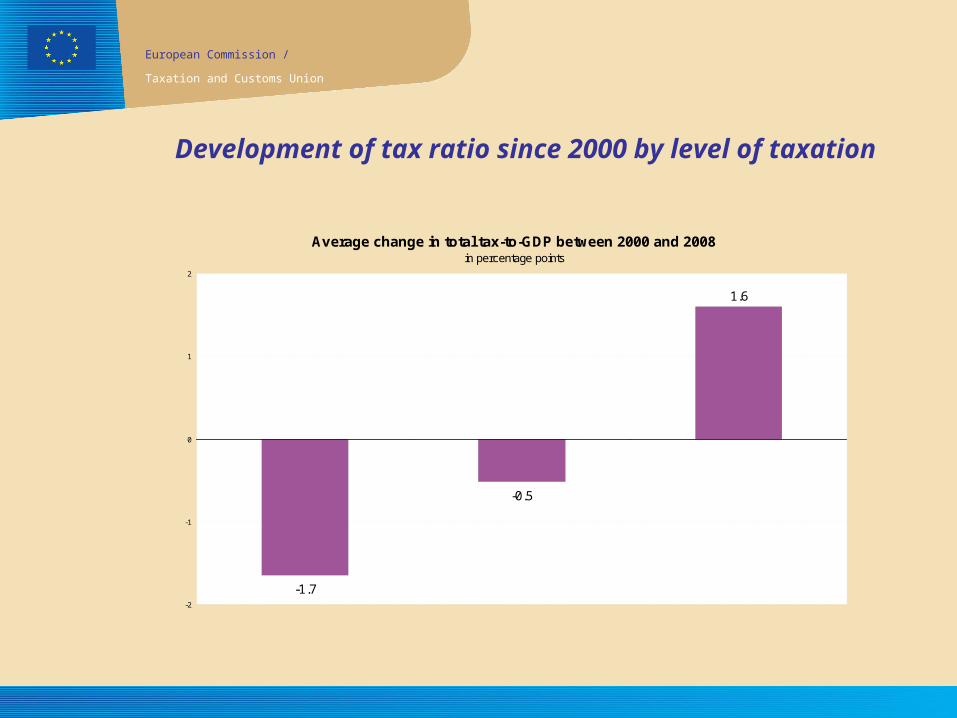
Development of tax ratio since 2000 by level of taxation
Average change in total tax-to-GDP between 2000 and 2008in percentage points
-1.7
-0.5
1.6
-2
-1
0
1
2
Medium tax countries
Low tax countries
High tax countries
European Commission /
Taxation and Customs Union
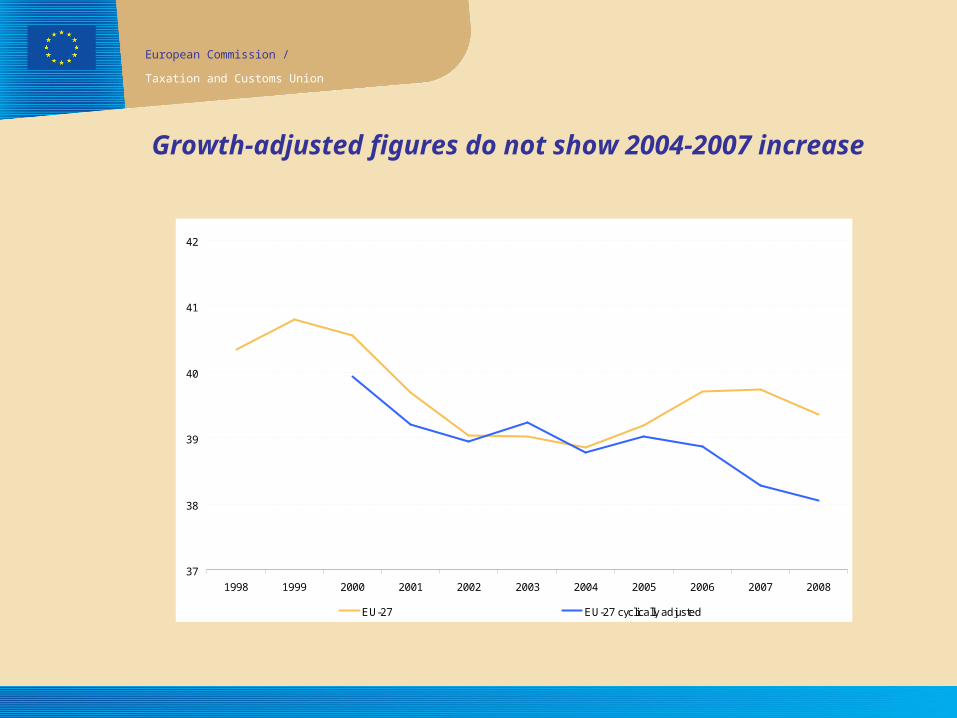
Growth-adjusted figures do not show 2004-2007 increase
37
38
39
40
41
42
1998 1999 2000 2001 2002 2003 2004 2005 2006 2007 2008
EU-27 EU-27 cyclically adjusted
%
European Commission /
Taxation and Customs Union
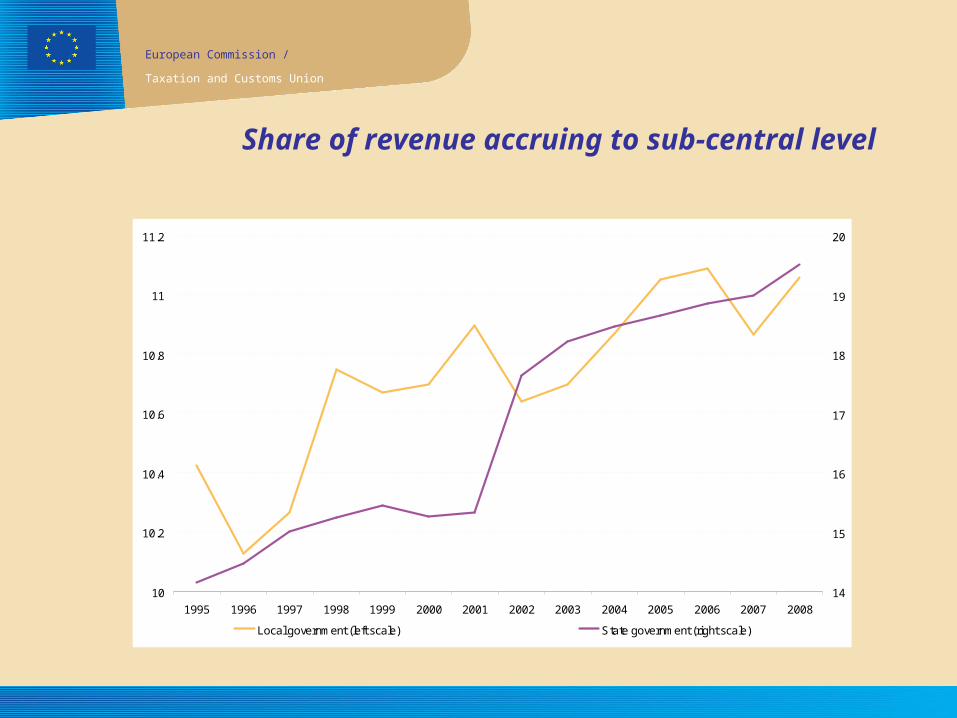
Share of revenue accruing to sub-central level
10
10.2
10.4
10.6
10.8
11
11.2
1995 1996 1997 1998 1999 2000 2001 2002 2003 2004 2005 2006 2007 200814
15
16
17
18
19
20
Local government (left scale) State government (right scale)
European Commission /
Taxation and Customs Union
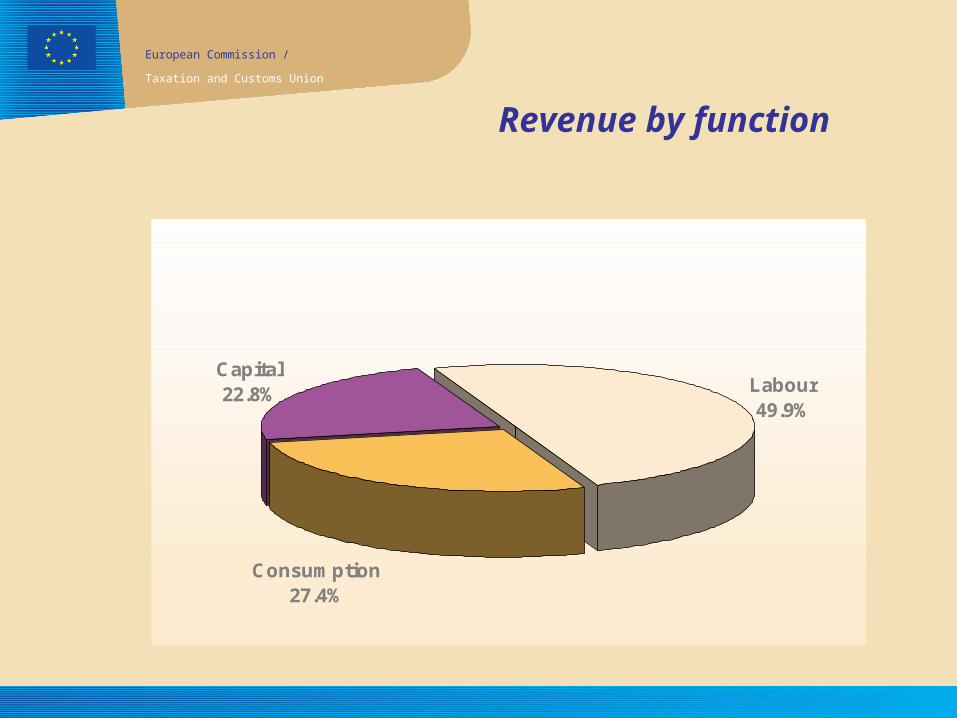
Revenue by function
Capital22.8% Labour
49.9%
Consumption27.4%
2008
European Commission /
Taxation and Customs Union
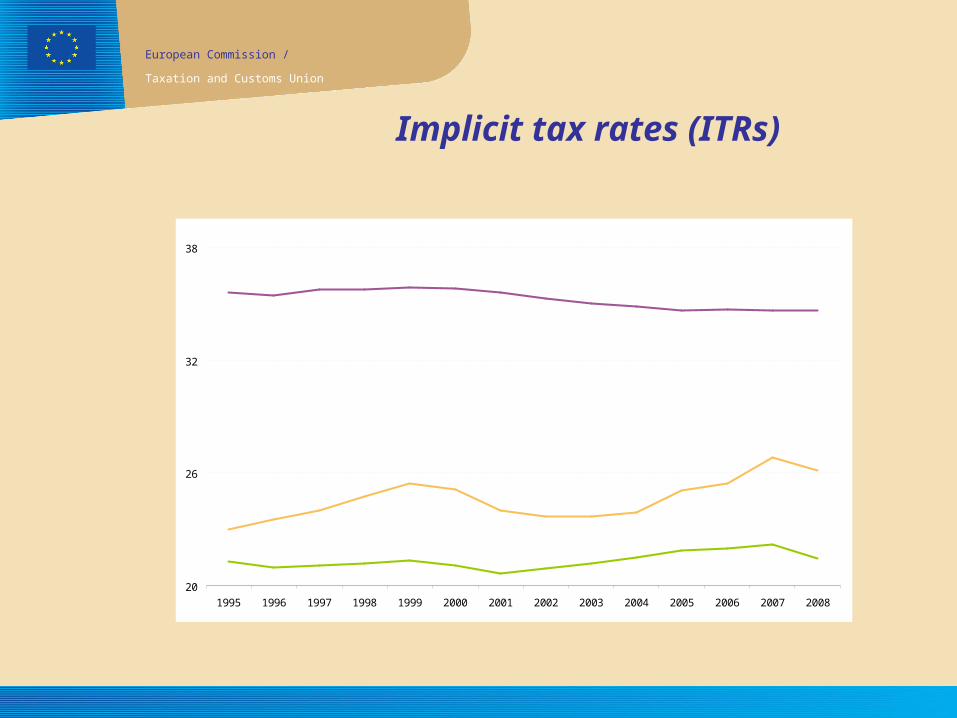
Implicit tax rates (ITRs)
20
26
32
38
1995 1996 1997 1998 1999 2000 2001 2002 2003 2004 2005 2006 2007 2008
%
ITR Capital
ITR Consumption
ITR Labour
European Commission /
Taxation and Customs Union
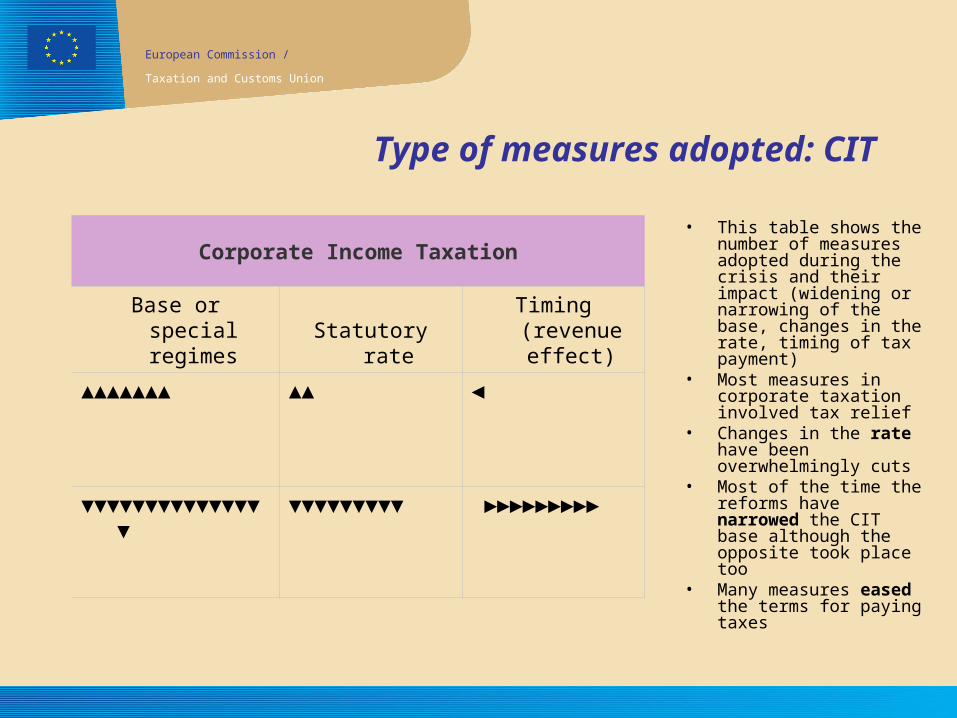
Type of measures adopted: CIT
Corporate Income Taxation
Base or special regimes Statutory rate
Timing (revenue effect)
▲▲▲▲▲▲▲ ▲▲ ◄
▼▼▼▼▼▼▼▼▼▼▼▼▼▼▼
▼▼▼▼▼▼▼▼▼
►►►►►►►►►
• This table shows the number of measures adopted during the crisis and their impact (widening or narrowing of the base, changes in the rate, timing of tax payment)
• Most measures in corporate taxation involved tax relief
• Changes in the rate have been overwhelmingly cuts
• Most of the time the reforms have narrowed the CIT base although the opposite took place too
• Many measures eased the terms for paying taxes
European Commission /
Taxation and Customs Union
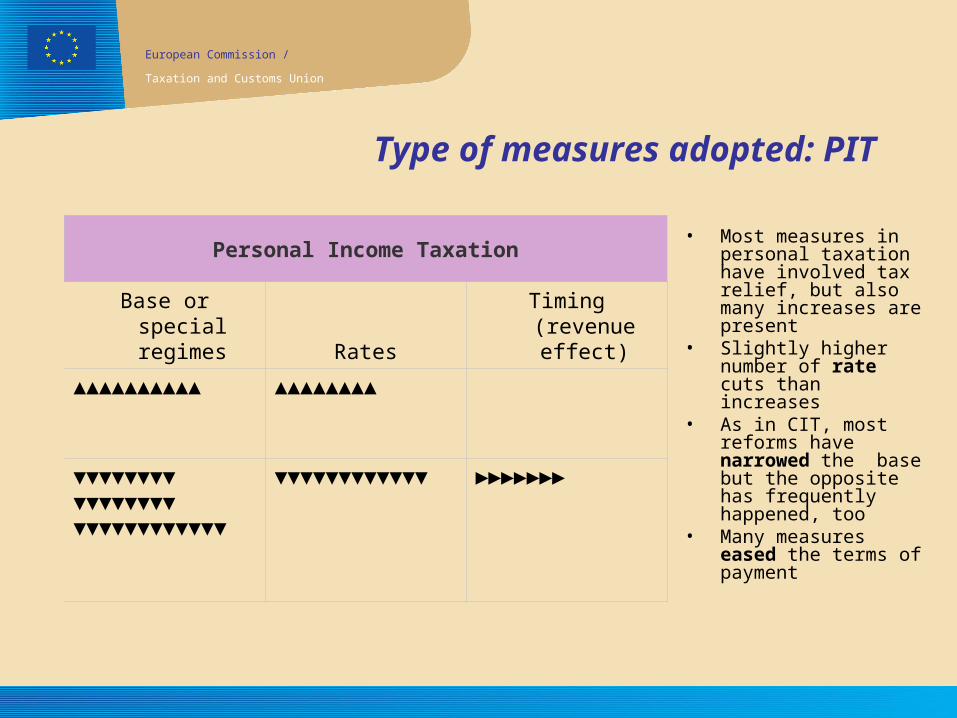
Type of measures adopted: PIT
• Most measures in personal taxation have involved tax relief, but also many increases are present
• Slightly higher number of rate cuts than increases
• As in CIT, most reforms have narrowed the base but the opposite has frequently happened, too
• Many measures eased the terms of payment
Personal Income Taxation
Base or special regimes Rates
Timing (revenue effect)
▲▲▲▲▲▲▲▲▲▲
▲▲▲▲▲▲▲▲
▼▼▼▼▼▼▼▼▼▼▼▼▼▼▼▼▼▼▼▼▼▼▼▼
▼▼▼▼
▼▼▼▼▼▼▼▼▼▼▼▼
►►►►►►►
European Commission /
Taxation and Customs Union
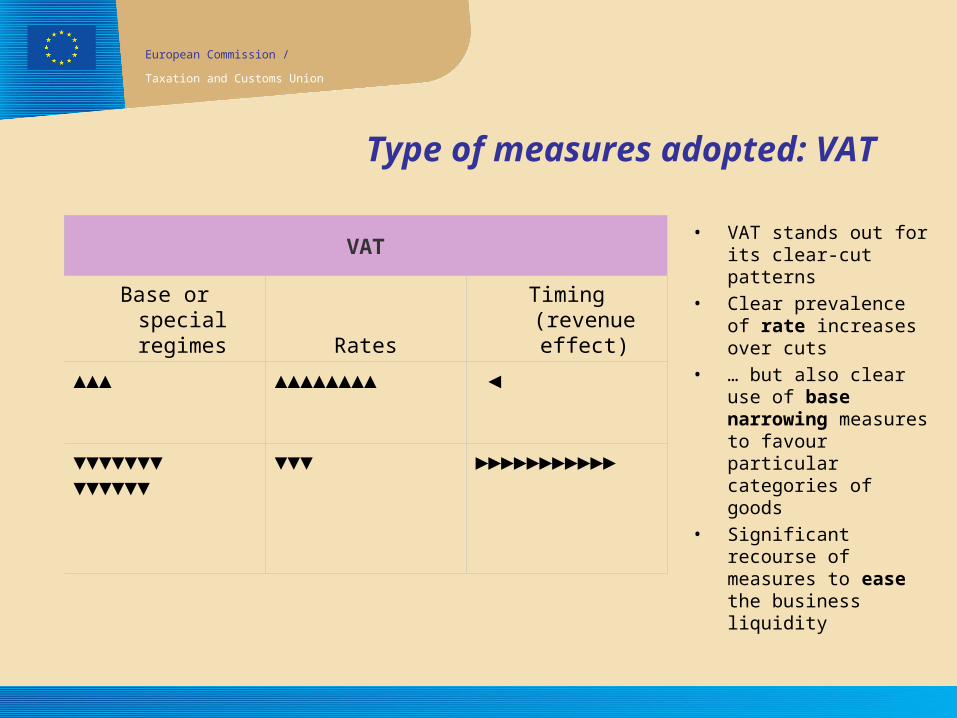
Type of measures adopted: VAT
• VAT stands out for its clear-cut patterns
• Clear prevalence of rate increases over cuts
• … but also clear use of base narrowing measures to favour particular categories of goods
• Significant recourse of measures to ease the business liquidity
VAT
Base or special regimes Rates
Timing (revenue effect)
▲▲▲ ▲▲▲▲▲▲▲▲ ◄
▼▼▼▼▼▼▼▼▼▼▼▼▼
▼▼▼ ►►►►►►►►►►►
European Commission /
Taxation and Customs Union
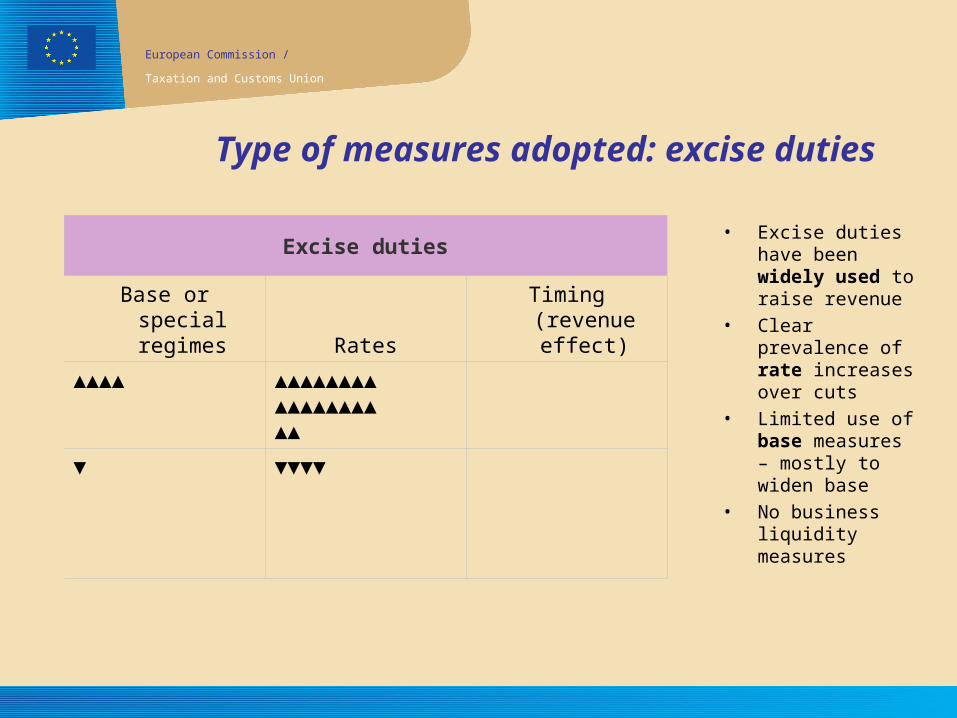
Type of measures adopted: excise duties
• Excise duties have been widely used to raise revenue
• Clear prevalence of rate increases over cuts
• Limited use of base measures – mostly to widen base
• No business liquidity measures
Excise duties
Base or special regimes Rates
Timing (revenue effect)
▲▲▲▲ ▲▲▲▲▲▲▲▲▲▲▲▲▲▲▲▲▲▲
▼ ▼▼▼▼
European Commission /
Taxation and Customs Union
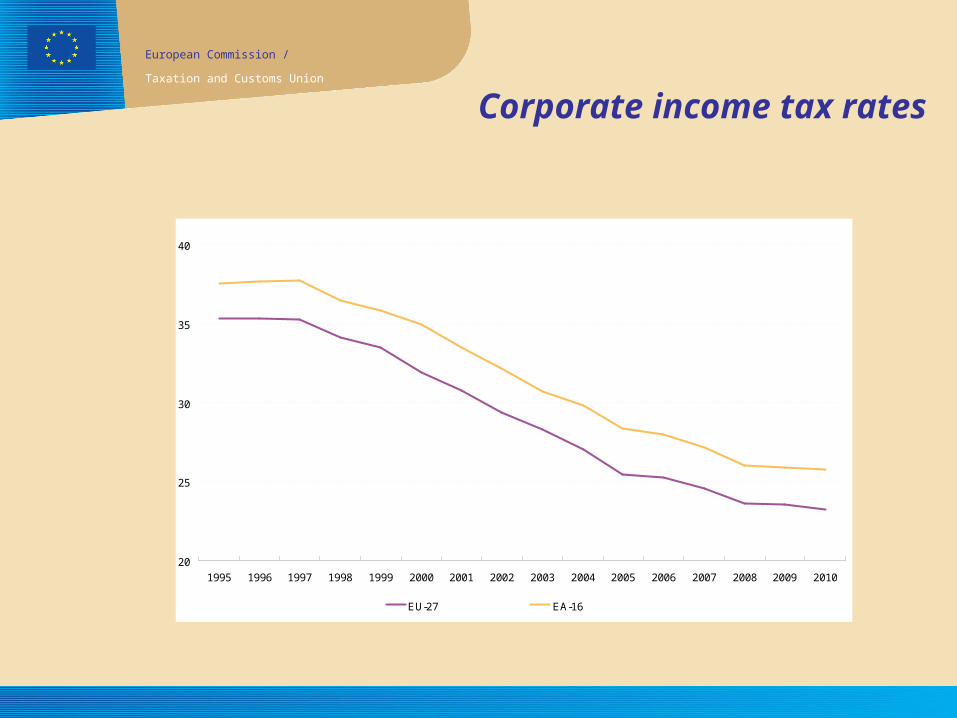
Corporate income tax rates
20
25
30
35
40
1995 1996 1997 1998 1999 2000 2001 2002 2003 2004 2005 2006 2007 2008 2009 2010
EU-27 EA-16
European Commission /
Taxation and Customs Union
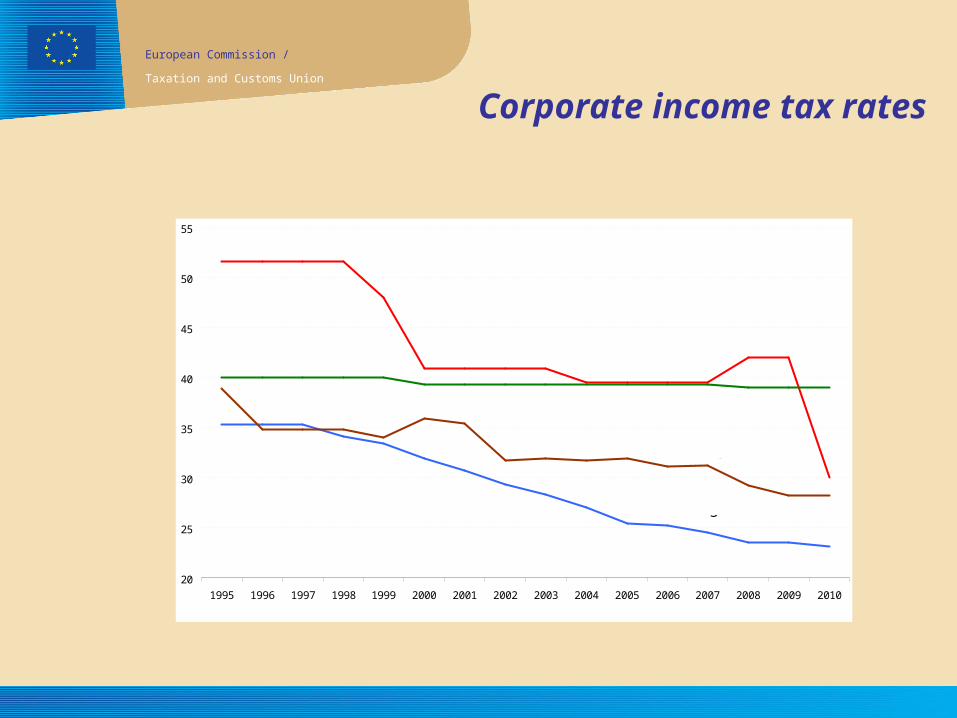
Corporate income tax rates
20
25
30
35
40
45
50
55
1995 1996 1997 1998 1999 2000 2001 2002 2003 2004 2005 2006 2007 2008 2009 2010
United States
BRIC average
EU average
J apan
European Commission /
Taxation and Customs Union
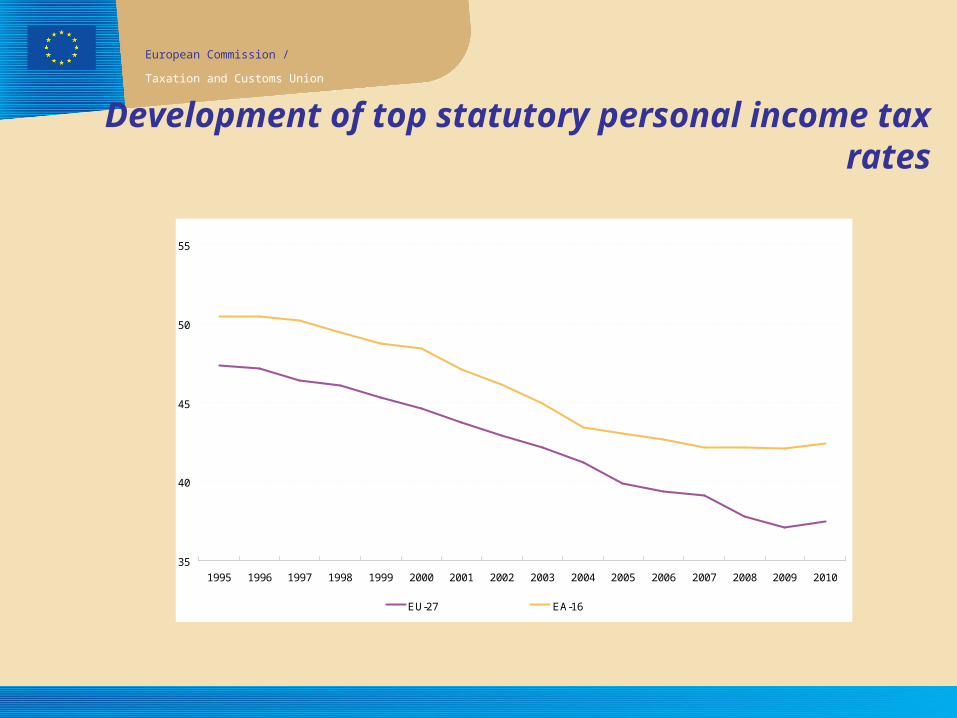
Development of top statutory personal income tax rates
35
40
45
50
55
1995 1996 1997 1998 1999 2000 2001 2002 2003 2004 2005 2006 2007 2008 2009 2010
EU-27 EA-16
European Commission /
Taxation and Customs Union
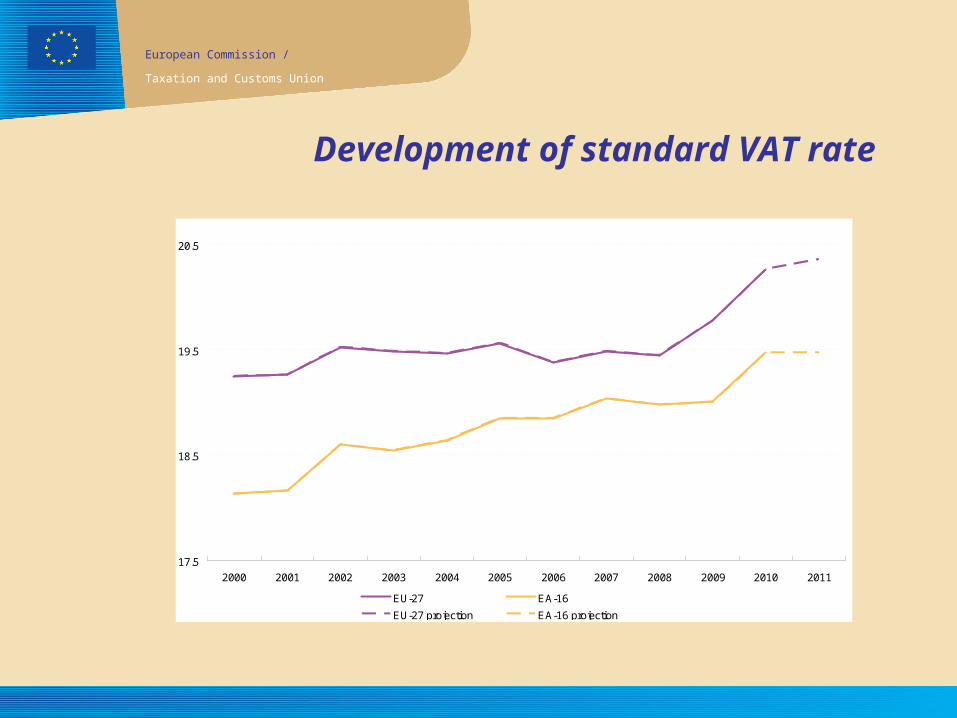
Development of standard VAT rate
17.5
18.5
19.5
20.5
2000 2001 2002 2003 2004 2005 2006 2007 2008 2009 2010 2011
EU-27 EA-16
EU-27 projection EA-16 projection
European Commission /
Taxation and Customs Union
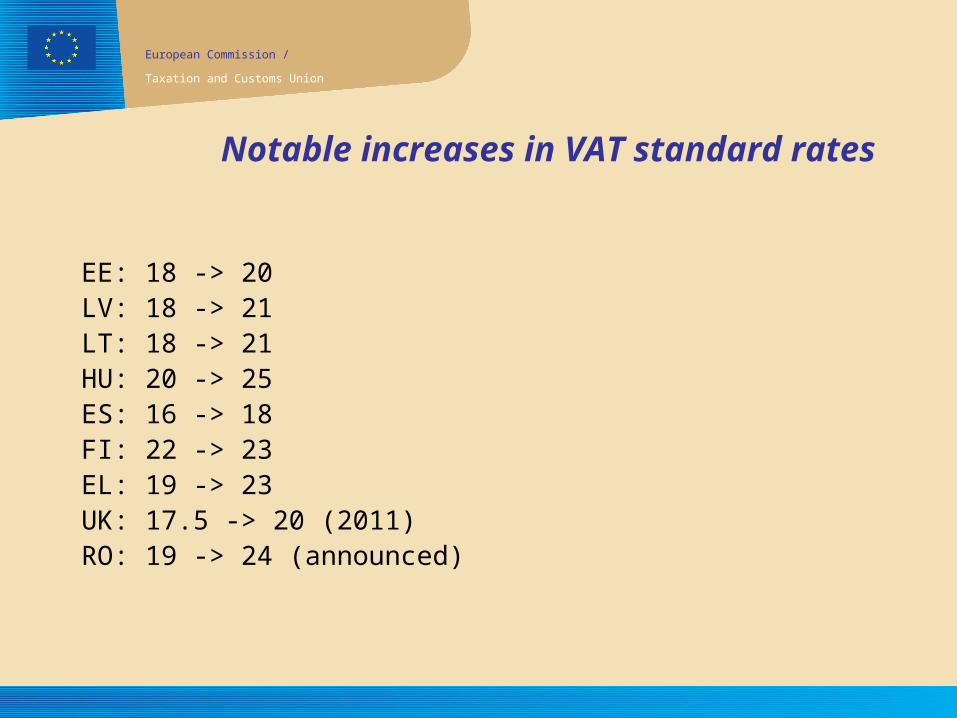
Notable increases in VAT standard rates
EE: 18 -> 20LV: 18 -> 21LT: 18 -> 21HU: 20 -> 25ES: 16 -> 18FI: 22 -> 23EL: 19 -> 23UK: 17.5 -> 20 (2011)RO: 19 -> 24 (announced)

European Commission /
Taxation and Customs Union
Additional information
• The full report and an executive summary are available at the following address:
• http://ec.europa.eu/taxtrends