Embed Size (px)
Citation preview
European CFO Surveywith Portugal insights Surrounded by uncertaintyQ3 | November 2016
Portugal

European CFO Survey Q3 2016 | Growth prospects in an uncertain world
2
About the dataThe findings discussed in this report are representative of the opinions of 1,148 CFOs based in 17 European countries: Austria, Belgium, Finland, France, Germany, Ireland, Italy, the Netherlands, Norway, Poland, Portugal, Russia, Spain, Sweden, Switzerland, Turkey and the UK. CFOs were all contacted between August and October 2016. French responses represent preliminary data.
Some of the charts in the Survey show results as an index value (net balance). This is calculated by subtracting the percentage of respondents giving a negative response from the percentage giving a positive response; responses that are neither positive nor negative are deemed to be neutral. Due to rounding, not all percentages shown in the charts will add up to 100.
AcknowledgementsWe would like to thank all participating CFOs for their support in completing the survey.
Further informationFor further information and a more detailed analysis please visit www.deloitteresearchemea.com. If you would like to contact us please complete the form on our website or email us at [email protected].
ContentsForeword 03
Key findings of the CFO Survey Portugal 04
Key findings 05
Financial prospects barely changed 08
Uncertainty still elevated 09
Risk appetite remains weak 10
Revenue expectations remain optimistic 11
Margin outlook recovers 12
Capex outlook weaker but remains positive 13
Employment outlook softens 14
Political and economic risks dominate 16
CFOs become more defensive 18
Bank borrowing preferred option for financing 19
Negative impact of Brexit negotiations feared 22
Main concerns over non-tariff barriers 23
Special questions about Portugal 25
Portuguese sample caracterization 25
Data summary 26

European CFO Survey Q3 2016 | Growth prospects in an uncertain world
3
Welcome to the fourth edition of the Deloitte European CFO Survey. The Survey presents the insights from CFOs across Europe on market and business sentiment, and provides a timely view of CFOs’ perspective on Brexit.
The European CFO Survey is part of the Deloitte EMEA CFO Programme, an initiative that brings together senior Deloitte professionals across multidisciplinary teams to help CFOs effectively address the challenges and demands they experience in their role. The Deloitte EMEA CFO Programme helps inform, develop, empower and connect the CFO community across the EMEA region and includes the Deloitte Next Generation CFO Academy and CFO Labs to assist in executive transition and transformation. If you would like further information on the programme please contact one of my colleagues based in your country.
We would like to thank all CFOs who took the time to participate in this edition of the Deloitte European CFO Survey and welcome your thoughts and feedback.
Once again, we proudly announce a new edition of the European CFO survey, which includes a section dedicated to the Portuguese CFOs’ perceptions and expectations. This successful initiative was again only possible with the involvement and active participation of our panel, which has been revealing greater interest in the understanding of the global mindset of the organizations’ financial leaders.
This year’s edition had the particularity of providing new insights regarding the EU economic health and stability, as the decision of BREXIT’s approval uncovered the CFOs insecurities regarding its influence and potential impact on their business. In terms of domestic perceptions, it was possible to infer that the overall confidence over the economic panorama remains low, slightly aggravated when compared to the previous edition. In line with this, CFOs demonstrated to be more cautious about the future, revealing a lower predisposition to assume risks in their business as they simultaneously intend to define cost control strategies as their main priority.
We hope that this analysis help you understand the European and Portuguese CFOs state of mind, and, specially, their main concerns and motivation drivers. This will help determining what matters need to be address and improved in this next year, to allow CFOs to draw a more optimistic vision for the future.
Alan FlanaganPartner, EMEA CFO Programme Lead
Jorge MarrãoPartner, Portugal CFO Programme Lead
Foreword

European CFO Survey Q3 2016 | Growth prospects in an uncertain world
4
Key findings of the CFO Survey Portugal
Lowering confidence Once again, expectations fell significantly in the 3rd quarter of 2016, as 71% of the surveyed CFOs have a negative sentiment about Portuguese economic outlook over the next 12 months.
This declining trend extends for a year now, since our first survey in Q3 2015 where only 2% of the surveyed CFOs were as pessimistic.
Financial prospects for their own companies remained stable from six months ago, though with a similar percentage of CFOs declaring themselves optimistic/pessimistic.
Expectations for revenue and operating margins also remained stable, whereas more CFOs expect capital expenditure increases.
Risk aversion The evolution of most risk and uncertainty indicators surveyed show an expansion of risk aversion. Globally, there is a slight increase in the perception of external financial and economic uncertainty.
More CFOs declare that now is not a good time to take greater risks (87% in Q3 2016 vs 85% in Q1 2016).
Once again, the top three factors that CFOs fear pose a significant risk to their businesses are domestic public policies, stress in the financial system, and political or economic instability in foreign markets. All three risk factors show a deeper concern when compared to Q1 2016.
On the other end of the spectrum, rising barriers to trade, rising input costs and rising labor costs do not seem to pose such a significant threat to Portuguese companies as those listed as the bottom three risk factors.
Focus on cost control In line with last semester’s conclusions, focus on reigning in costs remains as the surveyed CFOs’ top priority while expansionist strategies remain at the bottom.
In fact, 95% of CFOs in Portugal name cost control as an important priority closely followed by working capital efficiency (85%) and cost reduction (83%).
Growth strategies are generally not listed as top priorities since OPEX increase is last on the priority list, and all other expansionist strategies rank below efficiency measures.
It should however also be noted that a mere 25% feel that Divestment is an important strategy for their company.
Fear of Brexit A very significant 52% of the surveyed CFOs predict the Brexit will have a negative impact on their company, while no CFO deemed last June’s decision positive.
This result is all the more impressive when compared to our European neighbors as Portugal ranks second in negative sentiment following the United Kingdom. Heavy reliance on UK exports and fear of further EU instability surely impacted the surveyed CFOs’ opinion.
Confidence on the economic outlook continues to fall as 71% of CFO’s consider it to be negative.
Cost control is the top strategic priority for CFO’s in Portugal with 95% signaling it as likely to be important for their business.
Domestic public policies is the risk factor that most CFO’s consider to pose a significant threat to their business.
Fears of the consequences of a Brexit are very significant as 52% of CFO’s predict a negative impact on their businesses.

European CFO Survey Q3 2016 | Growth prospects in an uncertain world
5
Key findings European CFOs view the current economic and business environment as challenging, but see potential for growth in their businesses over the next year.
Businesses across Europe have had a number of political shocks to contend with over the summer and two-thirds of CFOs view current levels of uncertainty as above normal. As a result, optimism in the third quarter remains basically unchanged from the start of the year, with a net balance of just +1% of CFOs reporting being more optimistic about the financial prospects of their businesses compared to Q1.
With optimism barely improving and perceptions of uncertainty remaining elevated, CFOs continue to be risk averse. On average, less than a third (28%) of CFOs think now is a good time to be taking greater risk onto their balance sheets, down one percentage point from Q1.
One factor that clearly added to perceptions of external uncertainty over the summer was the results of the UK’s referendum in June to leave the EU. The ‘Brexit’ vote took markets by surprise and created a significant shock to sentiment in the UK. In the aftermath of the vote, we asked European CFOs how they believed Brexit negotiations between the EU27 and the UK would impact their businesses. Overwhelmingly European CFOs think there are many more potential negatives than positives from the process: 37% think the negotiations will have a negative impact on their business, while just 5% foresee any positives.
CFOs were also asked which aspects of Brexit would most affect their businesses. In 12 out of the 14 countries this question was asked, a rise in non-tariff barriers to trade – specifically ‘increased complexity and costs due to the introduction of different regulatory requirements’ – rates as the biggest concern. As a whole, ‘reduced workforce mobility’ and a ‘rise in tariffs’ rank as the next biggest concerns. The message for politicians and policymakers - ahead of the Brexit negotiations – is that non-tariff barriers matter at least as much, if not more, than the more-talked-about issues of tariffs and migration.
Brexit was not the only factor to affect sentiment over the summer. Political uncertainty was, to varying degrees, also a significant issue in Spain and Turkey. Both countries experienced significant political instability over the last six months, and it is perhaps not surprising that CFO expressed a fall in optimism. Italy also recorded a large drop in sentiment unsurprisingly given the deterioration of the national growth outlook, but still in line with other country’s net result.
With optimism barely improving and perceptions of uncertainty remaining elevated, CFOs continue to be risk averse.

European CFO Survey Q3 2016 | Growth prospects in an uncertain world
6
On a more positive note, when CFOs were asked to take a more forward looking view and assess the prospects for their businesses in the year ahead, they are markedly more optimistic. The outlook for revenue and margin growth over the next 12 months remains positive, with a net balance +49% expecting growth in revenues and a net balance of +20% expecting margins growth. Despite a deterioration from Q1, the outlook for capital expenditure (capex) and hiring over the next 12 months also remains positive (+8% net balance for capex and +5% for hiring). Much of the deterioration in the overall European averages since Q1 stems from the large post-referendum declines in the UK.
CFOs seem confident that, despite the difficult business environment they are currently facing, their businesses will cope and see growth over the next 12 months. This may reflect the fact that CFOs are well acquainted with this environment, having operated in a climate of uncertainty for some time now. It may also illustrate an underlying resilience in Europe’s corporate sector, which has endured years of slow growth and external shocks, but has started to show signs of a more sustained recovery this year. Although forecast
GDP growth of 1.6% for the eurozone is uninspiring, it would represent the third consecutive year of growth for the bloc – the first time this has been achieved since before the global financial crisis.
In terms of individual countries, headline indicators in Norway and Russia improved considerably. Both Norway and Russia have benefitted from the stabilisation of oil markets, with the price of a barrel of Brent crude rising almost 19% between April and September. Sentiment and risk appetite among CFOs in Germany improved as well, buoyed by continued signs of resilience in the German economy, where industrial production and consumer confidence have strengthened despite concerns over the banking sector. As Europe’s largest economy, the positive outlook for Germany is a boost for European growth prospects more generally.
Another spur to corporate activity is the financing environment. Monetary policy remains extremely accommodative in most countries on our panel and, as a result, financing conditions for large corporates remain positive, with bank borrowing and corporate debt viewed as very attractive, as is internal financing.

European CFO Survey Q3 2016 | Growth prospects in an uncertain world
European CFOs view the current economic and business environment as challenging, but see potential for growth in their businesses over the next year.
European CFO Survey Q3 2016 | Growth prospects in an uncertain world
7

European CFO Survey Q3 2016 | Growth prospects in an uncertain world
8
Chart 1. Financial prospects (%)
Compared to three months ago, how do you feel about the financial prospects for your company?*
Less optimistic Broadly unchanged More optimistic
*Note: In Finland, Norway, Italy, Spain and Sweden the question specified a six-month period.
GDP weighted average net balance 1%
4%
0
9%
20%
11%
0
7%
18%
31%
11%
5%
20%
0
5%
16%
24%
–31%
1%
–8%
€
IE
CH
NO
AT
IT
DE
PL
SE
BE
NL
ES
PT
TR
FI
RU
UK
GDP
FR
Net balanceAbsolute changes to Q1 2016 (pp)
0
– 39
– 1
+ 46
+ 17
– 20
+ 7
– 3
– 19
+ 3
– 1
– 12
+ 1
– 4
– 9
+ 27
–16
– 1
+ 11
52%
38%
55%
44%
52%
50%
60%
34%
44%
39%
59%
39%
42%
46%
40%
50%
37%
49%
54%
26%
31%
27%
38%
30%
25%
23%
42%
44%
36%
23%
41%
29%
30%
38%
37%
16%
26%
19%
22%
31%
18%
18%
19%
25%
17%
24%
13%
25%
18%
20%
29%
24%
22%
13%
47%
25%
27%
Financial prospects barely changed
Against the background of modest growth in Europe and elevated perceptions of uncertainty, CFO optimism remains broadly unchanged. A net balance of +1% are now more optimistic about the financial prospects of their company than three/six months ago, a decline of just one percentage point.
In Portugal, CFO sentiment has remained in line comparatively to last semester, with 29% of Portuguese CFOs feeling less optimistic while 42% claiming their sentiment to remain unchanged. This result comes across fairly pessimistic, with only France and the UK showing greater negativity. It should
be recalled that a significant drop in net sentiment (-44pp) occurred between 3Q15 and 1Q16, a consequence of a variety of factors including the election of a minority government, internal financial instability and weakened demand for key exports.
There have been more marked differences within countries, however. Once again, CFOs in Sweden are the most optimistic, with a net balance of +31% reporting growing optimism, despite sentiment having declined by 19 percentage points on the back of increased concerns about the external environment. The fact that 44% of CFOs based in Sweden are optimistic about
the financial prospects for their company compared to six months ago reflects the continued strength of the Swedish economy over the period, with Sweden still on course to record one of the fastest rates of growth – 3.3% – across Europe this year.
Russia and Norway have experienced the greatest rise in optimism since Q1, with prospects in both economies buoyed by the recovery of oil prices over the summer. Currency markets have also played a role, with the stabilisation of the rouble providing a more predictable environment for Russian firms and the continued weakness of the Norwegian krone boosting Norwegian exporters. Growth in the Norwegian economy is forecast to continue rising next year, while the recession in Russia is expected to end.
High levels of uncertainty in the face of the Brexit vote in June led to a sharp deterioration in sentiment in the UK. Indeed, the UK and France were the only two countries where CFOs were more pessimistic about the financial prospects of their firms than they were in Q1, with a net balance of -31% for the UK and -8% for France.
In Europe’s largest economy, Germany, CFOs are moderately more optimistic than they were in Q1. Despite being exposed to high levels of external uncertainty, the German economy has proved resilient and is set to grow at the fastest pace in five years, according to the German Institute for Economic Research, who have raised their forecast for growth on the back of a sharp rise in private consumption. In September, the German Ifo indicator of industrial activity rose to its highest level since May 2014, having shrugged off post-UK referendum losses and concerns over China.

European CFO Survey Q3 2016 | Growth prospects in an uncertain world
9
GDP weighted average net balance 63%Net balance
Absolute changes to Q1 2016 (pp)
Chart 2. Uncertainty (%)
How would you rate the overall level of external financial and economic uncertainty facing your business?
€
IE
CH
PL
AT
IT
DE
PT
TR
BE
NL
ES
RU
UK
FI
SE
GDP
FR
32%
48%
36%
46%
43%
12%
8%
50%
43%
32%
37%
31%
26%
51%
34%
11%
29%
41%
65%
52%
63%
43%
50%
88%
64%
50%
50%
68%
56%
68%
69%
36%
47%
88%
67%
59%
3%
2%
18%
11%
28%
6%
7%
2%
7%
1%
13%
4%
7%
62%
52%
61%
36%
32%
43%
88%
66%
63%
43%
68%
49%
29%
87%
22%
50%
63%
59%
–1
+3
–7
–9
–9
0
–4
+3
0
–2
–1
–10
–38
+5
–27
+17
–1
+11
High Normal Low
Uncertainty still elevated
Perceptions of external financial and economic uncertainty remain elevated across Europe. In only 3 of the 17 countries surveyed do a majority of CFOs perceive uncertainty to be normal or below normal.
Again, there are big differences across the cohort. In Portugal, on the other hand, perceptions of uncertainty actually increased 3pp, with now 68% of CFOs considering that their businesses are facing high external financial and economic uncertainty and only 2% defining external uncertainty as low. In Russia, perceptions of uncertainty dropped sharply, with the net balance falling by -38pp. Some of this
may reflect companies adapting to external conditions, but it also likely reflects the increase in oil prices and the stabilisation of the rouble.
Perceptions of uncertainty are highest in Germany and the UK, where a net balance of 88% and 87% of CFOs in each respective country report heightened levels of uncertainty. In the UK, perceived uncertainty increased from an already very high level by +5pp, reflecting the unpredictability around the impact of Brexit. Despite a resilient economic outlook in Germany, CFOs continue to view the external environment as uncertain.
However, there has been a -4pp fall in perceptions of uncertainty since the first quarter; a potential sign of fewer concerns about weaker foreign demand, especially from China. This is supported by the fact that weaker foreign demand and emerging market weakness have moved down the list of top risks for German CFOs.
The external environment is viewed most favourably by CFOs in Finland, with a net balance of just +22% of CFOs currently viewing uncertainty as above normal. A more stable outlook in neighbouring Russia may have helped ease perceptions of external uncertainty for Finland-based firms.

European CFO Survey Q3 2016 | Growth prospects in an uncertain world
10
–74% 0
GDP weighted average net balance –43%
–43% Net balance
Absolute changes to Q1 2016 (pp)
Chart 3. Risk appetite (%)
Is this a good time to be taking greater risk onto your balance sheet?
€ IECH NOAT ITDE PL SEBE NLES PT TRFI RU UKGDP FR
70% 69%76% 74%
89%
64%75% 72% 74%
69% 68%
53%
87% 86%
56% 50%
83%72% 73%
30% 31%24% 26%
11%
36%25% 28% 26%31% 32%
47%
13% 14%
44%50%
18%28% 27%
–40% –38%–51% –48%–79% –28%–51% –45% –49%–38% –36%–6% –71%–11% –65%–46%
Yes No
–3 –15 +6 +7 –14 –46 +17 +11 –27 –13 +14 +2 –4 +16 +18 +40 –15 –1 –4
Risk appetite remains weak
With optimism broadly unchanged and perceptions of uncertainty remaining elevated, CFOs continue to take a cautious view of risk. A large majority (72%) of participants state that now is not the right time to increase risk exposure. In none of the 17 countries is the net balance for CFOs’ risk appetite positive. Among the countries surveyed, Portugal maintains its position as the second country where CFOs share the least appetite for risk. Portuguese CFOs believing this is not a time for taking greater balance sheet risk has actually increased by 2pp to 87% comparatively to last semester.
Risk appetite among CFO based in Italy dropped this quarter (-46pp), but the overall number of respondents willing to take on risk remained higher than the
European average. Explanations for this drop vary. From the political uncertainty surrounding the constitutional referendum in December 2016, to worries linked to the Italian financial sector and the continued weakness of the labour market. Consumer confidence has fallen significantly from the record highs recorded in January and forecasters have – on average – sharply downgraded their growth expectations for the Italian economy, for this year and next. In September, growth of 0.7% was forecast for Italy in 2017, down from the 1.2% forecast in May.
Although risk appetite remains weak overall, big divergences exist between countries. CFOs in Russia are the least risk averse this quarter, having seen a strong rebound in risk appetite (+40pp change in
the net balance since Q1). In Russia, one in two CFOs now thinks it is a good time to take greater risk onto their balance sheets.
In line with improving economic sentiment, risk appetite has improved in Germany (+17pp), although CFOs remain risk averse on balance. In the UK, the impact of the Brexit vote can once again be seen, with a further deterioration in CFO risk appetite between Q1 and Q3 (-15pp).

European CFO Survey Q3 2016 | Growth prospects in an uncertain world
11
Revenue expectations remain optimistic In your view, how are revenues for your company likely to change over the next 12 months?*
Chart 4.1. Revenues (%)
Increase Decrease
Net balance
Absolute changes to Q1 2016 (pp)
*Note: In the UK CFOs were asked, “How are revenues for UK corporates likely to change over the next 12 months?”.
€ IECH NOAT ITDE PL SEBE NLES PT TRFI RU UKGDP FR
52% 52%49% 34%27% 46%67% 74% 65%52% 38%60% 34% 54%56% 63% 22%49% 43%
+2 –10 +3 +21 –1 –28 +12 +6 0 +3 +10 –5 –5 –6 +11 +26 –19 +1 +13
67% 69%64%
57%50%
68%76%
83%
73%71%
62%
71%
55%
69%67%76%
46%
65%
54%
14% 17%16%24%23% 22%
9% 9% 8%
20%24%
11%21%
14%11% 13%
24%16% 11%
GDP weighted average net balance 49%
In contrast to the broad pessimism about the current external environment, CFOs are optimistic about the outlook for revenue growth within their business. Almost two-thirds of CFOs expect their company’s revenue to grow and only 16% expect it to decrease (GDP weighted average net balance of +49%), marking for another quarter of stable and optimistic revenue expectations. Although most CFOs in Portugal are positive about revenue, with 55% expecting revenue growth on their businesses for the next 12 months, a slight decrease occurred on the net balance from last semester (-5 pp).
While revenue expectations have slightly dipped among non-eurozone countries (-2pp), this is largely the result of a sharp decline in revenue expectations among
CFOs in the UK (-19pp). The already positive averages would look even better without the UK’s sharp fall in revenue expectations, driven by positive improvements in Germany and France (+12pp and +13pp respectively).
CFOs in Poland are the most optimistic of the cohort on revenues. Recent data suggests that the Polish economy remains in good shape, with the country’s large manufacturing sector in August registering its strongest growth since March 2015, and consumer spending remaining very healthy.
After recording relatively strong revenue expectations in Q1, it is notable that CFOs in southern Europe have turned less optimistic in the last six months. The worsening economic outlook in Italy has
led to a sharp fall in revenue expectations (-28pp), while the outlook has also deteriorated in both Portugal, as previously referred, and Spain (both recording a 5pp drop in overall revenue expectations in comparison to the last semester).
However, the fact that CFOs in two of Europe’s largest economies, Germany and France, expect a strong improvement in revenue growth over the next year provides a more positive signal for European growth.
European CFO Survey Q3 2016 | Growth prospects in an uncertain world
12
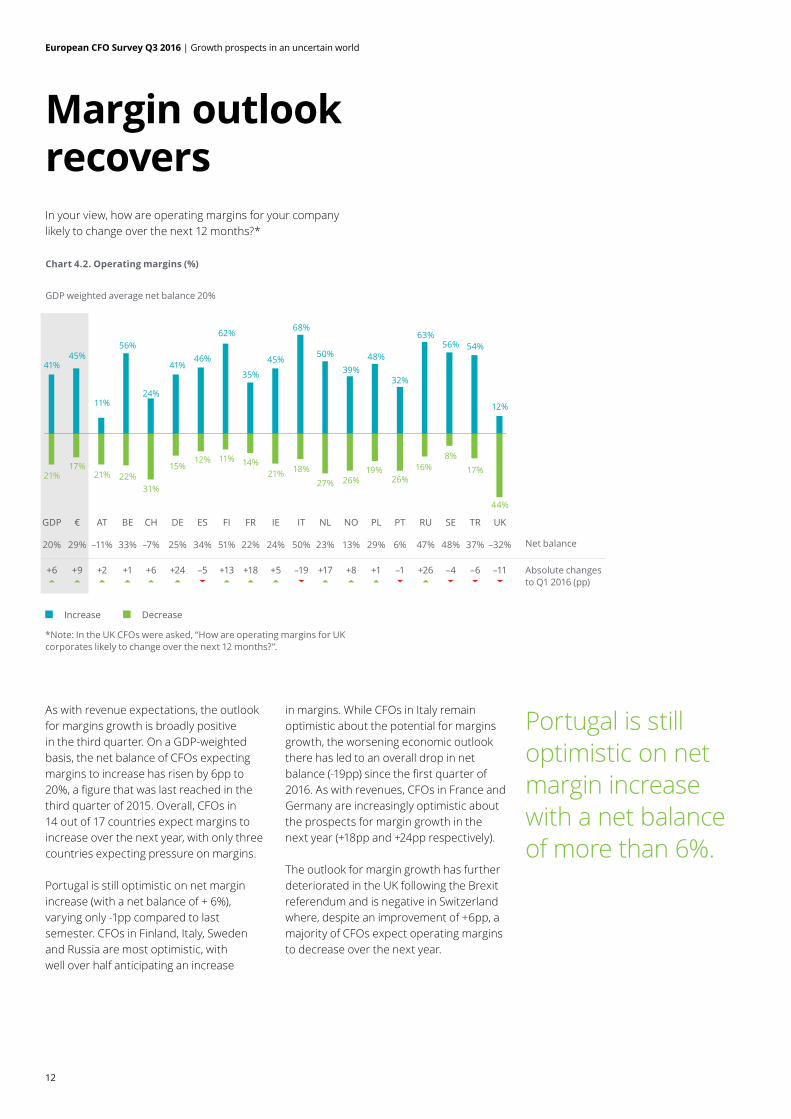
GDP weighted average net balance 20%
Margin outlook recovers
Chart 4.2. Operating margins (%)
In your view, how are operating margins for your company likely to change over the next 12 months?*
Increase Decrease
Net balance
*Note: In the UK CFOs were asked, “How are operating margins for UK corporates likely to change over the next 12 months?”.
Absolute changes to Q1 2016 (pp)
€ IECH NOAT ITDE PL SEBE NLES PT TRFI RU UKGDP FR
29% 24%–7% 13%–11% 50%25% 29% 48%33% 23%34% 6% 37%51% 47% –32%20% 22%
+9 +5 +6 +8 +2 –19 +24 +1 –4 +1 +17 –5 –1 –6 +13 +26 –11+6 +18
45% 45%
24%
39%
11%
68%
41%48%
56%56%50%46%
32%
54%62% 63%
12%
41%35%
17%21%
31%26%21% 18%15% 19%
8%
22%27%
12%
26%17%
11%16%
44%
21%14%
As with revenue expectations, the outlook for margins growth is broadly positive in the third quarter. On a GDP-weighted basis, the net balance of CFOs expecting margins to increase has risen by 6pp to 20%, a figure that was last reached in the third quarter of 2015. Overall, CFOs in 14 out of 17 countries expect margins to increase over the next year, with only three countries expecting pressure on margins.
Portugal is still optimistic on net margin increase (with a net balance of + 6%), varying only -1pp compared to last semester. CFOs in Finland, Italy, Sweden and Russia are most optimistic, with well over half anticipating an increase
in margins. While CFOs in Italy remain optimistic about the potential for margins growth, the worsening economic outlook there has led to an overall drop in net balance (-19pp) since the first quarter of 2016. As with revenues, CFOs in France and Germany are increasingly optimistic about the prospects for margin growth in the next year (+18pp and +24pp respectively).
The outlook for margin growth has further deteriorated in the UK following the Brexit referendum and is negative in Switzerland where, despite an improvement of +6pp, a majority of CFOs expect operating margins to decrease over the next year.
Portugal is still optimistic on net margin increase with a net balance of more than 6%.

European CFO Survey Q3 2016 | Growth prospects in an uncertain world
13
Capex outlook weaker but remains positive
European CFOs broadly retained their appetite for capital expenditure in the third quarter. An overall net balance of +8% expect capital expenditure in their business to increase over the next 12 months, and in only 4 of 17 countries is there an expectation that capital expenditures will decline.
Since the first quarter, the overall net balance for capex has fallen by -9pp, but this is largely attributable to the collapse in capex intentions in the UK (-32pp) following the Brexit vote. For CFOs in the eurozone the fall has been far smaller (-3pp), driven in particular by declines in Spain and
Italy, where the net balances of CFOs who expect capex to increase have fallen from the strong values seen in Q1. On an upbeat note, 43% Portuguese CFOs expect to increase capital expenditure while 21% expect to decrease it, which means a net balance of 21%, up from 6% in the previous semester.
Irish capex intentions remain high where, despite the Brexit vote, the economy remains on course to be Europe’s fastest growing this year. CFOs in Belgium are among the most willing to invest, with a net balance of +45% indicating capital expenditures will increase.
*Note: In the UK CFOs were asked, “How are capital expenditures for UK corporates likely to change over the next 12 months?”
Chart 4.3. Capital expenditure (%)
In your view, how are capital expenditures for your company likely to change over the next 12 months?*
Increase Decrease
GDP weighted average net balance 8%
Net balance
Absolute changes to Q1 2016 (pp)
€ IECH NOAT ITDE PL SEBE NLES PT TRFI RU UKGDP FR
22% 68%26% –4%31% 34%26% 36% 10%45% –5%20% 21% 3%0 –3% –50%8% 8%
–3 +21 +16 –11 N/A –21 +4 –14 +7+11 –18 –10 +9 –18 –33 –13 –32–9 +2
39%
75%
44%
29%38%
48%41%
50%
27%
48%
32%36%43% 40%
22%13%
7%
32% 30%
17%7%
18%
34%
8% 14%14% 14% 17%
4%
36%
15% 21%
37%
22%16%
58%
24%22%

European CFO Survey Q3 2016 | Growth prospects in an uncertain world
14
Employment outlook softens
As with capex intentions, the outlook for employment growth has weakened but remains broadly positive. On a GDP-weighted basis, a net balance of +5% of CFOs expect growth in the number of employees in their companies over the next 12 months.
In hand with the overall drop in confidence in the economic outlook, 32% of Portuguese CFOs present a pessimistic view with respect to workforce numbers. Portugal presents the third largest drop (-11pp) in net job creation expectations comparatively to the first quarter of 2016. This change may be associated to the increased uncertainty of CFOs on the country’s economic outlook.
Once again, much of the weaker outlook can be explained by a much more pessimistic view in the UK where the net balance (-42%) dropped sharply. In line with weaker economic conditions, the employment outlook in Italy also deteriorated sharply over the period (-22pp).
Between the first and third quarters the employment outlook improved in Austria, Belgium, France and Finland and, outside the EU, in Russia, Switzerland and Turkey. The question was asked for the first time in Poland this quarter, where CFOs are the most optimistic of our cohort about the employment outlook in their businesses.
*Note: In the UK CFOs were asked, “How is the outlook for hiring for UK corporates likely to change over the next 12 months?” In Finland the question specified a six-month period.
GDP weighted average net balance 5%
Chart 4.4. Number of employees (%)
In your view, how is the number of employees for your company likely to change over the next 12 months?*
Increase Decrease
Net balance
Absolute changes to Q1 2016 (pp)
€ IECH NOAT ITDE PL SEBE NLES PT TRFI RU UKGDP FR
23% 21%25%
38%
25% 23%30%
15%21%
25%
36%
14%
32%
20%17% 18%
51%
27%
14%
37%
62%
38%
21%21%
38%43%
60%
23%
55%
27%32%
24%
46%
31% 26%
9%
32% 32%
14% 41%13% –17%–4% 15%13% 45% 2%30% –9%17% –8% 26%14% 8% –42%5% 19%
–3 –10+2 –6+3 –220 N/A –1+2 –6–10 –11 +8+6 +13 –31–5 +9
Portuguese CFOs present a pessimistic view with respect to workforce numbers.

European CFO Survey Q3 2016 | Growth prospects in an uncertain worldBrochure / report title goes here | Section title goes here
15

European CFO Survey Q3 2016 | Growth prospects in an uncertain world
16
Political and economic risks dominate
Chart 5. Business risk next 12 months
Which of the following factors are likely to pose a significant risk to your business over the next 12 months?
PT*
AT
ES
CH
FR
BE
FI
DE
IEPolitical instability due to lack of government Demand Global/European economic
uncertainty Economic outlook/ growth
State "fragile" global economic recovery, uncertainty
Outlook of Finnish economy and competitiveness Fiscal and social policies in Europe Currency fluctuations
Uncertainty in fiscal policy Foreign competition The evolution of the price of raw materials Geopolitical risks
Economic activity and growth level in the eurozone Cost of raw material/commodities Financial markets instability Shortage of skilled professionals
Margin deterioration due to cost pressures
Tax interpretations (e.g. transfer pricing) Euro exchange rate Increasing regulations
Increasing regulation in Austria Economic outlook/growth Strength of the Swiss Franc Geopolitical risks
Increasing cost of personnel Competitive position in the market Geopolitical risks Skills shortage
Geopolitical risks Shortage of (skilled) labour Relationship with the EU Weaker domestic demand
Increasing barriers to trade / protectionism
Changes in regulation Brexit Exchange rate risks
Shortage in skilled personnelImpact of Belgian financial & economic policy making
Price of raw materials Weaker foreign demand
22 2 211 1 1
44 4 433 3 3
55 5 5
IT PLNOLocal market reduction Decreasing domestic demand Shortage of qualified workforce Domestic public policies (fiscal, tax,
labour, regulation, social, legal, etc.)
Geopolitical risks Decreasing foreign demandIncrease in costs of running a business (price increase of materials, workforce, services)
Stress in the financial system
Loss of competitiveness compared to international competitors Foreign competition Unstable corporate and tax law Political or economic instability in
foreign markets
Regulatory changes Interest rate level Decrease of domestic demand or recession Weaker domestic demand
Increase in labour costs Currency Market pressure for price decrease of offered goods/services Currency fluctuations
Stress in the financial system Order intake Geopolitical risks Effects of Brexit
Weaker domestic demand (in Russia) Macro/politically related factors Weakness/strength/volatility of currency (e.g. Turkish Lira) Weak demand in the UK
Deterioration of cash flow Skilled labour shortage Deterioration of cash flowDeflation and economic weakness in the euro area, and the possibility of a renewed euro crisis
Weak Russian rouble Cost of raw material/commodities Weaker domestic demandThe prospect of higher interest rates and a general tightening of monetary conditions in the UK and US
Organic profit decrease Fierce competition/pricing power Rising input costs Poor productivity/weak competitiveness in the UK economy
RU TRSE UK
22 2 211 1 1
44 4 433 3 3
55 5 5
2
2
2
2
2
2
2
2
1
1
1
1
1
1
1
1
4
4
4
4
4
4
4
4
3
3
3
3
3
3
3
3
5
5
5
5
5
5
5
5
*Note: The order for Portugal was corrected and therefore is different from the original European CFO survey.

European CFO Survey Q3 2016 | Growth prospects in an uncertain world
17
For 9 out of 16 countries, (geo)political and economic uncertainty poses the main risk to businesses over the next year. In Spain and Turkey, government instability has provided a clear source of concern, while the still unresolved crisis in the Middle East and the rise of populist parties in advanced economies continue to weigh on CFO sentiment.
In each country on the European CFO Survey panel individual factors play a role when CFOs are asked about significant business risks for the upcoming year. While in Q1 2016 (geo)political risks featured most prominently, external and macroeconomic factors play an equally important role for CFOs this time.
In 4 out of 16 countries, a reduction in demand constitutes the top risk for CFOs. Worries about demand and the economic environment coincide with downward revisions for growth in both European and global markets.
The top three concerns of CFOs in Portugal has remained unaltered since last semester. “Domestic public policies” ranks at the top (increasing 2pp), followed by the risks of “Stress in the financial system” and “Political or economic instability in foreign markets”. One needs to note that this survey was undertaken before the discussion of the state budget for 2017. We can still see concerns about the fragile but recovering financial system in Portugal. The third risk is a direct consequence of the continued turbulence in key exporting markets such as UK, Brazil or Angola. In Europe’s stronger growing economies – Germany, Sweden and Poland – skills shortages have become a more pressing concern for CFOs over the last six months. This suggests that competition for labour has intensified on the back of strong gains in employment.
We can still see concerns about the fragile but recovering financial system in Portugal.

European CFO Survey Q3 2016 | Growth prospects in an uncertain world
18
CFOs become more defensive
In times of elevated uncertainty, CFOs focus on defensive strategies. As in the first quarter, CFOs indicate a strong reluctance to use expansionary strategies over the next 12 months.
In 75% of the countries CFOs’ top-rated strategy is defensive, up from 63% in the first quarter. In most cases this
defensiveness reflects a focus on cost measures. In Austria, Sweden and the UK top priorities have changed from expansionary to defensive strategies.
The same defensive trend applies to Portugal, with “Cost control” keeping itself as the top priority as it did so last semester. “Working capital efficiency” and “Cost
reduction” have maintain their respective 2nd and 3rd spots in the ranking of CFO’s strategic priorities. While remaining in 5th place in the ranking, “Introducing new products/services” has increased by 17% in terms of importance for CFOs, which goes to show the increasingly felt need to create a differentiated offer from that of competitors as a path for growth.
Chart 6. Strategic priorities next 12 months
Defensive strategies Expansionary strategies
Please state to what degree the following strategies are likely to be a priority for your business over the next 12 months?
PT
ES FRFI IEIncreased productivity/efficiency Organic growth Organic growth Organic growth
Cost control Cost control Cost reduction Cost control
Organic growth Introducing new products/services Introduction of new products / services
Expanding into new markets
New products / services Expanding into new markets Cost control Cost reduction
Cost reductions Cost reduction Human Capital Introducing new products
AT CHBE DECost cutting On-going cost control Cost control Cost reductions
Organic growth Increasing productivity/efficiency Introducing new products/servicesIntroduction of new products/services
Investing in the EDP-System/in the quality of data
Organic growth Organic growth Increased operating cash flow
Increase in operating cash flow Cost reduction Cost reduction Growth via takeovers/acquisitions
Introducing new products/services Expanding into new markets Expanding into new markets Expansion into new markets
IT PLNOManagement control (cost control, cash management, etc.)
Cost reduction Revenue growth (current markets) Cost control
Introduction of new products or market expansion
Organic growth Revenue growth (new markets) Working capital efficiency
Cost reduction Focus on core business New investments Cost reduction
Expansion through acquisitions Growth in existing markets Cost reduction – direct costs Organic growth
Increasing CAPEX Increase cash flow Cost reduction – indirect costs Introducing new products/services
2
2
2
2
2
2
2
2
1
1
1
1
1
1
1
1
4
4
4
4
4
4
4
4
3
3
3
3
3
3
3
3
5
5
5
5
5
5
5
5
22 2 211 1 1
44 4 433 3 3
55 5 5
Ongoing cost control Reducing cost Cost control Reducing costs
Cost cutting Introducing new products/services Cost reduction Increasing cash flow
Investing in organic growth Increasing cash flow Organic growthIntroducing new products/services or expanding into new markets
Increasing cash flow M&A activity Expanding into new markets Expanding by acquisition
Introducing new products / services Expanding into new geographies Expanding by acquisition Reducing leverage
RU TRSE UK
22 2 211 1 1
44 4 433 3 3
55 5 5

European CFO Survey Q3 2016 | Growth prospects in an uncertain world
19
Bank borrowing preferred option for financing
Chart 7. Sources of funding – GDP weighted net balances (%)
How do you currently rate (…) as a source of funding for corporates in your country?
With monetary policy remaining accommodative across Europe, CFOs continue to view debt funding favourably. Bank borrowing again dominates the sources of funding for CFOs in Europe, with a net balance of 60%, on a GDP weighted basis, viewing bank borrowing as an attractive source of funding (+6pp change from the first quarter). This tendency holds for Portugal, with 58% of CFOs observing bank borrowing as an attractive source of funding.
Monetary authorities continued to widen the scope of their asset purchasing programmes, further pushing down yields on corporate debt obligations, making corporate debt more attractive compared to Q1 (+12pp). This is particularly true for
the eurozone’s four largest economies, as well as in the UK. Again, Portugal does not escape the tendency, and CFOs observe a 13% increase in the attractiveness of corporate debt compared to Q1 (from a net balance of 31% to 44%).
Equity remains the least attractive source of funding for CFOs in Europe. When asked how they rate equity as a source of funding a GDP weighted net balance of -9% of CFOs consider it an attractive source of funding. The same is true for Portugal, with equity funding registering a net balance of -8% among CFOs. In further striking measure, CFOs in Italy and Russia show particular negativity about equity as a source of funding with net balances of -68% and -50% respectively (see Chart
8.3). In Italy, this development could be linked to the turmoil that the Italian stock market has experienced since the beginning of the year.
The attractiveness of equity as a source of funding improved strongly in Germany (+15pp), in line with the improvement in German equity markets.
Internal financing is again the second most attractive source of funding for CFOs in Europe, with 55% viewing internal financing as attractive, compared to 16% who consider it is unattractive. Portugal too places Internal financing as the second most attractive source of funding, with 56% of CFOs regarding it as attractive and only 8% seeing it as unattractive.
*Note: Internal financing was first asked in Q3 2015.
Bank borrowing Corporate debt Equity Internal financing*
70
60
50
40
30
20
10
0
–10
–20
Q1 2015 Q3 2015 Q1 2016 Q3 2016
51%
39%
28%
–8%
54%
40%
20%
–11%
60%
39%
32%
–9%
47%
28%
7%

European CFO Survey Q3 2016 | Growth prospects in an uncertain world
20
62%
41%
69%
55%
79%
21%
58%
54%
63%
72%
85%
76%
48%
–6%
49%
21%
87%
60%
89%
€
IE
CH
NO
AT
IT
DE
PL
SE
BE
NL
ES
PT
TR
FI
RU
UK
GDP
FR
Chart 8.1. Bank borrowing (%)
Unattractive Neither attractive nor unattractive Attractive
GDP weighted average net balance 60% Net balanceAbsolute changes to Q1 2016 (pp)
+6
+35
+15
–4
+16
0
–6
0
–9
–7
+20
0
+6
–8
+12
+31
+3
+6
+21
How do you currently rate bank borrowing as a source of funding for corporates in your country? *
How do you currently rate corporate debt as a source of funding for corporates in your country?*
20%
45%
15%
29%
14%
27%
26%
22%
25%
8%
15%
10%
32%
43%
8%
23%
5%
11%
9%
7%
8%
8%
4%
26%
8%
12%
6%
10%
7%
10%
31%
11%
14%
37%
3%
71%
48%
77%
63%
82%
47%
66%
66%
69%
82%
85%
83%
58%
26%
63%
58%
89%
71%
89%
18%
Chart 8.2. Corporate debt (%)
€
IE
CH
NO
AT
IT
DE
PL
SE
BE
NL
ES
PT
TR
FI
RU
UK
GDP
FR
33%
59%
32%
37%
14%
15%
35%
54%
34%
24%
26%
26%
34%
34%
24%
18%
19%
30%
49%
20%
4%
16%
27%
27%
72%
13%
24%
30%
4%
5%
10%
11%
44%
27%
29%
1%
19%
3%
47%
37%
52%
36%
59%
13%
52%
22%
36%
72%
68%
64%
55%
22%
49%
53%
80%
51%
49%
GDP weighted average net balance 32%
26%
33%
36%
9%
32%
–59%
39%
–2%
6%
67%
63%
54%
44%
–22%
22%
24%
79%
32%
46%
Net balanceAbsolute changes to Q1 2016 (pp)
*Note: Finland and Russia asked the question as specific to “your own company”.
+8
+26
+11
+39
+14
–21
+17
–20
–14
+3
+60
+16
+12
+5
–19
+36
+20
+12
+1

European CFO Survey Q3 2016 | Growth prospects in an uncertain world
21
Chart 8.3. Equity (%)
How do you currently rate equity as a source of funding for corporates in your country?*
How do you currently rate internal financing as a source of funding for corporates in your country?*
Chart 8.4. Internal financing (%)
–11%
7%
3%
21%
–12%
–68%
10%
–16%
–4%
15%
–11%
0
–8%
9%
–2%
–50%
6%
–9%
–8%
€
IE
CH
NO
AT
IT
DE
PL
SE
BE
NL
ES
PT
TR
FI
RU
UK
GDP
FR
GDP weighted average net balance –9% Net balanceAbsolute changes to Q1 2016 (pp)
+4
0
+17
+5
–8
–18
+15
–23
–1
0
–2
–1
–17
–22
–2
–18
+10
+1
+11
48%
63%
43%
45%
40%
10%
49%
51%
43%
48%
47%
45%
31%
36%
43%
54%
29%
78%
32%
15%
27%
17%
36%
79%
32%
20%
33%
30%
19%
28%
39%
27%
32%
24%
17%
61%
26%
21%
22%
30%
38%
24%
11%
31%
17%
26%
33%
21%
28%
31%
36%
22%
11%
32%
23%
8%
45%
€
IE
CH
PT
AT
IT
DE
RU
BE
PL
ES
SE
FI
TR
GDP
FR
33%
32%
19%
36%
18%
24%
32%
11%
33%
11%
36%
34%
36%
41%
30%
43%
14%
11%
16%
8%
4%
34%
8%
26%
12%
20%
13%
6%
18%
18%
16%
11%
53%
57%
65%
56%
79%
42%
60%
63%
55%
69%
51%
60%
46%
41%
55%
46%
GDP weighted average net balance 39%
38%
46%
50%
48%
75%
8%
52%
37%
43%
48%
38%
53%
28%
24%
39%
35%
Net balanceAbsolute changes to Q1 2016 (pp)
0
–7
–3
–1
+18
+10
–2
–33
+1
+24
0
+27
+15
–7
–1
–7
Unattractive Neither attractive nor unattractive Attractive
*Note: Finland and Russia asked the question as specific to "your own company".

European CFO Survey Q3 2016 | Growth prospects in an uncertain world
22
Negative impact of Brexit negotiations feared
*Note: In the UK the question was "With the UK leaving the EU do you think the overall environment for business in the long term will be?" with answer options: "Worse", "Little changed" and "Better".
–29%
–24%
–18%
–29%
0
–48%
–30%
–52%
–54%
–36%
–24%
–21%
–11%
–42%
–34%
–32%
–38%
€
IT
CH
PL
AT
NL
DE
PT
UK*
BE
NO
ES
RU
FI
SE
GDP
IE
Chart 9. Brexit I (%)
Negative No impact Positive Not clear (or prefer not to say)
GDP weighted average net balance –32% Net balance
How will the Brexit negotiations between the EU27 and the UK impact your business?
3%
56% 5%
60% 6%
62% 9%
55% 8%
75% 3%
38% 14%
55%
40% 8%
24%
56% 4%
70%
68% 7%
59% 30%
40% 9%
46% 12%
24% 18%
5%
5%
6%
4%
11%
3%
6%
11%
2%
2%
5%
4%
10%
4%
34%
29%
23%
33%
11%
48%
36%
52%
65%
38%
27%
23%
11%
47%
38%
37%
48%
50% 8%
CFOs across Europe believe the forthcoming Brexit negotiations will negatively impact their businesses. On average, 37% of CFOs expect the impact to be negative, and only 5% expect it to have a positive effect, resulting in a net balance of -32%. CFOs in 13 out of 15 countries on average report a negative impact.
Portugal joins the European crowd in the negative assessment of Brexit, with 52% of CFOs reporting expected negative consequences impacting their business. Key impacts of Brexit in Portugal are associated with Portuguese emigrants working in the UK, exports ties and existing links to UK based financial institutions. Portuguese CFOs come second, only behind the UK, in expecting negative business consequences arising from Brexit negotiations.
It is not surprising that sentiment is most negative in the UK where CFOs were asked whether Brexit would worsen or improve the long-term business environment domestically. A large majority of CFOs – 65% – believe leaving the EU will be bad for business generally.
Ireland and the Netherlands both have close links to the UK, through trade and investment, and nearly half of CFOs in both countries think Brexit will have a negative impact on their businesses.
A large majority of CFOs believe leaving the EU will be bad for business generally.
European CFO Survey Q3 2016 | Growth prospects in an uncertain world
23
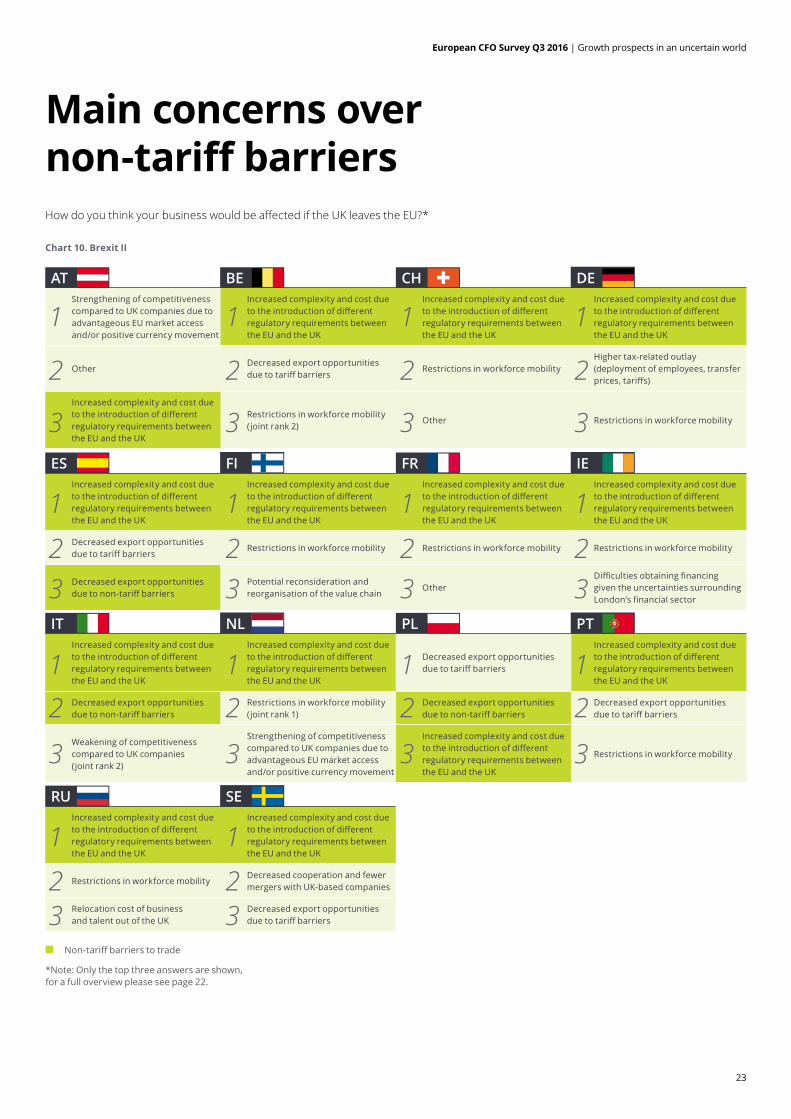
Chart 10. Brexit II
How do you think your business would be affected if the UK leaves the EU?*
Main concerns over non-tariff barriers
*Note: Only the top three answers are shown, for a full overview please see page 22.
Non-tariff barriers to trade
Increased complexity and cost due to the introduction of different regulatory requirements between the EU and the UK
Increased complexity and cost due to the introduction of different regulatory requirements between the EU and the UK
Restrictions in workforce mobilityDecreased cooperation and fewer mergers with UK-based companies
Relocation cost of business and talent out of the UK
Decreased export opportunities due to tariff barriers
AT
ES
IT
RU
CH
FR
PL
BE
FI
NL
SE
DE
IE
PTIncreased complexity and cost due to the introduction of different regulatory requirements between the EU and the UK
Increased complexity and cost due to the introduction of different regulatory requirements between the EU and the UK
Decreased export opportunities due to tariff barriers
Increased complexity and cost due to the introduction of different regulatory requirements between the EU and the UK
Decreased export opportunities due to non-tariff barriers
Restrictions in workforce mobility (joint rank 1)
Decreased export opportunities due to non-tariff barriers
Decreased export opportunities due to tariff barriers
Weakening of competitiveness compared to UK companies (joint rank 2)
Strengthening of competitiveness compared to UK companies due to advantageous EU market access and/or positive currency movement
Increased complexity and cost due to the introduction of different regulatory requirements between the EU and the UK
Restrictions in workforce mobility
Increased complexity and cost due to the introduction of different regulatory requirements between the EU and the UK
Increased complexity and cost due to the introduction of different regulatory requirements between the EU and the UK
Increased complexity and cost due to the introduction of different regulatory requirements between the EU and the UK
Increased complexity and cost due to the introduction of different regulatory requirements between the EU and the UK
Decreased export opportunities due to tariff barriers
Restrictions in workforce mobility Restrictions in workforce mobility Restrictions in workforce mobility
Decreased export opportunities due to non-tariff barriers
Potential reconsideration and reorganisation of the value chain
Other Difficulties obtaining financing given the uncertainties surrounding London’s financial sector
Strengthening of competitiveness compared to UK companies due to advantageous EU market access and/or positive currency movement
Increased complexity and cost due to the introduction of different regulatory requirements between the EU and the UK
Increased complexity and cost due to the introduction of different regulatory requirements between the EU and the UK
Increased complexity and cost due to the introduction of different regulatory requirements between the EU and the UK
Other Decreased export opportunities due to tariff barriers
Restrictions in workforce mobilityHigher tax-related outlay (deployment of employees, transfer prices, tariffs)
Increased complexity and cost due to the introduction of different regulatory requirements between the EU and the UK
Restrictions in workforce mobility (joint rank 2)
Other Restrictions in workforce mobility
2
2
2
2
2
2
2
2
2
2
2
2
2
2
1
1
1
1
1
1
1
1
1
1
1
1
1
1
3
3
3
3
3
3
3
3
3
3
3
3
3
3

European CFO Survey Q3 2016 | Growth prospects in an uncertain world
24
CFOs were also asked which aspects of Brexit they feel will impact their businesses most.
In all but two countries CFOs cited increased complexity and costs due to the introduction of regulations between the EU and the UK as having the biggest potential impact on their businesses. They also cited restrictions in workforce mobility and decreased export opportunities due to non-tariff barriers.
Portuguese CFOs share the common top ranked concern that new regulatory
requirements between the EU and the UK (more complex and costly) will be the predominant way in which their businesses will feel the impact of Brexit. Uncertainty regarding the possibility of introduction of new export tariffs and the likelihood of decreased workforce mobility are the respective 2nd and 3rd concerns of CFOs in Portugal.
Positive impacts of Brexit only make it into the top three in Austria and the Netherlands, where CFOs cited a potential strengthening of competitiveness compared to UK companies.

European CFO Survey Q3 2016 | Growth prospects in an uncertain world
25
In your view, how will the following activities evolve in your company’s sector during the next 12 months?Maintaining last quarter’s tendency, despite a 13pp net balance decrease, corporate restructuring keeps its position as the activity CFOs most expect to evolve in the coming 12 months, which may be tied to Portuguese CFOs’ pursuit of cost control strategies. Expectations regarding private equity activity have increased 1% compared to last semester, a sufficient enough movement to claim the second position from M&A activity, which saw CFOs’ expectations decrease by 18%.
The majority of Portuguese CFOs expect all enquired activities to maintain their current levels, a sign of stability with regard to corporate activity trends.
How do you view the economic outlook for Portugal over the next 12 months?CFOs find renewed pessimism on the outlook of the Portuguese economy over the coming 12 months, building on the acute sentiment inversion observed between 3Q15 and 1Q16.
Remote expectations on the ability of the Portuguese economy to return to healthy growth levels and major uncertainty created from recent world developments, e.g. Brexit, are possible causes for the sombre mood of CFOs in Portugal.
Special questions about Portugal
Portuguese sample characterizationRevenue Sector
Less tham 100 million €
Between 100 and 999 million €
1 billion € and more
Financial Services
Consumer Business
Life Sciences
Technology, Media, Telecomunications
Energy, Utilities, Mining
Manufacturing
Construction
Business & Professional Services
Other (please specify)
16% 18%
66%
6%
24%
29%
10%18%3%
5%
13%5%
European CFO Survey Q3 2016 | Growth prospects in an uncertain world
26
GDP € AT BE CH DE ES FI FR IE IT NL NO PL PT RU SE TR UK
Compared to three/six months ago, how do you feel about the financial prospects for your company?
More optimistic 26% 26% 30% 36% 27% 23% 41% 38% 19% 31% 25% 23% 38% 42% 29% 37% 44% 30% 16%Broadly unchanged 49% 52% 52% 39% 55% 60% 39% 40% 54% 38% 50% 59% 44% 34% 42% 50% 44% 46% 37%Less optimistic 25% 22% 19% 25% 18% 17% 20% 22% 27% 31% 25% 18% 18% 24% 29% 13% 13% 24% 47%Net balance 1% 4% 11% 11% 9% 7% 20% 16% –8% 0% 0% 5% 20% 18% 0% 24% 31% 5% –31%
In your view, how are the following key metrics for your company/corporates likely to change over the next 12 months?RevenuesIncrease 65% 67% 50% 71% 64% 76% 71% 67% 54% 69% 68% 62% 57% 83% 55% 76% 73% 69% 46%No change 20% 19% 27% 9% 20% 14% 17% 22% 35% 14% 10% 14% 19% 8% 24% 11% 19% 17% 29%Decrease 16% 14% 23% 20% 16% 9% 11% 11% 11% 17% 22% 24% 24% 9% 21% 13% 8% 14% 24%Net balance 49% 52% 27% 52% 49% 67% 60% 56% 43% 52% 46% 38% 34% 74% 34% 63% 65% 54% 22%Operating MarginsIncrease 41% 45% 11% 56% 24% 41% 46% 62% 35% 45% 68% 50% 39% 48% 32% 63% 56% 54% 12%No change 38% 38% 68% 22% 44% 44% 42% 27% 51% 34% 14% 23% 35% 33% 42% 21% 35% 29% 44%Decrease 21% 17% 21% 22% 31% 15% 12% 11% 14% 21% 18% 27% 26% 19% 26% 16% 8% 17% 44%Net balance 20% 29% –11% 33% –7% 25% 34% 51% 22% 24% 50% 23% 13% 29% 6% 47% 48% 37% –32%Capital expenditure (CAPEX)Increase 32% 39% 38% 48% 44% 41% 36% 22% 30% 75% 48% 32% 29% 50% 43% 13% 27% 40% 7%No change 43% 44% 54% 48% 39% 45% 49% 56% 49% 18% 38% 32% 37% 36% 36% 71% 56% 23% 35%Decrease 24% 17% 8% 4% 18% 14% 15% 22% 22% 7% 14% 36% 34% 14% 21% 16% 17% 37% 58%Net balance 8% 22% 31% 45% 26% 26% 20% 0% 8% 68% 34% –5% –4% 36% 21% –3% 10% 3% –50%Number of employeesIncrease 32% 37% 21% 55% 38% 43% 32% 31% 32% 62% 38% 27% 21% 60% 24% 26% 23% 46% 9%No change 41% 40% 54% 21% 37% 28% 54% 51% 54% 17% 39% 36% 40% 24% 44% 55% 56% 34% 40%Decrease 27% 23% 25% 25% 25% 30% 14% 17% 14% 21% 23% 36% 38% 15% 32% 18% 21% 20% 51%Net balance 5% 14% –4% 30% 13% 13% 17% 14% 19% 41% 15% –9% –17% 45% –8% 8% 2% 26% –42%
How would you rate the overall level of external financial and economic uncertainty facing your business?
High 67% 65% 43% 50% 63% 88% 56% 36% 59% 52% 50% 68% N/A 64% 68% 47% 50% 69% 88%Normal 29% 32% 46% 43% 36% 12% 37% 51% 41% 48% 43% 32% N/A 8% 31% 34% 50% 26% 11%Low 4% 3% 11% 7% 2% 0% 7% 13% 0% 0% 7% 0% N/A 28% 2% 18% 0% 6% 1%Net balance 63% 62% 32% 43% 61% 88% 49% 22% 59% 52% 43% 68% N/A 36% 66% 29% 50% 63% 87%
Is this a good time to be taking greater risk onto your balance sheet?
Yes 28% 30% 11% 31% 24% 25% 47% 44% 27% 31% 36% 32% 26% 28% 13% 50% 26% 14% 18%No 72% 70% 89% 69% 76% 75% 53% 56% 73% 69% 64% 68% 74% 72% 87% 50% 74% 86% 83%Net balance –43% –40% –79% –38% –51% –51% –6% –11% –46% –38% –28% –36% –48% –45% –74% 0% –49% –71% –65%
How do you currently rate as a source of funding for corporates in your country...Bank borrowingAttractive 71% 71% 82% 82% 77% 66% 83% 63% 89% 48% 47% 85% 63% 66% 58% 58% 69% 26% 89%Neither attractive nor unattractive 18% 20% 14% 8% 15% 26% 10% 23% 11% 45% 27% 15% 29% 22% 32% 5% 25% 43% 8%Unattractive 11% 9% 4% 10% 8% 8% 7% 14% 0% 7% 26% 0% 8% 12% 10% 37% 6% 31% 3%Net balance 60% 62% 79% 72% 69% 58% 76% 49% 89% 41% 21% 85% 55% 54% 48% 21% 63% –6% 87%Corporate debtAttractive 51% 47% 59% 72% 52% 52% 64% 49% 49% 37% 13% 68% 36% 22% 55% 53% 36% 22% 80%Neither attractive nor unattractive 30% 33% 14% 24% 32% 35% 26% 24% 49% 59% 15% 26% 37% 54% 34% 18% 34% 34% 19%Unattractive 19% 20% 27% 4% 16% 13% 10% 27% 3% 4% 72% 5% 27% 24% 11% 29% 30% 44% 1%Net balance 32% 26% 32% 67% 36% 39% 54% 22% 46% 33% –59% 63% 9% –2% 44% 24% 6% –22% 79%EquityAttractive 23% 21% 24% 33% 30% 31% 28% 22% 8% 22% 11% 21% 38% 17% 31% 11% 26% 36% 32%Neither attractive nor unattractive 45% 48% 40% 48% 43% 49% 45% 54% 78% 63% 10% 47% 45% 51% 31% 29% 43% 36% 43%Unattractive 32% 32% 36% 19% 27% 20% 28% 24% 17% 15% 79% 32% 17% 33% 39% 61% 30% 27% 26%Net balance –9% –11% –12% 15% 3% 10% 0% –2% –8% 7% –68% –11% 21% –16% –8% –50% –4% 9% 6%Internal financingAttractive 55% 53% 79% 55% 65% 60% 51% 46% 46% 57% 42% N/A N/A 69% 56% 63% 60% 41% N/ANeither attractive nor unattractive 30% 33% 18% 33% 19% 32% 36% 36% 43% 32% 24% N/A N/A 11% 36% 11% 34% 41% N/AUnattractive 16% 14% 4% 12% 16% 8% 13% 18% 11% 11% 34% N/A N/A 20% 8% 26% 6% 18% N/ANet balance 39% 38% 75% 43% 50% 52% 38% 28% 35% 46% 8% N/A N/A 48% 48% 37% 53% 24% N/A
How will the Brexit negotiations between the EU27 and the UK impact your business?
Negative 37% 34% 11% 38% 23% 36% 23% 47% N/A 48% 29% 48% 27% 33% 52% 11% 38% N/A 65%No impact 50% 56% 75% 56% 62% 55% 68% 40% N/A 24% 60% 38% 70% 55% 40% 59% 46% N/A 24%Positive 5% 5% 11% 2% 6% 6% 2% 4% N/A 10% 5% 0% 3% 4% 0% 0% 4% N/A 11%Net balance –32% –29% 0% –36% –18% –30% –21% –42% N/A –38% –24% –48% –24% –29% –52% –11% –34% N/A –54%
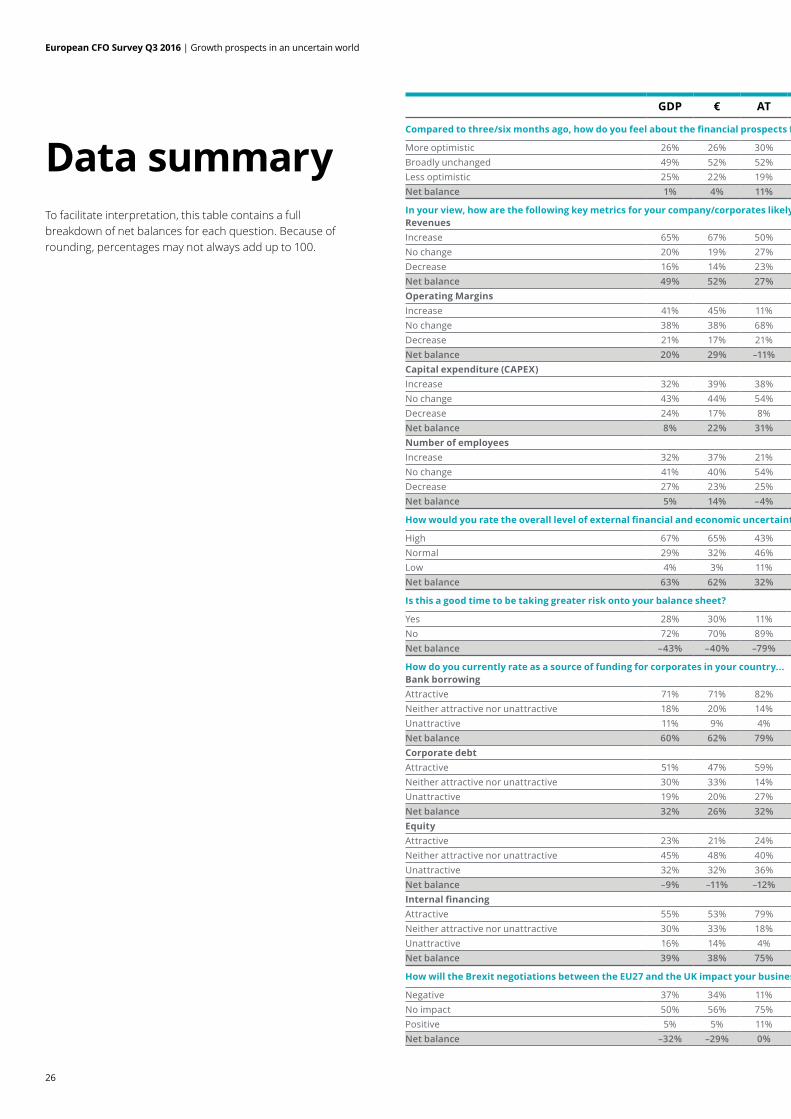
Data summaryTo facilitate interpretation, this table contains a full breakdown of net balances for each question. Because of rounding, percentages may not always add up to 100.

European CFO Survey Q3 2016 | Growth prospects in an uncertain world
27
GDP € AT BE CH DE ES FI FR IE IT NL NO PL PT RU SE TR UK
Compared to three/six months ago, how do you feel about the financial prospects for your company?
More optimistic 26% 26% 30% 36% 27% 23% 41% 38% 19% 31% 25% 23% 38% 42% 29% 37% 44% 30% 16%Broadly unchanged 49% 52% 52% 39% 55% 60% 39% 40% 54% 38% 50% 59% 44% 34% 42% 50% 44% 46% 37%Less optimistic 25% 22% 19% 25% 18% 17% 20% 22% 27% 31% 25% 18% 18% 24% 29% 13% 13% 24% 47%Net balance 1% 4% 11% 11% 9% 7% 20% 16% –8% 0% 0% 5% 20% 18% 0% 24% 31% 5% –31%
In your view, how are the following key metrics for your company/corporates likely to change over the next 12 months?RevenuesIncrease 65% 67% 50% 71% 64% 76% 71% 67% 54% 69% 68% 62% 57% 83% 55% 76% 73% 69% 46%No change 20% 19% 27% 9% 20% 14% 17% 22% 35% 14% 10% 14% 19% 8% 24% 11% 19% 17% 29%Decrease 16% 14% 23% 20% 16% 9% 11% 11% 11% 17% 22% 24% 24% 9% 21% 13% 8% 14% 24%Net balance 49% 52% 27% 52% 49% 67% 60% 56% 43% 52% 46% 38% 34% 74% 34% 63% 65% 54% 22%Operating MarginsIncrease 41% 45% 11% 56% 24% 41% 46% 62% 35% 45% 68% 50% 39% 48% 32% 63% 56% 54% 12%No change 38% 38% 68% 22% 44% 44% 42% 27% 51% 34% 14% 23% 35% 33% 42% 21% 35% 29% 44%Decrease 21% 17% 21% 22% 31% 15% 12% 11% 14% 21% 18% 27% 26% 19% 26% 16% 8% 17% 44%Net balance 20% 29% –11% 33% –7% 25% 34% 51% 22% 24% 50% 23% 13% 29% 6% 47% 48% 37% –32%Capital expenditure (CAPEX)Increase 32% 39% 38% 48% 44% 41% 36% 22% 30% 75% 48% 32% 29% 50% 43% 13% 27% 40% 7%No change 43% 44% 54% 48% 39% 45% 49% 56% 49% 18% 38% 32% 37% 36% 36% 71% 56% 23% 35%Decrease 24% 17% 8% 4% 18% 14% 15% 22% 22% 7% 14% 36% 34% 14% 21% 16% 17% 37% 58%Net balance 8% 22% 31% 45% 26% 26% 20% 0% 8% 68% 34% –5% –4% 36% 21% –3% 10% 3% –50%Number of employeesIncrease 32% 37% 21% 55% 38% 43% 32% 31% 32% 62% 38% 27% 21% 60% 24% 26% 23% 46% 9%No change 41% 40% 54% 21% 37% 28% 54% 51% 54% 17% 39% 36% 40% 24% 44% 55% 56% 34% 40%Decrease 27% 23% 25% 25% 25% 30% 14% 17% 14% 21% 23% 36% 38% 15% 32% 18% 21% 20% 51%Net balance 5% 14% –4% 30% 13% 13% 17% 14% 19% 41% 15% –9% –17% 45% –8% 8% 2% 26% –42%
How would you rate the overall level of external financial and economic uncertainty facing your business?
High 67% 65% 43% 50% 63% 88% 56% 36% 59% 52% 50% 68% N/A 64% 68% 47% 50% 69% 88%Normal 29% 32% 46% 43% 36% 12% 37% 51% 41% 48% 43% 32% N/A 8% 31% 34% 50% 26% 11%Low 4% 3% 11% 7% 2% 0% 7% 13% 0% 0% 7% 0% N/A 28% 2% 18% 0% 6% 1%Net balance 63% 62% 32% 43% 61% 88% 49% 22% 59% 52% 43% 68% N/A 36% 66% 29% 50% 63% 87%
Is this a good time to be taking greater risk onto your balance sheet?
Yes 28% 30% 11% 31% 24% 25% 47% 44% 27% 31% 36% 32% 26% 28% 13% 50% 26% 14% 18%No 72% 70% 89% 69% 76% 75% 53% 56% 73% 69% 64% 68% 74% 72% 87% 50% 74% 86% 83%Net balance –43% –40% –79% –38% –51% –51% –6% –11% –46% –38% –28% –36% –48% –45% –74% 0% –49% –71% –65%
How do you currently rate as a source of funding for corporates in your country...Bank borrowingAttractive 71% 71% 82% 82% 77% 66% 83% 63% 89% 48% 47% 85% 63% 66% 58% 58% 69% 26% 89%Neither attractive nor unattractive 18% 20% 14% 8% 15% 26% 10% 23% 11% 45% 27% 15% 29% 22% 32% 5% 25% 43% 8%Unattractive 11% 9% 4% 10% 8% 8% 7% 14% 0% 7% 26% 0% 8% 12% 10% 37% 6% 31% 3%Net balance 60% 62% 79% 72% 69% 58% 76% 49% 89% 41% 21% 85% 55% 54% 48% 21% 63% –6% 87%Corporate debtAttractive 51% 47% 59% 72% 52% 52% 64% 49% 49% 37% 13% 68% 36% 22% 55% 53% 36% 22% 80%Neither attractive nor unattractive 30% 33% 14% 24% 32% 35% 26% 24% 49% 59% 15% 26% 37% 54% 34% 18% 34% 34% 19%Unattractive 19% 20% 27% 4% 16% 13% 10% 27% 3% 4% 72% 5% 27% 24% 11% 29% 30% 44% 1%Net balance 32% 26% 32% 67% 36% 39% 54% 22% 46% 33% –59% 63% 9% –2% 44% 24% 6% –22% 79%EquityAttractive 23% 21% 24% 33% 30% 31% 28% 22% 8% 22% 11% 21% 38% 17% 31% 11% 26% 36% 32%Neither attractive nor unattractive 45% 48% 40% 48% 43% 49% 45% 54% 78% 63% 10% 47% 45% 51% 31% 29% 43% 36% 43%Unattractive 32% 32% 36% 19% 27% 20% 28% 24% 17% 15% 79% 32% 17% 33% 39% 61% 30% 27% 26%Net balance –9% –11% –12% 15% 3% 10% 0% –2% –8% 7% –68% –11% 21% –16% –8% –50% –4% 9% 6%Internal financingAttractive 55% 53% 79% 55% 65% 60% 51% 46% 46% 57% 42% N/A N/A 69% 56% 63% 60% 41% N/ANeither attractive nor unattractive 30% 33% 18% 33% 19% 32% 36% 36% 43% 32% 24% N/A N/A 11% 36% 11% 34% 41% N/AUnattractive 16% 14% 4% 12% 16% 8% 13% 18% 11% 11% 34% N/A N/A 20% 8% 26% 6% 18% N/ANet balance 39% 38% 75% 43% 50% 52% 38% 28% 35% 46% 8% N/A N/A 48% 48% 37% 53% 24% N/A
How will the Brexit negotiations between the EU27 and the UK impact your business?
Negative 37% 34% 11% 38% 23% 36% 23% 47% N/A 48% 29% 48% 27% 33% 52% 11% 38% N/A 65%No impact 50% 56% 75% 56% 62% 55% 68% 40% N/A 24% 60% 38% 70% 55% 40% 59% 46% N/A 24%Positive 5% 5% 11% 2% 6% 6% 2% 4% N/A 10% 5% 0% 3% 4% 0% 0% 4% N/A 11%Net balance –32% –29% 0% –36% –18% –30% –21% –42% N/A –38% –24% –48% –24% –29% –52% –11% –34% N/A –54%

European CFO Survey Q3 2016 | Growth prospects in an uncertain world
28
GDP AT BE CH DE ES FI FR IE IT NL NO PL PT RU SE TR UK
How do you think your business would be affected if the UK leaves the EU? (please select all that apply)
Increased complexity and cost due to the introduction of different regulatory requirements between the EU and the UK
39% 18% 38% 34% 51% 34% 38% 41% 66% 19% 36% N/A 23% 44% 42% 50% N/A N/A
Relocation cost of business and talent out of the UK 7% 0% 13% 4% 4% 15% 4% 0% 14% 2% 9% N/A 2% 6% 26% 8% N/A N/A
Higher tax-related outlay (deployment of employees, transfer prices, tariffs)
17% 11% 14% 10% 37% 4% 11% 11% 17% 5% 9% N/A 12% 18% 24% N/A N/A N/A
Potential reconsideration and reorganisation of the value chain
13% 4% 14% 12% 16% 9% 20% 16% 10% 5% 18% N/A 16% 13% 21% N/A N/A N/A
Decreased export opportunities due to tariff barriers 15% 14% 29% 10% 17% 23% 13% 11% 14% 8% 18% N/A 31% 32% 5% 14% N/A N/A
Decreased export opportunities due to non-tariff barriers
12% 11% 7% 6% 12% 22% 4% 16% 10% 12% 9% N/A 28% 15% 0% N/A N/A N/A
Decreased cooperation and fewer mergers with UK-based companies
11% 4% 11% 7% 16% 21% 7% 5% 10% 6% 5% N/A 13% 8% 11% 18% N/A N/A
Restrictions in workforce mobility 24% 7% 29% 19% 30% 16% 22% 32% 31% 4% 36% N/A 17% 24% 39% N/A N/A N/A
Difficulties obtaining financing given the uncertainties surrounding London’s financial sector
10% 4% 4% 5% 7% 19% 2% 16% 24% 7% 9% N/A 10% 16% 8% N/A N/A N/A
Strengthening of competitiveness compared to UK companies due to advantageous EU market access and/or positive currency movement
11% 21% 7% 7% 15% 11% 4% 8% 10% 6% 27% N/A 10% 5% 5% 14% N/A N/A
Weakening of competitiveness compared to UK companies due to market access limitations and/or negative currency movements
9% 4% 16% 7% 15% 8% 11% 0% 24% 12% 14% N/A 7% 3% 5% N/A N/A N/A
Increased opportunities to buy assets in the UK as a result of sterling devaluation and an easing of monetary policy
7% 14% 5% 10% 8% 9% 9% 0% 7% 4% 0% N/A 2% 8% 24% N/A N/A N/A
Improved UK tax and regulatory environment as the UK government seeks to reinforce attractiveness of the UK market
6% 0% 11% 12% 7% 8% 11% 0% 14% 2% 14% N/A 6% 11% 8% N/A N/A N/A
Other 13% 21% 0% 14% 9% 0% 4% 30% 3% 8% 27% N/A 5% 2% 16% N/A N/A N/A
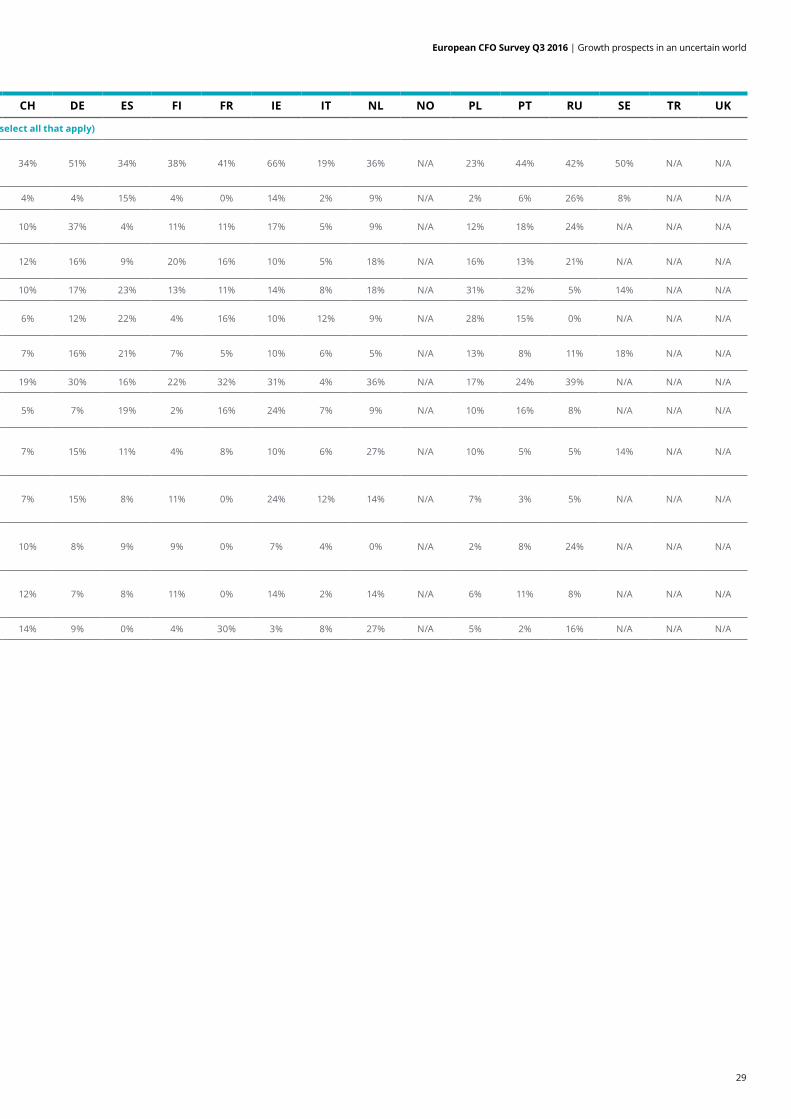
Data summary (continued)To facilitate interpretation, this table contains a full breakdown of net balances for each question. Because of rounding, percentages may not always add up to 100.
European CFO Survey Q3 2016 | Growth prospects in an uncertain world
29
GDP AT BE CH DE ES FI FR IE IT NL NO PL PT RU SE TR UK
How do you think your business would be affected if the UK leaves the EU? (please select all that apply)
Increased complexity and cost due to the introduction of different regulatory requirements between the EU and the UK
39% 18% 38% 34% 51% 34% 38% 41% 66% 19% 36% N/A 23% 44% 42% 50% N/A N/A
Relocation cost of business and talent out of the UK 7% 0% 13% 4% 4% 15% 4% 0% 14% 2% 9% N/A 2% 6% 26% 8% N/A N/A
Higher tax-related outlay (deployment of employees, transfer prices, tariffs)
17% 11% 14% 10% 37% 4% 11% 11% 17% 5% 9% N/A 12% 18% 24% N/A N/A N/A
Potential reconsideration and reorganisation of the value chain
13% 4% 14% 12% 16% 9% 20% 16% 10% 5% 18% N/A 16% 13% 21% N/A N/A N/A
Decreased export opportunities due to tariff barriers 15% 14% 29% 10% 17% 23% 13% 11% 14% 8% 18% N/A 31% 32% 5% 14% N/A N/A
Decreased export opportunities due to non-tariff barriers
12% 11% 7% 6% 12% 22% 4% 16% 10% 12% 9% N/A 28% 15% 0% N/A N/A N/A
Decreased cooperation and fewer mergers with UK-based companies
11% 4% 11% 7% 16% 21% 7% 5% 10% 6% 5% N/A 13% 8% 11% 18% N/A N/A
Restrictions in workforce mobility 24% 7% 29% 19% 30% 16% 22% 32% 31% 4% 36% N/A 17% 24% 39% N/A N/A N/A
Difficulties obtaining financing given the uncertainties surrounding London’s financial sector
10% 4% 4% 5% 7% 19% 2% 16% 24% 7% 9% N/A 10% 16% 8% N/A N/A N/A
Strengthening of competitiveness compared to UK companies due to advantageous EU market access and/or positive currency movement
11% 21% 7% 7% 15% 11% 4% 8% 10% 6% 27% N/A 10% 5% 5% 14% N/A N/A
Weakening of competitiveness compared to UK companies due to market access limitations and/or negative currency movements
9% 4% 16% 7% 15% 8% 11% 0% 24% 12% 14% N/A 7% 3% 5% N/A N/A N/A
Increased opportunities to buy assets in the UK as a result of sterling devaluation and an easing of monetary policy
7% 14% 5% 10% 8% 9% 9% 0% 7% 4% 0% N/A 2% 8% 24% N/A N/A N/A
Improved UK tax and regulatory environment as the UK government seeks to reinforce attractiveness of the UK market
6% 0% 11% 12% 7% 8% 11% 0% 14% 2% 14% N/A 6% 11% 8% N/A N/A N/A
Other 13% 21% 0% 14% 9% 0% 4% 30% 3% 8% 27% N/A 5% 2% 16% N/A N/A N/A

30
European CFO Survey Q3 2016 | Growth prospects in an uncertain world
European CFO Survey
CFO Survey Portugal
Sanford CockrellManaging Partner, Global Leader,CFO ProgrammeDeloitte [email protected]
Alan FlanaganPartner, EMEA CFO Programme LeadDeloitte [email protected]
Michael GramppDirector, European CFO Survey LeadDeloitte [email protected]
Kate McCarthyManager, EMEA ResearchDeloitte [email protected]
Jorge MarrãoPartner, CFO Programme Portugal LeaderDeloitte [email protected]
Nelson FontainhasPartner, CFO Survey Portugal LeaderDeloitte [email protected]
Francisco JácomeManager, Finance transformationDeloitte [email protected]
Inês Silva NunesClients & Markets campaign managerDeloitte [email protected]

European CFO Survey Q3 2016 | Growth prospects in an uncertain world

Deloitte refers to one or more of Deloitte Touche Tohmatsu Limited, a UK private company limited by guarantee (“DTTL”), its network of member firms, and their related entities. DTTL and each of its member firms are legally separate and independent entities. DTTL (also referred to as “Deloitte Global”) does not provide services to clients.Please see www.deloitte.com/about to learn more about our global network of member firms.
Deloitte provides audit, consulting, financial advisory, risk advisory, tax and related services to public and private clients spanning multiple industries. Deloitte serves four out of five Fortune Global 500® companies through a globally connected network of member firms in more than 150 countries bringing, world-class capabilities, insights, and high-quality service to address clients' most complex business challenges. To learn more about how Deloitte's approximately 245,000 professionals make an impact that matters, please connect with us on Facebook, LinkedIn, or Twitter.
This communication contains general information only, and none of Deloitte Touche Tohmatsu Limited, its member firms, or their related entities (collectively, the “Deloitte Network”) is, by means of this communication, rendering professional advice or services. Before making any decision or taking any action that may affect your finances or your business, you should consult a qualified professional adviser. No entity in the Deloitte network shall be responsible for any loss whatsoever sustained by any person who relies on this communication. © 2016. For information, contact Deloitte & Associados, SROC S.A.
www.deloitteresearchemea.com


![cfos/df ePsf ;+zf]wgx](https://img.dokumen.tips/doc/110x75/6271bfd169df4d37f659ec37/cfosdf-epsf-zfwgx.jpg)

![cfos/ P]g @)%*](https://img.dokumen.tips/doc/110x75/62068534b9eb4f395166c325/cfos-pg-.jpg)