Embed Size (px)
Citation preview

Eradicate hunger, food insecurity
and malnutrition
Eliminate rural poverty through socio-
economic development
Sustainable management and
utilization of natural resources
Presentation by Árni M. Mathiesen Assistant-Director General
Fisheries and Aquaculture DepartmentFood and Agriculture Organization of the United Nations
Europe, the Ocean and Feeding the World20 March 2018
European Parliament, Brussels, Belgium

0.0
3.0
6.0
9.0
12.0
15.0
18.0
21.0
0
20
40
60
80
100
120
140
160
180
1950 1955 1960 1965 1970 1975 1980 1985 1990 1995 2000 2005 2010 2016
Aquaculture for human consumption
Capture for human consumption
Non-food uses
Per capita food fish supply
Utilisation du poisson (millions des tonnes –equivalent en poids vif)
Consommation de poissonpar personne (kg)
Hors plantes aquatiques. 2015/2016: estimations/perspectives
What are we achieving now?Fish production and utilization
174.1 MT
Aquaculture for human consumption: 93 MT
Capture for human consumption: 82 MT
Non- food uses : 21 MT
Per capita food fish supply: 20.5Kg/PC

OECD-FAO Fish Model Projections (2026)
Source: OECD-FAO Agricultural Outlook 2017-2026Countries/regions ranked by per capita fish consumption in 2014-16 average.Countries/regions with declined per capita fish consumption highlighted in red.
WB-FAO-IFPRI Fish to 2030 Projections
Source: World Bank Report on Fish to 2030 (Table 3.7). Countries/regions ranked by per capita fish consumption in 2006. Countries/regions with declined per capita fish consumption highlighted in red
Country/region
Fish Demand (2030) Total fish
prod. (2012, mil.
tonne)
S-Dgap
2030 (col. 4 minus col. 3)
kg/cap.Total (mil.
tonne)
WORLD29.1 261.2 156.5
-104.7
S.S. Africa10.8 15.1 6.9
-8.2
L.A. & C.12.2 18.3 14.8
-3.4
N. Africa12.9 3.7 2.8
-0.8
Europe27.3 23.4 16.0
-7.4
N. America29.8 12.9 6.7
-6.1
Oceania31.9 1.8 1.4
-0.3
Asia37.0 186.3 107.8
-78.5
Future fish supply and demand projections
FAO/FI Fish Supply-Demand Gap Projections
Source: Estimation of FI/FAO (preliminary results)Main assumptions: 1) Per capita fish demand affected by income growth. 2) Fish price unchanged. 3) Preference over fish unchanged
50,2
47,2
26,5
25,0
23,5
22,8
17,7
11,4
8,1
6,9
21,6
0 10 20 30 40 50 60
China
Japan
Asia and Pacific
Australia New Zealand
Europe
Northern America
Northern Africa
Latin America and Caribbean
Sub-Saharan Africa
India
WORLD
2014-16 2026
Per capita fish consumption (kg/capita/year)

Filling Fish Supply-Demand
Source: WHO
Maintaining/increasing capture fisheries production▪Rebuilding overexploited stocks ▪Recovery of the “Sunken Billions” through reducing overcapacity More direct human consumption▪Shifting industrialized use of fish (fish meal and fish oil) to direct human consumptionReducing waste▪Utilization of bycatch and discards▪Utilization of processing waste▪Reducing post-harvest spoilage (cold storage, more efficient value chain, etc.)Sustaining aquaculture growth▪Sustainable intensification in Asia.▪Expansion in Africa and Latin America▪Increasing acceptance in western countries ▪More efficient feed and feed management▪Genetic improvement of seed stocks▪Low-trophic species (non-fed finfishes, mollusks, etc.)▪Innovation in farming systems and technologies

What are we achieving now?Capture fisheries production
million tonnes in live weight 2015
Including aquatic plants
0
10
20
30
40
50
60
70
80
90
1001
95
0
19
55
19
60
19
65
19
70
19
75
19
80
19
85
19
90
19
95
20
00
20
05
20
10
20
15
Mill
ion
s
Inland Capture
Marine Capture
Finfish83%
Crustaceans8%
Molluscs7%
Aquatic plants1%
Other aquatic animals
1%

million tonnes live weight
Including aquatic plants
What are we achieving now?Aquaculture production
2015
0
20
40
60
80
100
1201
95
0
19
55
19
60
19
65
19
70
19
75
19
80
19
85
19
90
19
95
20
00
20
05
20
10
20
15
Mill
ion
s
Marine & Coastal Aquaculture
Inland Aquaculture
Other aquatic animals
1%
Crustaceans7%
Molluscs15%
Aquatic plants28%
Finfish49%

Available for consumption ▪ Increased proportion for human consumption
▪ Reduced waste
▪ Rebuilding stocks
▪ Aquaculture expected to exceed 100 million tonnes by 2025
▪ Aquaculture annual growth expected to slow from 5.3% over previous decade to 2.3% pa for coming decade
(1970-2010 8.3% pa)
▪ Human consumption 2026 180 MT ; 100 MT Aquaculture - 80 MT Capture Fisheries

Issues, constraints and challenges
Source: WHO
Resources and environment▪ Environment degradation and habitat destruction ▪ Loss of biodiversity▪ Overexploited fish stocks▪ Biosecurity (disease outbreaks)▪ Climate changes (El Niño, ocean acidification, stock migration, severe
weather conditions, etc.)Socioeconomic and governance▪ Overcapacity (fleets and labor) ▪ IUU fishing▪ Bycatch and discards▪ Access to capital and financial services (loans, insurance, etc.)▪ Economic development and Equity (poverty, forced labor, child labor, etc.)▪ Public image of fisheries and aquaculture

Global Primary Production
Total Continental 115 billion tons a year
Total Marine 55 billion tons a year
What is the potential?
Total continetal; 115
Total Marine; 55
World Biomass/Standing Stock
Total Continental 1837 billion tons
Total Marine 3.9 billion tons
Total Continetal;
1837
Total Marine; 3,9
Primary Production
Mean NPP (g/m^2/year)
Total Continental 773
Total Marine 152
Total Continental;
773
Total marine; 152

We are only using a fraction of the Ocean Space and PP today
1.What can we achieve with in the conventional?2. Can we use more of the PP?3. Can we increase the PP?
Are there limits? Yes ( Technical, Environmental)What are the limits? We don’t know
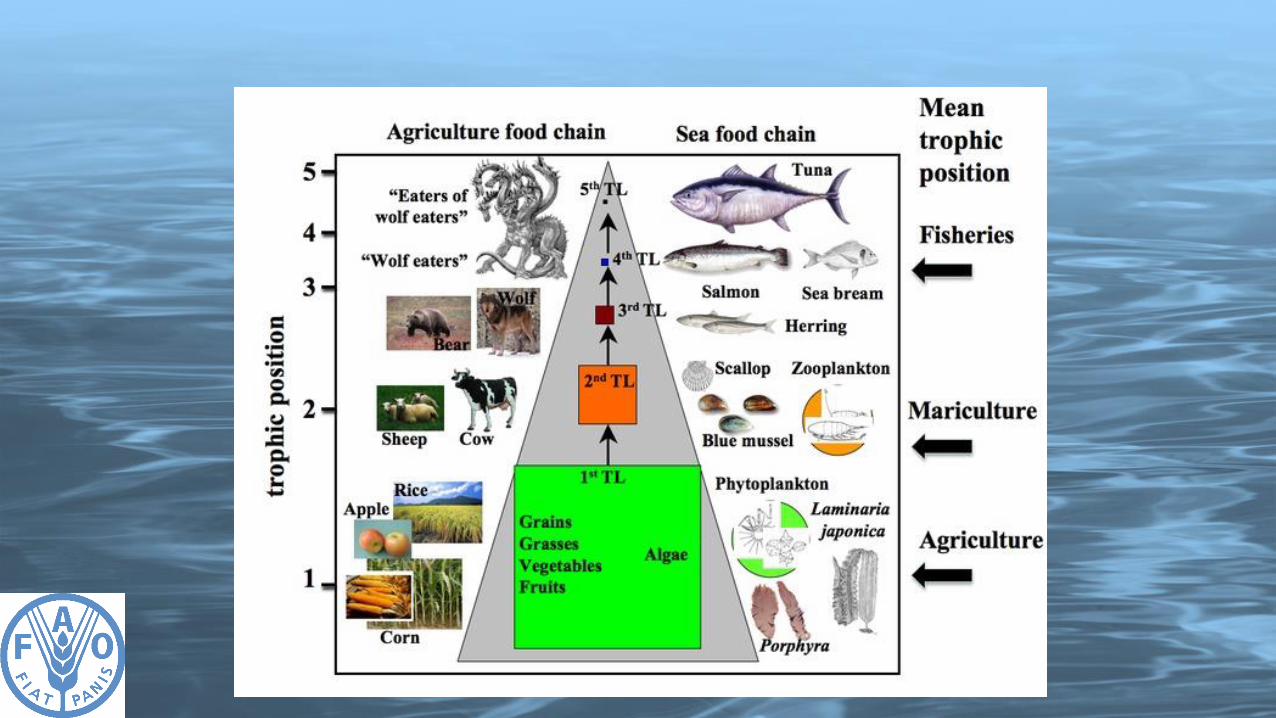

Integrated Multi-Trophic Aquaculture(IMTA):Big potential for Blue Growth
▪ Ecosystem approach▪ Diversified products▪ Better market
satisfaction▪ Better economic and
ecological benefit

CBD Sustainable Ocean Initiative Fostering dialogue for the sustainable use of Fisheries resources , 28 February 2018, European Parliament, Brussels, Belgium
http://www.fao.org/fi/static-media/ADG/AM_Presentation_BrusselsFeb2018.pdf
FAO’s Blue Growth Initiative, 5 October 2017, St. Julian’s Malta
https://www.slideshare.net/FAOoftheUN/faos-blue-growth-initiative?ref=http://www.fao.org/fishery/DirectorsMedia/en
Major issues, For the Diplomatic Education and training center, Mid career course, 2 March 2018 Embassy of the Republic of Indonesia
https://www.slideshare.net/FAOoftheUN/major-issues-for-the-diplomatic-education-and-training-center-mid-career-course?ref=http://www.fao.org/fishery/DirectorsMedia/en
Financing the Sustainable Ocean , Bali Indonesia Economy 22-24 February 2017
https://www.slideshare.net/FAOoftheUN/world-ocean-summit-2017-financing-the-sustainable-ocean-economy?ref=http://www.fao.org/fishery/DirectorsMedia/en
Second Session of the Preparatory Committee on BBNJ, 2 September 2016
https://www.slideshare.net/FAOoftheUN/second-session-of-the-preparatory-committee-on-bbnj?ref=http://www.fao.org/fishery/DirectorsMedia/en
International Trade in Fish and Fish Production“Foro Económico de Pesca y Acuacultura 2015”Mexico City 26-27 November 2015
http://www.slideshare.net/FAOoftheUN/international-trade-in-fish-and-fish-production
Workshop on the Climate Change’s Impact, Boracay Islands, Philippines 9th
May 2015:
https://www.youtube.com/watch?v=OQ-fS2TZX_Y
Blue bio-economy - unlocking the potential of seas and oceans, International Conference Growth in Blue Bio-economy, FAROE ISL ANDS • 2-3 JUNE 2015
http://www.slideshare.net/rniMatthiasMathiesen/blue-bio-economy-unlocking-the-potential-of-seas-and-oceans
Outlook for Fish Trade 2030, 10th North Atlantic Seafood Conference, Bergen, 4-5 March 2015
http://www.slideshare.net/FAOoftheUN/outlook-for-fish-trade-2030-10th-north-atlantic-seafood-conference-bergen-45-march-2015?ref=http://www.fao.org/fishery/DirectorsMedia/en
Future Prospects for Fisheries and Aquaculture and their contribution to preserving food security, Lima, Peru, 24 February 2015
Future Prospects for Fisheries and Aquaculture and their contribution to preserving food security - YouTube
The Blue Economy or Economy in the Blues:
Can Africa's Seas and Oceans Trasform the Continent? Mahe, Seychelles 22-24 November 2016
https://www.slideshare.net/FAOoftheUN/africas-new-economy-intraafrican-trade-
and-the-blue-economy-as-catalysts-for-economic-transformation-64386333?ref=http://www.fao.org/fishery
/DirectorsMedia/en
Global Policy and Trade Session: Outlook
for world seafood trade 2030 prospects and challenges, 1st March 2016, Bergen, Norwayhttp://www.slideshare.net/FAOoftheUN/gl
obal-policy-and-trade-session-outlook-for-world-seafood-trade-2030-prospects-and-challenges
Combatting IUU Fishing through the
implementation of the Port State Measures Agreement and other instruments , 15th
February 2016, London, United Kingdom
http://www.slideshare.net/FAOoftheUN/combatting-iuu-fishing-through-the-implementation-of-the-port-state-measures-
agreement-and-other-instruments
Celebrating 20 Years of the Code of Conduct for Responsible Fisheries 153rd Session FAO Council , Rome, 30 November - 4 December 2015
http://www.slideshare.net/FAOoftheUN/celebrating-20-years-of-the-code-of-conduct-for-responsible-fisheries-presentation-under-fao-council-153rd-session-rome-30-november-4-december-2015
PRESENTATIONS

THANK YOU