Embed Size (px)
Citation preview


Europe, Fixed AccessEurope presents a mix of mature and emerging markets, with cultural, economic, technological, and linguistic diversities that combine to create traffic patterns that can prove to be interesting to roll-up. Regional analysis is intricate, as different applications can vary in penetration and availability depending on the country.
In Europe, Real-Time Entertainment is once again the top traffic category, responsible for 45.6% of peak downstream traffic, a figure that is up slightly over the 42.3% observed in our 2H 2014 report. Depending on the specific country however, this percentage ranges anywhere from 25% to 68% of downstream traffic. This fluctuation in share is due in large part to the availability of OTT video services in varying countries as well as the speed of service made available to subscribers. Based on our observations in this and previous reports, countries with access to paid services like Netflix or BBC iPlayer typically had a higher share of Real-Time Entertainment traffic on their network.
Figure 1 - Peak Period Aggregate Traffic Composition - Europe, Fixed Access
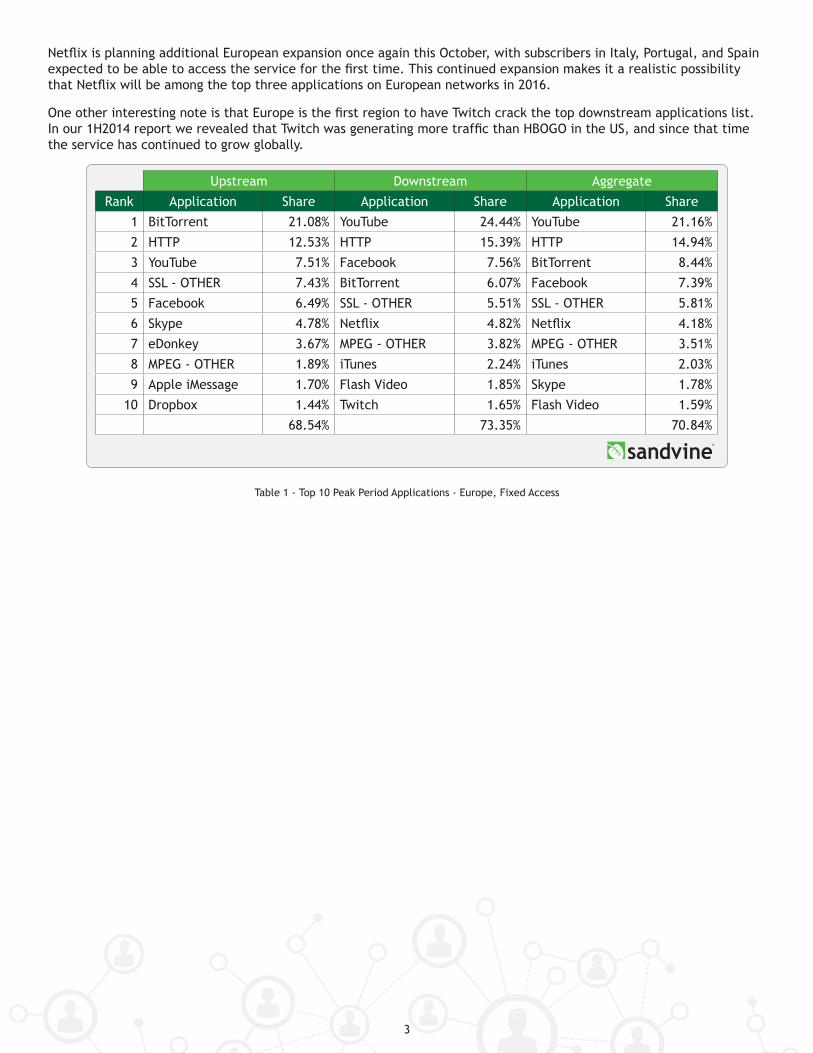
European networks have a consistent set of dominant applications and services that are available in each region, which account for 80-85% of all traffic. A set of localized websites and region-restricted applications make up the remainder of traffic. This can be seen in the list of top 10 applications for the region, all of which have global availability. One application that is noteworthy however is Netflix which accounts for 4.82% of regional peak downstream traffic, but is not yet available in all European countries.
Last fall, Netflix expanded to six new European countries, which is the reason for its increase from the previously observed 3.44% of peak downstream traffic. Netflix is able to crack the top applications list thanks to the popularity of the service in the countries where it is available. In previous reports we have discussed how Netflix accounts for over 20% of network traffic in the UK and Ireland, while in countries where it has recently launched such as Austria and France it already accounts for approximately 10% of peak downstream traffic.
3
Netflix is planning additional European expansion once again this October, with subscribers in Italy, Portugal, and Spain expected to be able to access the service for the first time. This continued expansion makes it a realistic possibility that Netflix will be among the top three applications on European networks in 2016.
One other interesting note is that Europe is the first region to have Twitch crack the top downstream applications list. In our 1H2014 report we revealed that Twitch was generating more traffic than HBOGO in the US, and since that time the service has continued to grow globally.
Upstream Downstream Aggregate
Rank Application Share Application Share Application Share
1 BitTorrent 21.08% YouTube 24.44% YouTube 21.16%
2 HTTP 12.53% HTTP 15.39% HTTP 14.94%
3 YouTube 7.51% Facebook 7.56% BitTorrent 8.44%
4 SSL - OTHER 7.43% BitTorrent 6.07% Facebook 7.39%
5 Facebook 6.49% SSL - OTHER 5.51% SSL - OTHER 5.81%
6 Skype 4.78% Netflix 4.82% Netflix 4.18%
7 eDonkey 3.67% MPEG - OTHER 3.82% MPEG - OTHER 3.51%
8 MPEG - OTHER 1.89% iTunes 2.24% iTunes 2.03%
9 Apple iMessage 1.70% Flash Video 1.85% Skype 1.78%
10 Dropbox 1.44% Twitch 1.65% Flash Video 1.59%
68.54% 73.35% 70.84%
Table 1 - Top 10 Peak Period Applications - Europe, Fixed Access

4
Europe, Mobile AccessMobile networks in Europe provides the same set of challenges for regional analysis as fixed networks due to the diversity in each country’s culture, economy, languages, and deployed network technologies.
Much like other mobile networks during peak period, Real-Time Entertainment traffic is the clear traffic category leader account for 35.9% of downstream traffic during peak period. Web Browsing and Social Networking, as seen commonly in other regions, round out the second and third-most popular traffic categories.
Figure 2 - Peak Period Aggregate Traffic Composition – Europe, Mobile Access
Skype is the application that continues to drive the majority of communications traffic, now accounting for almost half of that category’s traffic in the European region. The remaining top applications vary from country to country, but we have observed continued growth of OTT messaging applications in many European countries with WhatsApp and now Snapchat being the dominant third-party players, although none of those have cracked the top applications list like they have done in Latin America and North America.

5
Upstream Downstream Aggregate
Rank Application Share Application Share Application Share
1 Facebook 18.09% YouTube 21.41% YouTube 19.55%
2 HTTP 13.11% HTTP 19.87% HTTP 18.98%
3 SSL - OTHER 7.32% Facebook 15.62% Facebook 15.96%
4 YouTube 7.29% MPEG - OTHER 5.10% SSL - OTHER 5.28%
5 Skype 6.81% SSL - OTHER 4.97% MPEG - OTHER 4.54%
6 Google 6.24% Google 2.36% Google 2.87%
7 BitTorrent 4.67% iTunes 2.24% BitTorrent 2.14%
8 Apple iMessage 1.56% HTTP Live Streaming 1.87% iTunes 2.07%
9 Whats App 1.39% BitTorrent 1.81% Skype 1.96%
10 Instagram 1.15% Google Market 1.76% Instagram 1.51%
67.16% 75.12% 74.00%
Table 2 - Top 10 Peak Period Applications - Europe, Mobile Access
YouTube is the application that generates the most bandwidth both in peak period and the entire day. In the past 18 months, YouTube has made gains and has seen its share increase from 16.5% to 21.4% of downstream traffic in the peak evening hours. The appearance of BitTorrent on the upstream list indicates that the use of aircards or dongles can be found on in Europe, although in the past year it has declined from 3.0% to 2.2% of total traffic during peak period.

6
Sandvine in the SkiesSandvine is currently deployed in over 250 different operators, and until just a few months ago those deployments were limited to subscribers on the ground.
That all changed in early 2015 when a European mobile virtual network operator (MVNO) who provides satellite Internet services to a number of airlines selected Sandvine to help them improve passenger quality of experience.
In this deployment (shown above), Sandvine’s Policy Traffic Switch (PTS) carefully manages traffic for dozens of airlines, and thousands of planes and daily passengers. The PTS identifies traffic and provides real-time policy enforcement to prioritize applications, while also measuring subscriber quality of experience and making that information available in reports.
The PTS provides detailed measurements that let the MVNO and the airlines understand how the in-flight Internet service is used. This information can later be used to study the potential of new services and to optimize the management policies that are used to share the available bandwidth. Example reports include:
• Latency by aircraft, airline, and network-wide• Bandwidth by application for each aircraft and airline, and for the network as a whole• Policy enforcement actions triggered by set conditions
So what are the three most popular applications (by bandwidth) used by European travelers when flying? They are:
• Facebook• Web Browsing• Apple’s iMessage
Why no streaming video? Applications such as YouTube or Netflix are often blocked on flights due to their high bandwidth demands. If you had 200 people on a plane trying to stream video, there wouldn’t be enough bandwidth to go around and it wouldn’t work for anyone. Lower bandwidth applications like web browsing, Facebook, or messaging use far less bandwidth and work fine when trying to be simultaneously accessed by hundreds of users over a satellite connection.
This airplane use case is easily extended to other environments in which a large number of users are sharing a relatively limited amount of bandwidth—as an example, the same situation applies on cruise ships, but instead of a few hundred users there are several thousand!
7
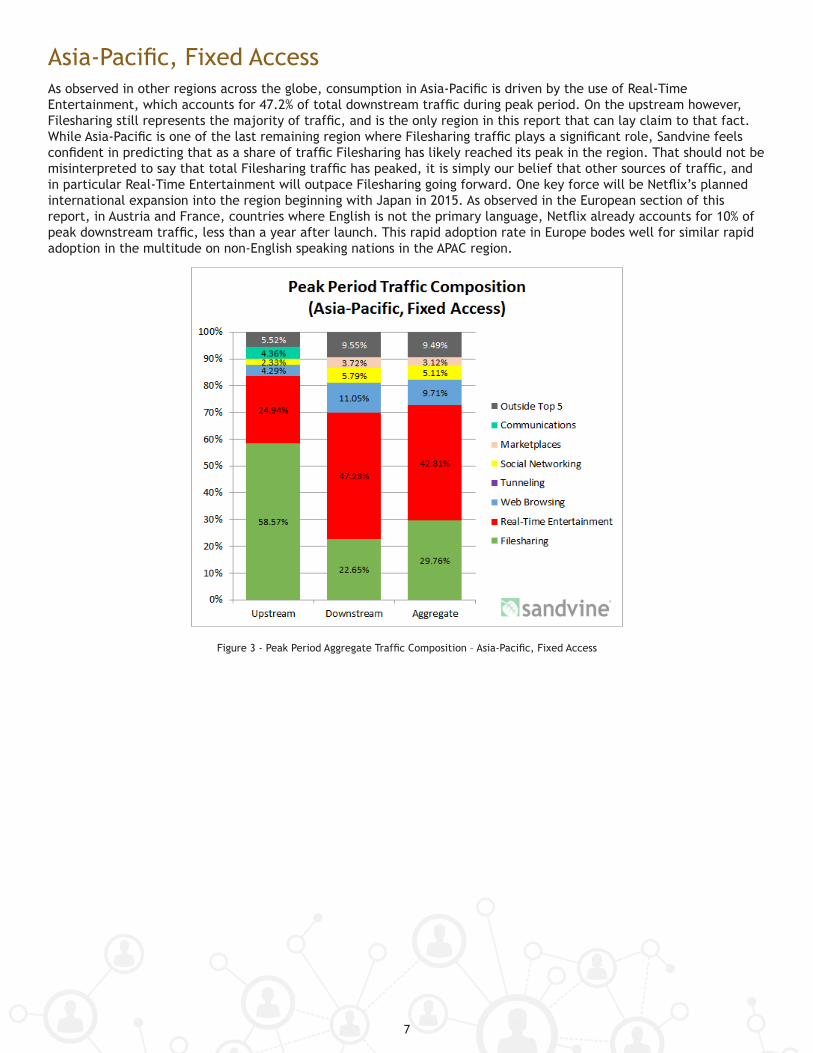
Asia-Pacific, Fixed AccessAs observed in other regions across the globe, consumption in Asia-Pacific is driven by the use of Real-Time Entertainment, which accounts for 47.2% of total downstream traffic during peak period. On the upstream however, Filesharing still represents the majority of traffic, and is the only region in this report that can lay claim to that fact. While Asia-Pacific is one of the last remaining region where Filesharing traffic plays a significant role, Sandvine feels confident in predicting that as a share of traffic Filesharing has likely reached its peak in the region. That should not be misinterpreted to say that total Filesharing traffic has peaked, it is simply our belief that other sources of traffic, and in particular Real-Time Entertainment will outpace Filesharing going forward. One key force will be Netflix’s planned international expansion into the region beginning with Japan in 2015. As observed in the European section of this report, in Austria and France, countries where English is not the primary language, Netflix already accounts for 10% of peak downstream traffic, less than a year after launch. This rapid adoption rate in Europe bodes well for similar rapid adoption in the multitude on non-English speaking nations in the APAC region.
Figure 3 - Peak Period Aggregate Traffic Composition – Asia-Pacific, Fixed Access

8
As covered in previous reports, a unique characteristic of the Asia-Pacific region is the popularity of peercasting applications, particularly QVoD and PPStream. These applications allow users to stream live events while simultaneously helping to distribute the stream to other viewers, which drives large volumes of upstream traffic
YouTube gained significant share over our last report, and reclaimed its spot as the top application. Much like Europe, our Asia-Pacific dataset is made up of multiple countries with diverse cultural differences. This makes it easier for applications which are available globally to rise to the top of our lists compared to regional video services.
Valve’s Steam Service is also found among the top downstream apps, accounting for 1.16% of downstream traffic, marking its first appearance in our charts from any region. For those unfamiliar with the service, Steam is a digital marketplace that allows PC gamers to download the latest games. More details on the service can be found in the “Steam Gaining Steam” section of this report.
Upstream Downstream Aggregate
Rank Application Share Application Share Application Share
1 BitTorrent 48.22% YouTube 29.31% BitTorrent 24.95%
2 QVoD 8.89% BitTorrent 19.20% YouTube 24.64%
3 Thunder 3.91% HTTP 9.65% HTTP 8.39%
4 HTTP 3.29% Facebook 3.65% Facebook 3.27%
5 Skype 2.10% MPEG - OTHER 3.11% Thunder 2.32%
6 Facebook 1.71% Thunder 1.93% QVoD 2.31%
7 SSL - OTHER 1.21% SSL - OTHER 1.66% SSL - OTHER 1.57%
8 PPStream 0.81% Flash Video 1.21% iTunes 1.26%
9 Dropbox 0.70% Valve’s Steam Service 1.16% Skype 1.12%
10 Apple iMessage 0.57% Dailymotion 0.88% Flash Video 1.09%
71.41% 71.76% 70.92%
Table 3 - Top 10 Peak Period Applications – Asia-Pacific, Fixed Access
9
Steam Gaining SteamIn our North American and Latin American report issued earlier this year, Sandvine examined how a Call of Duty DLC release caused XBOX traffic to spike to 12% of traffic on the day of its release. But what about PC Gamers?
There are many avenues for PC gamers to download titles, but based on our observations from numerous global networks Valve’s Steam store is the unquestioned leader in user base and traffic share.
On many networks around the globe, Steam accounts for 1-3% of downstream traffic in the peak evening hours. The exception to those figures comes either when an anticipated game is released (Grand Theft Auto V) or the two times a year (typically winter and summer) when Steam launches one of their highly anticipated Steam sales.
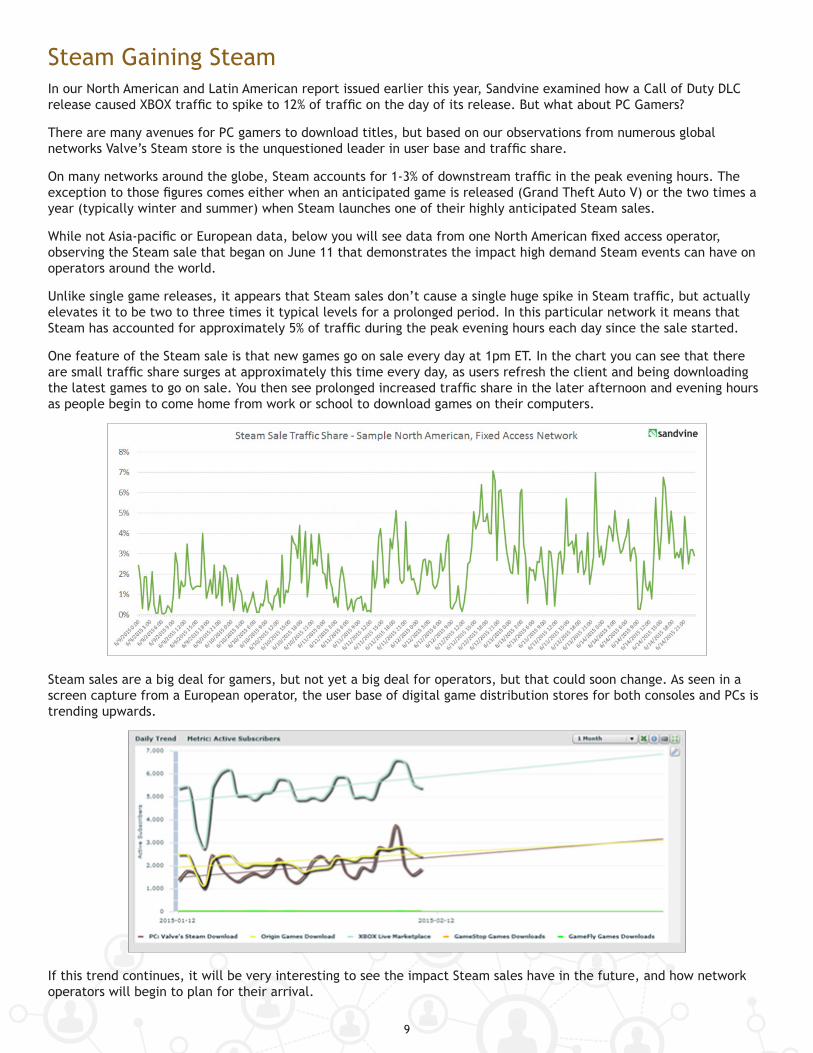
While not Asia-pacific or European data, below you will see data from one North American fixed access operator, observing the Steam sale that began on June 11 that demonstrates the impact high demand Steam events can have on operators around the world.
Unlike single game releases, it appears that Steam sales don’t cause a single huge spike in Steam traffic, but actually elevates it to be two to three times it typical levels for a prolonged period. In this particular network it means that Steam has accounted for approximately 5% of traffic during the peak evening hours each day since the sale started.
One feature of the Steam sale is that new games go on sale every day at 1pm ET. In the chart you can see that there are small traffic share surges at approximately this time every day, as users refresh the client and being downloading the latest games to go on sale. You then see prolonged increased traffic share in the later afternoon and evening hours as people begin to come home from work or school to download games on their computers.
Steam sales are a big deal for gamers, but not yet a big deal for operators, but that could soon change. As seen in a screen capture from a European operator, the user base of digital game distribution stores for both consoles and PCs is trending upwards.
If this trend continues, it will be very interesting to see the impact Steam sales have in the future, and how network operators will begin to plan for their arrival.

10
Asia-Pacific, Mobile AccessOther than the appearance of multiple applications accounting for the high Real-Time Entertainment share, Asia- Pacific’s traffic is for the most part similar in composition to that of leading networks in Europe. The one potential difference is the popularity of marketplaces in the region which accounts for 5% of downstream traffic. When combining the traffic share of iTunes and Google Play, with monthly usage that exceeds on average 1GB per month, subscribers in Asia-Pacific are the highest consumers of app and game downloads in the world.
Figure 4 - Peak Period Aggregate Traffic Composition – Asia-Pacific, Mobile Access
One other area of traffic that is continuing to gain traction in the region, especially in Australia and New Zealand is streaming music. Spotify (0.6% of peak downstream) had held a leadership position in these two countries, but was recently surpassed by the newly launched Apple Music (0.8% of peak downstream). It should be noted that at the time of data collection, Apple Music was offering a three month free trial to subscribers, while Spotify only offers a reduced featureset to subscribers for free. Once the free trial offered by Apple begins to expire for many subscribers at the end of August, it will be very interesting to revisit the data to see if Apple is able to maintain first place as subscribers must decide if they want to pay for the service.
Upstream Downstream Aggregate
Rank Upstream Share Downstream Share Aggregate Share
1 HTTP 13.42% YouTube 17.58% YouTube 16.55%
2 Facebook 8.57% HTTP 16.18% HTTP 15.87%
3 YouTube 8.54% Facebook 7.74% Facebook 7.84%
4 SSL - OTHER 7.08% MPEG - OTHER 5.98% MPEG - OTHER 5.51%
5 Google 4.31% SSL - OTHER 4.80% SSL - OTHER 5.05%
6 BitTorrent 3.83% Dailymotion 2.61% Dailymotion 2.46%
7 KakaoTalk 3.83% Google Market 2.24% Google Market 2.07%
8 Skype 2.00% Instagram 2.06% Instagram 1.96%
9 Dailymotion 1.83% iTunes 1.89% iTunes 1.80%
10 Instagram 1.71% HTTP Live Streaming 1.71% BitTorrent 1.56%
55.12% 62.79% 60.65%
Table 4 - Top 10 Peak Period Applications – Asia-Pacific, Mobile Access

11
Explanation of Traffic CategoriesThe table below describes each of the traffic categories used in the Global Internet Phenomena Report.
Traffic Category Description Examples
Storage Large data transfers using the File Transfer Protocol or its derivatives. Services that provide file-hosting, network back-up, and one-click downloads
FTP, Rapidshare, Mozy, zShare, Carbonite, Dropbox
Gaming Console and PC gaming, console download traffic, game updates
Nintendo Wii, Xbox Live, Playstation 2, Playstation 3, PC games
Marketplaces Marketplaces where subscribers can purchase and download media including applications, music, movies, books, and software updates
Google Android Marketplace, Apple iTunes, Windows Update
Administration Applications and services used to administer the network
DNS, ICMP, NTP, SNMP
Filesharing Filesharing applications that use a peer-to- peer or Newsgroups as a distribution models
BitTorrent, eDonkey, Gnutella, Ares, Newsgroups
Communications Applications, services and protocols that allow email, chat, voice, and video communications; information sharing (photos, status, etc) between users
Skype, WhatsApp, iMessage, FaceTime
Real-Time
Entertainment
Applications and protocols that allow “on- demand” entertainment that is consumed (viewed or heard) as it arrives
Streamed or buffered audio and video (RTSP, RTP, RTMP, Flash, MPEG - OTHER), peercasting (PPStream, Octoshape), specific streaming sites and services (Netflix, Hulu, YouTube, Spotify,)
Social Networking Websites and services focused on enabling interaction (chat, communication) and information sharing (photos, status, etc) between users
Facebook, Twitter, Linkedin, Instagram
Tunneling Protocols and services that allow remote access to network resources or mask application identity.
Remote Desktop, VNC, PC Anywhere, SSL - OTHER, SSH,
Web Browsing Web protocols and specific websites HTTP, WAP browsing

Headquarters Sandvine Incorporated ULCWaterloo, Ontario Canada Phone: +1 519 880 2600 Email: [email protected]
European Offices Sandvine LimitedSwindon, UK Phone: +44 (0) 1256 698021 Email: [email protected]
Copyright ©2015 Sandvine Incorporated ULC. Sandvine and the Sandvine logo are registered trademarks of Sandvine Incorporated ULC. All rights reserved.
Revision: 2015-09-16
www.sandvine.comTo learn more about the latest Internet trends: www.internetphenomena.com
Study DetailsSandvine’s Global Internet Phenomena Reports examine a representative cross-section of the world’s leading fixed and mobile communications service providers (CSPs) and are made possible by the voluntary participation of our customers. Collectively, Sandvine’s customers provide Internet and data service to hundreds of millions of subscribers worldwide.
The data gathered for these reports was collected in July 2015 and is completely subscriber-anonymous. No information regarding specific content or personally-identifiable information (including, but not limited to, IP or MAC addresses and subscriber IDs) was collected during this study.
This study reflects the traffic profiles of real service providers, including the impact of any network management (for instance, congestion management and traffic optimization) policies that may be in place.
The data collected includes the bandwidth per second per protocol and the number of active hosts per protocol on the network at each hour. Data also includes the total transmitted (upstream) and received (downstream) bytes, from the subscriber’s perspective, attributable to each subscriber for a period of 30 days.
The datasets were used to create a 24-hour profile of each network, normalized by the number of active subscribers at each hour in the day. These profiles were then aggregated hierarchically for each region with weightings based on subscriber counts and access technology market share.
In parts of the report we reference industry publications, analyst studies, media articles and other sources. As such, we are indebted to the collective work and wisdom of a large number of individuals and organizations and have endeavored to correctly cite all sources and to identify the original creator of referenced material.
Working With SandvineAre you a leading content provider who would like to work with Sandvine to ensure your applications are recognized by fixed and mobile operators around the world? We’d love to hear from you. Contacts us: [email protected]