Embed Size (px)
Citation preview

EUROCONTROL
EUROCONTROLShort-Term Forecast
May 2010
Flight Movements 2010-2011

V1.0 Page: 3
EUROCONTROL/STATFOR/Doc398 v1.0 31/5/10
EUROCONTROL Short-Term Forecast, May 2010. IFR Flight Movements 2010-2011.
Summary: Growth, Ash and Sovereign Debt: a fragile recovery. The April-May volcanic ash reduced growth of European flights in 2010 by about 1 percentage point. However, before the ash arrived, traffic was growing slightly ahead of the forecast, so this May update to the short-term forecast is quite similar to the forecast published in February: about 0.8% growth for 2010 the most likely point, within a ±2% range. For 2011, most States see small upward revisions, largely in a bounce-back from the April 2010 lost flights. This forecast has been adjusted downwards for the ash in May, but assumes no further significant eruption. A future eruption of the same scale would have a smaller effect on flights, as the rules for flying in ash have been adapted with recent experience. A what-if scenario, adding 4 months of further eruption at less than the scale seen in May, showed for most States effects that lay within the low-to-base range of the forecast: only Ireland and Iceland were more significantly affected (by 2-3 percentage points for 2010 as a whole). Though the spotlight remains on downside risks (ash, oil prices, and an economic recovery threatened by doubts about Sovereign debt) there remain upside risks, in particular the high load factors and the low baseline from which traffic is growing. An upward revision later in the year therefore remains a possibility. The forecast will next be updated in September 2010, together with the medium-term forecast.
Figure 1. Growth of IFR movements in 2010 (Uncertainty is typically ± 2.4 percentage points.)

EUROCONTROL Short-Term Forecast, May 2010. IFR Flight Movements 2010-2011. EUROCONTROL/STATFOR/Doc398
V1.0
Page: 4
1. INTRODUCTION The Statistics and Forecast Service (STATFOR) of EUROCONTROL produces a short-term (two years) forecast of IFR flights in Europe. This is published four times per year: independently in May and December, and as an integral part of the medium-term forecast in February and September. This issue of the short-term forecast was prepared in parallel with the forecast of service units that STATFOR produces for the Central Route Charges Office of EUROCONTROL1.
This update of the flight forecast uses the improved method that was first put into operation in February 2009 and enhanced in February 2010. This method is outlined in Annex C. The main improvements are:
• The short-term forecast is now network-based, ie it forecasts zone-to-zone traffic flows for some 8,000 zone-pairs rather than forecasting each State independently as in the old method.
• The February and September short-term forecasts are aligned with the medium-term forecast for the first two years at this zone-to-zone level of detail: they are short- or medium-term views of the same data.
• That alignment means that increasingly in the later months of the short-term forecast, economic factors influence the growth forecast.
• The short-term forecast incorporates future schedule data.
Reporting of the forecast for this summary report remains focused on the main flows for each State, and for the EUROCONTROL Statistical Reference Area (ESRA08). The ESRA082 represents the whole of Europe. It is a large, stable subset of the Member States used for comparison purposes since 2009.
In the remainder of this document:
• Section 2 looks at what has changed since the last forecast, and what this says about trends in growth.
• Section 3 summarizes the forecast for 2010.
• Section 4 outlines the forecast for 2011.
The next short-term forecast will be published at the end of September 2010 as part of the medium-term forecast.
1 1 EUROCONTROL Forecast of Service Units: May 2010 Update, EUROCONTROL STATFOR, May 2010 2 See www.eurocontrol.int/statfor/faq for map of ESRA08.

EUROCONTROL Short-Term Forecast, May 2010. IFR Flight Movements 2010-2011. EUROCONTROL/STATFOR/Doc398
V1.0
Page: 5
2. RECENT TRAFFIC TRENDS The ash-cloud is estimated to have resulted in just over 100,000 fewer flights in April than would otherwise have been seen3. The effects in May are not fully clear yet, but are expected to be much smaller: closer to 6,000 flights. These two events will reduce growth in 2010 (by around 1% point) and then lead to apparently stronger growth in 2011.
Ash-cloud aside, for Europe as a whole traffic has been slightly stronger than the central forecast that was published in February (Figure 2). This was in spite of some strikes and the continuation of poor weather conditions from December-January into February. The number of holidays and the moving of Easter always makes identifying the underlying trend difficult at this time of year, but the relatively-strong flight counts have been backed up by continuing strong load factors (AEA, Figure 3) and passenger numbers (eg from ACI-Europe and IATA, not shown here).
Figure 2. Ash-cloud aside, recent traffic has been ahead of the forecast published in February.
Figure 3. Load factors have remained strong, except during the ash crisis. (Source: AEA)
3 Ash-cloud impact report, in preparation.
Actual April 2010
Amended April 2010
x

EUROCONTROL Short-Term Forecast, May 2010. IFR Flight Movements 2010-2011. EUROCONTROL/STATFOR/Doc398
V1.0
Page: 6
As was true before the 2008 traffic down-turn, the low-cost and business aviation segments of the market have been contributing to the renewed growth. In May these are joined by the ‘charter’ segment (Figure 4). Even the recently-weaker all-cargo and traditional-scheduled carriers are now fluctuating at around the traffic volumes of 2009 (ie 0% growth).
Figure 4. Growth per market segment in recent weeks.
Figure 5 shows that the five busiest States all saw significant reductions in traffic in the previous three months (February to April). The main contributor to this decline was the ash-cloud, which is why Ireland and the UK are prominent in Figure 5, in particular with Ireland having the largest percentage decrease over the period. On the other hand, there are some States which continued to see growth in flights: only a limited number have seen much growth in origin-destination traffic (see Figure 6), but others have seen increases in overflights.
Figure 5. The five busiest States all contributed to a decline in traffic on the European network in Feb-Apr 2010 period.

EUROCONTROL Short-Term Forecast, May 2010. IFR Flight Movements 2010-2011. EUROCONTROL/STATFOR/Doc398
V1.0
Page: 7
Figure 6. Only one State contributed much in the way of new flights to the European network in Feb-Apr 2010 period.
Figure 7 shows traffic growth to the top 6 destinations outside Europe. In January-March, five of them were back in growth, the USA being the exception. Alone of the six destinations, Morocco increased its growth during the ash crisis (in terms of additional flights compared to 12 months before).
Figure 7. Main changes in flows from outside Europe: In the first quarter of 2010, 5 were growing.

EUROCONTROL Short-Term Forecast, May 2010. IFR Flight Movements 2010-2011. EUROCONTROL/STATFOR/Doc398
V1.0
Page: 8
Turning to some of the underlying factors, since January 2009, oil and fuel costs have been steadily increasing (Figure 8). The ‘crack spread’ difference between oil and kerosene prices is at a long-term low, meaning that the price of jet fuel has not climbed as quickly as that of crude – and adds upside risks to the jet fuel price. Meanwhile, Brent Crude in May has reached as high a price as seen in all but 4 months of the 2008 oil-price peak. In fact, oil prices have fallen back in the last few days, but the euro continues to weaken which – fuel and currency hedging aside – adds to the costs of European aircraft operators.
Eurostat ticket price data (Figure 9) show that average ticket prices in April are 1.8% below those of 12 months ago. This is mainly due to Easter effect, which lifted prices in March since the Easter holiday period in some States began in March this year, but not last year. On average, March and April prices together are little changed in real terms.

EUROCONTROL Short-Term Forecast, May 2010. IFR Flight Movements 2010-2011. EUROCONTROL/STATFOR/Doc398
V1.0
Page: 9
Figure 8. Oil prices are still climbing (Source: EIA).
Figure 9. Real ticket prices in EU have decreased by 1.8% in April 2010 because of Easter effect. (Source: Eurostat)

EUROCONTROL Short-Term Forecast, May 2010. IFR Flight Movements 2010-2011. EUROCONTROL/STATFOR/Doc398
V1.0
Page: 10
3. THE FORECAST FOR 2010 The previous section described the poor weather, strikes and volcanic ash which have distorted the traffic patterns of the beginning of the year. For the rest of 2010, the uncertainty of strikes and volcanic ash both continue, although the Eyjafjallajökull volcano appears to have quietened down for the moment4. At the same time, the economic outlook has also become more uncertain – in particular the downside risks have grown significantly as the spotlight has fallen on levels of government debt. Reduced government spending in several States around Europe is likely to slow economic growth and, of more direct impact, reduce disposable income.
May 2010 is the first month of the forecast. At the time of writing, May had already seen enough disruption from volcanic ash to knock perhaps 1% off the month’s traffic (where the April effect was 1% off the entire year). In addition there was a general strike in Greece on the 5th May. The forecast for the month of May 2010 has been adjusted for these effects to the extent that they can be estimated from the available data.
For the forecast shown in Figure 1 and elsewhere in this report, we have assumed that the volcano has no further significant effect on the number of flights, beyond May. There is a discussion of a what-if? scenario that tests this assumption at the end of this section.
The net effect of the relatively strong growth trend (ash-cloud aside) and the ash is for a forecast for 2010 which is, at the European level, little changed from the February publication. The number of flights in European region in 2010 is likely to end around 0.8% above 2009. Figure 10 compares the range of the new forecast with the actual traffic in 2008 and 2009.
Figure 10. Traffic growth in the ESRA08. (For all States, see Annex A.)
Details per state and region are provided in Annex B as well as in the map in Figure 1.
Figure 11 compares the new short-term forecast for 2010 as a whole with the one published in February 2010. The numbers on the chart highlight the differences between the new forecast and the one made in February 2010, in terms of percentage point change in growth of IFR movements in 2010. So for example, the forecast for Albania total flights has changed by between 2 and 4 percentage points, but this was within the forecast range, so the circle is grey.
The main changes in traffic have affected the following States:
• The decrease of traffic growth in Iceland was mainly due to volcano ash impact;
• Russian flows to Ukraine and domestic growth have boosted the traffic growth in Ukraine;
• Adriatic Eastern coast, where traffic growth was mainly increased by the flows to and from Turkey ;
4 Icelandic Met Office, http://en.vedur.is/earthquakes-and-volcanism/articles/nr/1884
Actual traffic in 2008
Forecast traffic range in 2010
(Forecasted May 2010)
Actual traffic in 2009
Actual traffic in 2010

EUROCONTROL Short-Term Forecast, May 2010. IFR Flight Movements 2010-2011. EUROCONTROL/STATFOR/Doc398
V1.0
Page: 11
• FYROM, where traffic growth has been strongly affected by the rerouting to Greece.
Figure 11. Difference between the new forecast and the previous Short-Term Forecast, in terms of total growth in 2010.5
What-If Scenario: The regulatory authorities have adapted the no-fly rules several times since April, so even an eruption on the scale of that seen in April will have a smaller effect on traffic in future. The eruption in May was felt mainly, but not exclusively, along the Atlantic coast of Europe; and the same regions will of course be first in line for any future eruption because of their proximity to Iceland and the prevailing weather patterns.
To test the sensitivity of the forecast to a further eruption, we considered disruption of half that seen in May (in percentage terms) but continued from July through to October. For 2010 the effects were for most States within the low-to-base forecast range, even for the UK, with reductions of less than 0.5% (points) in growth for 2010. However, Ireland and Iceland both saw more significant effects, namely 2-3% point lower growth in 2010.
5 Note that because internal flows are often small, percentage changes can be large, which is why many of the largest circles are
in the ‘internal’ column.
EUROCONTROL Short-Term Forecast, May 2010. IFR Flight Movements 2010-2011. EUROCONTROL/STATFOR/Doc398
V1.0
Page: 12
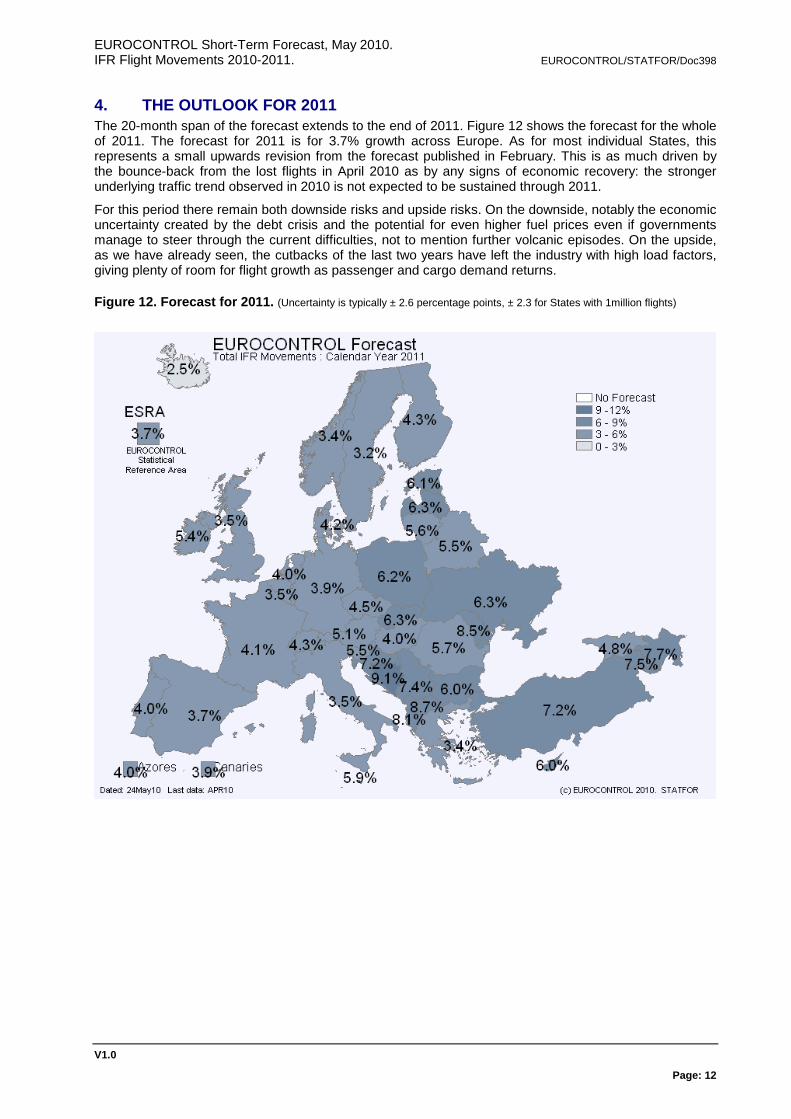
4. THE OUTLOOK FOR 2011 The 20-month span of the forecast extends to the end of 2011. Figure 12 shows the forecast for the whole of 2011. The forecast for 2011 is for 3.7% growth across Europe. As for most individual States, this represents a small upwards revision from the forecast published in February. This is as much driven by the bounce-back from the lost flights in April 2010 as by any signs of economic recovery: the stronger underlying traffic trend observed in 2010 is not expected to be sustained through 2011.
For this period there remain both downside risks and upside risks. On the downside, notably the economic uncertainty created by the debt crisis and the potential for even higher fuel prices even if governments manage to steer through the current difficulties, not to mention further volcanic episodes. On the upside, as we have already seen, the cutbacks of the last two years have left the industry with high load factors, giving plenty of room for flight growth as passenger and cargo demand returns.
Figure 12. Forecast for 2011. (Uncertainty is typically ± 2.6 percentage points, ± 2.3 for States with 1million flights)

EUROCONTROL Short-Term Forecast, May 2010. IFR Flight Movements 2010-2011. EUROCONTROL/STATFOR/Doc398
V1.0
Page: 13
A. ACTUAL GROWTH SINCE PREVIOUS FORECAST Table 1 shows actual growth in IFR movements in each State or region in Feb-Apr 2010 period, compared to the same period 12 months before. For reference, the forecast range is shown from the previous short-term forecast, published in February 2010. Note that, from the February 2010 forecast, the mid range (25th-75th percentile) of the short-term forecast are aligned with the low-high scenarios in the medium-term forecast.
Table 1. Actual growth per State, Feb-Apr 2010 vs. Feb-Apr 2009, with details of the previous forecast range.
Forecast
State Actual Growth Low High
Albania 16.2% 4.4% 8.7%
Armenia 7.8% 9.7% 11.9%
Austria -1.5% -1.1% 3.9%
Azerbaijan 7.9% 9.4% 15.1%
Belarus 0.8% -0.6% 5.0%
Belgium/Luxembourg -4.1% -1.4% 3.9%
Bosnia & Herzegovina 6.8% 4.2% 10.1%
Bulgaria 1.6% 0.6% 6.5%
Canarias 0.9% 0.5% 5.8%
Croatia 4.7% 2.3% 7.5%
Cyprus 7.0% 2.4% 7.4%
Czech Republic -3.8% -0.4% 4.7%
Denmark -3.2% -1.1% 3.6%
ESRA -3.4% -1.5% 3.4%
Estonia -2.5% -1.5% 3.7%
FYROM -3.8% 26.1% 33.2%
Finland -8.9% -5.0% -0.3%
France -4.8% -4.0% 1.7%
Georgia 14.3% 7.6% 14.8%
Germany -4.1% -1.1% 4.6%
Greece 3.5% 1.9% 7.4%
Hungary -1.2% 0.3% 6.9%
Iceland -15.0% -3.8% 0.1%
Ireland -10.6% -7.1% -2.6%
Italy 0.0% 0.2% 4.8%
Latvia -1.1% 0.2% 6.3%
Lisbon FIR 3.3% 0.7% 6.0%
Lithuania 2.0% 1.4% 5.3%
Malta 8.7% 3.0% 9.9%
Moldova 14.8% 5.2% 14.8%
Netherlands -5.2% -3.2% 1.8%
Norway -3.6% -0.6% 3.2%
Poland -1.5% -1.2% 1.1%
Romania 2.9% 2.3% 7.8%
S. Maria FIR 3.8% 1.7% 8.2%
Serbia & Montenegro 3.0% -1.1% 4.8%
Slovakia 5.5% 4.6% 10.8%
Slovenia 1.2% 0.6% 5.9%
Spain -2.1% -2.8% 2.7%
Sweden -6.4% -3.3% 0.2%
Switzerland -3.5% -2.6% 2.7%
Turkey 12.9% 7.8% 12.5%
UK -9.8% -4.3% 0.0%
Ukraine 6.2% 1.6% 8.2%

EUROCONTROL Short-Term Forecast, May 2010. IFR Flight Movements 2010-2011. EUROCONTROL/STATFOR/Doc398
V1.0
Page: 14
B. FORECAST FOR 2010 AND 2011 Note that, from the February 2010 forecast, the mid range (25th-75th percentile) of the short-term forecast are aligned with the low-high scenarios in the medium-term forecast, and growth in 2011 is calculated with reference to the same scenario in 2010, not the baseline in 2010.
Table 2. Summary of forecast total IFR flight growth per traffic zone.
2006 2007 2008 2009 2010 2011 Ave. 2011/ 2009
H . . . . 14% 10% 12.2%
B 2.7% 19% 4.5% 8.9% 11% 8.1% 9.6%
Albania
L . . . . 8.4% 5.2% 6.8%
H . . . . 6.7% 10% 8.5%
B 2.6% 11% 8.0% -6.7% 4.1% 7.5% 5.8%
Armenia
L . . . . 1.6% 4.3% 2.9%
H . . . . 5.2% 7.0% 6.1%
B 4.1% 8.1% 2.0% -7.6% 2.9% 5.1% 4.0%
Austria
L . . . . 0.5% 2.3% 1.4%
H . . . . 9.3% 11% 10.0%
B . 4.3% 13% 0.5% 6.8% 7.7% 7.3%
Azerbaijan
L . . . . 4.6% 5.1% 4.9%
H . . . . 6.9% 7.9% 7.4%
B 13% 18% 16% -8.6% 4.5% 5.5% 5.0%
Belarus
L . . . . 1.8% 2.7% 2.3%
H . . . . 2.2% 5.4% 3.8%
B 4.9% 4.2% 0.7% -7.9% -0.1% 3.5% 1.7%
Belgium/Luxembourg
L . . . . -2.2% 0.9% -0.7%
H . . . . 10% 12% 10.8%
B 5.5% 19% 8.5% 3.1% 7.1% 9.1% 8.1%
Bosnia-Herzegovina
L . . . . 4.4% 6.0% 5.2%
H . . . . 7.8% 8.4% 8.1%
B 1.6% 11% 7.7% -0.2% 5.3% 6.0% 5.6%
Bulgaria
L . . . . 2.4% 2.7% 2.6%
H . . . . 6.4% 5.8% 6.1%
B 4.0% 1.7% -0.2% ( 13%) 4.3% 3.9% 4.1%
Canary Islands
L . . . . 2.1% 0.7% 1.4%
H . . . . 9.2% 9.5% 9.3%
B 2.4% 17% 6.0% 0.1% 6.4% 7.2% 6.8%
Croatia
L . . . . 3.7% 4.2% 4.0%
H . . . . 9.3% 8.1% 8.7%
B 4.1% 12% 12% -1.7% 6.9% 6.0% 6.5%
Cyprus
L . . . . 4.5% 3.4% 3.9%
H . . . . 5.0% 6.4% 5.7%
B 2.4% 5.6% 5.5% -5.0% 2.7% 4.5% 3.6%
Czech Republic
L . . . . 0.3% 1.9% 1.1%
H . . . . 5.3% 5.9% 5.6%
B 2.9% 4.8% -0.3% -8.5% 3.2% 4.2% 3.7%
Denmark
L . . . . 1.0% 1.6% 1.3%
H . . . . 6.5% 14% 10.2%
B -5.7% 12% 13% ( 12%) 3.2% 6.1% 4.6%
Estonia
L . . . . 0.3% 3.0% 1.7%

EUROCONTROL Short-Term Forecast, May 2010. IFR Flight Movements 2010-2011. EUROCONTROL/STATFOR/Doc398
V1.0
Page: 15
2006 2007 2008 2009 2010 2011 Ave. 2011/ 2009
H . . . . 4.9% 11% 8.1%
B 6.8% 3.9% 2.0% -0.1% 1.6% 8.7% 5.1%
FYROM
L . . . . -1.4% 5.6% 2.0%
H . . . . 1.9% 9.8% 5.7%
B 1.4% -0.3% 6.3% -7.7% -0.5% 4.3% 1.9%
Finland
L . . . . -2.7% 1.9% -0.4%
H . . . . 1.6% 6.1% 3.8%
B 3.9% 6.0% -0.2% -7.3% -0.6% 4.1% 1.7%
France
L . . . . -2.7% 1.3% -0.7%
H . . . . 9.4% 8.3% 8.8%
B -1.2% 9.7% -0.0% -3.6% 6.6% 4.8% 5.7%
Georgia
L . . . . 4.0% 1.7% 2.8%
H . . . . 2.7% 5.8% 4.2%
B 4.2% 4.6% 1.4% -7.0% 0.3% 3.9% 2.1%
Germany
L . . . . -2.0% 1.1% -0.4%
H . . . . 5.1% 5.8% 5.4%
B 3.2% 9.9% 3.4% -0.8% 2.7% 3.4% 3.1%
Greece
L . . . . 0.4% 0.7% 0.6%
H . . . . 5.3% 6.2% 5.8%
B 4.4% 1.8% 1.1% -2.3% 2.7% 4.0% 3.3%
Hungary
L . . . . -0.0% 0.9% 0.4%
H . . . . -8.7% 4.7% -2.2%
B 4.1% 5.7% 4.2% -7.8% ( 11%) 2.5% -4.5%
Iceland
L . . . . ( 13%) -0.4% -7.0%
H . . . . -0.9% 7.3% 3.1%
B 5.4% 5.9% 0.5% ( 12%) -2.8% 5.4% 1.2%
Ireland
L . . . . -4.6% 2.7% -1.0%
H . . . . 4.2% 5.8% 5.0%
B 4.0% 8.4% -2.4% -5.1% 2.2% 3.5% 2.8%
Italy
L . . . . 0.4% 0.7% 0.6%
H . . . . 5.4% 8.9% 7.1%
B 13% 15% 11% -8.4% 2.7% 6.3% 4.5%
Latvia
L . . . . 0.0% 3.6% 1.8%
H . . . . 7.1% 5.6% 6.3%
B 5.7% 6.3% 2.7% -7.2% 4.9% 4.0% 4.5%
Lisbon FIR
L . . . . 2.7% 1.3% 2.0%
H . . . . 8.0% 8.2% 8.1%
B 6.0% 13% 12% ( 12%) 5.1% 5.6% 5.4%
Lithuania
L . . . . 2.2% 2.7% 2.5%
H . . . . 8.6% 7.9% 8.2%
B 0.2% 8.1% 3.4% 0.7% 6.0% 5.9% 5.9%
Malta
L . . . . 3.5% 3.3% 3.4%
H . . . . 13% 12% 12.0%
B 7.8% 25% 18% 6.7% 9.6% 8.5% 9.1%
Moldova
L . . . . 6.4% 5.4% 5.9%
H . . . . 2.7% 5.7% 4.2%
B 6.0% 4.9% -1.6% -8.6% 0.6% 4.0% 2.3%
Netherlands
L . . . . -1.3% 1.7% 0.2%

EUROCONTROL Short-Term Forecast, May 2010. IFR Flight Movements 2010-2011. EUROCONTROL/STATFOR/Doc398
V1.0
Page: 16
2006 2007 2008 2009 2010 2011 Ave. 2011/ 2009
H . . . . 3.4% 5.1% 4.2%
B 6.1% 4.5% 2.6% -4.4% 1.9% 3.4% 2.6%
Norway
L . . . . 0.4% 1.5% 0.9%
H . . . . 8.1% 8.4% 8.3%
B 16% 13% 10% -7.6% 5.7% 6.2% 6.0%
Poland
L . . . . 3.5% 3.8% 3.6%
H . . . . 7.9% 8.2% 8.0%
B 1.3% 4.0% 2.7% -2.3% 5.3% 5.7% 5.5%
Romania
L . . . . 2.7% 2.8% 2.7%
H . . . . 6.0% 5.9% 6.0%
B 0.9% 1.7% 6.5% -2.6% 3.5% 4.0% 3.8%
Santa Maria FIR
L . . . . 1.2% 1.6% 1.4%
H . . . . 8.9% 9.5% 9.2%
B 8.7% 16% 8.6% 3.3% 6.2% 7.4% 6.8%
Serbia&Montenegro
L . . . . 3.5% 4.3% 3.9%
H . . . . 8.3% 8.8% 8.5%
B 3.8% -1.6% 6.4% -2.4% 5.5% 6.3% 5.9%
Slovakia
L . . . . 2.6% 3.3% 3.0%
H . . . . 6.8% 7.7% 7.3%
B 3.7% 15% 6.8% -4.2% 4.1% 5.5% 4.8%
Slovenia
L . . . . 1.3% 2.3% 1.8%
H . . . . 2.8% 6.0% 4.4%
B 5.1% 8.4% -1.8% -9.5% 0.6% 3.7% 2.1%
Spain
L . . . . -1.7% 0.4% -0.6%
H . . . . 1.6% 5.2% 3.4%
B 3.8% 2.8% 3.9% ( 11%) -0.3% 3.2% 1.4%
Sweden
L . . . . -2.1% 1.1% -0.5%
H . . . . 3.9% 6.2% 5.0%
B 2.4% 5.9% 0.3% -7.1% 1.6% 4.3% 3.0%
Switzerland
L . . . . -0.7% 1.6% 0.4%
H . . . . 11% 8.8% 9.8%
B 8.0% 9.2% 8.6% 4.2% 8.8% 7.2% 8.0%
Turkey
L . . . . 6.5% 4.4% 5.4%
H . . . . 10% 8.8% 9.5%
B 1.3% 8.2% 8.7% -6.9% 7.9% 6.3% 7.1%
Ukraine
L . . . . 5.3% 3.4% 4.4%
H . . . . -1.2% 5.1% 1.9%
B 3.4% 3.5% -1.4% -9.4% -2.9% 3.5% 0.2%
UK
L . . . . -4.7% 1.1% -1.8%
H . . . . 2.6% 5.6% 4.1%
B 3.9% 5.1% 0.4% -6.6% 0.6% 3.7% 2.1%
ESRA02
L . . . . -1.3% 1.1% -0.1%
H . . . . 2.3% 5.5% 3.9%
B 3.5% 5.6% 0.3% -7.2% 0.3% 3.5% 1.9%
EU27
L . . . . -1.7% 0.9% -0.4%
H . . . . 2.7% 5.7% 4.2%
B 3.7% 5.0% 0.4% -6.6% 0.8% 3.7% 2.2%
ESRA08
L . . . . -1.2% 1.1% -0.0%

EUROCONTROL Short-Term Forecast, May 2010. IFR Flight Movements 2010-2011. EUROCONTROL/STATFOR/Doc398
V1.0
Page: 17
2006 2007 2008 2009 2010 2011 Ave. 2011/ 2009
H . . . . 2.3% 5.6% 3.9%
B 3.6% 4.9% 0.4% -6.9% 0.3% 3.5% 1.9%
SES
L . . . . -1.7% 0.9% -0.4%

EUROCONTROL Short-Term Forecast, May 2010. IFR Flight Movements 2010-2011. EUROCONTROL/STATFOR/Doc398
V1.0
Page: 18
C. NEW SHORT-TERM FORECAST METHOD
The new short-term forecast method combines inputs from several forecasts. Time-series modeling plays a large part. Final traffic is capped to match airport capacities.
The short-term forecast focuses on time-series modeling of traffic trends month-by-month. The final result is in terms of numbers of flights per month per pair of zones or regions: within Europe origin-destination zones are used (groups of airports often smaller than States); outside of Europe, large regions are used (groups of States). Four separate forecasts (with differing horizons and time and geographical resolution) contribute to the forecast as a whole (see Figure 13):
• The State-flow forecast method is the previous method. It has been used for several years for published short-term forecasts. It forecasts each State separately, and within the State, separate forecasts for a few main ‘flows’: internals, overflights etc.
• The zone or region-pair forecast is largely based on time-series methods for some 8000 series.
• The schedule method uses data from published schedules for future months, and comparisons of previous schedules with actual flights.
• The first years of the medium-term forecast also contribute a view of future traffic.
The combined forecast is then capped by airport capacities, using the same method as used in the medium- and long-term forecasts. Overflights are calculated using both the trends identified in the short-term forecast, and the base-year flight patterns used previously in the medium-term forecast. The result is a single forecast from which short- and medium-term views can be reported.
Figure 13. Summary of short-term forecast method.
Historical Archive:
Monthly Airport-Pair Data
Short-term Forecast Medium-Term Forecast(Parts of method only)
Zone/Region-PairForecast Method
ScheduleForecast Method
Historical Archive:Published Schedule
Combine
Supporting Data:-Events-Calendars
State-FlowForecast Method
Apply annual capacities
Initial Airport-PairForecast
Aligned Airport-PairForecast
Final Airport-Pair Forecast
FinalForecast
ForecastOverflights

EUROCONTROL
© 2010 - European Organisation for the Safety of Air Navigation (EUROCONTROL)
This document is published by EUROCONTROL for information purposes. It may
be copied in whole or in part, provided that EUROCONTROL is mentioned as the
source and it is not used for commercial purposes (i.e. for financial gain). The infor-
mation in this document may not be modified without prior written permission from
EUROCONTROL.
For further information, please contact: STATFOR, the EUROCONTROL Statistics and Forecast [email protected]://www.eurocontrol.int/statfor
The Statistics and Forecasts Service (STATFOR) is ISO 9001:2008 certified