Embed Size (px)
Citation preview

1
EURAMET Key-Comparison
Luminous Intensity EURAMET.PR-K3.a
Final Report, May 2014
A. Sperling, G. Sauter, D. Lindner, M. Eltmann Physikalisch-Technische Bundesanstalt, Germany

2

3
Content 1 Introduction .......................................................................................................... 5
2 General information ............................................................................................. 6
2.1 List of Participants ........................................................................................ 6
2.2 Lamp-Transfer-Standards ............................................................................ 8
2.3 Time Schedule ............................................................................................. 8
2.4 Influences of the Operational Conditions ...................................................... 9
2.4.1 Geometric Alignment ............................................................................. 9
2.4.2 Electric Supply .................................................................................... 10
2.4.3 Thermodynamic Conditions................................................................. 10
2.4.4 Temporal Conditions ........................................................................... 11
2.5 Operational Conditions Used at PTB and by the Participants .................... 11
2.5.1 Luminous intensity standard lamps ..................................................... 11
2.5.2 Operational Conditions at the Participating Laboratories .................... 12
2.5.3 Influence of Transport ......................................................................... 14
2.5.4 Influence of Aging ............................................................................... 15
3 Results Normalised to EURAMET-RV ............................................................... 15
3.1 Luminous Intensity Values ......................................................................... 15
3.2 Tables Summarising NMI results................................................................ 16
4 Calculations in the Comparison ......................................................................... 20
4.1 Stability of the PTB Instrumentation ........................................................... 20
4.2 Determination of the EURAMET-RV .......................................................... 20
4.3 Determination of the Degrees of Equivalence ............................................ 22
4.4 Determination of Mutual DOE .................................................................... 24
4.5 Literature .................................................................................................... 26
Annex A .................................................................................................................... 27
A 1 PTB Measurement Equation for Luminous Intensity .................................. 27
A 2 Measurement Uncertainties ....................................................................... 27
A 3 The NE -Criterion ......................................................................................... 30
A 4 The Birge-Ratio .......................................................................................... 30
Annex B .................................................................................................................... 30
B 1 Data Collected from the Three Link Laboratories ....................................... 30
B 1.1 Link Laboratory PTB ............................................................................... 31
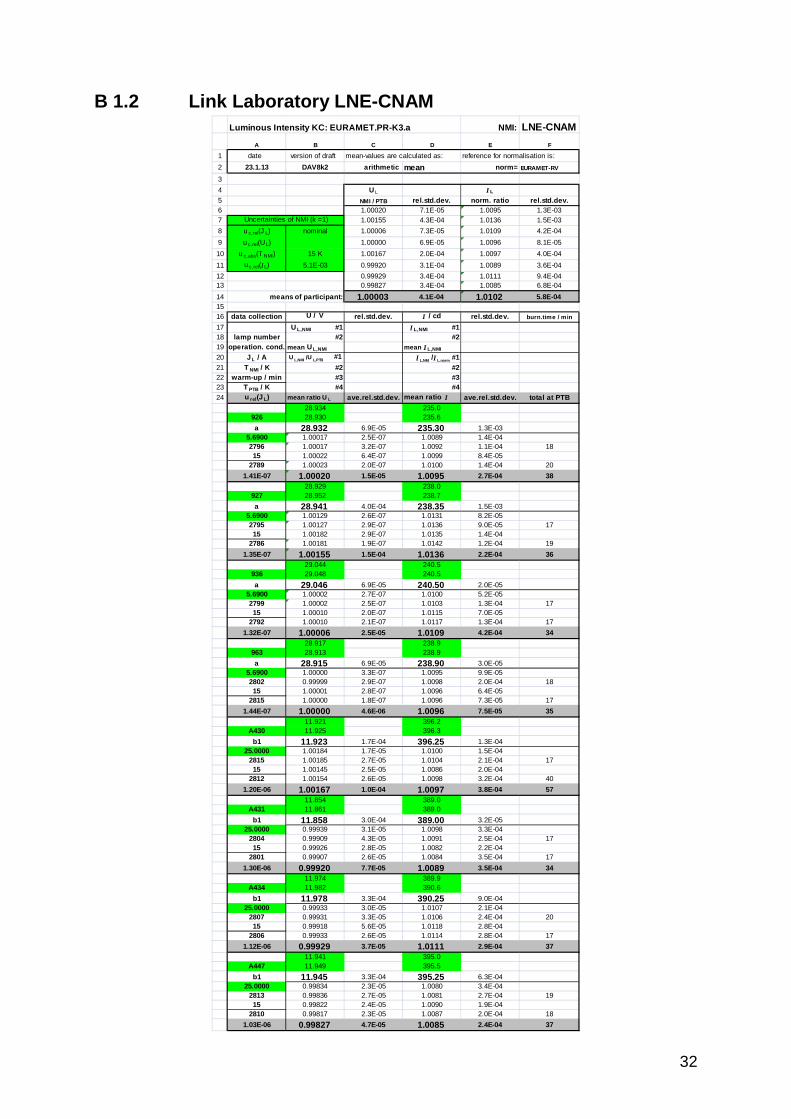
B 1.2 Link Laboratory LNE-CNAM ................................................................... 32
B 1.3 Link Laboratory INRIM ............................................................................ 33
B 2 Data Collected from the Thirteen Participating NMIs.................................. 34
B 2.1 NMI Laboratory BIM ................................................................................ 34
B 2.2 NMI Laboratory BelGIM .......................................................................... 35
B 2.3 NMI Laboratory SP ................................................................................. 36
B 2.4 NMI Laboratory UME .............................................................................. 37
B 2.5 NMI Laboratory BEV ............................................................................... 38
B 2.6 NMI Laboratory VSL ............................................................................... 39
B 2.7 NMI Laboratory CMI ............................................................................... 40
4
B 2.8 NMI Laboratory IPQ ................................................................................ 41
B 2.9 NMI Laboratory DMDM ........................................................................... 42
B 2.10 NMI Laboratory GUM .......................................................................... 43
B 2.11 NMI Laboratory INM ............................................................................ 44
B 2.12 NMI Laboratory SMU .......................................................................... 45
B 2.13 NMI Laboratory MIKES ....................................................................... 46
Annex C .................................................................................................................... 47

5
1 Introduction This report describes the international key comparison “EURAMET.PR-K3.a” of luminous intensity values transferred to the pilot laboratory by over 70 incandescent lamps. The lamps are grouped in batches from the sixteen participants. This key comparison was carried out under the auspices of the European Association of National Metrology Institutes (EURAMET), which is the Regional Metrology Organisation (RMO) in Europe. A key comparison is part of an arrangement agreed within the Comité International des Poids et Mesures (CIPM) and supports the Mutual Recognition Arrangement CIPM MRA [1]. Key comparisons deal with a specified quantity – here the luminous intensity measured with the SI-base unit, candela - and they determine on different levels (such as CCPR and RMO) the related Reference Values (RV). The relative differences between the value of each participant and the RV are evaluated as the second result, which is denoted as Degree of Equivalence (DOE). Finally, from the DOEs of the participants, their relative mutual differences to the values of all other participants are evaluated and presented as a matrix of DOEs. All results mentioned above are evaluated with associated expanded uncertainties. More than a decade ago, the CCPR initialised a key comparison for luminous intensity denoted as CCPR-K3.a, which was piloted by the Physikalisch-Technische Bundesanstalt (PTB, Germany). The resulting “… key comparison reference value CCPR-KCRV was calculated as the weighted average of the individual results, weighted by the inverse square of the individual standard uncertainties, with the application of a minimum uncertainty cutoff of 0.25 % ” [2]. All results of this CCPR-key-comparison were published [3] in 1999 and the DOEs are listed in the data base [2] of the BIPM. The part of the data base relevant for this key comparison is shown below. This key comparison “EURAMET.PR-K3.a” is performed according to the regulations valid within the Comité Consultatif de Photométrie et Radiométrie (CCPR). All participating laboratories are National Metrological Institutes (NMI) and all of them are accredited according to the ISO 17025 [4]. The comparison follows strictly the Technical Protocol specifying procedures for organisation and models for the determination of all results with the associated measurement uncertainties. The latter are evaluated and reported according to the "Guide to the Expression of Uncertainty in Measurement" (GUM) [5]. Before the measurements were started, the Technical Protocol was prepared by the pilot laboratory and agreed in all details by the working group with participants as members. The reference value CCPR-KCRV for luminous intensity is maintained since that time by the participants of that early CCPR comparison and three of them are now acting as link laboratories for this EURAMET-Key-Comparison:

6
1. Laboratoire Commun de Métrologie (LNE-INM/CNAM, France; former BNM-INM), 2. Instituto Nazionale di Ricerca Metrologica (INRIM, Italy; former IEN), 3. Physikalisch-Technische Bundesanstalt (PTB, Germany).
These laboratories support the comparison with values for luminous intensity to restore the CCPR-KCRV as the reference value EURAMET-RV for this EURAMET-Key-Comparison and the PTB agreed to act as pilot laboratory. The link laboratories transferred their maintained values of luminous intensity by batches of incandescent lamps to the pilot laboratory, which measured the lamps and evaluated a weighted average for the luminous intensity, i.e. the reference value EURAMET-RV with its associated uncertainty. Averaging the values from three link laboratories reduces the uncertainty contributions originated by maintenance, transfer and by the measurements performed at both sides; i.e. at each of the three link laboratories and the pilot laboratory. This ensures that the EURAMET-RV is as close as possible to the original CCPR-KCRV and the associated uncertainty is only slightly increased. Finally, the luminous intensity values transferred from all other participants are compared with the EURAMET-RV and the DOEs of their values with the reference value and mutually with all other luminous intensity values are evaluated with the associated uncertainties. All principle information, the data collection and the evaluation are given in the following chapters and are supplemented with more details in the Annexes.
2 General information
2.1 List of Participants The acronyms of the participating National Metrological Institutes are listed in the first column of Table 1. The names of the institute and the contact person with the e-mail address are given in the second column. The third column shows the country and the city of each participant. In the last column, the number and types of the lamp-transfer-standards used by the participants are entered. In the invitation to this comparison, "hand-carrying" was recommended for the transport of the transfer standards. Thus, for each participant, two trips had to be scheduled. The majority of NMIs followed this recommendation, less than 20 % of the lamps were shipped to PTB using public transport. So, none of the lamps was broken and only 2 of over 70 lamps showed a change of values noticeable enough to be excluded from the comparison.

7
Table 1 EURAMET KC of Luminous Intensity: Participants and their lamp-transfer-standards Acronym Laboratory Name
Contact Person / Email Country City
Number and lamp type
BIM Bulgarian Institute for Metrology Nikolay Alexandrov, Email: [email protected]
Bulgaria Sofia
4 WI41/G
SP Swedish National Testing and Research Institute Anne Andersson, Email:[email protected]
Sweden Boras
3 WI41/G
MIKES Helsinki University of Technology and Centre for Metrology, Metrology Research Institute Tuomas Poikonen, Email: [email protected]
Finland Helsinki
4 WI41/G
GUM Central Office of Measures, Optical Radiation Division Dorota Soboto, Email: [email protected]
Poland Warsaw
5 WI41/G
SMU Slovak Institute of Metrology Peter Nemecek, Email: [email protected]
Slovakia Bratislava
3 LIS/IF/IC/S
IPQ Instituto Português da Qualidade, Laboratório Central de Metrologia Olivier Pellegrino, Email: [email protected]
Portugal Caparica
4 WI41/G
BEV Bundesamt für Eich- und Vermessungswesen, Gruppe Eichwesen (Metrology Service) Norbert Hörhager-Berl, Email: [email protected]
Austria Wien
4 WI41/G
INM National Institute of Metrology Mihai Simionescu, Email: [email protected]
Romania Bucureşti
2 WI40/G 2 WI41/G )1
CMI Czech Metrology Institute Marek Smid, Email: [email protected]
Czech Republic Praha
4 WI41/G
UME Ulusal Metroloji Enstitüsü, TÜBITAK-UME Ferhat Sametoglu, Email: [email protected]
Turkey Gebze-Kocaeli
6 WI41/G
VSL NMi Van Swinden Laboratorium B.V. Elena A. Revtova, Email: [email protected]
Netherlands Delft
4 WI41/G
DMDM Directorate of Measures and Precious Metals, Boban Zarkov, Email: [email protected]
Serbia Beograd
4 WI41/G 4 LIS (GEC)
BelGIM Belarussian State, Institute of Metrology Olga B. Tarasova, Email: [email protected]
Belarus Minsk
5 SIS 40-100 )1
INRIM Istituto Nazionale di Ricerca Metrologica, Maria Luisa Rastello, Email: [email protected]
Italy Torino
6 WI41/G
LNE-CNAM Laboratoire Commun de Métrologie Gael Obein, Email: [email protected]
France La Plaine Saint-Denis
4 WI41/G 4 LIS (GEC)
PTB Physikalisch-Technische Bundesanstalt Armin Sperling, Email: [email protected]
Germany Braunschweig
6 WI41/G
Remarks: )1 Results of one lamp excluded by participant

8
2.2 Lamp-Transfer-Standards Five different types of lamp-transfer-standards were used by the participants and are stated in the last column of Table 1. Their images are shown in Fig. 1. Obviously, the bulbs and filaments of these lamps are significantly different. These properties could affect seriously the alignment and the influence of stray light. Thus, the pilot laboratory took a great deal of care to follow precisely the instructions of the participant for the operation of the lamp-transfer-standards to reduce the related contributions to the measurement uncertainty.
a) OSRAM
WI41/G
b) OSRAM
WI40/G
c) POLARON
LIS/IF/IC/S
d) POLARON
LIS (GEC)
e) SIS 40-100
Fig. 1 Images of five different lamp-transfer-standards used by the participants are shown and identified by the names of lamp manufacturers1 and the lamp type.
2.3 Time Schedule At the beginning of the comparison, the measurements were delayed due to missing lamps. Afterwards, all measurements continued as scheduled. At the pilot laboratory (PTB), the luminous intensity measurements of the lamp-transfer-standards started in July 2008 and were completed within less than four weeks. Because of the very short and uninterrupted period of time for measurements, no effects of aging or drifts of the instrumentation are found to be noticeable and no correction had to be applied. Two months later, September 2008, a status report was already distributed to the participants. The last data of the participants return measurements were received at the PTB in June 2011. (A collection of documents from the participants received by the pilot laboratory is added in the Annex.) All data regarding the lamps of a participant, sent from a participant or measured in the PTB, are collected in an individual table. All tables are organised to perform the evaluations for each participant and to get final results for the whole comparison. In February 2011, a complete overview on the results was distributed to the participants as “Pre-Draft A”. The results (ratios of the participant’s value and the related value of the pilot) for each participant were normalised to its own mean value. This prevented
1 The manufacturers are named for clear identification of a lamp type, not as a recommendation.

9
the data of a participant from being compared with the results of the other participants, but allowed for cross-checking all own entries. This process was introduced in the procedure to avoid misinterpretation and typos. The latest responses on these checks and the messages dealing with the measurement uncertainties and their budgets were received in January 2013.
2.4 Influences of the Operational Conditions The operational conditions for the lamp-transfer-standards affect their geometric, electric, thermodynamic and temporal properties. According to the sensitivity of the lamps with respect to these conditions and regarding the associated uncertainties connected to the transfer of the luminous intensity values, the operational conditions can be divided in three groups: (i) Conditions which do not change the properties, but modify a measurement result; (ii) Conditions which affect the properties in a reversible manner; (iii) Conditions which create an irreversible change of the lamp-transfer-standard. Maximum care and attention were taken at PTB to avoid any irreversible change of the lamp-transfer-standards. All conditions were optimally fulfilled to reduce any modification of measurement results.
2.4.1 Geometric Alignment An operational condition of the first category is e.g. the geometrical alignment of a luminous intensity standard lamp and its unavoidable small deviations from perfect alignment. The geometrical alignment has to be done in six degrees of freedom, where each axis might have different sensitivity factors for the evaluation of the combined measurement uncertainty associated with the luminous intensity value. The relations of geometrical sensitivity factors for the six degrees of freedom are as follow:
- A translation of the lamp in the direction of the optical axis of the bench will have a much stronger effect on the illuminance on the photometer (inverse square law) than a translation of the same extent orthogonally directed to optical axis of the bench.
- A small tilt angle of the lamp around an axis parallel to the bench’s optical axis will create a negligible effect on the illuminance, although a noticeable rotation of this type may affect the properties of the lamp in a reversible manner.
- Significant changes in the illuminance on the photometer will appear from a rotation around the vertical axis passing through the centre of the filament - even if the luminous intensity distribution of the lamp remains unchanged.
- For most of the types of lamps in this comparison, the strongest effect on the evaluated value of luminous intensity comes from a tilt angle around the horizontal axis through the centre of the filament and orthogonally directed to the bench’s optical axis.
The luminous intensity standard lamps of a few participants are mounted to individual sockets/holders. These lamps are of course operated at PTB attached to their

10
specific holders and they are aligned according to the individual specification given by the participant.
Note: Irreversible changes of a lamp introduced by mechanical conditions may be created by a change of the burning position of a lamp. But, within this comparison, all luminous intensity standard lamps were operated only in the cap down position.
2.4.2 Electric Supply In this comparison, the incandescent lamp standards for the transfer of the luminous intensity values were operated using the lamp current as a setting parameter, which was held constant. A lamp, seasoned and calibrated with a DC-supply at a fixed polarity, can irreversibly be altered if accidentally operated with reversed polarity. Although all participants within this comparison were using DC power supplies for their transfer-standard-lamps, three possible conditions with respect to polarity were used: i) Negative polarity at central contact of the lamp cap; ii) Positive polarity at central contact of the lamp cap; iii) Fixed polarity given by marked external contacts. The condition used for every lamp from the participants is given in Table 2. As mentioned in chapter 2.4.1, a few luminous intensity standard lamps were mounted in specific holders. In general, these holders had separate contacts for current supply and voltage measurement and were clearly marked with respect to their electrical connection. In order to avoid any discussion on all the variations mentioned above, the instructions with respect to electric supply given by the participants were followed accurately at PTB. In general, the lamps were measured using a four-pole-technique, either at the marked connectors or directly at the electrically conducting parts of the cap. This was also almost true for the Polaron lamps (high current) with separate holder and separate leads and contacts, where the separate contacts for current and voltage are used for four-pole-connection (that means, the voltage drop due to the wires from the separate holder to the real contacts of the lamp is taken as part of the lamp voltage).
2.4.3 Thermodynamic Conditions It is well known that the properties of incandescent lamps are not very sensitive to the environmental conditions like ambient temperature, air pressure, speed of moving air and humidity. Therefore, it was sufficient that, for the duration of the measurements for this comparison, the stability of these values was high enough to avoid any related effects. The ambient temperature was stabilised at a value of 23.0 °C and the fluctuations were less than ±1.0 °C. The lamps were standing free in up-right position. During operation, air flow was restricted to thermal convection.

11
2.4.4 Temporal Conditions At PTB, all lamp-transfer-standards were operated following the PTB rules for the temporal management of these types of lamp standards. These rules are facilitating the safe operation of lamp standards and minimise contribution of Type B uncertainties. In detail: The lamp current as setting parameter was ramped up within one minute to the value given by the participant. The warm-up time was considered as stated by the participant and was additionally checked by analysing the stability of the readings of the meters. The measurements were started after the thermal equilibrium was achieved (typically after 10 min to 15 min burning time). Finally, after the measurements, the lamp current was ramped down within the time period of about one minute. The burning time for each individual lamp operation complemented by additional data is shown in the individual breakdown for the measurement results. An example for such an overview is given in Table 3. PTB did not apply any burning time dependent corrections for lamp aging to the measured values of the luminous intensity.
2.5 Operational Conditions Used at PTB and by the Participants
2.5.1 Luminous intensity standard lamps
There are different types of luminous intensity standard lamps which were used and operated according to the conditions stated in Table 2. These conditions are referenced in Table 2 and abbreviated with the symbols "a", “b” or “c”. The differences indicated are due to the variations in the shapes of the filaments and to the different types of apertures/masks connected to the different lamp types. Geometrical conditions:
a) e.g. OSRAM Wi41/G - lamp’s optical axis is central and perpendicular to the filament plane - lamp’s optical axis is parallel to the bench’s horizontal axis - plane, containing lamp’s optical axis and lamp axis (cap down), is vertical - distance is measured from the centre of the filament - only the light passing through the opening in the mask is measured
b) e.g. Polaron LIS (high current) - lamp’s optical axis is perpendicular to the plane materialised by metal bands
and central to the filament plane - lamp’s optical axis parallel to the bench’s horizontal axis - lamp operated in “cap down” position, plane containing lamp’s optical axis
and filament axis is vertical - distance is measured from the centre of the filament - only the light passing through the aperture is measured

12
c) SIS-type, operated with special baffle - (detailed information in Table 2, symbol c)
Electrical power supply and measurements: - the quantity to be set is constant DC current - polarity depends on the individual lamp standard - lamp voltage is measured with two separate contacts, "four-pole-technique".
2.5.2 Operational Conditions at the Participating Laboratories A reduction of measurement uncertainty associated with the value of the transferred luminous intensity can be achieved if the operational conditions from the participants were precisely duplicated for the measurements of their standards at PTB. The high flexibility of the measurement setup at PTB for these variations is documented in Table 2. The abbreviations used in the table have the following meanings: neg. negative polarity connected to pos. positive polarity connected to c.c. central contact red red marked contact ± the two contacts are marked with individual sign All modifications for the operation of the lamps were realised at the PTB. Table 2 Geometric and electric operational conditions used by the participants for
the lamp-transfer-standards symbol operational conditions (see also pictures in Fig. 2) polarity
a PTB-conditions neg. at c.c. a1 PTB-conditions pos. at c.c. a2 PTB-conditions; but use of an alignment jig and a level for
the lamp orientation pos. at "red"
a3 PTB-conditions; but lamp’s glass frame is between filament and photometer; complete glass bulb is visible to photometer
pos. at c.c
b1 PTB-conditions; but lamp axis is vertical and rotation is indicated by metal bands, lamp’s optical axis is perpendicular and central to filament plane
marked by "±"
b2 PTB-conditions; but additional details according to alignment at participant laboratory
marked by "±"
b3 PTB-conditions; but perpendicular and central to filament plane, bench’s optical axis central to mask, an arrow indicates the direction for measurement
neg. at c.c.
c BelGIM-conditions; cap down, filament plane perpendicular to bench’s optical axis, start of light path at centre of filament; baffle: a) 15 mm distance from glass bulb on the opposite site from the filament holder in direction to the photometer, b) marked site towards the lamp, c) opening central and normal to lamp’s optical axis, lower edge horizontal.
neg. at c.c.

13
For a measurement of the luminous intensity values, the assigned distances vary depending on the effective location of the beginning of the light path within the filament of the lamps. Therefore, at PTB, all luminous intensity measurements were carried out using a (large) distance of 6 m between the planes associated with the filament and the limiting aperture of the photometer. In most cases additional readings at reduced distances were taken to find out the sensitivity coefficient for a translation in the direction of the bench’s optical axis. These coefficients are used for the evaluation of uncertainty as well as for a correction between the different measurements conditions, e.g. to those distances used at the laboratories of the participants. However, it turns out - as expected - that the influence seems to be negligible.
Fig. 2 shows a selection of images documenting the alignment of the different types of luminous intensity standard lamps at the PTB according to the instructions of the participants. The column of images in the middle shows the view from the photometer to the filament. The cross hair indicates the location for the set-point of the filament centre. The directions of the two hairs indicate the vertical and horizontal directions to be set for a rotation of the filament around the lamp’s axis optical axis. The two other columns show side-views of the filament and the cross hairs indicate horizontally the bench’s optical axis and vertically the plane where distance measurements are started. These cross hairs show also the direction to be set for the filament’s tilt angle. Finally, the direction to be set for a rotation of the lamp around the filament’s vertical axis is given by minimum widths of the filament’s images in both of the side-views. For all lamps, these sets of images of the filaments were taken for each operation to prove the achieved alignment with respect to the six degrees of freedom.
view from the right side view from the photometer along the bench’s optical axis
view from the left side
OSRAM WI41/G
OSRAM WI40/G

14
SIS 40-100
POLARON LIS (GEC)
POLARON LIS/IF/IC/S
Fig. 2: Examples of images documenting the mechanical alignment of the filaments of the various types of luminous intensity standard lamps.
2.5.3 Influence of Transport In general, the lamps when returned from PTB to the participant’s laboratory should have been operated following the same procedure as used for the measurements before shipment. From the “initial” and “return” data sets measured by the participant before and after the transportations and the measurements at the PTB, the lamp data and lamp characteristics shall verify that the values previously assigned to the lamp’s properties are still valid. Thus, the two sets of lamp data will allow the detection and the magnitude of changes due to a possible small alteration during transport and from the use in PTB. Provided these changes are negligible, the values measured at PTB can be taken as a basis for the determination and further dissemination of the EURAMET-RV value of the luminous intensity. In case that a significant change of one lamp has occurred, the weight of that specific transfer standard for the calculation of the average shall be reduced or, in worst
15
case, the specific standard might be excluded from the comparison by the participant.
2.5.4 Influence of Aging In principle, any operation of the lamp transfer standards - the operations at PTB, too - will irreversibly alter the lamp data and the values transferred by the lamp. These changes depend on the aging rate specific for each lamp-transfer-standard and the total duration of the burning time. This is the reason why the total burning time at PTB is summarised in the tables explained below. Using the lamp’s aging rate – which is usually known only by the participants laboratory - and the burning time at PTB, an expectation of the possible aging related change can be calculated and compared with the change found by the return-measurements. A relative aging rate of a few parts in 104 per hour is usually found for these types of lamps. When multiplied with the typical burning time at PTB of less than one hour, the effect of aging is negligible, otherwise it would be the responsibility of a participant to perform the appropriate correction for the values of the “return” measurement results.
3 Results Normalised to EURAMET-RV
3.1 Luminous Intensity Values Each link laboratory was asked to calibrate its luminous intensity lamp-transfer-standards such that the luminous intensity values represent the magnitude of its luminous intensity unit at the former time, when the laboratory participated in the CCPR key comparison. The uncertainty associated with this maintained luminous intensity value is combined from the former uncertainty and the contribution for the maintenance over the long period of time. It is important to notice that the maintained luminous intensity values of a link laboratory transfer the former values, independent of today’s values, which might be changed due to new realisations of the luminous intensity unit or because of improved measurement techniques. The luminous intensity values of all other participants represent the luminous intensity values used for their day–to–day calibrations associated with the minimum uncertainties. The pilot laboratory starts with a constant but arbitrary luminous intensity value when collecting the values of the link laboratories. Their weighted contribution is the reference value EURAMET-RV. This value is the best approach to the CCPR-KCRV available during this EURAMET key comparison and it is finally used at the pilot laboratory, to normalise the luminous intensity values of all other participants. The three link laboratories as well as all other participating laboratories measured the relevant quantities of their lamp-transfer-standards before and after the shipments to and from the pilot laboratory. These measurements are denoted as “initial” and

16
“return” measurements. Participating laboratories reported for each lamp-transfer-standard four values with the associated uncertainties, two for luminous intensity and two more for lamp voltage performed before and after the transports and the measurements carried out at the pilot laboratory. All these values were corrected by the participating laboratory for operation under the stated conditions. The pilot laboratory operated the lamp-transfer-standards of a participant at minimum in two independent runs (at the begin of the measurement campaign and again at the end). It acquired the values for lamp currents, lamp voltages, distribution temperatures and illuminances in known distances. From these raw data, the values for luminous intensities and lamp voltages are first corrected for perfect settings of the operational conditions and then evaluated with associated uncertainties as normalised contribution to the comparison. The values of luminous intensity are normalised to the EURAMET-RV, while those of the lamp voltages are normalised to the values determined at the PTB.
3.2 Tables Summarising NMI results For each participant, the submitted data and evaluated results of the measurements carried out at the pilot laboratory are collected in individual tables collected in the Annex B. The Table 3 shows an example for detailed explanation of the entries. Title and name of the key comparison are given on top and the acronym of the corresponding NMI is shown in the upper right corner. The characters “A, B, C, …” and numbers “1, 2, 3, …” in the first row and first column, respectively, are for reference to identify the cells with the different entries. The first framed block in the table includes the cells from A1 to F2 and contains general information, starting from left with “date” and “version of the related draft”. The entries in the two blocks of cells C1 to D2 and E1 to F2 explain that the relative data of voltages (C6-C14) and luminous intensities (E6-E14) are averaged as arithmetic means and that the latter is normalised to the key comparison reference value EURAMET-RV, which is realised within this key comparison from the luminous intensity values transferred by the link laboratories. The second framed block C4 to F14 is important because it collects the averaged and normalised results of all lamp measurements for one NMI (the entries will be explained later). The small block of cells A7 to B11 holds the standard uncertainties indicated by the participating NMI and gives access to these uncertainty contributions. The biggest part of the table deals with the properties and measurements of the individual lamp-transfer-standards. The names of quantities, units and further descriptions for the entries in blocks below row 24 are given in a header block (A16 to F24). The respective values for each lamp are given below row 24 in blocks of eight rows according to the description in the header block. The entry respective to the header cell A18 stands for the lamp number, while the respective entry for A19

17
states the operational condition at PTB with the identifier defined in the columns of Table 2. During the explanation of the individual cells in a block with lamp data, it is inconvenient to refer individually to the respective cell in the header block. Therefore, a cell with lamp data is referenced to the respective cell in the header by the additional character “r” at the cell identifier. As example, the explanation “lamp number” in cell A18 of the header is referenced as A18r for the corresponding entry in the blocks of lamp data. The values for the lamp current, the distribution temperature and the warm-up time are taken from the data sheet prepared by the participant and copied in the cells A20r to A22r. In cell A23r, a value for the distribution temperature measured at PTB is shown. It was determined by blue-red-ratio measurements with an uncertainty just sufficient for PTB mismatch correction. The relative standard uncertainty in cell A24r gives constancy and deviation of the set-value for lamp current during lamp operation at PTB. In columns B16r to C24r, the values of the individual measurements of the lamp voltage are summarised and the cells B17r and B18r show the values for the lamp voltage as given by the participant („initial“ and „return“ transportation, respectively) and their average in B19r. The stated standard deviations of the participant’s voltage measurements are given in the cells C17r and C18r with their average in cell C19r. The ratios of the participant’s value of lamp voltage (from B19r) divided by the PTB values of lamp voltage determined during repeated operations (#1,…, #4) are listed in the cells B20r to B23r and the relative standard deviations of these voltage measurements are given in the cells C20r to C23r. Averages of the ratios of values and relative standard deviations are given in the cells B24r and C24r, respectively. In the columns D16r to D24r and E16r to E24r, the values and associated relative standard deviations (further on taken as relative standard uncertainties) of the luminous intensity are summarised similar to the lamp voltages. The cells D17r to D18r show the participant’s „initial“ (before transportation to the pilot) and „return“ (after transportation back to the NMI) values with the average in D19r, while the cells E17r to E19r state their respective related relative standard deviations calculated from the values given by the participants. The cells D20r to D23r show the ratio of the average in the cell D19r divided by the photometric value determined during the repeated operations (#1,…,#4) at PTB and the PTB values are normalised to the EURAMET-RV, which represents a value close to the CCPR-KCRV. Therefore, the listed relative deviations of the participant’s values are just the deviations from the CCPR-KCRV. The relative standard deviations are collected in the cells E20r to E23r. The averaged value of a lamp is calculated and placed in the cell D24r together with the relative standard deviation stated in the cell of E24r. In column "F" of the block for a lamp-transfer-standard, the burning time at PTB is given separately for each power up sequence and the total burning time is stated in F24r, too. In very few cases, the number of measurements per power up sequence

18
at PTB was larger than usual, which can be seen from the reported longer burning time. This tabulation is consecutively repeated for all lamp-transfer-standards of the individual participant. The averaged results for relative voltages and normalised luminous intensities of all lamps for one participant are copied from below and are summarised within the second framed block C6 to F13, which simplifies the overview and the check of consistency. The repeatability of a single lamp as well as the uniformity of the batch can be analysed from these results which forms the basis for an identification of transfer standards which might be affected by transport, use or operational conditions. The relative mean values and associated standard deviations for lamp voltage and normalised luminous intensity values are shown in cells C14 to F14 and the value in cell E14 subtracted by “1” is just the DOE, which is the relative deviation of the participant’s value of luminous intensity from the EURAMET-RV, which is close to the CCPR-KCRV. It should be noted that, in a key comparison, the (single) DOE value of a participant states the relative deviation of its luminous intensity value from the related RV. This means that, in a CCPR key comparison, the (single) DOE value depends on the values of all other accepted participants and only the mutual DOE values are independent of the RV. Similarly, in this EURAMET key comparison, the (single) DOE value of a participant is the relative deviation of its luminous intensity value from the related EURAMET-RV. Thus, it is dependent on the luminous intensity values transferred by only the link laboratories but totally independent of the values of the other participants. Again the mutual DOE values are independent of the RV. The CCPR-KCRV and the EURAMET-RV are close to each other but the uncertainty associated with the value of the latter is increased due to contributions from (i) maintenance at the link laboratories over a long period of time (since the CCPR key comparison), (ii) the uncertainties of the link laboratories originated from the transfer at the time when participating in the former CCPR key comparison, and (iii) the uncertainties from the new transfer in this comparison, which includes additional operations and measurements at the link laboratories and at the pilot laboratory. The relation is given in the next chapter.

19
Table 3 Table with collected data measured by the participant and at the PTB
Luminous Intensity KC: EURAMET.PR-K3.a NMI: BIM
A B C D E F
1 date version of draft mean-values are calculated as: reference for normalisation is:
2 23.1.13 DAV8k2 arithmetic mean norm= EURAMET-RV
3
4 U L I L
5 NMI / PTB rel.std.dev. norm. ratio rel.std.dev.6 1.00009 3.8E-05 1.0011 1.2E-037 Uncertainties of NMI (k =1) 1.00015 7.7E-05 1.0009 4.6E-04
8 u c,rel(J L) nominal 1.00012 1.3E-04 0.9999 1.3E-04
9 u c,rel(U L) 1.5E-04 1.00000 2.9E-05 0.9996 9.1E-04
10 u c,abs(T NMI) 11.55 K
11 u c,rel(I L) 7.5E-03
12 13
14 means of participant: 1.00009 3.3E-05 1.00036 3.6E-041516 data collection U / V rel.std.dev. I / cd rel.std.dev. burn.time / min
17 U L,NMI #1 I L,NMI #118 lamp number #2 #219 operation. cond. mean U L,NMI mean I L,NMI
20 J L / A U L,NMI /U L,PTB #1 I L,NMI /I L,norm #121 T NMI / K #2 #222 warm-up / min #3 #323 T PTB / K #4 #424 u rel(J L) mean ratio U L ave.rel.std.dev. mean ratio I ave.rel.std.dev. total at PTB
29.3668 230.27305 29.3646 229.75
a 29.3657 3.7E-05 230.01 1.1E-035.61539 1.00008 4.3E-07 1.0004 6.5E-05
2795 1.00007 4.6E-07 1.0003 1.3E-04 1812 1.00010 6.2E-07 1.0016 9.1E-05
2795 1.00010 5.1E-07 1.0020 1.3E-04 45
1.26E-07 1.00009 7.2E-06 1.0011 4.2E-04 6329.2066 230.70
348 29.2021 230.49
a 29.2044 7.7E-05 230.60 4.6E-045.62422 1.00016 5.2E-07 1.0007 1.1E-04
2795 1.00015 4.5E-07 1.0009 1.2E-04 1812 1.00015 5.0E-07 1.0010 7.4E-05
2794 1.00014 4.7E-07 1.0008 1.7E-04 17
1.25E-07 1.00015 4.2E-06 1.0009 4.4E-05 3529.1848 231.28
369 29.1775 231.25
a 29.1812 1.3E-04 231.27 6.7E-055.57789 1.00011 6.1E-07 0.9999 7.7E-05
2795 1.00010 7.2E-07 0.9997 1.0E-04 1712 1.00013 5.3E-07 1.0000 9.4E-05
2792 1.00013 3.9E-07 1.0002 1.5E-04 18
1.15E-07 1.00012 6.9E-06 0.9999 1.2E-04 3529.1048 227.70
380 29.1034 227.29
a 29.1041 2.4E-05 227.50 9.0E-045.61538 1.00003 5.0E-07 0.9996 9.3E-05
2795 1.00002 3.6E-07 0.9998 1.2E-04 1712 0.99997 5.0E-07 0.9994 6.6E-05
2790 0.99996 4.8E-07 0.9996 7.8E-05 17
1.28E-07 1.00000 1.6E-05 0.9996 9.0E-05 34

20
4 Calculations in the Comparison
4.1 Stability of the PTB Instrumentation At the PTB, the stability of the instrumentation was verified with batches of monitor lamps. For the luminous intensity measurements over the period of three weeks, two photometers were used. Their responsivity was proved to be stable within the repeatability of the measurements. No corrections have to be applied. The results of measurements using up to 7 monitor lamps are shown in Fig. 3 with the measurement sequence indicated by characters “M”, “L” and “T” referring to Monitor, Link and ParticipanT, respectively. In the centre of the measurement campaign at the PTB, the monitor objects and the lamp-transfer-standards are encircled with lamps of the link laboratories.
11.7.08 16.7.08 21.7.08 26.7.08 31.7.08 5.8.08 10.8.08
0.10 %
0.05 %
0.00 %
-0.05 %
-0.10 %
Fig. 3 Relative deviations of photocurrents from mean photocurrent as function of time
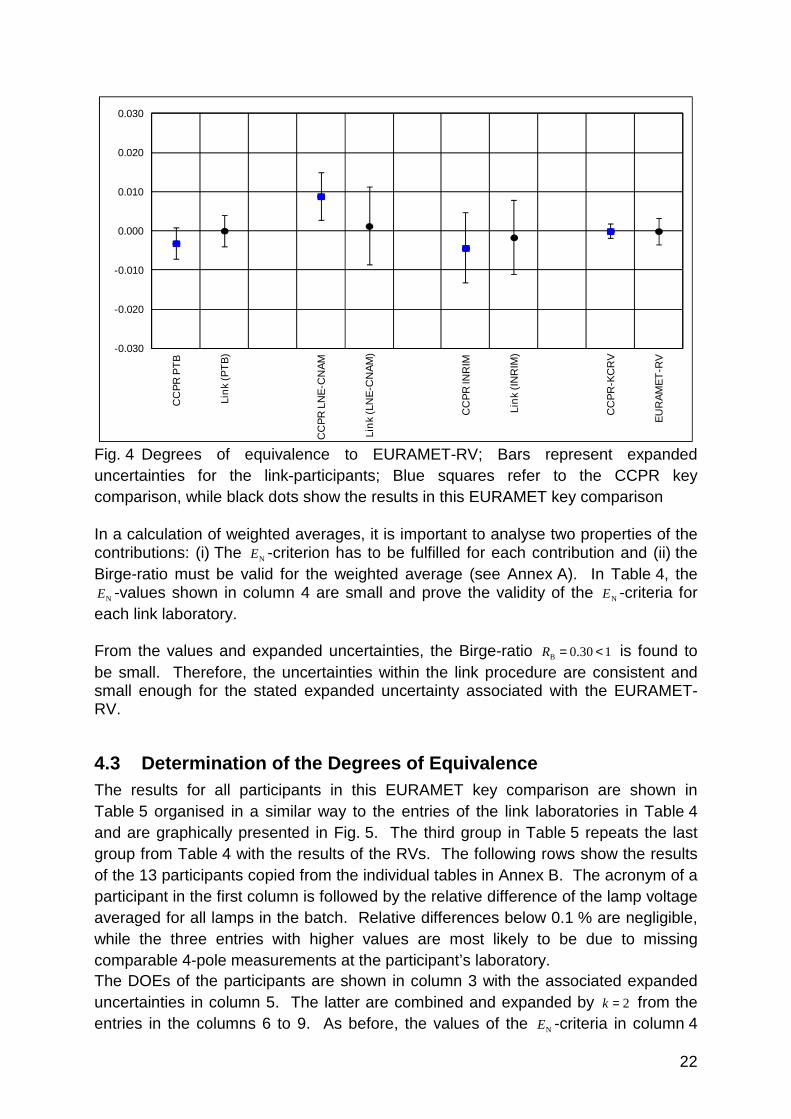
4.2 Determination of the EURAMET-RV The evaluation of the EURAMET-RV is explained in Table 4 and the result is shown in the last row. A graphical presentation of the content of this table is given in Fig. 4. The values of the link laboratories are shown in three groups of two rows: The first column holds the acronym of the link laboratory or a hint to the RV, respectively. The upper row of a group shows the DOE for the link laboratory with associated expanded uncertainty as determined in the former CCPR key comparison and published by the BIPM [2]. These values are marked as blue squares in Fig. 4 together with the related reference CCPR-KCRV. The second row in a group presents the results from this EURAMET key comparison. The results are the normalised and averaged values taken from the tables in Annex B similar to the example shown in Table 3. The second column shows the relative deviation of lamp voltages measured at a link laboratory from the voltages measured at the PTB. The small relative differences prove that neither instability of the lamps nor differences in the operational conditions between link and pilot laboratory influence the luminous intensity values significantly.

21
The normalised averaged luminous intensity value from cell E14 in Table 3 is transferred by the batch of lamps from the link laboratory to the pilot laboratory. The value represents the luminous intensity of the link laboratory at the time of the CCPR key comparison and the DOE is just the difference to the CCPR-KCRV. Therefore, the DOE was subtracted from the transferred and normalised value of luminous intensity placed in column three of Table 4 in the second row of a link laboratory. The associated uncertainties in column five of Table 4 are combined and expanded from the contributions in the four more columns to the right. These four contribution of uncertainties are explained in Annex A. Table 4 Reference value for EURAMET key comparison Link-Results of Luminous Intensity KC: EURAMET.PR-K3.a Pilot-Lab.: PTB - Photometry
Link Laboratory U NMI/U PTB -1 I NMI/I RV -1 E N U(batch) u rel(unit) u rel(transfer) u rel(PTB) u rel(homog.)
CCPR PTB -0.0031 4.0E-03Link (PTB) 0.00005 0.0001 0.02 4.0E-03 1.8E-03 5.8E-04 5.8E-04 1.2E-04
CCPR LNE-CNAM 0.0089 6.0E-03Link (LNE-CNAM) 0.00003 0.0013 0.12 1.0E-02 5.1E-03 5.8E-04 5.8E-04 5.8E-04
CCPR INRIM -0.0043 9.0E-03Link (INRIM) 0.00011 -0.0016 0.16 9.4E-03 4.6E-03 5.8E-04 5.8E-04 4.0E-04
CCPR-KCRV 0.0000 1.8E-03EURAMET-RV 0.0000 3.4E-03 The EURAMET-RV is evaluated as the average of the entries in column three, i.e. the second row, weighted by the associated uncertainties in column five. This EURAMET-RV is used to normalise all luminous intensities in the example of Table 3 and in the Annex B including those values of the link laboratories, which are entries in Table 4. By definition, the two references CCPR-KCRV and EURAMET-RV have identical values as shown in the presentations of Table 4 and Fig. 4, but the expanded uncertainty associated with the EURAMET-RV is about twice the expanded uncertainty associated with the CCPR-KCRV.
22
-0.030
-0.020
-0.010
0.000
0.010
0.020
0.030
CC
PR
PT
B
Lin
k (P
TB
)
CC
PR
LN
E-C
NA
M
Lin
k (L
NE
-CN
AM
)
CC
PR
INR
IM
Lin
k (I
NR
IM)
CC
PR
-KC
RV
EU
RA
ME
T-R
V
Fig. 4 Degrees of equivalence to EURAMET-RV; Bars represent expanded uncertainties for the link-participants; Blue squares refer to the CCPR key comparison, while black dots show the results in this EURAMET key comparison In a calculation of weighted averages, it is important to analyse two properties of the contributions: (i) The NE -criterion has to be fulfilled for each contribution and (ii) the Birge-ratio must be valid for the weighted average (see Annex A). In Table 4, the
NE -values shown in column 4 are small and prove the validity of the NE -criteria for each link laboratory. From the values and expanded uncertainties, the Birge-ratio 130.0B <=R is found to be small. Therefore, the uncertainties within the link procedure are consistent and small enough for the stated expanded uncertainty associated with the EURAMET-RV.
4.3 Determination of the Degrees of Equivalence The results for all participants in this EURAMET key comparison are shown in Table 5 organised in a similar way to the entries of the link laboratories in Table 4 and are graphically presented in Fig. 5. The third group in Table 5 repeats the last group from Table 4 with the results of the RVs. The following rows show the results of the 13 participants copied from the individual tables in Annex B. The acronym of a participant in the first column is followed by the relative difference of the lamp voltage averaged for all lamps in the batch. Relative differences below 0.1 % are negligible, while the three entries with higher values are most likely to be due to missing comparable 4-pole measurements at the participant’s laboratory. The DOEs of the participants are shown in column 3 with the associated expanded uncertainties in column 5. The latter are combined and expanded by 2=k from the entries in the columns 6 to 9. As before, the values of the NE -criteria in column 4

23
prove that the deviations from the RV and the associated expanded uncertainties are well matched for all participants. Table 5 Results of all participants in the EURAMET key comparison Results of Luminous Intensity KC: EURAMET.PR-K3.a Pilot-Lab.: PTB - Photometry
Participant U NMI/U PTB -1 I NMI/I RV -1 E N U(batch) u rel(unit) u rel(transfer) u rel(PTB) u rel(homog.)
CCPR-KCRV 0.0000 1.8E-03EURAMET-RV 0.0000 3.4E-03
BIM 0.00009 0.0004 0.03 1.5E-02 7.5E-03 5.8E-04 5.8E-04 3.6E-04
BelGIM -0.00077 -0.0053 0.67 7.2E-03 3.3E-03 5.8E-04 5.8E-04 1.2E-03
SP 0.00003 -0.0061 0.62 9.3E-03 4.0E-03 5.8E-04 5.8E-04 2.2E-03
UME -0.00031 0.0043 0.28 1.5E-02 7.5E-03 5.8E-04 5.8E-04 1.0E-03
BEV 0.00017 -0.0026 0.23 1.1E-02 5.5E-03 5.8E-04 5.8E-04 1.4E-03
VSL 0.00158 -0.0054 0.75 6.4E-03 2.9E-03 5.8E-04 5.8E-04 1.0E-03
CMI 0.00270 -0.0010 0.12 8.0E-03 3.8E-03 5.8E-04 5.8E-04 9.0E-04
IPQ 0.00030 0.0057 0.35 1.6E-02 8.0E-03 5.8E-04 5.8E-04 5.2E-04
DMDM 0.00060 0.0022 0.18 1.2E-02 6.0E-03 5.8E-04 5.8E-04 1.5E-03
GUM -0.00019 0.0033 0.29 1.1E-02 5.6E-03 5.8E-04 5.8E-04 4.4E-04
INM 0.00088 -0.0021 0.15 1.4E-02 6.5E-03 5.8E-04 5.8E-04 2.3E-03
SMU 0.00578 0.0042 0.53 7.2E-03 3.5E-03 5.8E-04 5.8E-04 2.4E-04
MIKES 0.00003 -0.0032 0.58 4.4E-03 1.9E-03 5.8E-04 5.8E-04 8.0E-04 The numerical result is presented in Fig. 5. On the left, the two RV from the CCPR and this EURAMET KC are shown and, to the right, the DOEs of the participants and as bars the expanded associated uncertainties are drawn. Obviously, the DOEs are well localised near the centre-line representing the RV and the intervals of the expanded uncertainties includes the RV for all participants, which can be seen as the graphical meaning of the NE -criteria.
-0.030
-0.020
-0.010
0.000
0.010
0.020
0.030
CC
PR
-KC
RV
EU
RA
ME
T-R
V
BIM
Bel
GIM SP
UM
E
BE
V
VS
L
CM
I
IPQ
DM
DM
GU
M
INM
SM
U
MIK
ES
Fig. 5 Degrees of equivalence to EURAMET-RV; Bars represent expanded uncertainties for the participants; Blue square refer to the CCPR-KCRV, while the black dots show the results in this EURAMET key comparison

24
4.4 Determination of Mutual DOE The single DOE ( ) RR xxxD ii −= for the equivalence of a participant’s luminous
intensity value with the RV is less important than the values of the mutual equivalences ( ) RxxxDDD jijiij −=−= to the other participants. The normalisation of all luminous intensities with the RV with a value 1R ≅x leads to expanded uncertainties
( ) ( ) ( ) ( ) ( )R2222 xuDDDuDuDu jijiij ⋅−++= associated with the mutual equivalences ijD .
The term ( ) ( )R22
xuDD ji ⋅− accounting for the contribution of the uncertainty associated
with the RV is negligible, as known from other key comparisons. Table 6 shows in the columns 2 and 3 the single DOEs with associated expanded uncertainties copied from Table 5 and, in the columns to the right, the matrix of the mutual DOEs jiij DDD −= with the associated expanded 2=k uncertainties
( ) ( ) ( )jiij DuDukDU 22 += .

25
Table 6 Matrix of mutual DOEs with associated expanded uncertainties Matrix of equivalence 1/2 Lab j →Lab i
↓ Di / 10 -2 Ui / 10 -2 Dij / 10 -2 Uij / 10 -2 Dij / 10 -2 Uij / 10 -2 Dij / 10 -2 Uij / 10 -2 Dij / 10 -2 Uij / 10 -2 Dij / 10 -2 Uij / 10 -2 Dij / 10 -2 Uij / 10 -2 Dij / 10 -2 Uij / 10 -2
BIM 0.04 1.5 0.57 1.66 0.65 1.76 -0.39 2.12 0.30 1.86 0.58 1.63 0.14 1.70BelGIM -0.53 0.72 -0.57 1.66 0.08 1.18 -0.96 1.66 -0.27 1.31 0.01 0.96 -0.43 1.08SP -0.61 0.93 -0.65 1.76 -0.08 1.18 -1.04 1.76 -0.35 1.44 -0.07 1.13 -0.51 1.23UME 0.43 1.5 0.39 2.12 0.96 1.66 1.04 1.76 0.69 1.86 0.97 1.63 0.53 1.70BEV -0.26 1.1 -0.30 1.86 0.27 1.31 0.35 1.44 -0.69 1.86 0.28 1.27 -0.16 1.36VSL -0.54 0.64 -0.58 1.63 -0.01 0.96 0.07 1.13 -0.97 1.63 -0.28 1.27 -0.44 1.02CMI -0.10 0.80 -0.14 1.70 0.43 1.08 0.51 1.23 -0.53 1.70 0.16 1.36 0.44 1.02IPQ 0.57 1.6 0.53 2.19 1.10 1.75 1.18 1.85 0.14 2.19 0.83 1.94 1.11 1.72 0.67 1.79DMDM 0.22 1.2 0.18 1.92 0.75 1.40 0.83 1.52 -0.21 1.92 0.48 1.63 0.76 1.36 0.32 1.44GUM 0.33 1.1 0.29 1.86 0.86 1.31 0.94 1.44 -0.10 1.86 0.59 1.56 0.87 1.27 0.43 1.36INM -0.21 1.4 -0.25 2.05 0.32 1.57 0.40 1.68 -0.64 2.05 0.05 1.78 0.33 1.54 -0.11 1.61SMU 0.42 0.72 0.38 1.66 0.95 1.02 1.03 1.18 -0.01 1.66 0.68 1.31 0.96 0.96 0.52 1.08MIKES -0.32 0.44 -0.36 1.56 0.21 0.84 0.29 1.03 -0.75 1.56 -0.06 1.18 0.22 0.78 -0.22 0.91
UME BEV VSL CMIBIM BelGIM SP
Matrix of equivalence 2/2 Lab j →Lab i
↓ Di / 10 -2 Ui / 10 -2 Dij / 10 -2 Uij / 10 -2 Dij / 10 -2 Uij / 10 -2 Dij / 10 -2 Uij / 10 -2 Dij / 10 -2 Uij / 10 -2 Dij / 10 -2 Uij / 10 -2 Dij / 10 -2 Uij / 10 -2
BIM 0.04 1.5 -0.53 2.19 -0.18 1.92 -0.29 1.86 0.25 2.05 -0.38 1.66 0.36 1.56BelGIM -0.53 0.72 -1.10 1.75 -0.75 1.40 -0.86 1.31 -0.32 1.57 -0.95 1.02 -0.21 0.84SP -0.61 0.93 -1.18 1.85 -0.83 1.52 -0.94 1.44 -0.40 1.68 -1.03 1.18 -0.29 1.03UME 0.43 1.5 -0.14 2.19 0.21 1.92 0.10 1.86 0.64 2.05 0.01 1.66 0.75 1.56BEV -0.26 1.1 -0.83 1.94 -0.48 1.63 -0.59 1.56 -0.05 1.78 -0.68 1.31 0.06 1.18VSL -0.54 0.64 -1.11 1.72 -0.76 1.36 -0.87 1.27 -0.33 1.54 -0.96 0.96 -0.22 0.78CMI -0.10 0.80 -0.67 1.79 -0.32 1.44 -0.43 1.36 0.11 1.61 -0.52 1.08 0.22 0.91IPQ 0.57 1.6 0.35 2.00 0.24 1.94 0.78 2.13 0.15 1.75 0.89 1.66DMDM 0.22 1.2 -0.35 2.00 -0.11 1.63 0.43 1.84 -0.20 1.40 0.54 1.28GUM 0.33 1.1 -0.24 1.94 0.11 1.63 0.54 1.78 -0.09 1.31 0.65 1.18INM -0.21 1.4 -0.78 2.13 -0.43 1.84 -0.54 1.78 -0.63 1.57 0.11 1.47SMU 0.42 0.72 -0.15 1.75 0.20 1.40 0.09 1.31 0.63 1.57 0.74 0.84MIKES -0.32 0.44 -0.89 1.66 -0.54 1.28 -0.65 1.18 -0.11 1.47 -0.74 0.84
MIKESINMIPQ DMDM GUM SMU

26
4.5 Literature [1] Mutual recognition arrangement (CIPM-MRA),
http://www.bipm.org/en/cipm-mra (accessed February 1 2013) [2] BIPM database,
http://kcdb.bipm.org/appendixB/default.asp (accessed February 1 2013) [3] SAUTER, Georg ; LINDNER, Detlef ; LINDEMANN, Matthias:
CCPR Key Comparison K3.a of Luminous Intensity and K4 of Luminous Flux with Lamps as Transfer Standards, PTB-Opt-62, 1999. - ISBN 3-89701-471-8
[4] ISO/IEC/EN 17025. General Requirements for the Competence of Calibration and Testing Laboratories
[5] ISO. Guide to the Expression of Uncertainty in Measurement (GUM), http://www.bipm.org/en/publications/guides/gum.html (accessed Febr. 1 2013)
[6] KACKER, R. , DATLA, R. , PARR, A.: Combined result and associated uncertainty from interlaboratory evaluations based on the ISO Guide,
Metrologia, 2002, 39, 279-293

27
Annex A
A 1 PTB Measurement Equation for Luminous Intensity At the PTB, the luminous intensity iI of all the lamps was measured by substitution method under "constant" conditions. Its value is calculated from a factor 0f multiplied with the photocurrent iy of a photometer in illuminance mode. Within the relative combined standard uncertainty ( )0rel fu , at a defined distribution temperature of the lamp under test, the factor 0f is independent of individual lamps.
ii yfI ⋅= 0 ( ) %058.00rel =fu (A1)
Let nk ≤≤1 be the number of the participants and similarly knj ≤≤1 the number of transfer standards of the participant k . At the PTB, the photocurrent iy for one measurement is averaged from 15 readings and for each lamp 41 =≤≤ ri measurements are averaged to get the PTB value of luminous intensity ( )0
, jkI having a relative standard uncertainty ( )( )0
,rel jkIu "of the mean".
( ) ( )r
y
fyfI
r
ii
jkjk
∑=⋅=⋅= 1
00,0
0, ( )( )
( )( )( ) rr
yyIu
r
ijki
jk ⋅−
−=∑
=
1
11
20,
0,
2rel (A2)
Each participant reported two values ( )i, jkI and ( )r
, jkI from “initial“ and “return” measurements for one lamp. The mean of these two values is divided by the PTB-value and calculated as lamp ratio jkv , for the j-th lamp of the k-th participant. The related standard uncertainty is calculated as a combination from the reproducibility stated by the participant and the repeatability in Equ. (A2) found at the PTB.
( ) ( )
( )0,
r,
i,
, 2 jk
jkjkjk
I
IIv
⋅+
= ( )( ) ( )
( ) ( )( )( )0,
2rel
2
r,
i,
r,
i,
,2rel jk
jkjk
jkjkjk Iu
II
IIvu +
+−
= (A3)
All lamp ratios determined for one participant are averaged to the batch ratio vk with a related relative variance taken as squared uncertainty ( )kvu2
rel "of the mean".
∑=
=kn
jjk
kk v
nv
1,
1 ( ) ( ) ( )∑=
−⋅−
=kn
jkjk
kkk vv
nnvu
1
2,
2rel 1
1 (A4)
A 2 Measurement Uncertainties The uncertainty statement of the participants was divided into two parts dealing with the uncertainty of:
- the realization, including the maintenance since that time ( )unitrelu , - the transfer of the maintained unit to the pilot laboratory ( )transferrelu .
Similarly, at the pilot laboratory, two sources of uncertainty have to be regarded: - the homogeneity of a batch of lamps of a participant ( )homog.relu , - the stability or repeatability of measurements at the laboratory ( )PTBrelu .
The homogeneity is calculated individually for each batch of a participant according to Equ. (A4) and the repeatability is found as a type B uncertainty from the results between the two photometers used and the stability found with the batches of monitor lamps, it is stated as relative expanded uncertainty in the following equation.

28
( ) ( ) ( ) ( ) ( ) ( ) 2withPTBhomog.transferunitbatchbatch 2rel
2rel
2rel
2relrel =+++⋅=≡ kuuuukUU (A5)
The relative uncertainties mentioned above and ( )batchU are listed in the Tables 4 and 5. The expanded uncertainties ( )batchU are also used in Fig. 4 and 5. The inverse square law combines the illuminance ( )TE of a radiation characterised by distribution temperature T and the luminous intensity ( )TI of a lamp. This illuminance generates a photocurrent y′ of a photometer with responsivity ( )tTs ,v if operated at a distance d . To correct for a possible drift of the responsivity, the time t is included in the list of variables and, for consistency of the units on both sides of the equation, the unit of solid angle 1sr10 ==Ω is added.
( ) ( ) ( )tTs
y
dTITE
,v20 ′
=⋅= Ω (A6)
To avoid any confusion with luminous intensity symbolised by the character “ I ”, in this report, the lamp current is symbolised by the character “ J ”. Luminous intensity I , distribution temperature T and lamp voltage U of incandescent lamps vary with the lamp current according to the following equations with the exponents UTI mmm ,, .
( ) ( ) ( ) ( )UTI mmm
TJ
JUU
TJ
JTT
TJ
JTII
′⋅=′
′⋅=′
′⋅=′ ;; (A7)
At the PTB, the readings J of the lamp current are adjusted (or corrected) to exactly match the values ( )TJ given by the participant, but the lamp current may differ by a factor Jc due to measurement errors (shunt resistance, DVM calibration).
JcJ J ⋅=′ (A8)
The distance between lamp and photometer is determined as the sum of three parts. The dominant part is the distance 0d between the two reference planes for the limiting aperture of the photometer head and for the filament of the lamp. Any misalignment 0∆ dp << of the head is constant and can be taken as included in 0d , while any misalignment 0∆ dl << of an individual lamp has to be taken into account.
( )00 ∆1 dldd +⋅= (A9)
The responsivity ( )tTs ,v of a photometer head is constant vs with two correction factors: for a possible drift (linear approach) up to the time t and due to mismatch errors depending on the distribution temperature T (exponent m for the ratio of that distribution temperature and CIE Illuminant A, referenced by AT ).
( ) ( )m
T
TtastTs
−
⋅⋅+⋅=
Avv 1, (A10)
The luminous intensity ′I is found by combination of the equations stated above.
( )y
T
T
ta
cdl
s
dI
mmmmJ
TI
⋅
⋅
⋅+⋅+
⋅⋅
=′⋅+
A
20
v0
20
1
∆1
Ω (A11)
Due to the arbitrary value of the responsivity, the first factor has an arbitrary value, too, but is constant, while the last term - the photocurrent - is strongly dependent on the luminous intensity of the individual lamp. The two more factors in between are for correction purposes having values very close to unity. They are discussed below:

29
Distance: At the PTB, the repeatability to align the location of a lamp is within mm3.0∆ ≤l , an interval with rectangular probability distribution, while the distance was
set to m60 =d . Thus, the relative uncertainty of the luminous intensity due to the distance measurement is calculated from:
( )( ) ( )%003.0
12
∆2∆
20
rel =⋅
=dl
lIu . (A12)
Lamp current: The transfer standards are incandescent lamps with values of the exponents 7.0=Tm and 7=Im varying for individual lamps by less than 10 % and the photometer used at the PTB have a mismatch index of 01.0≤m . From these values, the product Tmm⋅ in Equ. (A11) is negligible compared to Im . During the comparison, the equipment (DVM, shunt resistor) at the PTB for the measurement of the lamp current was tested to be stable within 0.01 % - an interval with rectangular probability distribution. Due to the final normalization of all ratios, in the first order, the correction factor Jc cancels out and as second order, the variation of Im has to be regarded. The relative uncertainty of the luminous intensity due to the lamp current measurement is calculated from:
( )( ) ( )( )%004.0
12
1.0 2rel
rel =⋅⋅= JIJ
cumcIu . (A13)
Distribution temperature: At the PTB, the distribution temperature T of each transfer standard lamp was measured and the mismatch correction was applied. Due to the final normalization, neither the uncertainty of the distribution temperature scale nor the uncertainty of the mismatch index have to be regarded. Calculated as a second order effect for a distribution temperature up to an uncertainty of K∆ 20≤Τ - an interval with rectangular probability distribution - the luminous intensity will be affected to a small extent.
( )( ) ( )%002.0
122856∆
∆
2
rel =⋅= TmTIu . (A14)
Drift of photometers: The stability of the photometers (i.e. the stability of the measurement setup for luminous intensity at PTB, see Fig. 3) was tested periodically by groups of "monitor lamps". The campaign for the measurement of luminous intensity lasted for only four weeks and no change of the photometers was found within the relative uncertainty of these measurements. Therefore, no correction for a drift of the photometer was applied, but the limited repeatability of the readings for the monitor lamps has to be taken into account. It is found within the limits stated below (rectangular distribution):
( )( ) %058.03001.0rel ==⋅ taIu (A15)
In Equ. (A11), the luminous intensity is calculated from the photocurrent multiplied with a constant factor 0f , having a relative combined uncertainty ( )0rel fu calculated from the contributions stated above.
yfI ⋅= 0 ( ) %058.00rel =fu (A16)

30
A 3 The NE -Criterion The NE -criterion is calculated as the ratio of the absolute value of the relative difference ( ) RR xxxx i −=∆ of a luminous intensity contribution ix from the average Rx divided by the expanded uncertainty ( )xU ∆ of this difference.
( ) 1N ≤=xU
xE
∆∆ (A17)
A 4 The Birge-Ratio Assume, a quantity was measured several times ni ≤≤1 with values ix and with associated standard uncertainties iu then the weighted mean Rx is associated with
the so called internal uncertainty ( )∑=i iuu 2
int 11 . The external uncertainty associated
with the weighted mean is originated from the individual contributions ix and their
weights and evaluated as ( )( ) ( ) ( )( )∑∑ −−=i ii ii unuxxu 22
Rext 11 . The Birge-ratio
1intextB ≈= uuR compares the consistency of internal and external uncertainties [6].
( )( )
( )1
2R
int
extB −
−== ∑
n
uxx
u
uR i ii (A18)
Provided the stated uncertainties are too small for the scatter of the weighted contributions, then the Birge-ratio exceeds a value of unity. Thus, the Birge-ratio indicates whether stated uncertainties are realistic. The Birge-ratio was not applicable for the participants results, their contributions are averaged without weights. The Birge-ratio was determined for the contributions of the link laboratories as basis for the evaluation of the EURAMET-RV. It was found to be less than unity, so the internal uncertainty multiplied by 2=k is stated as the expanded uncertainty associated with the EURAMET-RV.
Annex B The entries in the highlighted fields of the following tables are thoroughly approved and finally accepted by the participants.
B 1 Data Collected from the Three Link Laboratories The following 3 Tables document and evaluate all measured data for the lamp-transfer-standards of the three link laboratories. The meaning of the entries is given in chapter 3.2 and the principle equations for the calculations are explained in Annex A.

31
B 1.1 Link Laboratory PTB Luminous Intensity KC: EURAMET.PR-K3.a NMI: PTB
A B C D E F
1 date version of draft mean-values are calculated as: reference for normalisation is:
2 23.1.13 DAV8k2 arithmetic mean norm= EURAMET-RV
3
4 U L I L
5 NMI / PTB rel.std.dev. norm. ratio rel.std.dev.6 1.00006 7.0E-05 0.9970 1.5E-047 Uncertainties of NMI (k =1) 1.00006 6.1E-05 0.9970 9.6E-05
8 u c,rel(J L) nominal 1.00004 4.0E-05 0.9969 2.7E-04
9 u c,rel(U L) 1.2E-04 1.00004 4.6E-05 0.9975 4.5E-04
10 u c,abs(T NMI) 10 K 1.00004 3.9E-05 0.9968 3.2E-04
11 u c,rel(I L) 1.8E-03 1.00003 3.0E-05 0.9967 4.1E-04
12 13
14 means of participant: 1.00005 5.6E-06 0.9970 1.2E-041516 data collection U / V rel.std.dev. I / cd rel.std.dev. burn.time / min
17 U L,NMI #1 I L,NMI #118 lamp number #2 #219 operation. cond. mean U L,NMI mean I L,NMI
20 J L / A U L,NMI /U L,PTB #1 I L,NMI /I L,norm #121 T NMI / K #2 #222 warm-up / min #3 #323 T PTB / K #4 #424 u rel(J L) mean ratio U L ave.rel.std.dev. mean ratio I ave.rel.std.dev. total at PTB
27.847 195.76260S 27.843 195.78
a 27.845 6.4E-05 195.77 5.2E-055.5000 1.00003 2.8E-07 0.9967 6.2E-052740 1.00001 3.5E-07 0.9970 1.1E-04 1512 1.00012 6.1E-07 0.9971 6.4E-05
2740 1.00010 3.1E-07 0.9974 8.8E-05 15
1.29E-07 1.00006 2.6E-05 0.9970 1.4E-04 3027.952 197.92
264S 27.949 197.95
a 27.951 6.0E-05 197.94 8.8E-055.5000 1.00005 3.8E-07 0.9969 5.7E-052750 1.00004 3.7E-07 0.9970 1.1E-04 1612 1.00008 3.1E-07 0.9970 7.1E-05
2750 1.00006 7.3E-07 0.9971 1.5E-04 15
1.20E-07 1.00006 8.5E-06 0.9970 3.9E-05 3125.536 142.14
B11S 25.534 142.21
a 25.535 4.0E-05 142.18 2.3E-045.2000 1.00003 4.2E-07 0.9965 9.2E-052605 1.00002 3.1E-07 0.9972 1.7E-04 1512 1.00006 3.5E-07 0.9968 1.0E-04
2605 1.00004 2.9E-07 0.9969 8.3E-05 15
1.49E-07 1.00004 8.0E-06 0.9969 1.3E-04 3025.845 138.11
B22S 25.843 137.98
a 25.844 4.4E-05 138.05 4.5E-045.2000 1.00003 2.5E-07 0.9975 7.8E-052612 1.00002 2.7E-07 0.9976 1.1E-04 1612 1.00006 2.2E-07 0.9975 1.1E-04
2612 1.00006 3.1E-07 0.9976 1.5E-04 15
1.45E-07 1.00004 1.1E-05 0.9975 2.2E-05 3127.413 171.35
B33S 27.411 171.45
a 27.412 3.6E-05 171.40 3.0E-045.4000 1.00002 7.5E-06 0.9965 7.4E-052675 1.00000 7.6E-06 0.9969 1.6E-04 1612 1.00006 4.9E-06 0.9968 8.1E-05
2675 1.00006 6.5E-06 0.9971 1.4E-04 15
2.75E-07 1.00004 1.5E-05 0.9968 1.2E-04 3127.378 176.77
B44S 27.377 176.91
a 27.377 3.0E-05 176.84 4.0E-045.4000 1.00003 4.0E-07 0.9966 7.1E-052688 1.00002 5.3E-07 0.9968 1.7E-04 1612 1.00003 3.5E-07 0.9966 8.5E-05
2688 1.00003 2.3E-07 0.9969 1.1E-04 15
1.51E-07 1.00003 2.4E-06 0.9967 7.1E-05 31
32
B 1.2 Link Laboratory LNE-CNAM Luminous Intensity KC: EURAMET.PR-K3.a NMI: LNE-CNAM
A B C D E F
1 date version of draft mean-values are calculated as: reference for normalisation is:
2 23.1.13 DAV8k2 arithmetic mean norm= EURAMET-RV
3
4 U L I L
5 NMI / PTB rel.std.dev. norm. ratio rel.std.dev.6 1.00020 7.1E-05 1.0095 1.3E-037 Uncertainties of NMI (k =1) 1.00155 4.3E-04 1.0136 1.5E-03
8 u c,rel(J L) nominal 1.00006 7.3E-05 1.0109 4.2E-04
9 u c,rel(UL) 1.00000 6.9E-05 1.0096 8.1E-05
10 u c,abs(T NMI) 15 K 1.00167 2.0E-04 1.0097 4.0E-04
11 u c,rel(I L) 5.1E-03 0.99920 3.1E-04 1.0089 3.6E-04
12 0.99929 3.4E-04 1.0111 9.4E-0413 0.99827 3.4E-04 1.0085 6.8E-04
14 means of participant: 1.00003 4.1E-04 1.0102 5.8E-041516 data collection U / V rel.std.dev. I / cd rel.std.dev. burn.time / min
17 U L,NMI #1 I L,NMI #118 lamp number #2 #219 operation. cond. mean UL,NMI mean I L,NMI
20 J L / A U L,NMI /U L,PTB #1 I L,NMI /I L,norm #121 T NMI / K #2 #222 warm-up / min #3 #323 T PTB / K #4 #424 u rel(J L) mean ratio U L ave.rel.std.dev. mean ratio I ave.rel.std.dev. total at PTB
28.934 235.0926 28.930 235.6
a 28.932 6.9E-05 235.30 1.3E-035.6900 1.00017 2.5E-07 1.0089 1.4E-042796 1.00017 3.2E-07 1.0092 1.1E-04 1815 1.00022 6.4E-07 1.0099 8.4E-05
2789 1.00023 2.0E-07 1.0100 1.4E-04 20
1.41E-07 1.00020 1.5E-05 1.0095 2.7E-04 3828.929 238.0
927 28.952 238.7
a 28.941 4.0E-04 238.35 1.5E-035.6900 1.00129 2.6E-07 1.0131 8.2E-052795 1.00127 2.9E-07 1.0136 9.0E-05 1715 1.00182 2.9E-07 1.0135 1.4E-04
2786 1.00181 1.9E-07 1.0142 1.2E-04 19
1.35E-07 1.00155 1.5E-04 1.0136 2.2E-04 3629.044 240.5
936 29.048 240.5
a 29.046 6.9E-05 240.50 2.0E-055.6900 1.00002 2.7E-07 1.0100 5.2E-052799 1.00002 2.5E-07 1.0103 1.3E-04 1715 1.00010 2.0E-07 1.0115 7.0E-05
2792 1.00010 2.1E-07 1.0117 1.3E-04 17
1.32E-07 1.00006 2.5E-05 1.0109 4.2E-04 3428.917 238.9
963 28.913 238.9
a 28.915 6.9E-05 238.90 3.0E-055.6900 1.00000 3.3E-07 1.0095 9.9E-052802 0.99999 2.9E-07 1.0098 2.0E-04 1815 1.00001 2.8E-07 1.0096 6.4E-05
2815 1.00000 1.8E-07 1.0096 7.3E-05 17
1.44E-07 1.00000 4.6E-06 1.0096 7.5E-05 3511.921 396.2
A430 11.925 396.3
b1 11.923 1.7E-04 396.25 1.3E-0425.0000 1.00184 1.7E-05 1.0100 1.5E-04
2815 1.00185 2.7E-05 1.0104 2.1E-04 1715 1.00145 2.5E-05 1.0086 2.0E-04
2812 1.00154 2.6E-05 1.0098 3.2E-04 40
1.20E-06 1.00167 1.0E-04 1.0097 3.8E-04 5711.854 389.0
A431 11.861 389.0
b1 11.858 3.0E-04 389.00 3.2E-0525.0000 0.99939 3.1E-05 1.0098 3.3E-04
2804 0.99909 4.3E-05 1.0091 2.5E-04 1715 0.99926 2.8E-05 1.0082 2.2E-04
2801 0.99907 2.6E-05 1.0084 3.5E-04 17
1.30E-06 0.99920 7.7E-05 1.0089 3.5E-04 3411.974 389.9
A434 11.982 390.6
b1 11.978 3.3E-04 390.25 9.0E-0425.0000 0.99933 3.0E-05 1.0107 2.1E-04
2807 0.99931 3.3E-05 1.0106 2.4E-04 2015 0.99918 5.6E-05 1.0118 2.8E-04
2806 0.99933 2.6E-05 1.0114 2.8E-04 17
1.12E-06 0.99929 3.7E-05 1.0111 2.9E-04 3711.941 395.0
A447 11.949 395.5
b1 11.945 3.3E-04 395.25 6.3E-0425.0000 0.99834 2.3E-05 1.0080 3.4E-04
2813 0.99836 2.7E-05 1.0081 2.7E-04 1915 0.99822 2.4E-05 1.0090 1.9E-04
2810 0.99817 2.3E-05 1.0087 2.0E-04 18
1.03E-06 0.99827 4.7E-05 1.0085 2.4E-04 37

33
B 1.3 Link Laboratory INRIM Luminous Intensity KC: EURAMET.PR-K3.a NMI: INRIM
A B C D E F
1 date version of draft mean-values are calculated as: reference for normalisation is:
2 23.1.13 DAV8k2 arithmetic mean norm= EURAMET-RV
3
4 U L I L
5 NMI / PTB rel.std.dev. norm. ratio rel.std.dev.6 1.00005 1.8E-05 0.9932 6.5E-047 Uncertainties of NMI (k =1) 1.00007 4.9E-05 0.9940 7.8E-04
8 u c,rel(J L) nominal 1.00003 5.1E-05 0.9934 4.9E-04
9 u c,rel(U L) 2.3E-04 1.00032 2.8E-04 0.9936 7.6E-04
10 u c,abs(T NMI) 12 K 1.00014 1.4E-04 0.9958 2.0E-03
11 u c,rel(I L) 4.6E-03 1.00007 1.6E-04 0.9946 9.1E-04
12 13
14 means of participant: 1.00011 4.5E-05 0.9941 4.0E-041516 data collection U / V rel.std.dev. I / cd rel.std.dev. burn.time / min
17 U L,NMI #1 I L,NMI #118 lamp number #2 #219 operation. cond. mean U L,NMI mean I L,NMI
20 J L / A U L,NMI /U L,PTB #1 I L,NMI /I L,norm #121 T NMI / K #2 #222 warm-up / min #3 #323 T PTB / K #4 #424 u rel(J L) mean ratio U L ave.rel.std.dev. mean ratio I ave.rel.std.dev. total at PTB
29.523 261.2888 29.524 261.5
a 29.524 1.7E-05 261.35 5.7E-045.7802 1.00006 3.9E-07 0.9927 6.3E-052841 1.00005 5.1E-07 0.9926 1.0E-04 1812 1.00004 3.0E-07 0.9936 9.0E-05
2844 1.00004 2.7E-07 0.9938 1.4E-04 23
1.24E-07 1.00005 5.6E-06 0.9932 3.1E-04 4129.806 262.9
893 29.808 263.2
a 29.807 3.4E-05 263.05 5.7E-045.8303 1.00014 2.1E-07 0.9949 8.2E-052849 1.00012 2.7E-07 0.9950 9.6E-05 1712 1.00002 4.0E-07 0.9930 9.4E-05
2847 1.00001 2.6E-07 0.9932 1.1E-04 38
1.22E-07 1.00007 3.5E-05 0.9940 5.3E-04 5529.556 269.4
904 29.553 269.3
a 29.555 5.1E-05 269.35 1.9E-045.7802 1.00002 2.8E-07 0.9925 8.1E-052850 1.00001 2.5E-07 0.9927 1.3E-04 1812 1.00004 2.6E-07 0.9940 5.4E-05
2848 1.00003 2.8E-07 0.9943 1.5E-04 18
1.31E-07 1.00003 7.0E-06 0.9934 4.5E-04 3628.287 217.3
139 28.271 217.6
a 28.279 2.8E-04 217.45 6.9E-045.6401 1.00032 2.3E-07 0.9929 1.7E-042783 1.00032 3.5E-07 0.9931 1.3E-04 1712 1.00033 3.4E-07 0.9941 8.9E-05
2783 1.00032 2.9E-07 0.9942 1.0E-04 18
1.33E-07 1.00032 6.8E-07 0.9936 3.3E-04 3528.373 225.9
199 28.365 225.0
a 28.369 1.4E-04 225.45 2.0E-035.6352 1.00013 3.0E-07 0.9951 8.8E-052789 1.00013 1.9E-07 0.9950 1.3E-04 1712 1.00015 3.3E-07 0.9965 7.2E-05
2785 1.00014 2.7E-07 0.9966 7.2E-05 18
1.31E-07 1.00014 5.4E-06 0.9958 4.4E-04 3528.129 222.6
159 28.120 222.2
a1 28.125 1.6E-04 222.40 9.0E-045.6202 1.00007 3.4E-07 0.9945 1.1E-042787 1.00007 1.8E-07 0.9945 8.3E-05 2012 1.00006 2.9E-07 0.9948 9.9E-05
2784 1.00006 3.0E-07 0.9949 7.1E-05 18
1.27E-07 1.00007 3.0E-06 0.9946 1.1E-04 38

34
B 2 Data Collected from the Thirteen Participating NMIs
B 2.1 NMI Laboratory BIM
Luminous Intensity KC: EURAMET.PR-K3.a NMI: BIM
A B C D E F
1 date version of draft mean-values are calculated as: reference for normalisation is:
2 23.1.13 DAV8k2 arithmetic mean norm= EURAMET-RV
3
4 U L I L
5 NMI / PTB rel.std.dev. norm. ratio rel.std.dev.6 1.00009 3.8E-05 1.0011 1.2E-037 Uncertainties of NMI (k =1) 1.00015 7.7E-05 1.0009 4.6E-04
8 u c,rel(J L) nominal 1.00012 1.3E-04 0.9999 1.3E-04
9 u c,rel(U L) 1.5E-04 1.00000 2.9E-05 0.9996 9.1E-04
10 u c,abs(T NMI) 11.55 K
11 u c,rel(I L) 7.5E-03
12 13
14 means of participant: 1.00009 3.3E-05 1.00036 3.6E-041516 data collection U / V rel.std.dev. I / cd rel.std.dev. burn.time / min
17 U L,NMI #1 I L,NMI #118 lamp number #2 #219 operation. cond. mean U L,NMI mean I L,NMI
20 J L / A U L,NMI /U L,PTB #1 I L,NMI /I L,norm #121 T NMI / K #2 #222 warm-up / min #3 #323 T PTB / K #4 #424 u rel(J L) mean ratio U L ave.rel.std.dev. mean ratio I ave.rel.std.dev. total at PTB
29.3668 230.27305 29.3646 229.75
a 29.3657 3.7E-05 230.01 1.1E-035.61539 1.00008 4.3E-07 1.0004 6.5E-05
2795 1.00007 4.6E-07 1.0003 1.3E-04 1812 1.00010 6.2E-07 1.0016 9.1E-05
2795 1.00010 5.1E-07 1.0020 1.3E-04 45
1.26E-07 1.00009 7.2E-06 1.0011 4.2E-04 6329.2066 230.70
348 29.2021 230.49
a 29.2044 7.7E-05 230.60 4.6E-045.62422 1.00016 5.2E-07 1.0007 1.1E-04
2795 1.00015 4.5E-07 1.0009 1.2E-04 1812 1.00015 5.0E-07 1.0010 7.4E-05
2794 1.00014 4.7E-07 1.0008 1.7E-04 17
1.25E-07 1.00015 4.2E-06 1.0009 4.4E-05 3529.1848 231.28
369 29.1775 231.25
a 29.1812 1.3E-04 231.27 6.7E-055.57789 1.00011 6.1E-07 0.9999 7.7E-05
2795 1.00010 7.2E-07 0.9997 1.0E-04 1712 1.00013 5.3E-07 1.0000 9.4E-05
2792 1.00013 3.9E-07 1.0002 1.5E-04 18
1.15E-07 1.00012 6.9E-06 0.9999 1.2E-04 3529.1048 227.70
380 29.1034 227.29
a 29.1041 2.4E-05 227.50 9.0E-045.61538 1.00003 5.0E-07 0.9996 9.3E-05
2795 1.00002 3.6E-07 0.9998 1.2E-04 1712 0.99997 5.0E-07 0.9994 6.6E-05
2790 0.99996 4.8E-07 0.9996 7.8E-05 17
1.28E-07 1.00000 1.6E-05 0.9996 9.0E-05 34

35
B 2.2 NMI Laboratory BelGIM Luminous Intensity KC: EURAMET.PR-K3.a NMI: BelGIM
A B C D E F
1 date version of draft mean-values are calculated as: reference for normalisation is:
2 23.1.13 DAV8k2 arithmetic mean norm= EURAMET-RV
3
4 U L I L
5 NMI / PTB rel.std.dev. norm. ratio rel.std.dev.6 0.99977 1.2E-05 0.9972 1.8E-047 Uncertainties of NMI (k =1) 0.99960 1.6E-04 0.9953 1.1E-03
8 u c,rel(J L) nominal 0.99963 7.7E-05 0.9947 1.4E-04
9 u c,rel(U L) 1.1E-04 0.99793 7.1E-05 0.9915 6.6E-04
10 u c,abs(T NMI) 30K
11 u c,rel(I L) 3.3E-03
12 13
14 means of participant: 0.99923 4.4E-04 0.9947 1.2E-031516 data collection U / V rel.std.dev. I / cd rel.std.dev. burn.time / min
17 U L,NMI #1 I L,NMI #118 lamp number #2 #219 operation. cond. mean U L,NMI mean I L,NMI
20 J L / A U L,NMI /U L,PTB #1 I L,NMI /I L,norm #121 T NMI / K #2 #222 warm-up / min #3 #323 T PTB / K #4 #424 u rel(J L) mean ratio U L ave.rel.std.dev. mean ratio I ave.rel.std.dev. total at PTB
41.000 114.09123 41.000 114.1
c 41.000 8.8E-08 114.095 4.5E-051.8850 0.99974 5.5E-07 0.9974 9.6E-052856 0.99977 5.2E-07 0.9975 1.1E-04 3015 0.99978 7.9E-07 0.9970 5.5E-05
2863 0.99980 3.7E-07 0.9968 7.7E-05 17
1.63E-07 0.99977 1.2E-05 0.9972 1.7E-04 4740.050 111.7
140 40.062 111.7
c 40.056 1.5E-04 111.70 1.6E-051.8670 0.99947 7.4E-07 0.9972 8.8E-052856 0.99949 5.2E-07 0.9974 1.2E-04 1815 0.99971 4.2E-07 0.9934 6.8E-05
2858 0.99972 3.5E-07 0.9934 1.4E-04 17
1.65E-07 0.99960 6.8E-05 0.9953 1.1E-03 3540.100 109.24
141 40.106 109.25
c 40.103 7.5E-05 109.245 4.7E-051.8670 0.99960 3.7E-07 0.9944 1.4E-042856 0.99960 5.1E-07 0.9946 1.1E-04 1815 0.99966 3.8E-07 0.9950 9.7E-05
2858 0.99966 2.7E-07 0.9948 1.2E-04 17
1.56E-07 0.99963 1.7E-05 0.9947 1.4E-04 3541.800 115.9
129 41.801 115.9
c 41.800 7.2E-06 115.90 2.5E-051.8850 0.99779 8.5E-07 0.9903 7.6E-052856 0.99784 6.5E-07 0.9903 1.6E-04 4515 0.99805 4.5E-07 0.9926 5.2E-05
2871 0.99806 4.2E-07 0.9926 6.4E-05 38
1.41E-07 0.99793 7.1E-05 0.9915 6.6E-04 83
134 Results of the lamp excluded by participant
c1.8910285615
2861
1.39E-07

36
B 2.3 NMI Laboratory SP
Luminous Intensity KC: EURAMET.PR-K3.a NMI: SP
A B C D E F
1 date version of draft mean-values are calculated as: reference for normalisation is:
2 23.1.13 DAV8k2 arithmetic mean norm= EURAMET-RV
3
4 U L I L
5 NMI / PTB rel.std.dev. norm. ratio rel.std.dev.6 0.99989 2.0E-04 0.9959 3.7E-047 Uncertainties of NMI (k =1) 1.00002 9.7E-05 0.9895 3.7E-04
8 u c,rel(J L) nominal 1.00019 5.0E-04 0.9961 5.3E-04
9 u c,rel(U L)
10 u c,abs(T NMI) 17 K
11 u c,rel(I L) 4.0E-03
12 13
14 means of participant: 1.00003 8.7E-05 0.9939 2.2E-031516 data collection U / V rel.std.dev. I / cd rel.std.dev. burn.time / min
17 U L,NMI #1 I L,NMI #118 lamp number #2 #219 operation. cond. mean U L,NMI mean I L,NMI
20 J L / A U L,NMI /U L,PTB #1 I L,NMI /I L,norm #121 T NMI / K #2 #222 warm-up / min #3 #323 T PTB / K #4 #424 u rel(J L) mean ratio U L ave.rel.std.dev. mean ratio I ave.rel.std.dev. total at PTB
32.16 316.92669 32.173 316.72
a 32.167 2.0E-04 316.82 3.2E-045.8400 0.99987 4.3E-07 0.9957 3.5E-052856 0.99987 4.1E-07 0.9956 7.7E-05 1915 0.99989 5.9E-06 0.9960 1.5E-04
2881 0.99990 8.5E-06 0.9964 1.7E-04 20
1.29E-07 0.99989 7.2E-06 0.9959 1.8E-04 3930.92 299.93
771 30.914 299.71
a 30.917 9.7E-05 299.82 3.7E-045.8200 1.00003 4.2E-07 0.9894 5.4E-052856 1.00002 5.6E-07 0.9895 9.7E-05 1715 1.00001 4.1E-07 0.9896 8.2E-05
2877 1.00001 4.4E-07 0.9896 1.5E-04 19
1.26E-07 1.00002 6.2E-06 0.9895 5.8E-05 3631.28 304.01
817 31.249 303.69
a 31.265 5.0E-04 303.85 5.3E-045.8700 1.00017 4.4E-07 0.9961 9.5E-052856 1.00017 4.3E-07 0.9961 1.4E-04 1815 1.00020 4.0E-07 0.9962 8.1E-05
2875 1.00020 3.6E-07 0.9961 9.3E-05 17
1.21E-07 1.00019 9.7E-06 0.9961 1.8E-05 35
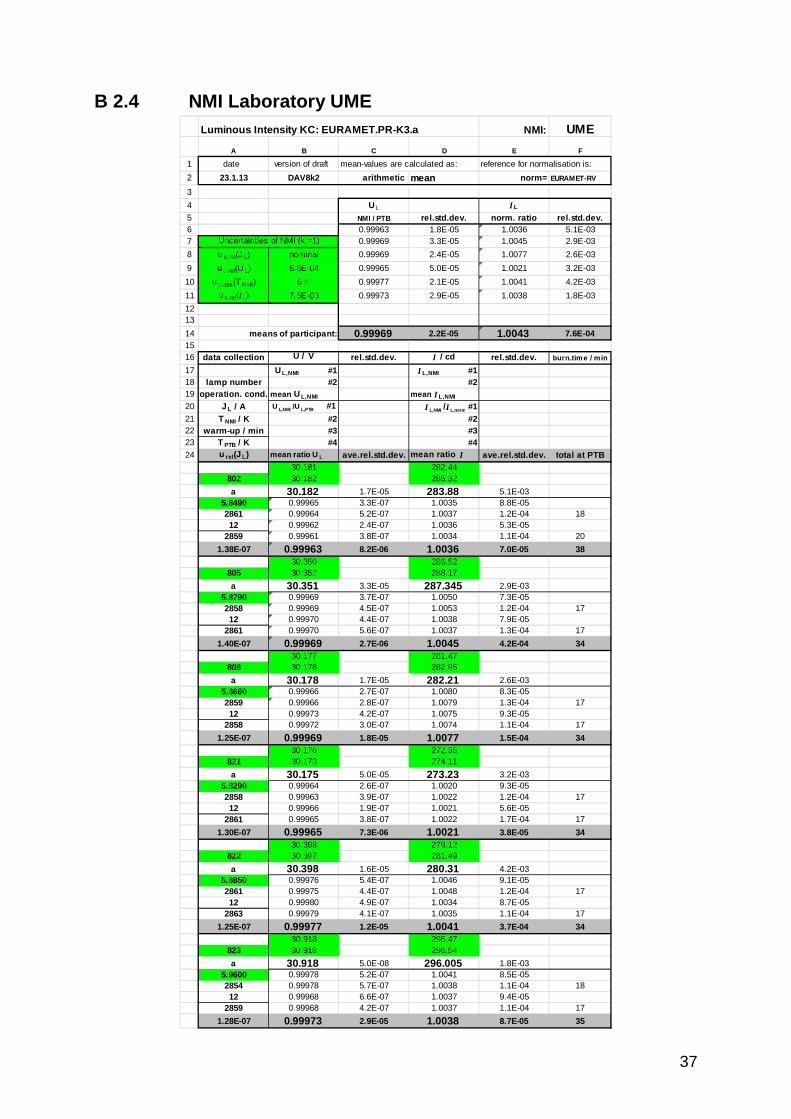
37
B 2.4 NMI Laboratory UME Luminous Intensity KC: EURAMET.PR-K3.a NMI: UME
A B C D E F
1 date version of draft mean-values are calculated as: reference for normalisation is:
2 23.1.13 DAV8k2 arithmetic mean norm= EURAMET-RV
3
4 U L I L
5 NMI / PTB rel.std.dev. norm. ratio rel.std.dev.6 0.99963 1.8E-05 1.0036 5.1E-037 Uncertainties of NMI (k =1) 0.99969 3.3E-05 1.0045 2.9E-03
8 u c,rel(J L) nominal 0.99969 2.4E-05 1.0077 2.6E-03
9 u c,rel(U L) 6.6E-04 0.99965 5.0E-05 1.0021 3.2E-03
10 u c,abs(T NMI) 6 K 0.99977 2.1E-05 1.0041 4.2E-03
11 u c,rel(I L) 7.5E-03 0.99973 2.9E-05 1.0038 1.8E-03
12 13
14 means of participant: 0.99969 2.2E-05 1.0043 7.6E-041516 data collection U / V rel.std.dev. I / cd rel.std.dev. burn.time / min
17 U L,NMI #1 I L,NMI #118 lamp number #2 #219 operation. cond. mean U L,NMI mean I L,NMI
20 J L / A U L,NMI /U L,PTB #1 I L,NMI /I L,norm #121 T NMI / K #2 #222 warm-up / min #3 #323 T PTB / K #4 #424 u rel(J L) mean ratio U L ave.rel.std.dev. mean ratio I ave.rel.std.dev. total at PTB
30.181 282.44802 30.182 285.32
a 30.182 1.7E-05 283.88 5.1E-035.8490 0.99965 3.3E-07 1.0035 8.8E-052861 0.99964 5.2E-07 1.0037 1.2E-04 1812 0.99962 2.4E-07 1.0036 5.3E-05
2859 0.99961 3.8E-07 1.0034 1.1E-04 20
1.38E-07 0.99963 8.2E-06 1.0036 7.0E-05 3830.350 286.52
805 30.352 288.17
a 30.351 3.3E-05 287.345 2.9E-035.8790 0.99969 3.7E-07 1.0050 7.3E-052858 0.99969 4.5E-07 1.0053 1.2E-04 1712 0.99970 4.4E-07 1.0038 7.9E-05
2861 0.99970 5.6E-07 1.0037 1.3E-04 17
1.40E-07 0.99969 2.7E-06 1.0045 4.2E-04 3430.177 281.47
808 30.178 282.95
a 30.178 1.7E-05 282.21 2.6E-035.8660 0.99966 2.7E-07 1.0080 8.3E-052859 0.99966 2.8E-07 1.0079 1.3E-04 1712 0.99973 4.2E-07 1.0075 9.3E-05
2858 0.99972 3.0E-07 1.0074 1.1E-04 17
1.25E-07 0.99969 1.8E-05 1.0077 1.5E-04 3430.176 272.35
821 30.173 274.11
a 30.175 5.0E-05 273.23 3.2E-035.8290 0.99964 2.6E-07 1.0020 9.3E-052858 0.99963 3.9E-07 1.0022 1.2E-04 1712 0.99966 1.9E-07 1.0021 5.6E-05
2861 0.99965 3.8E-07 1.0022 1.7E-04 17
1.30E-07 0.99965 7.3E-06 1.0021 3.8E-05 3430.398 279.12
822 30.397 281.49
a 30.398 1.6E-05 280.31 4.2E-035.8850 0.99976 5.4E-07 1.0046 9.1E-052861 0.99975 4.4E-07 1.0048 1.2E-04 1712 0.99980 4.9E-07 1.0034 8.7E-05
2863 0.99979 4.1E-07 1.0035 1.1E-04 17
1.25E-07 0.99977 1.2E-05 1.0041 3.7E-04 3430.918 295.47
823 30.918 296.54
a 30.918 5.0E-08 296.005 1.8E-035.9600 0.99978 5.2E-07 1.0041 8.5E-052854 0.99978 5.7E-07 1.0038 1.1E-04 1812 0.99968 6.6E-07 1.0037 9.4E-05
2859 0.99968 4.2E-07 1.0037 1.1E-04 17
1.28E-07 0.99973 2.9E-05 1.0038 8.7E-05 35

38
B 2.5 NMI Laboratory BEV
Luminous Intensity KC: EURAMET.PR-K3.a NMI: BEV
A B C D E F
1 date version of draft mean-values are calculated as: reference for normalisation is:
2 23.1.13 DAV8k2 arithmetic mean norm= EURAMET-RV
3
4 U L I L
5 NMI / PTB rel.std.dev. norm. ratio rel.std.dev.6 1.00029 3.8E-05 0.9941 1.9E-037 Uncertainties of NMI (k =1) 0.99997 4.3E-05 1.0011 1.4E-03
8 u c,rel(J L) nominal 1.00017 1.8E-04 0.9976 1.3E-03
9 u c,rel(U L) 2.2E-04 1.00025 1.4E-04 0.9969 5.8E-04
10 u c,abs(T NMI) 50 K
11 u c,rel(I L) 5.5E-03
12 13
14 means of participant: 1.00017 7.2E-05 0.9974 1.4E-031516 data collection U / V rel.std.dev. I / cd rel.std.dev. burn.time / min
17 U L,NMI #1 I L,NMI #118 lamp number #2 #219 operation. cond. mean U L,NMI mean I L,NMI
20 J L / A U L,NMI /U L,PTB #1 I L,NMI /I L,norm #121 T NMI / K #2 #222 warm-up / min #3 #323 T PTB / K #4 #424 u rel(J L) mean ratio U L ave.rel.std.dev. mean ratio I ave.rel.std.dev. total at PTB
31.330 262.92701 31.328 263.90
a1 31.329 3.2E-05 263.41 1.9E-036.0028 1.00033 4.2E-07 0.9951 6.2E-052855 1.00032 4.2E-07 0.9946 1.3E-04 1810-15 1.00026 4.3E-07 0.9934 1.1E-042852 1.00025 4.6E-07 0.9935 1.3E-04 17
1.14E-07 1.00029 2.0E-05 0.9941 4.0E-04 3531.720 261.33
705 31.722 260.71
a1 31.721 3.2E-05 261.02 1.2E-035.9530 0.99991 5.0E-07 1.0023 1.1E-042855 0.99992 4.4E-07 1.0026 1.7E-04 1910-15 1.00001 4.8E-07 0.9996 1.3E-042843 1.00002 5.6E-07 0.9998 1.1E-04 40
1.18E-07 0.99997 2.9E-05 1.0011 7.9E-04 5931.936 282.93
707 31.925 282.19
a1 31.931 1.7E-04 282.56 1.3E-036.0277 1.00009 7.3E-07 0.9975 1.1E-042855 1.00010 4.9E-07 0.9976 1.3E-04 1810-15 1.00023 1.3E-06 0.9975 6.2E-052864 1.00025 7.9E-07 0.9977 1.0E-04 18
1.25E-07 1.00017 4.2E-05 0.9976 5.8E-05 3631.957 265.18
708 31.948 264.88
a1 31.953 1.4E-04 265.03 5.7E-046.0300 1.00025 5.1E-07 0.9965 1.1E-042855 1.00025 4.7E-07 0.9970 1.4E-04 1710-15 1.00025 3.6E-07 0.9969 1.3E-042849 1.00025 4.2E-07 0.9969 1.4E-04 17
1.16E-07 1.00025 1.8E-06 0.9969 1.1E-04 34

39
B 2.6 NMI Laboratory VSL
Luminous Intensity KC: EURAMET.PR-K3.a NMI: VSL
A B C D E F
1 date version of draft mean-values are calculated as: reference for normalisation is:
2 23.1.13 DAV8k2 arithmetic mean norm= EURAMET-RV
3
4 U L I L
5 NMI / PTB rel.std.dev. norm. ratio rel.std.dev.6 1.00436 4.0E-05 0.9965 1.2E-037 Uncertainties of NMI (k =1) 1.00065 3.4E-05 0.9958 9.7E-04
8 u c,rel(J L) nominal 1.00033 3.8E-05 0.9936 6.8E-04
9 u c,rel(U L) 1.0E-04 1.00097 3.4E-05 0.9924 4.4E-03
10 u c,abs(T NMI)
11 u c,rel(I L) 2.9E-03
12 13
14 means of participant: 1.00158 9.4E-04 0.9946 9.6E-041516 data collection U / V rel.std.dev. I / cd rel.std.dev. burn.time / min
17 U L,NMI #1 I L,NMI #118 lamp number #2 #219 operation. cond. mean U L,NMI mean I L,NMI
20 J L / A U L,NMI /U L,PTB #1 I L,NMI /I L,norm #121 T NMI / K #2 #222 warm-up / min #3 #323 T PTB / K #4 #424 u rel(J L) mean ratio U L ave.rel.std.dev. mean ratio I ave.rel.std.dev. total at PTB
30.974 270.35537 30.972 271.01
a 30.973 3.2E-05 270.68 1.2E-035.7241 1.00433 4.8E-07 0.9964 9.1E-052856 1.00432 3.9E-07 0.9967 1.2E-04 1720 1.00441 4.3E-07 0.9964 8.5E-05
2857 1.00440 4.4E-07 0.9965 1.0E-04 17
1.19E-07 1.00436 2.4E-05 0.9965 7.1E-05 3431.835 278.42
541 31.833 278.96
a 31.834 3.1E-05 278.69 9.7E-045.7905 1.00069 5.7E-07 0.9958 9.1E-052856 1.00067 5.0E-07 0.9960 1.1E-04 1720 1.00064 4.8E-07 0.9957 8.4E-05
2857 1.00063 4.2E-07 0.9958 6.1E-05 17
1.27E-07 1.00065 1.4E-05 0.9958 6.3E-05 3430.083 260.98
86 30.081 261.25
a 30.082 3.3E-05 261.12 5.2E-045.8445 1.00030 4.3E-07 0.9929 4.9E-052861 1.00029 5.1E-07 0.9928 1.6E-04 1820 1.00036 4.8E-07 0.9941 9.6E-05
2862 1.00036 5.5E-07 0.9946 1.1E-04 17
1.24E-07 1.00033 1.9E-05 0.9936 4.4E-04 3529.708 262.91
406 29.706 265.22
a 29.707 3.4E-05 264.07 4.4E-035.8238 1.00097 4.7E-07 0.9924 9.2E-052856 1.00097 5.0E-07 0.9928 1.1E-04 1720 1.00097 5.1E-07 0.9922 1.4E-04
2856 1.00097 3.9E-07 0.9922 1.9E-04 20
1.28E-07 1.00097 7.9E-07 0.9924 1.4E-04 37

40
B 2.7 NMI Laboratory CMI
Luminous Intensity KC: EURAMET.PR-K3.a NMI: CMI
A B C D E F
1 date version of draft mean-values are calculated as: reference for normalisation is:
2 23.1.13 DAV8k2 arithmetic mean norm= EURAMET-RV
3
4 U L I L
5 JL&UL(NMI)->2-pole NMI / PTB rel.std.dev. norm. ratio rel.std.dev.6 1.00103 3.5E-04 1.0010 4.7E-047 Uncertainties of NMI (k =1) 1.00155 2.5E-04 0.9993 1.6E-03
8 u c,rel(J L) nominal 1.00325 7.0E-04 0.9968 3.9E-04
9 u c,rel(U L) 5.0E-05 1.00498 1.9E-03 0.9989 4.1E-04
10 u c,abs(T NMI) 11 K
11 u c,rel(I L) 3.8E-03
12 13
14 means of participant: 1.00270 9.0E-04 0.9990 8.8E-041516 data collection U / V rel.std.dev. I / cd rel.std.dev. burn.time / min
17 U L,NMI #1 I L,NMI #118 lamp number #2 #219 operation. cond. mean U L,NMI mean I L,NMI
20 J L / A U L,NMI /U L,PTB #1 I L,NMI /I L,norm #121 T NMI / K #2 #222 warm-up / min #3 #323 T PTB / K #4 #424 u rel(J L) mean ratio U L ave.rel.std.dev. mean ratio I ave.rel.std.dev. total at PTB
29.601 239.43562 29.580 239.65
a 29.591 3.5E-04 239.54 4.6E-045.5930 1.00105 2.0E-07 1.0008 1.2E-042764 1.00104 2.1E-07 1.0011 1.2E-04 1812-15 1.00102 2.7E-07 1.0010 1.0E-042795 1.00102 1.9E-07 1.0012 1.1E-04 45
1.35E-07 1.00103 6.1E-06 1.0010 8.7E-05 6329.48 235.50
512 29.465 234.75
a 29.473 2.5E-04 235.13 1.6E-035.5420 1.00154 1.4E-05 0.9993 1.3E-042759 1.00155 1.4E-05 0.9992 1.9E-04 1712-15 1.00156 1.2E-05 0.9993 1.8E-042788 1.00156 1.3E-05 0.9994 2.1E-04 18
2.49E-07 1.00155 4.9E-06 0.9993 2.8E-05 3528.65 219.53
2/88 28.61 219.65
a 28.630 7.0E-04 219.59 2.7E-045.5730 1.00322 2.1E-07 0.9973 7.8E-052765 1.00322 2.4E-07 0.9973 6.3E-05 1712-15 1.00328 2.1E-07 0.9963 9.7E-052795 1.00328 2.8E-07 0.9964 1.2E-04 17
1.32E-07 1.00325 1.8E-05 0.9968 2.8E-04 3428.72 221.83
1B/1988 28.61 221.65
a 28.665 1.9E-03 221.74 4.1E-045.6090 1.00497 2.1E-07 0.9991 1.0E-042765 1.00497 3.0E-07 0.9990 1.6E-04 1712-15 1.00500 2.8E-07 0.9988 7.8E-052796 1.00500 2.1E-07 0.9987 1.1E-04 17
1.33E-07 1.00498 8.5E-06 0.9989 8.1E-05 34

41
B 2.8 NMI Laboratory IPQ
Luminous Intensity KC: EURAMET.PR-K3.a NMI: IPQ
A B C D E F
1 date version of draft mean-values are calculated as: reference for normalisation is:
2 23.1.13 DAV8k2 arithmetic mean norm= EURAMET-RV
3
4 UL I L
5 NMI / PTB rel.std.dev. norm. ratio rel.std.dev.6 1.00025 2.1E-05 1.0048 1.1E-037 Uncertainties of NMI (k =1) 1.00036 8.9E-05 1.0047 1.7E-03
8 u c,rel(J L) nominal 1.00029 7.4E-05 1.0064 1.5E-03
9 u c,rel(U L) 1.0E-04 1.00031 1.8E-04 1.0068 7.2E-04
10 u c,abs(T NMI) 15 K
11 u c,rel(I L) 8.0E-03
12 13
14 means of participant: 1.00030 2.3E-05 1.0057 5.2E-041516 data collection U / V rel.std.dev. I / cd rel.std.dev. burn.time / min
17 UL,NMI #1 I L,NMI #118 lamp number #2 #219 operation. cond. mean U L,NMI mean I L,NMI
20 J L / A U L,NMI /U L,PTB #1 I L,NMI /I L,norm #121 T NMI / K #2 #222 warm-up / min #3 #323 T PTB / K #4 #424 u rel(J L) mean ratio U L ave.rel.std.dev. mean ratio I ave.rel.std.dev. total at PTB
29.938 262.4853 29.937 263.05
a 29.938 1.8E-05 262.77 1.1E-035.7855 1.00027 4.6E-07 1.0051 9.5E-052856 1.00026 5.2E-07 1.0051 6.1E-05 1715 1.00024 4.0E-07 1.0046 7.0E-05
2844 1.00023 5.5E-07 1.0047 1.3E-04 20
1.16E-07 1.00025 9.4E-06 1.0048 1.3E-04 3730.048 263.45
54 30.043 264.35
a 30.046 8.9E-05 263.90 1.7E-035.8038 1.00035 3.8E-07 1.0047 8.5E-052856 1.00033 4.4E-07 1.0048 1.1E-04 1715 1.00038 5.7E-07 1.0046 9.7E-05
2843 1.00037 5.0E-07 1.0048 9.2E-05 19
1.17E-07 1.00036 1.1E-05 1.0047 6.1E-05 3629.928 262.67
56 29.924 263.43
a 29.926 7.4E-05 263.05 1.4E-035.7923 1.00031 6.1E-07 1.0061 1.1E-042856 1.00030 5.8E-07 1.0060 9.7E-05 1715 1.00027 4.4E-07 1.0068 1.2E-04
2843 1.00026 4.6E-07 1.0066 1.2E-04 16
1.22E-07 1.00029 1.1E-05 1.0064 2.0E-04 3329.988 261.98
85 29.999 262.33
a 29.994 1.8E-04 262.16 6.7E-045.7920 1.00033 5.4E-07 1.0065 9.9E-052856 1.00032 4.6E-07 1.0062 1.8E-04 1715 1.00031 6.3E-07 1.0073 6.4E-05
2845 1.00029 6.1E-07 1.0071 1.2E-04 17
1.23E-07 1.00031 7.3E-06 1.0068 2.7E-04 34

42
B 2.9 NMI Laboratory DMDM Luminous Intensity KC: EURAMET.PR-K3.a NMI: DMDM
A B C D E F
1 date version of draft mean-values are calculated as: reference for normalisation is:
2 23.1.13 DAV8k2 arithmetic mean norm= EURAMET-RV
3
4 U L I L
5 NMI / PTB rel.std.dev. norm. ratio rel.std.dev.6 1.00060 2.1E-04 1.0002 1.4E-037 Uncertainties of NMI (k =1) 1.00052 3.1E-05 1.0000 7.9E-04
8 u c,rel(J L) nominal 1.00060 2.1E-04 0.9996 8.6E-04
9 u c,rel(U L) 5.0E-04 1.00057 1.3E-04 0.9956 1.2E-03
10 u c,abs(T NMI) 10 K 1.00061 2.3E-04 1.0059 7.8E-04
11 u c,rel(I L) 6.0E-03 1.00096 1.2E-04 1.0026 3.6E-03
12 1.00059 6.3E-04 1.0047 3.9E-0313 1.00036 9.3E-04 1.0089 2.1E-03
14 means of participant: 1.00060 5.9E-05 1.0022 1.5E-031516 data collection U / V rel.std.dev. I / cd rel.std.dev. burn.time / min
17 UL,NMI #1 I L,NMI #118 lamp number #2 #219 operation. cond. mean UL,NMI mean I L,NMI
20 J L / A U L,NMI /U L,PTB #1 I L,NMI /I L,norm #121 T NMI / K #2 #222 warm-up / min #3 #323 T PTB / K #4 #424 u rel(J L) mean ratio U L ave.rel.std.dev. mean ratio I ave.rel.std.dev. total at PTB
29.529 237.547 29.5410 236.88
a 29.535 2.0E-04 237.19 1.3E-035.7560 1.00067 4.0E-07 1.0008 6.7E-052800 1.00065 4.9E-07 1.0008 1.5E-04 1710-15 1.00055 2.7E-07 0.9995 1.1E-042792 1.00054 1.9E-07 0.9998 1.2E-04 17
1.29E-07 1.00060 3.2E-05 1.0002 3.4E-04 3429.187 230.9
50 29.1887 230.54
a 29.188 2.9E-05 230.72 7.8E-045.7380 1.00052 3.1E-07 0.9999 9.4E-052800 1.00050 5.0E-07 0.9998 8.1E-05 1610-15 1.00054 4.3E-07 1.0002 1.3E-042791 1.00054 2.6E-07 1.0001 2.1E-04 18
1.44E-07 1.00052 9.5E-06 1.0000 1.0E-04 3429.238 232.2
52 29.2505 231.8
a 29.244 2.1E-04 232.01 8.4E-045.7440 1.00061 4.2E-07 0.9993 1.3E-042800 1.00060 1.6E-07 0.9993 1.1E-04 1710-15 1.00060 3.9E-07 1.0000 7.6E-052791 1.00059 3.8E-07 0.9999 1.1E-04 21
1.36E-07 1.00060 4.5E-06 0.9996 2.0E-04 3829.281 232.3
87 29.2884 231.74
a 29.285 1.3E-04 232.02 1.2E-035.7520 1.00060 4.8E-07 0.9956 9.6E-052800 1.00059 5.2E-07 0.9957 1.7E-04 2110-15 1.00055 3.2E-07 0.9954 1.3E-042792 1.00054 3.6E-07 0.9959 1.2E-04 19
1.18E-07 1.00057 1.5E-05 0.9956 1.1E-04 4012.117 376.4
7HE78 12.1120 376.91
b3 12.115 2.1E-04 376.66 6.8E-0424.340 1.00076 3.8E-05 1.0062 4.8E-042800 1.00082 4.5E-05 1.0067 6.0E-04 1710-15 1.00045 5.2E-05 1.0049 4.6E-042792 1.00040 4.1E-05 1.0057 5.2E-04 66
2.32E-06 1.00061 1.1E-04 1.0059 3.9E-04 8312.225 378.2
7GV78 12.2222 380.92
b3 12.224 1.1E-04 379.56 3.6E-0324.400 1.00110 3.3E-05 1.0020 4.3E-042800 1.00094 4.0E-05 1.0011 2.3E-04 1710-15 1.00089 3.4E-05 1.0036 2.6E-042798 1.00091 3.2E-05 1.0038 3.5E-04 18
1.90E-06 1.00096 4.6E-05 1.0026 6.5E-04 3512.252 380.3
7GY78 12.2367 383.27
b3 12.244 6.2E-04 381.79 3.9E-0324.350 1.00071 3.4E-05 1.0045 4.4E-042800 1.00070 3.1E-05 1.0047 3.6E-04 1810-15 1.00048 3.4E-05 1.0047 3.8E-042796 1.00047 3.3E-05 1.0049 4.0E-04 18
1.77E-06 1.00059 6.5E-05 1.0047 8.5E-05 3612.468 388.8
7GZ78 12.4911 390.43
b3 12.480 9.3E-04 389.62 2.1E-0324.290 1.00032 4.1E-05 1.0090 4.0E-042800 1.00050 3.2E-05 1.0093 3.4E-04 1810-15 1.00030 4.3E-05 1.0088 4.1E-042797 1.00032 3.7E-05 1.0085 4.2E-04 20
1.69E-06 1.00036 4.6E-05 1.0089 1.5E-04 38

43
B 2.10 NMI Laboratory GUM Luminous Intensity KC: EURAMET.PR-K3.a NMI: GUM
A B C D E F
1 date version of draft mean-values are calculated as: reference for normalisation is:
2 23.1.13 DAV8k2 arithmetic mean norm= EURAMET-RV
3
4 U L I L
5 NMI / PTB rel.std.dev. norm. ratio rel.std.dev.6 0.99987 8.3E-05 1.0033 4.4E-047 Uncertainties of NMI (k =1) 0.99968 9.9E-05 1.0044 9.1E-04
8 u c,rel(J L) nominal 0.99985 1.9E-05 1.0030 1.6E-03
9 u c,rel(U L) 2.5E-04 0.99981 2.8E-06 1.0018 1.3E-03
10 u c,abs(T NMI) 15 K 0.99983 1.2E-04 1.0038 1.4E-03
11 u c,rel(I L) 5.6E-03
12 13
14 means of participant: 0.99981 3.4E-05 1.0033 4.4E-041516 data collection U / V rel.std.dev. I / cd rel.std.dev. burn.time / min
17 U L,NMI #1 I L,NMI #118 lamp number #2 #219 operation. cond. mean U L,NMI mean I L,NMI
20 J L / A U L,NMI /U L,PTB #1 I L,NMI /I L,norm #121 T NMI / K #2 #222 warm-up / min #3 #323 T PTB / K #4 #424 u rel(J L) mean ratio U L ave.rel.std.dev. mean ratio I ave.rel.std.dev. total at PTB
30.303 280.81 30.298 281.0
a1 30.301 8.3E-05 280.90 3.6E-045.8460 0.99990 4.7E-07 1.0038 8.9E-052887 0.99989 5.5E-07 1.0037 1.0E-04 1810 0.99986 4.2E-07 1.0030 1.0E-04
2889 0.99985 4.1E-07 1.0027 1.1E-04 21
1.25E-07 0.99987 1.2E-05 1.0033 2.6E-04 3930.304 277.0
2 30.298 277.5
a1 30.301 9.9E-05 277.25 9.0E-045.8294 0.99969 5.5E-07 1.0046 1.1E-042888 0.99968 4.9E-07 1.0045 1.0E-04 1810 0.99968 5.0E-07 1.0043 7.6E-05
2889 0.99967 5.1E-07 1.0042 1.2E-04 17
1.20E-07 0.99968 3.0E-06 1.0044 1.0E-04 3530.309 281.8
3 30.308 282.7
a1 30.309 1.6E-05 282.25 1.6E-035.8847 0.99984 4.4E-07 1.0029 8.4E-052888 0.99983 4.9E-07 1.0029 1.4E-04 1710 0.99987 3.1E-07 1.0033 9.4E-05
2888 0.99987 4.6E-07 1.0030 1.4E-04 18
1.17E-07 0.99985 9.0E-06 1.0030 9.7E-05 3530.439 282.6
4 30.439 283.3
a1 30.439 1.2E-08 282.95 1.2E-035.8787 0.99981 4.0E-07 1.0014 9.1E-052888 0.99981 3.7E-07 1.0013 1.1E-04 1710 0.99981 3.5E-07 1.0022 1.0E-04
2888 0.99980 4.0E-07 1.0022 8.8E-05 16
1.17E-07 0.99981 2.8E-06 1.0018 2.4E-04 3330.519 289.4
5 30.512 290.2
a1 30.516 1.1E-04 289.80 1.4E-035.8793 0.99986 4.0E-07 1.0037 9.5E-052896 0.99984 4.9E-07 1.0037 1.2E-04 1610 0.99982 4.7E-07 1.0039 8.7E-05
2896 0.99981 3.9E-07 1.0040 1.2E-04 16
1.25E-07 0.99983 1.1E-05 1.0038 7.6E-05 32

44
B 2.11 NMI Laboratory INM
Luminous Intensity KC: EURAMET.PR-K3.a NMI: INM
A B C D E F
1 date version of draft mean-values are calculated as: reference for normalisation is:
2 23.1.13 DAV8k2 arithmetic mean norm= EURAMET-RV
3
4 UL I L
5 NMI / PTB rel.std.dev. norm. ratio rel.std.dev.6 1.00039 1.0E-04 0.9934 2.3E-037 Uncertainties of NMI (k =1) 1.00160 1.3E-03 1.0000 6.2E-03
8 u c,rel(J L) nominal 1.00065 2.1E-04 1.0003 2.7E-03
9 u c,rel(UL) 7.0E-04
10 u c,abs(T NMI) 30 K
11 u c,rel(I L) 6.5E-03
12 13
14 means of participant: 1.00088 3.7E-04 0.9979 2.3E-031516 data collection U / V rel.std.dev. I / cd rel.std.dev. burn.time / min
17 U L,NMI #1 I L,NMI #118 lamp number #2 #219 operation. cond. mean U L,NMI mean I L,NMI
20 J L / A U L,NMI /U L,PTB #1 I L,NMI /I L,norm #121 T NMI / K #2 #222 warm-up / min #3 #323 T PTB / K #4 #424 u rel(J L) mean ratio U L ave.rel.std.dev. mean ratio I ave.rel.std.dev. total at PTB
28.80 228.74711 28.806 229.79
a1 28.803 1.0E-04 229.265 2.3E-035.5685 1.00040 2.5E-07 0.9926 8.3E-052800 1.00040 3.3E-07 0.9929 7.0E-05 1715 1.00038 3.0E-07 0.9941 1.1E-04
2787 1.00038 3.3E-07 0.9938 1.9E-04 37
1.40E-07 1.00039 5.3E-06 0.9934 3.5E-04 5430.49 246.45
195/473 30.566 249.49
a3 30.528 1.2E-03 247.97 6.1E-035.7557 1.00133 1.6E-06 0.9990 1.1E-042800 1.00143 1.2E-06 0.9994 1.6E-04 1715 1.00179 1.7E-06 1.0012 9.5E-05
2797 1.00184 2.1E-06 1.0006 1.1E-04 39
1.20E-07 1.00160 1.3E-04 1.0000 5.1E-04 5630.55 246.64
196/474 30.561 247.96
a3 30.556 1.8E-04 247.3 2.7E-035.7501 1.00045 1.1E-06 0.9995 1.5E-042800 1.00051 1.0E-06 0.9997 1.9E-04 1715 1.00075 1.1E-06 1.0008 9.9E-05
2799 1.00087 9.6E-07 1.0010 1.5E-04 35
1.33E-07 1.00065 9.8E-05 1.0003 4.0E-04 52
823 Results of the lamp excluded by participant
a15.6284280015
2800
1.23E-07

45
B 2.12 NMI Laboratory SMU
Luminous Intensity KC: EURAMET.PR-K3.a NMI: SMU
A B C D E F
1 date version of draft mean-values are calculated as: reference for normalisation is:
2 23.1.13 DAV8k2 arithmetic mean norm= EURAMET-RV
3
4 U L I L
5 NMI / PTB rel.std.dev. norm. ratio rel.std.dev.6 1.00656 2.3E-03 1.0046 3.8E-047 Uncertainties of NMI (k =1) 1.00823 6.1E-03 1.0038 6.7E-04
8 u c,rel(J L) nominal 1.00255 5.8E-04 1.0043 1.0E-04
9 u c,rel(U L)
10 u c,abs(T NMI) 8 K
11 u c,rel(I L) 3.5E-03
12 13
14 means of participant: 1.00578 1.7E-03 1.0042 2.4E-041516 data collection U / V rel.std.dev. I / cd rel.std.dev. burn.time / min
17 U L,NMI #1 I L,NMI #118 lamp number #2 #219 operation. cond. mean U L,NMI mean I L,NMI
20 J L / A U L,NMI /U L,PTB #1 I L,NMI /I L,norm #121 T NMI / K #2 #222 warm-up / min #3 #323 T PTB / K #4 #424 u rel(J L) mean ratio U L ave.rel.std.dev. mean ratio I ave.rel.std.dev. total at PTB
14.025 511.6PA902 14.088 511.21
b2 14.057 2.2E-03 511.405 3.8E-0425.184 1.00622 3.5E-06 1.0046 9.4E-052856 1.00613 2.1E-06 1.0047 1.6E-04 2720 1.00696 3.5E-06 1.0045 1.1E-04
2890 1.00692 5.1E-06 1.0047 1.5E-04 27
2.59E-07 1.00656 2.2E-04 1.0046 4.2E-05 5413.900 502.66
PA907 14.069 501.99
b2 13.985 6.0E-03 502.3 6.7E-0425.472 1.00681 1.3E-05 1.0040 9.5E-052856 1.00659 2.8E-05 1.0039 1.3E-04 2720 1.00959 1.6E-05 1.0036 9.1E-05
2889 1.00994 1.3E-05 1.0037 1.4E-04 25
7.87E-07 1.00823 8.8E-04 1.0038 9.3E-05 5213.872 503.35
PA908 13.888 503.31
b2 13.880 5.8E-04 503.3 4.8E-0525.085 1.00275 4.8E-06 1.0044 6.5E-052856 1.00267 3.8E-06 1.0045 1.4E-04 2620 1.00240 3.6E-06 1.0041 9.4E-05
2888 1.00239 4.3E-06 1.0041 1.9E-04 51
3.48E-07 1.00255 9.3E-05 1.0043 9.1E-05 77

46
B 2.13 NMI Laboratory MIKES
Luminous Intensity KC: EURAMET.PR-K3.a NMI: MIKES
A B C D E F
1 date version of draft mean-values are calculated as: reference for normalisation is:
2 23.1.13 DAV8k2 arithmetic mean norm= EURAMET-RV
3
4 U L I L
5 NMI / PTB rel.std.dev. norm. ratio rel.std.dev.6 0.99999 1.0E-05 0.9977 5.4E-047 Uncertainties of NMI (k =1) 1.00002 8.5E-06 0.9978 4.1E-03
8 u c,rel(J L) nominal 1.00010 8.6E-06 0.9973 1.9E-03
9 u c,rel(U L) 1.2E-04 1.00001 3.2E-06 0.9943 2.6E-03
10 u c,abs(T NMI) 15 K
11 u c,rel(I L) 1.85E-03
12 13
14 means of participant: 1.00003 2.4E-05 0.9968 8.2E-041516 data collection U / V rel.std.dev. I / cd rel.std.dev. burn.time / min
17 UL,NMI #1 I L,NMI #118 lamp number #2 #219 operation. cond. mean UL,NMI mean I L,NMI
20 J L / A U L,NMI /U L,PTB #1 I L,NMI /I L,norm #121 T NMI / K #2 #222 warm-up / min #3 #323 T PTB / K #4 #424 u rel(J L) mean ratio U L ave.rel.std.dev. mean ratio I ave.rel.std.dev. total at PTB
31.039 283.249502 31.039 282.95
a2 31.039 1.3E-08 283.10 5.1E-045.8732 0.99997 3.9E-07 0.9974 8.2E-052850 0.99997 3.9E-07 0.9975 1.7E-04 2220 1.00001 3.8E-07 0.9978 9.0E-05
2858 1.00001 4.4E-07 0.9982 7.2E-05 20
1.12E-07 0.99999 1.0E-05 0.9977 1.8E-04 4230.902 282.56
9503 30.902 280.24
a2 30.902 3.4E-08 281.40 4.1E-035.9103 1.00001 3.7E-07 0.9978 9.7E-052849 1.00001 5.0E-07 0.9977 1.1E-04 1720 1.00004 3.8E-07 0.9977 1.2E-04
2853 1.00004 4.8E-07 0.9978 1.3E-04 17
1.33E-07 1.00002 8.5E-06 0.9978 1.3E-05 3429.645 260.68
9904 29.645 259.67
a2 29.645 2.6E-08 260.175 1.9E-035.8245 1.00010 3.9E-07 0.9972 6.4E-052830 1.00008 4.8E-07 0.9971 1.2E-04 1720 1.00012 3.7E-07 0.9976 1.0E-04
2838 1.00011 3.8E-07 0.9975 9.7E-05 17
1.36E-07 1.00010 8.6E-06 0.9973 1.2E-04 3429.805 264.92
9905 29.805 266.29
a2 29.805 3.5E-08 265.605 2.6E-035.8201 1.00001 2.3E-07 0.9941 4.6E-052832 1.00001 2.4E-07 0.9944 1.5E-04 1820 1.00002 2.1E-07 0.9944 9.1E-05
2844 1.00001 3.7E-07 0.9945 8.6E-05 17
1.18E-07 1.00001 3.2E-06 0.9943 9.0E-05 35

47
Annex C Technical specifications of the 16 participants are collected in a separate document sent to EURAMET-TCPR.