Embed Size (px)
Citation preview

EU experience with ODYSSEE indicators for policy evaluation / La experiencia europea en el uso de
indicadores para la evaluación de políticas: El proyecto ODYSSEE
Didier Bosseboeuf, ADEME Bruno Lapillonne, Vice President, Enerdata
Taller de trabajo del proyecto BIEE / Mesoamérica Base de Indicadores de Eficiencia Energética
Auditorio Raul Prebisch, Sede Sub-regional México, CEPAL
11 – 12 de abril, 2013

Out
line
1. Importance of indicators 2. EU experience with ODYSSEE? 3. Overview of indicators from ODYSSEE 4. Conclusions

Previously very general and qualitative targets set in the framework of the
EU energy policy or national policies
Now quantitative targets are set in the EU: That are more constraining and ambitious That are increasingly integrated within energy law and Directives That are defined both at the level of the total consumption but also by
sector or end-use (“sectoral targets” That generally require yearly monitoring, with standardised procedures,
and reporting obligations
More and more countries at world level with quantities targets
From soft commitments to more constraining and quantitative targets

4
0 1 2 3 4 5 6 7 8
Aust
ria
Belg
ium
Cr
oatia
Cy
prus
Gr
eece
Lu
xem
bour
g M
alta
Sl
ovak
ia
Czec
h Re
p Fi
nlan
d Hu
ngar
y Li
thua
nia
Net
herla
nds
Pola
nd
Port
ugal
Ro
man
ia
Slov
enia
Es
toni
a Ita
ly
Latv
ia
Swed
en
Bulg
aria
De
nmar
k Ire
land
Fr
ance
Ge
rman
y Sp
ain
Final Primary Residential/Transport/Agriculture Public Industry
71 quantitative policy targets set in the EU 27 countries with targets on final consumers (54%) 13 countries with targets on primary consumption (24%) 5 countries with targets on residential 4 countries with targets on public sector 3 countries with targets on industry sector
Number of targets by sector

Monitoring on a yearly basis the results achieved in terms of energy savings becomes now a necessity for many governments and institutions,
To check that the country is on track compared to its targets (“distance to target”)
To justify the public budget spent
To conform to reporting requirements of the parliament or other institutions (e.g. EU Commission for EU member countries)
Energy efficiency indicators : a necessary tool to assess the progress achieved ?

Beyond a monitoring of the energy savings and progress achieved these
indicators can be also used : To understand why the targets are not met so as to identify
corrective measures To compare/benchmark the countries progress and performance
with respect to energy efficiency performances and assess potential for improvement
Finally to assess the long term potential for energy efficiency improvement so as to see what new measures could be implemented indicators are the main input variables of the end-use models to be used for such assessments (e.g. MEDEE, MAED, LEAP)
Multiple use of energy efficiency indicators

Out
line
1. Importance of indicators 2. EU experience with ODYSSEE? 3. Overview of indicators from ODYSSEE 4. Conclusions

The ODYSSEE-MURE project (1/2)
Energy efficiency Indicators have been developed in Europe since the mid nineties within a project , know as ODYSSEE-MURE supported by a special programme of the European Commission called EIE, Energy Intelligent Europe and all EU agencies
Project coordinated by ADEME, the French Energy Environment and Efficiency Agency
Presently the project associates 33 partners from 28 countries, mainly national energy efficiency agencies (or their representatives)

ECONOTEC C O N S U L T A N T S
The ODYSSEE-MURE network

The ODYSSEE-MURE project (2/2)
Main objectives :
– Evaluate and compare energy efficiency progress by sector for EU countries and for the EU as a whole, and relate the progress to the observed trend in energy consumption;
– Evaluate energy efficiency policy measures in the EU countries
Project relying on two data bases, covering the EU, the individual 27 Member states, Norway and Croatia, The ODYSSEE data base on energy efficiency indicators
www.odyssee-indicators.org The MURE database on all policy measures implemented by
sector, and their impact evaluation whenever available: www.mure2.com

ODYSSEE and MURE Data Bases
These data base cover all EU-27 countries, Norway and Croatia, the
EU-27 and EU-15 as a whole. These data base are updated by national teams, with a centralised
management (“technical coordinator”), that is in charge of the quality control and assistance to the countries Enerdata for ODYSSEE; ISIS-Fraunhofer-ISIS for MURE),

ODYSSEE data base in brief
Data base covering: Energy consumption data by sector and end-use and their drivers
(about 1000 data series, of which 600 main data series) Half energy consumption data and half non energy data Importance given in the consistency between the definition
and coverage of the energy consumption categories and drivers
Energy efficiency and CO2 indicators at macro or sectoral levels (about 180 indicators).
Period covered: 1990-2009 (from 1980 for most EU-15 countries);
Available on internet (www.odyssee-indicators.org) with a password
12

Maine users of ODYSSEE data and indicators
DG-ENER:
EMOS database (Energy Market Observatory) Explicit reference in the Energy Service Directive to ODEX indicator Basis to measure energy savings with top-down methods for the monitoring of the ESD Directive ;
IEA: to complete its indicators for European countries.
EEA (European Environmental Agency):
Indicators factsheets Annual TERM report; Annual report “State and Outlook of the Environnement » Fourth pan-European environment assessment report in the 'Environment for Europe' process in the framework of UNECE.
*TERM monitors indicators tracking transport and environment integration in the EU

Out
line
1. Importance of indicators 2. EU experience with ODYSSEE? 3. Overview of indicators from ODYSSEE 4. Conclusions

15
Classification of ODYSSEE indicators: ~180 indicators split in 7 different types of energy efficiency indicators and 2 types of CO2 indicators Type Level
1. Energy intensities by sector & sub sector
2. Adjusted intensities final and industry
3. Specific energy consumption by sub sector & end-use
4. Benchmarked specific energy consumption
steel, cement, paper, heating
5. Energy efficiency indices (ODEX) final and by sector
6. Energy savings final, by sector and sub sectors
7. Indicators of diffusion by sector
8. CO2 intensities by sector & sub sector
9. Specific CO2 emissions by sub sector & end-use
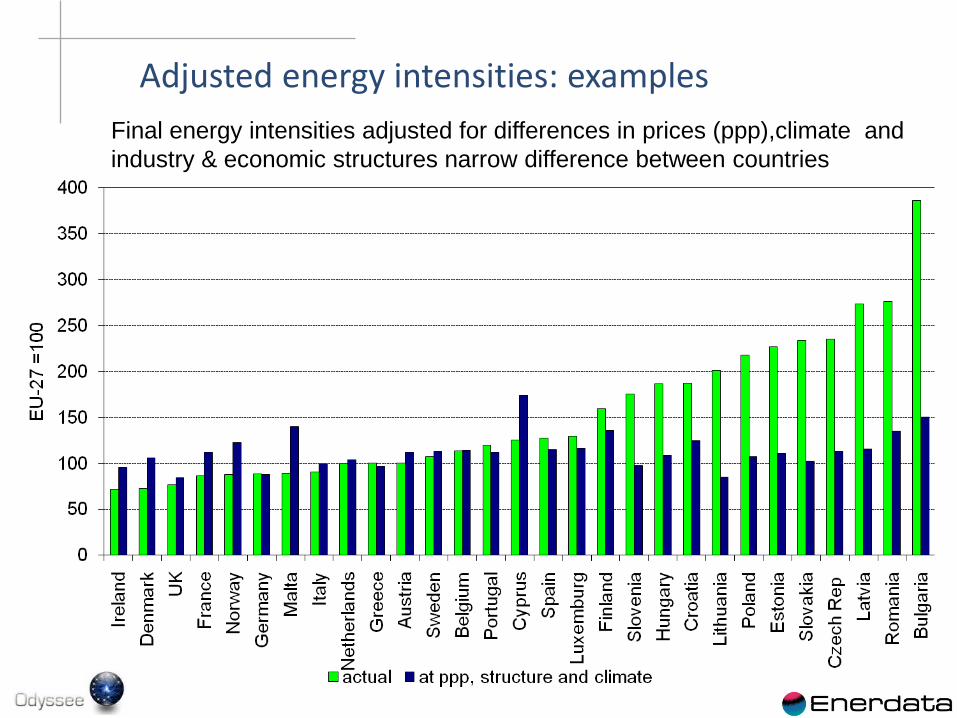
Final energy intensities adjusted for differences in prices (ppp),climate and industry & economic structures narrow difference between countries
Adjusted energy intensities: examples

Benchmarking of the specific consumption: case of crude steel
Belgium Bulgaria
Czech Republic
France
Germany
Greece
Hungary
Italy
Luxembourg
Netherlands
Poland
Portugal
Slovak Republic
Slovenia
Spain
Sweden
UK
USA
Japan
South Korea UE27
Croatia
0.0
0.1
0.2
0.3
0.4
0.5
0% 10% 20% 30% 40% 50% 60% 70% 80% 90% 100%
toe/t
% of electric steel Best electric arc
Best oxygen process
Distance to red line show possible potential of energy efficiency gains

Example of energy efficiency index (ODEX): final consumers (EU-27)
ODEX= 79 in 2007 21% energy efficiency improvement between 1990 and 2007
ODEX is calculated as a 3 years moving average to avoid short term fluctuations (imperfect climatic corrections, behavioural factors, business cycles)….

Energy efficiency improvement from ODEX can also bee expressed in %/year to assess the average annual rate of energy efficiency improvements
0.0
0.5
1.0
1.5
2.0
2.5
3.0
3.5
4.0
Pol
and
Rom
ania
B
ulga
ria
Hun
gary
C
ypru
s S
love
nia
Latv
ia
Lith
uani
a N
ethe
rland
s G
erm
any
Fran
ce
Slo
vaki
a E
U-2
7 A
ustri
a E
ston
ia
Cro
atia
Ire
land
Fi
nlan
d S
wed
en
Gre
ece
Den
mar
k U
K
Bel
gium
N
orw
ay
Italy
M
alta
P
ortu
gal
Spa
in
Luxe
mbo
urg
Cze
ch R
ep
%/y
ear
1996-2007

20
Energy savings: example of the refrigerator stock A reduction of the average specific consumption of the refrigerator 'stock from 400 to 300 kWh in a country with 2 million of refrigerators will result in total electricity savings equal to 100 GWh. Methodology officially proposed by the European Commission for the monitoring of the 9% savings required by the Energy Service Directive (ESD) with top-down indicators
•Energy savings in 2007 (compared to 1990) = 100 GWh ((400-300)*1 )
assuming a stock of 1 M refrigerators in 2007
•Rate of energy savings: 25% (=100/400)

Energy savings for final consumers(EU-27)
0
20
40
60
80
100
120
140
160
1997 1998 1999 2000 2001 2002 2003 2004 2005 2006 2007
Mto
e Households Transport Industry
About 158 Mtoe energy savings in 2007 compared to 1997: without energy savings the final energy consumption would have been in 2007 158 Mtoe higher. Calculated by summing savings by end-use or sub-sector. More than half of savings in industry 52%; 32% for transport, 16% for households

Examples of indicators of diffusion
Source: GfK
0
20
40
60
80
100
Port
ugal
Spai
n
EU-1
5
Fran
ce
Pola
nd
UK
Germ
any
Italy
Swed
en
Denm
ark
Net
herla
nds
%
2008
0% 5%
10% 15% 20% 25% 30% 35% 40%
Italy
Spai
n
Port
ugal
Fran
ce
EU-2
7
Germ
any
Denm
ark
Net
herla
nds
UK
Belg
ium
1995 2007
Case of washing machines: share of efficiency label case of A & A+
Case of transport: share of rail and water in freight transport

In ODYSSEE : a wide range of indicators and number is increasing: why? Energy efficiency has different meaning and frontiers (economic versus
technical efficiency). Policy measures aims at different target (e.g. cars, mobility behavior): depending on the definition used and the target, different indicators may
be considered; (e.g. for cars toe/passenger-km, toe/car; l/100 km, l/kg); Interpretation is enriched by comparing several indicators to show for
instance the impact on energy consumption of factors not linked to energy efficiency (e.g. lifestyles, behaviors , structural changes in industry, modal shift);
Alternative indicators are often necessary to cope with possible data gaps (alternative indicators );
Originality of ODYSSEE data base on indicators: a wide range of Odyssee indicators

Drivers of the variation of the final energy consumption in the EU
-200
-150
-100
-50
0
50
100
150
200
250
Varia
tion
cons
umpt
ion
Act
ivity
effe
ct
Life
styl
es
Stru
ctur
e ef
fect
Ene
rgy
savi
ngs
Clim
ate
effe
ct
Oth
er
Mto
e
1997-2007

Policy makers need data and indicators to monitor the impact of their
actions, to prepare new policy measures and to assess long– term energy savings potentials
Data needed are not just merely the usual energy statistics from the energy balance but more detailed data by end-use
Strategies have to be defined to collect such data ... In a permanent way: by combining detailed surveys every 2 to 3 years with modelling or lighter surveys
in between the survey years by imposing reporting requirements to utilities, equipment manufacturers ,
utilities exchange of international experience is very useful in that matter
Although such indicators can be used to assess the impact of policies, it is seldom that they can measure the impact of a single measure they measure the impact of packages of measures acting on a given end-use (e.g. new cars, lighting, solar heaters...)
Conclusion: indicators and policies: the European experience

Beyond a monitoring of the energy savings and progress achieved these
indicators can be also used : To understand why the targets are not met so as to identify
corrective measures To compare/benchmark the countries progress and performance
with respect to energy efficiency performances and assess potential for improvement
Finally to assess the long term potential for energy efficiency improvement so as to see what new measures could be implemented indicators are the main input variables of the end-use models to be used for such assessments (e.g. MEDEE, MAED, LEAP)
Conclusion :multiple use of energy efficiency indicators

Thank you
http://www.odyssee-indicators.org http://www.MURE2.com

9% energy savings in 2016 compared to 2008 for each EU member country (“Energy Service Directive” (ESD) adopted in May 2006 ), with reporting obligation imposed to each EU member on actions undertaken and energy savings achieved, with harmonised calculation model using combination of top-down and bottom-up methods
20% energy efficiency progress by 2020
18% share of cogeneration by 2010
130g CO2/km for new cars by 2012 (new Directive)
Ban of incandescent lamps in 2012
Annex : example of official targets in the field of energy efficiency : EU Directives

Raise the annual energy intensity reduction of the GDP to -2%/year by 2015 and –2.5%/year by 2030
Obligation of energy savings for suppliers of electricity, gas, heating oil, and district heat to be made in consumer premises. imposed on (54 TWh* for 2006-2008 and 345 TWh* over 2010-2013) (with possibilities of buying energy savings certificates from other actors) (“White certificates”);
Energy uses of new buildings below 15 kWh/m2/year in 2020 (heating, water heating and ventilation)
Thermal retroffiting of: 400, 000 dwellings per year until 2020 with an objective of 38% total
savings in in 2020 for all dwellings built before 2008; 120 Mm2 of public buildings by 2020 with an objective of 40% savings
for all public buildings 139.5 TWh total energy savings in 2016 with final consumers according to
National Energy Efficiency Action Plan as required by EU ESD Directive *lifetime discounted energy savings”
Annex : French official targets in the field of energy efficiency, as included in Energy Laws