Embed Size (px)
Citation preview

ETSI ETR 053
TECHNICAL September 1996
REPORT Second Edition
Source: ETSI TC-RES Reference: RTR/RES-11001
ICS: 33.020
Key words: Mobile, radio, site engineering
Radio Equipment and Systems (RES);Radio site engineering for radio equipment and
systems in the mobile service
ETSI
European Telecommunications Standards Institute
ETSI Secretariat
Postal address: F-06921 Sophia Antipolis CEDEX - FRANCEOffice address: 650 Route des Lucioles - Sophia Antipolis - Valbonne - FRANCEX.400: c=fr, a=atlas, p=etsi, s=secretariat - Internet: [email protected]
Tel.: +33 92 94 42 00 - Fax: +33 93 65 47 16
Copyright Notification: No part may be reproduced except as authorized by written permission. The copyright and theforegoing restriction extend to reproduction in all media.
© European Telecommunications Standards Institute 1996. All rights reserved.

Page 2ETR 053: September 1996
Whilst every care has been taken in the preparation and publication of this document, errors in content,typographical or otherwise, may occur. If you have comments concerning its accuracy, please write to"ETSI Editing and Committee Support Dept." at the address shown on the title page.

Page 3ETR 053: September 1996
Contents
Foreword .......................................................................................................................................................9
Introduction....................................................................................................................................................9
1 Scope ................................................................................................................................................11
2 References........................................................................................................................................11
3 Definitions, symbols and abbreviations .............................................................................................123.1 Definitions ..........................................................................................................................123.2 Symbols .............................................................................................................................123.3 Abbreviations .....................................................................................................................13
4 Choice of site.....................................................................................................................................144.1 General ..............................................................................................................................144.2 Radio site selection criteria ................................................................................................15
4.2.1 Location chosen by propagation analysis......................................................154.2.2 Availability of capacity on existing sites.........................................................154.2.3 Compatibility ..................................................................................................164.2.4 Environmental and planning considerations..................................................16
5 System requirements ........................................................................................................................175.1 Private mobile radio (PMR)................................................................................................17
5.1.1 Introduction....................................................................................................175.1.2 Analogue PMR systems ................................................................................17
5.1.2.1 Public Access Mobile Radio ................................................185.1.3 Digital PMR systems .....................................................................................185.1.4 Potential sources of interference...................................................................19
5.2 Paging................................................................................................................................195.2.1 Introduction....................................................................................................195.2.2 On-site radio paging system..........................................................................195.2.3 Wide area paging systems............................................................................195.2.4 Signalling systems.........................................................................................205.2.5 Coverage in confined spaces ........................................................................20
5.3 Public radiotelephone ........................................................................................................205.3.1 Introduction....................................................................................................205.3.2 Public radiotelephone (analogue)..................................................................21
5.3.2.1 Frequency re-use.................................................................215.3.2.2 Hand-over ............................................................................21
5.3.3 Public radiotelephone (digital) - GSM/DCS 1 800 .........................................215.3.3.1 Data bases...........................................................................225.3.3.2 Radio ...................................................................................225.3.3.3 Traffic and signalling channel ..............................................22
5.3.4 Use of repeaters............................................................................................235.4 Confined space engineering ..............................................................................................23
5.4.1 Introduction....................................................................................................235.4.2 Characteristics of radiating cable ..................................................................235.4.3 Confined space radiocommunication systems..............................................24
5.4.3.1 Antenna characteristics .......................................................245.4.3.2 Recommendations for frequency range 150 kHz to
1 000 MHz ...........................................................................245.4.4 Installation and maintenance of radiating cables ..........................................25
5.5 Repeaters ..........................................................................................................................255.5.1 Introduction....................................................................................................255.5.2 Types of repeater ..........................................................................................265.5.3 Repeater characteristics................................................................................26

Page 4ETR 053: September 1996
5.5.4 Installation recommendations....................................................................... 26
6 Installation recommendations........................................................................................................... 276.1 Support structure and mechanical considerations ............................................................ 27
6.1.1 Structural integrity ......................................................................................... 276.1.2 Wind loading................................................................................................. 276.1.3 Protective coatings ....................................................................................... 276.1.4 Use of dissimilar metals................................................................................ 28
6.2 Equipment room................................................................................................................ 286.2.1 Equipment arrangements ............................................................................. 286.2.2 Environment.................................................................................................. 29
6.3 Electrical supply, protection and lightning protection ........................................................ 296.3.1 Electrical supplies ......................................................................................... 296.3.2 Lightning effects, protection and responsibilities .......................................... 296.3.3 Earthing of antenna support structures ........................................................ 306.3.4 Earthing of antennas, feeders and associated plant .................................... 31
6.4 Antennas and feeders ....................................................................................................... 316.4.1 Choice of antenna type................................................................................. 316.4.2 Antenna specification.................................................................................... 326.4.3 Location of antennas .................................................................................... 336.4.4 Radiation pattern .......................................................................................... 336.4.5 Gain .............................................................................................................. 336.4.6 Cross-polar performance.............................................................................. 336.4.7 Voltage standing wave ratio.......................................................................... 346.4.8 Wind vibration............................................................................................... 346.4.9 Degradation of antenna performance........................................................... 346.4.10 Cables, cable routes and connectors ........................................................... 346.4.11 Feeder identification, terminations and earthing........................................... 356.4.12 Sealing.......................................................................................................... 356.4.13 Inspection for moisture ................................................................................. 35
7 Problems identified on site................................................................................................................ 367.1 Generation of unwanted products ..................................................................................... 36
7.1.1 Broadband noise and spurious products of transmitters .............................. 367.1.1.1 Noise considerations........................................................... 377.1.1.2 Spurious considerations...................................................... 37
7.1.2 Ambient RF noise levels ............................................................................... 387.1.3 Intermodulation products between several source frequencies ................... 387.1.4 Intermodulation products caused by external effects ................................... 40
7.2 Intermodulation and blocking effects in receiver systems................................................. 407.2.1 Intermodulation between received signals.................................................... 407.2.2 Saturation of receiver front end .................................................................... 417.2.3 Selectivity of the receiver .............................................................................. 417.2.4 Spurious response of the receiver ................................................................ 427.2.5 Receiver protection for low power equipment (I-ETS 300 220 [9]) ............... 42
7.3 EMC issues ....................................................................................................................... 427.4 Technical responsibility of the site operator ...................................................................... 42
8 Avoiding radio frequency problems .................................................................................................. 428.1 Antenna distribution networks ........................................................................................... 438.2 Receiver distribution networks .......................................................................................... 438.3 Filters and couplers........................................................................................................... 43
8.3.1 Control of unwanted products....................................................................... 438.3.2 The ferrite circulator...................................................................................... 438.3.3 The cavity resonator ..................................................................................... 448.3.4 The spectrum dividing filter........................................................................... 448.3.5 Control of intermodulation, cross modulation and blocking effects in
receiver systems by filter protection ............................................................. 44
9 Environmental effects ....................................................................................................................... 449.1 Standards .......................................................................................................................... 449.2 Corrosion and climatic effects ........................................................................................... 459.3 Ultraviolet degradation ...................................................................................................... 45

Page 5ETR 053: September 1996
10 Health and safety ..............................................................................................................................4510.1 Introduction ........................................................................................................................4510.2 Radio frequency (non-ionizing radiation) hazards to personnel.........................................4610.3 Electrical safety..................................................................................................................4610.4 Physical safety ...................................................................................................................4610.5 Fire hazards .......................................................................................................................47
11 Site administration.............................................................................................................................4711.1 Site discipline .....................................................................................................................4711.2 Site records........................................................................................................................4711.3 Orientation of support structure and antennas ..................................................................4811.4 Working arrangements ......................................................................................................48
12 Maintenance recommendations ........................................................................................................4812.1 Support structure ...............................................................................................................4812.2 Equipment room ................................................................................................................4812.3 Electrical supply and lightning protection...........................................................................5012.4 Antennas and feeders........................................................................................................5012.5 Filters and couplers............................................................................................................51
13 Troubleshooting on radio sites ..........................................................................................................5213.1 Method of approach...........................................................................................................5213.2 Case studies ......................................................................................................................52
13.2.1 Cases where the use of cavity resonators, bandpass filters or ferriteisolators provided a cure ...............................................................................53
13.2.2 Case where the problem is related to equipment alignment .........................5413.2.3 Cases where the problems are related to broadcast transmitters ................5413.2.4 Cases where the problems are related to cables and connectors ................5613.2.5 Cases where the problems are related to site maintenance .........................5613.2.6 Cases where the problems are related to faulty equipment ..........................5613.2.7 Case where the problem is related to site modifications...............................5713.2.8 Case where the problem is related to equipment screening .........................5713.2.9 Accidental operation of discarded equipment ...............................................5813.2.10 Examples of lack of isolation between systems ............................................58
Annex A: Protection ratios and minimum field strengths required in the mobile services......................59
1 VHF and UHF land and maritime mobile services ............................................................................591.1 Protection ratios based on internal noise and distortion in the receiver.............................591.2 Man-made noise ................................................................................................................591.3 Noise Amplitude Distribution (NAD) determination of degradation....................................61
1.3.1 Definitions......................................................................................................611.3.1.1 Noise amplitude distribution.................................................611.3.1.2 Spectrum amplitude.............................................................611.3.1.3 Impulse rate.........................................................................611.3.1.4 Impulsive-noise tolerance....................................................61
1.3.2 Determination of degradation ........................................................................621.4 Minimum values of field strength to be protected ..............................................................62
Annex B: Spectral parameters................................................................................................................66
B.1 Spectral parameters for TX-RX compatibility ....................................................................................66
B.2 Evaluation of spectral parameters.....................................................................................................68
Annex C: Antennas and feeder systems ................................................................................................71
C.1 Common antenna configurations ......................................................................................................71
C.2 Stacking and baying data ..................................................................................................................72
C.3 Isolation between antennas...............................................................................................................74
Page 6ETR 053: September 1996
C.4 Control of precipitation noise ............................................................................................................ 75
C.5 Achieved Cross Polar Discrimination (XPD) for antennas mounted at an angle to precisehorizontal and vertical frames of axes .............................................................................................. 75
C.6 Antennas and feeders....................................................................................................................... 76C.6.1 Calculation of system reflection performance ................................................................... 76C.6.2 Points of note concerning the reflection performance of RF systems............................... 77C.6.3 Calculation procedure for system reflection performance................................................. 77C.6.4 Reflection performance calculations for radio site designers............................................ 77
C.6.4.1 Voltage reflection coefficient method............................................................ 77C.6.4.2 Recommended procedure ............................................................................ 77C.6.4.3 Calculation example ..................................................................................... 78
C.6.5 Reflection performance calculations for radio site engineers ........................................... 79C.6.5.1 Return loss method....................................................................................... 79C.6.5.2 Recommended procedure ............................................................................ 79C.6.5.3 Example calculations .................................................................................... 80
Annex D: Noise power on typical radio sites .......................................................................................... 83
Annex E: The position of metals in the galvanic series.......................................................................... 84
Annex F: Equipment arrangements....................................................................................................... 86
Annex G: Typical example of good earthing practice............................................................................. 87
Annex H: Equipment used to avoid radio frequency problems .............................................................. 88
H.1 Cavity resonators.............................................................................................................................. 88H.1.1 Introduction........................................................................................................................ 88H.1.2 General.............................................................................................................................. 88H.1.3 Typical applications ........................................................................................................... 88H.1.4 Cavity resonator construction............................................................................................ 89H.1.5 Alignment .......................................................................................................................... 91
H.2 Ferrite isolators and circulators ........................................................................................................ 92H.2.1 Introduction........................................................................................................................ 92H.2.2 General.............................................................................................................................. 92H.2.3 Typical applications ........................................................................................................... 93H.2.4 Ferrite isolator construction............................................................................................... 95
H.3 Characteristics of distribution amplifiers ........................................................................................... 96H.3.1 Receiver distribution amplifier system............................................................................... 96H.3.2 Receiver distribution amplifier in a 4 way multicoupler system ......................................... 97
H.4 Typical filter system .......................................................................................................................... 98
H.5 Trunking combiner.......................................................................................................................... 103H.5.1 Trunking combiner system.............................................................................................. 103H.5.2 Specification of a TX/RX trunking combiner ................................................................... 103
Annex J: Interference due to intermodulation products in the land mobile service between 25 and1 000 MHz ............................................................................................................................ 105
1 Introduction ..................................................................................................................................... 105
2 Transmitters.................................................................................................................................... 1052.1 Coupling loss Ac.............................................................................................................. 1052.2 Intermodulation conversion loss, AI ................................................................................ 105
3 External non-linear elements.......................................................................................................... 107

Page 7ETR 053: September 1996
4 Receivers ........................................................................................................................................107
5 Reduction of intermodulation product levels in transmitters............................................................1085.1 Intermodulation conversion loss ......................................................................................1085.2 Coupling loss ...................................................................................................................1085.3 Identification of the source of an intermodulation product ...............................................110
6 Reduction of intermodulation products in receivers ........................................................................111
7 Reduction of intermodulation interference by frequency arrangements..........................................111
8 Reduction of intermodulation interference by other arrangements .................................................111
Annex K: Sources of unwanted signals in multiple base station sites in the land mobile service ........112
1 Introduction......................................................................................................................................112
2 Simple frequency relationships .......................................................................................................112
3 Complex frequency relationships ....................................................................................................1123.1 Generation of intermediate frequency and/or its derivatives ...........................................1123.2 Generation of transmit/receive (TX/Rx) difference frequency .........................................112
4 Intermodulation products.................................................................................................................1124.1 Generated external to the site..........................................................................................1124.2 Intermodulation products generated on-site by non-linear junctions on the mast ...........1124.3 Intermodulation products generated on-site by non-linearity in components of the
system..............................................................................................................................113
5 Transmitter noise ............................................................................................................................113
6 External electrical noise ..................................................................................................................114
7 Summary .........................................................................................................................................114
Annex L: Intermodulation interference .................................................................................................115
L.1 Intermodulation spectrum................................................................................................................115
L.2 Products - combinations of two frequencies A and B excluding pure harmonics ...........................116
L.3 Intermodulation products.................................................................................................................119
Annex M: Transmitter noise measurement ...........................................................................................121
M.1 Introduction......................................................................................................................................121
M.2 Measurement system......................................................................................................................121
M.3 Measurement accuracy...................................................................................................................122
M.4 Results ............................................................................................................................................122
M.5 Explanation of plots .........................................................................................................................126
M.6 Conclusions.....................................................................................................................................127
Annex N: Radiocommunications in confined spaces............................................................................128
N.1 Systems for radiocommunications in confined spaces ...................................................................128N.1.1 Design consideration .......................................................................................................128

Page 8ETR 053: September 1996
N.2 Typical characteristics of radiating cable........................................................................................ 133N.2.1 Environmental influences ................................................................................................ 133N.2.2 Application example ........................................................................................................ 134
N.3 Design example for confined space engineering............................................................................ 134N.3.1 Design example .............................................................................................................. 134N.3.2 Conditions ....................................................................................................................... 134N.3.3 Design procedure............................................................................................................ 134N.3.4 Conclusions..................................................................................................................... 135
Annex P: TETRA parameters .............................................................................................................. 136
Annex Q: Typical national analogue cellular telephone networks ........................................................ 137
History ....................................................................................................................................................... 138

Page 9ETR 053: September 1996
Foreword
This ETSI Technical Report (ETR) has been prepared by the Radio Equipment and Systems (RES)Technical Committee of the European Telecommunications Standards Institute (ETSI).
ETRs are informative documents resulting from ETSI studies which are not appropriate for EuropeanTelecommunication Standard (ETS) or Interim European Telecommunication Standard (I-ETS) status.
An ETR may be used to publish material which is either of an informative nature, relating to the use orapplication of ETSs or I-ETSs, or which is immature and not yet suitable for formal adoption as an ETS orI-ETS.
Introduction
The growth of radio services has resulted in an increase in the number of radio sites required and in thenumber of users sharing their facilities.
The radio frequency spectrum is a finite natural resource for which there are many competing demands,therefore radio systems must be designed so that individual systems are very efficient and operate withminimum interference to other systems.
The aesthetic impact of radio structures provides an increasing constraint on the development of furtherradio sites. It is essential, therefore, to obtain the support of the community with regard to environmentalissues. Consequently it is necessary to demonstrate that the optimum use will be made of the proposedinstallation.
In granting building permission for a radio structure, local authorities expect radio system users to operatethe maximum number of systems from existing structures before giving consideration to an application foranother structure in the same area.
The use of radio or repeater stations is subject to the radio license conditions of the relevant regulatoryauthority. The inclusion of any type of radio station in the ETR does not mean its use will be permitted bythe responsible administration.
Whilst this ETR has been prepared to assist radio system designers to obtain optimum use of radio sitesand the radio spectrum, it is also intended for the guidance of those site operators and maintenanceorganizations who do not have ready access to radio systems engineers.
This document also addresses radio engineering installations which may cause potential problems withregard to interaction and interference.
Accordingly the document sets out methods and design solutions which are achievable without extensiveresources.
Radio equipment for the mobile and fixed services is built to standards which are directed to ensure theefficient use of the radio spectrum. One set of parameters control bandwidth and the level of out of bandradiation, which will cause interference to other users, and will specify the receiver sensitivity and limits tothe levels of spurious emission from receivers. Another set of parameters define conditions which make asystem less susceptible to interference by others; they include receiver selectivity, dynamic range andblocking characteristics. Good installation design ensures that as far as possible the performance of acomplete installation preserves the professional characteristics of the components, laying down theintended field strength in the designated area, avoiding the radiation of spurious emissions and preservingthe sensitivity of receivers.
The objectives are as follows:
a) to obtain the coverage required from the chosen site in a precise and well defined manner;
b) to minimize spectrum pollution to other users on adjacent sites;
c) to minimize interference to other co-sited users;

Page 10ETR 053: September 1996
d) to operate the system with the effective radiated power (erp) and optimum spectral efficiencycompatible with providing the required service;
e) to minimize the effects of lightning.
To fulfill the requirements of all relevant legislation and recommendations, the above criteria should bemet for the whole of the working life of the installation and should allow for future expansion. The quality ofservice is largely dependent on the planning of the system and considerable guidance on the topic is givenin annex A.
The layout of this ETR follows the logical approach that would be adopted in the provision of a new radiosite, from the selection of a suitable geographic location to the installation and maintenance ofradiocommunications equipment. It must be stressed that the order in which these subjects are discussedis not in order of importance. It is therefore essential to read the ETR in its entirety after which it may beused as a reference document.
Preventive maintenance and repairs will be required to ensure that the installation continues to meet theperformance criteria described; good engineering design will allow these activities to be carried out safelyand with minimum loss of service.

Page 11ETR 053: September 1996
1 Scope
This ETSI Technical Report (ETR) provides guidance for engineers concerned with the design,specification, installation, operation and maintenance of radio systems. It is particularly directed towardssystems working in the Very High Frequency (VHF) and Ultra High Frequency (UHF) bands butencompassing a measurement range between 9 kHz and 4 GHz in respect of compatibility where co-sitedoperation of many different users' equipment has become common. It does not specifically cover thetechnology associated with microwave systems.
This ETR examines the objectives of good design and the effects of common deficiencies. It providesrecommendations designed to ensure that users avoid interactions which result in mutual interference,spectrum contamination, or danger to personnel or equipment. References and annexes are provided forfurther reading by engineers who are new to the field or are encountering the problems which aredescribed for the first time.
This ETR also includes information relating to the safety precautions required when dealing withnon-ionising radiation.
The contents of this ETR have been arranged to identify the source of the problems found on radio sitesand recommendations are made for the control of these problems.
2 References
For the purposes of this ETR, the following references apply:
[1] CCIR Report 358-5: "Protection ratios and minimum field strengths required inthe mobile services".
[2] CCIR Report 739-1: "Interference due to intermodulation products in the landmobile service between 25 MHz and 1 000 MHz".
[3] CCIR Report 1019: "Sources of unwanted signals in multiple base station sitesin the land mobile service".
[4] CCIR Report 258-4: "Man made radio noise".
[5] ETS 300 086 (1991): "Radio Equipment and Systems (RES); Land mobile groupTechnical characteristics and test conditions for radio equipment with an internalor external RF connector intended primarily for analogue speech".
[6] ETS 300 113: "Radio Equipment and Systems (RES); Land mobile service;Technical characteristics and test conditions for radio equipment intended forthe transmission of data (and speech) and having an antenna connector".
[7] ETS 300 296: "Radio Equipment and Systems (RES); Land mobile serviceTechnical characteristics and test conditions for radio equipment using integralantennas intended primarily for analogue speech".
[8] ETS 300 390: "Radio Equipment and Systems (RES); Land mobile service;Technical characteristics and test conditions for radio equipment intended forthe transmission of data (and speech) and using an integral antenna".
[9] I-ETS 300 220: "Radio Equipment and Systems (RES); Short range devicesTechnical characteristics and test methods for radio equipment to be used in the25 MHz to 1 000 MHz frequency range with power levels ranging up to500 mW".
[10] ENV 50166-2: "Human exposure to electromagnetic fields - High frequency(10 kHz to 300 GHz)".

Page 12ETR 053: September 1996
[11] I-ETS 300 230: "Radio Equipment and Systems (RES); Land mobile serviceBinary Interchange of Information and Signalling (BIIS) at 1 200 bit/s(BIIS 1 200)".
3 Definitions, symbols and abbreviations
3.1 Definitions
For the purposes of this ETR, the following definitions apply:
communal site: A location at which there is more than one fixed transmitter. There are two types ofcommunal site; one having separate equipment and antennas but housed in a common equipment room,and the other having an engineered system employing common antenna working where the isolationbetween equipment's is determined by the filter system.
At all communal sites equipment installed on the site must meet the limits as specified in the relevantstandards.
finial: Metal spike or similar device mounted on the topmost part of a structure - usually for lightningprotection in the context of this document.
single fixed station: A radio station where only one Radio Frequency (RF) carrier can be radiated at anyone time; the fixed station equipment is only required to meet the limit specified for intermodulationattenuation. All other limits in the relevant standard should be met.
multiple fixed station: When two sites are in close proximity the decision governing when they should beclassed as a single site or two sites shall be decided by the RF isolation between them. The limitingminimum figure shall be 60 dB but this figure should ideally exceed 70 dB at all frequencies of operation.In any case any signal received from a neighbouring site should not exceed - 20 dBm and ideally- 30 dBm.
downlink: A radio path for the transmission of signals from one Base Station (BS) to Mobile Stations(MS).
uplink: A radio communication path for the transmission of signals from Mobile Stations (MS) to one BaseStation (BS).
spurious emissions: Emissions at frequencies other than those of the carrier and sidebands associatedwith normal modulation.
3.2 Symbols
For the purposes of this ETR, the following symbols apply:
ac alternating currentC/I Carrier to Interference ratioC/N Carrier to Noise ratiodB decibeldBc decibel relative to carrierdBd decibel relative to a half wave dipoledBi decibel relative to an isotropic radiatordBm decibel relative to one mWdc direct currentGHz GigahertzHz HertzIntermod IntermodulationkHz kilohertzkm kilometrekW kilowattMHz Megahertzm metremm millimetre

Page 13ETR 053: September 1996
mW milliWattRX ReceiverTX TransmitterV VoltW Watt
3.3 Abbreviations
For the purposes of this ETR, the following abbreviations apply:
ABS Acrylonitrile Butadiene StyreneAF Audio FrequencyAMPS Advanced Mobile Phone SystemAUC Authentication CentreBIIS Binary Interchange of Information and SignallingBPSK BiPolar Shift KeyingBSC Base Station ControllerBT Bandwidth Time productBTS Base Transceiver StationCBS Common Base StationDCS Digital Communications SystemDTMF Dual Tone Multi FrequencyDQPSK Differential Quadrature Phase Shift KeyingEIR Equipment Identity RegisterELCB Earth Leakage Circuit BreakerEMC ElectroMagnetic Compatibilitye.m.f. electro-motive forceEPIRB Emergency Position Indication Radio BeaconERMES European Radio Message Systemerp effective radiated powerETACS Extended Total Access Communications SystemFDMA Frequency Division Multiple AccessFM Frequency ModulationFSK Frequency Shift KeyingGFSK Gaussian Frequency Shift KeyingGMSK Gaussian Minimum Shift KeyingGSM Global System for Mobile communicationsHF High FrequencyHLR Home Location RegisterIF Intermediate FrequencyISDN Integrated Services Digital NetworkLMS Land Mobile ServiceMF Medium FrequencyMSC Mobile services Switching CentreMSK Minimum Shift KeyingMTBF Mean Time Between FailureNAD Noise Amplitude DistributionNMT Nordic Mobile Telephone systemNRJ Non-Reciprocal JunctionPA Power AmplifierPAMR Public Access Mobile RadioPDO Packet Data OptimizedPIB PolyIsoButylenePMR Private Mobile RadioPOCSAG Post Office Code Standardization Advisory GroupPSK Phase Shift KeyingPSTN Public Switched Telephone NetworkPVC PolyVinylChlorideRCCB Residual Current Circuit BreakerRCD Residual Current DeviceRF Radio FrequencyRL Return Loss

Page 14ETR 053: September 1996
RIC Radio Identity CodeSIM Subscriber Identity ModuleSMS Short Message ServiceTACS Total Access Communications SystemTDMA Time Division Multiple AccessTETRA Trans-EuropeanTrunked RadioUHF Ultra High FrequencyVHF Very High FrequencyVLR Visitor Location RegisterVSWR Voltage Standing Wave RatioXPD Cross Polar Discrimination
4 Choice of site
4.1 General
For a proposed service, sites are chosen for their ability to provide coverage of the required service area.Buildings or other existing structures can be used providing a suitable antenna system can be erected. Indeciding the suitability of sites, the effects on coverage of local physical obstructions must be taken intoaccount. The final antenna height must be sufficient to clear obstructions if a good radiation pattern is tobe achieved.
Preference is usually given to sites centrally located within the required service area so that maximumcoverage is achieved with an omni-directional radiation pattern. In the event that no suitable locations canbe found, it may be necessary to utilize sites on the periphery of the service area. In these circumstancesdirectional antennas would normally be employed to limit radiation to the desired area.
The use of the highest available site is not always the best decision. As more users occupy the availableradio spectrum there is an increasing need to share frequencies. The use of an unnecessarily high sitemay provide degraded service due to co-channel users. Modern systems are frequently designed on aninterference limited, rather than a noise limited criteria.
When locations have been identified which meet the coverage requirements, determined attempts shouldbe made to share existing sites with other users. The site sharing decision will be influenced by theavailability of sites, their coverage potential and whether RF compatibility exists with the other users'equipment.
If the construction of a new site is necessary the location should be carefully chosen both from thecoverage and the environmental and planning aspects. Other radio users should always be informed ofthe proposals as a large number may wish to expand their systems and share the new facility if it offerssignificant advantages.
It is essential that all potential users are taken into account in the initial planning of a site. There havebeen many cases in the past where a multitude of small sites have been erected in close proximity due tolack of early consultation. Co-operation to build a single large structure would mean users could sharecosts and all would benefit from increased performance of the facility.
To design installations which meet the user's expectations the requirements must be understood andinterpreted with the propagation parameters of the frequencies to be used. In certain environments it maybe extremely difficult to provide a clear path for the required radiation pattern. The choice of site may be acompromize between radio coverage requirements, technical considerations and economic or planningconstraints.
The fundamentals to the choice of radio sites may be summarized as follows:
a) examination of user requirements, service area, frequency, licence power limits, modes of operation;
b) inspection of service area to identify preferred locations for sites;
c) search for existing sites in the preferred areas;
d) analyse suitability of existing sites and the feasibility of site sharing;

Page 15ETR 053: September 1996
e) formulate proposals for new sites where necessary.
The choice of sites is an iterative process that may have to be repeated several times to produce theoptimum choice of sites. Where compromizes are necessary it is essential that the user is given theopportunity to consider what effects coverage irregularities will have on the service.
4.2 Radio site selection criteria
Radio site selection criteria can be classified as follows:
a) location chosen by propagation analysis;
b) availability of capacity at existing sites;
c) site compatibility;
d) environmental and planning considerations.
4.2.1 Location chosen by propagation analysis
Propagation analysis is necessary to decide in which areas to search for radio sites, to check thesuitability of an existing site, or to decide the exact location for the construction of a new radio site.
Propagation information must be related not only to the site location but also to the power, frequencyband, antenna height and type of the system in use. It must account for the screening effects of terrainand clutter e.g. buildings and trees. It must also consider the reception environment of the mobile stationwhich may suffer from man made noise or multi-path fading due to signal reflections.
Propagation information can be obtained by several methods as follows:
a) information from site operators based on their experience of existing sites;
b) manual calculations by an experienced propagation engineer based on map information of terrainheight and features;
c) computer field strength predictions generated by evaluating radio path loss from a database of terrainheight and feature data;
d) radio survey by the establishment of a test station at the proposed location for the purpose of carryingout coverage measurements.
To identify the areas of search for radio sites, calculations from terrain details are the most appropriate.These may also be adequate to check the suitability of an existing site when they are examined along withthe past experiences of other site users.
To decide the location of a new site computer predictions are strongly advised. These are available from anumber of commercial organizations. The magnitude of the variations is dependent on the accuracy andresolution of the terrain database used to generate the predications, and the quality of the propagationmodel.
The most reliable information is obtained by the establishment of a test station and measurement of signalstrength across the area of interest. Such tests must be carefully executed to simulate the user's finaloperational conditions.
4.2.2 Availability of capacity on existing sites
When a suitable existing site has been located there are several options available to the new user andthese are as follows:
a) to share an information channel on an existing system;
b) to share a frequency division filter system on an existing antenna;
Page 16ETR 053: September 1996
c) to share the equipment accommodation and install a new antenna on the structure;
d) to provide separate equipment accommodation and install a new antenna on the structure.
Each possibility must be evaluated against the users' requirements. The proposals will be affected byvarious technical and economic limitations.
In the event that there are serious shortcomings in equipment room accommodation, antenna mountingpositions or antenna structure load bearing capability, a complete site redevelopment may be required. Itmay be concluded that site sharing is not viable and that an alternative site should be sought.
4.2.3 Compatibility
For satisfactory performance of the installed system, radio site compatibility is essential. This covers allRF aspects which may cause interference to or from the proposed system. Compatibility with other usersof the same or adjacent sites must be ensured.
Wherever possible, the location of a radio structure should be chosen with reference to its isolation fromother radio transmission activity. It should preferably be at least 500 m from a busy road. This is to avoidthe reception of vehicle ignition noise and to prevent interference from passing mobile radio transmitters.
The ambient noise level, particularly at urban sites in the lower VHF bands, will have a limiting effect onreceiver sensitivity and therefore receiver range and performance. Ambient RF noise includesatmospheric noise and man made electrical noise. Care should be taken to avoid areas of high level manmade noise either from industrial or domestic sources. The increased processing speed and greaternumber of computing equipment's in recent years has proved to be a virulent source of radio noise insome cases even affecting the UHF bands. Annex A gives guidelines for ambient noise levels for variousfrequencies and environments.
The possibility of RF breakthrough into other electronic equipment should be considered. In the pastcases of breakthrough to audio and video equipment have been reported due to the siting of radioinstallations in residential areas. It is important to realize that there are no actions that can be taken at theradio site to eliminate high ambient noise levels and RF breakthrough effects. These can only be reducedby measures which would also drastically affect the wanted coverage area.
Inability to achieve compatibility with local factors or with existing site users may cause the site to berejected in favour of an alternative site offering better compatibility.
4.2.4 Environmental and planning considerations
Radio sites are prominent features of the landscape. It is therefore understandable that many buildingauthorities pay particular attention to applications for new sites and for redevelopment of existing sites.There are also organizations and individuals who will raise objections to any application. Objections will bemore numerous where the site is located in a National Park, Area of Outstanding National Beauty or Areaof High Landscape Value.
It is important that these aspects are carefully considered at the planning stage of any new site orredevelopment. Applications prepared without due consideration will result in refusal which may beimpossible to overturn.
Whilst the site must have sufficient capacity for the foreseeable requirements, it should create theminimum impact on the environment. For example:
a) relocating the site a small distance without changing the performance may drastically reduce theimpact on the surroundings;
b) minimization of the number of antennas, careful choice of antenna types and their arrangement in asymmetrical form, subject to a satisfactory RF performance, will provide a better appearance;
c) an alternative type of support structure may present a more acceptable profile;

Page 17ETR 053: September 1996
d) varying materials, styles and colours for construction of equipment buildings may result in a moreacceptable appearance;
e) landscaping of the compound with the addition of trees and shrubs will improve the visual impact ofthe site.
5 System requirements
5.1 Private mobile radio (PMR)
5.1.1 Introduction
The most common use of private mobile radio (PMR) is to provide two way communication between afixed site and a number of mobile units.
PMR systems operate in specifically allocated parts of the Very High Frequency (VHF) and Ultra HighFrequency (UHF) bands. Each frequency band is divided into a number of separate channels spaced at5 kHz, 6,25 kHz, 12,5 kHz, 20 kHz or 25 kHz.
Most mobile radio services use Frequency Modulation (FM). In some cases phase modulation (PM) or FMwith pre-emphasis is used to improve the received signal to noise ratio. Amplitude modulation (AM) isused in some of the VHF bands. An increasing number of modern mobile radio networks use digitalmodulation such as Phase Shift Keying (PSK) or Frequency Shift Keying (FSK). Single sideband or linearmodulation techniques using narrow band channels may be introduced, with the aim of improvingspectrum efficiency.
PMR equipment is covered by ETSI standards ETS 300 086 [5] and/or ETS 300 296 [7] for speech(analogue FM or PM systems) and ETS 300 113 [6] and/or ETS 300 390 [8] for the transmission of data(and speech). These ETSI standards apply to constant envelope angle modulation systems using theavailable bandwidth, operating on radio frequencies between 30 MHz and 1 GHz, with channelseparations of 12,5 kHz, 20 kHz and 25 kHz depending on different national regulations.
5.1.2 Analogue PMR systems
The simplest form of PMR system is a single frequency simplex system. In this case the transmitters andreceivers in the same system all operate on the same frequency. This mode of operation calls for a highdegree of operational discipline on the part of the users. Single frequency channels may be assigned tolow power and to handportable to handportable services.
Most PMR systems use two frequency channels. The base station transmits on one of these frequenciesand the mobile stations in the same system transmit on the other frequency. This is known as twofrequency simplex, or semi duplex operation. With the addition of suitable control apparatus, the basestation transmitter may be operated in a full duplex, or repeater, mode. In this way communication may beestablished between mobile or portable users within range of the base station who may not otherwise beable to communicate directly between themselves. The repeater facility may be under the control of anoperator.
Trunked PMR systems operate in a full duplex mode at the base station. The user terminals may be eitherfull or semi-duplex. Trunked systems have the facility to automatically establish calls between individualusers, pre-defined groups of users or to all users of the system. Additional facilities such as theconnection of radio terminals to a private telephone network, and the transfer of short text messages mayalso be found in a trunked PMR system.
In the case of PMR, there are self provided services in which the licensees own and operate their basestations. Most users operate a single base station with a few mobiles. Some private networks have manybase stations and may have several thousand mobile units. These larger systems use various techniquesto provide near contiguous coverage of large areas. These techniques include scanning mobiles,quasi-synchronous operation of all base station transmitters with receiver voting and more recentlytrunked radio systems. Other systems may use a single frequency with or without base stations forapplications such as site security.

Page 18ETR 053: September 1996
Shared PMR channels are used by several licensees, each with their own base station. In highlypopulated areas the coverage area of many channels can overlap each other such that severalsimultaneous transmissions can occur, with resulting interference. The use of access tone signallingsystems can minimize the problem but does not offer a complete solution.
Common Base Station (CBS) systems are offered to subscribers by operators or service providers. CBSoperators provide wide area coverage using a single or many radio channels from one or several basestations. Some networks can be built in a complex configuration in order to provide a good service anduse coverage techniques such as simulcast, multi-channel configuration with sites linked by leased linesand voting systems. In some cases, networks can be dedicated to specific types of use, e.g. security,funds transportation, building or park keepers. Different user groups have to share a system. Sharingneeds a signalling protocol based on audio tones or digital signalling (e.g. BIIS 1 200 [11]) resulting fromthe needs of users of the networks.
5.1.2.1 Public Access Mobile Radio
Public Access Mobile Radio (PAMR) operators offer regional or national coverage using trunked multiplechannel systems. In a trunked system, subscribers share a pool of channels and are automaticallyallocated a vacant channel to make a call. Trunking has additional advantages in spectrum efficiency,operator simplicity, reliability, privacy and ease of expansion. Call set up processing is by use of digitalsignalling and communication may be by analogue speech, digital speech or data signals.
In a typical PAMR system, each radio station transmits a control signal on a radio channel. It also has anumber of traffic channels at its disposal on which users of radio units communicate. When not in use, theradio unit is automatically tuned to the control signal and the unit's microprocessor can communicate withthe system computer on this channel at any time.
When the user wishes to make a call, the unit transmits the request in the form of a data signal to thesystem computer. The computer finds the caller's desired correspondent and, by means of the controlchannel, checks for willingness to receive a call. When both called and calling parties are ready tocommunicate, the computer allocates the first available traffic channel.
When the call is terminated by either party, the radio unit sends a data signal releasing the channel.
Radio stations may be interconnected to increase the service area to provide any size of network, up to anational or international level.
Calls may also be made into other fixed line networks such as telephone systems.
Clause H.5 shows a configuration of equipment for a typical trunking installation.
5.1.3 Digital PMR systems
Many complete systems are known under their commercial designation. These are dedicated to differentusers such as mobile data, police systems and taxi networks. They can be operated on a local, regional,national or European coverage, using one or many frequencies. The protocols can be proprietary orpublic. The bit rates are usually under 9 600 bit/s.
The digital systems can use different types of modulation, viz indirect (via the normal audio circuitry) for arate of signalling not higher than 2 400 bit/s and direct frequency modulation for higher data rates(> 4 800 bit/s).
The most current modulations are:
- Minimum Shift Keying (MSK);- FSK;- BiPolar Shift Keying (BPSK);- Gaussian Minimum Shift Keying (GMSK);- Gaussian Frequency Shift Keying (GFSK);- FM 2 or 4 levels.
The access to the channels can be by Frequency Division Multiple Access (FDMA) or Time DivisionMultiple Access (TDMA) methods.

Page 19ETR 053: September 1996
However, manufacturers recognized the commercial value of a standardized digital system andharmonized standards for the Trans European Trunked Radio (TETRA) system have been developedover a number of years by ETSI committees.
The Trans European Trunked Radio (TETRA) system is a standardized private digital trunked mobileradio system designed to work in the UHF band between 380 - 400 MHz, 410 - 430 MHz and450 - 470 MHz.
Original discussions noted the requirements for both "Voice plus Data" and "Data only" systems and thatburst mode (or packet switched data) whilst being the optimum for "Data only" systems also needed to besupported by "Voice plus Data" systems. These basic concepts led to the levels of standardization for bothprivate and public access systems. The two standards "Voice plus Data" and "Data only" (now calledPacket Data Optimized (PDO)) cover digital speech and data (with optional connection to public or privatenetworks) and are applicable to a wide range of single or multisite systems.
The technical parameters for TETRA are shown in annex P.
5.1.4 Potential sources of interference
Mobile radio equipment can be affected by other sources of radiated products on the same site or in closeproximity. General details are contained in subclause 7.1 (Generation of unwanted products) andsubclause 7.2 (Intermodulation and blocking effects in receiver systems).
In order to minimize these effects, the use of filter systems and other related devices is stronglyrecommended. General details can be found in clause 8 (Avoiding radio frequency problems).
5.2 Paging
5.2.1 Introduction
Paging is a one way communication system for sending coded signals to personal receivers. Eachreceiver contains a unique Radio Identity Code (RIC) and when a transmission containing this code isreceived, the bearer is alerted by means of an audible tone, a light or a vibrator. The alert may beaccompanied by a voice message, a numeric message or an alphanumeric message for display on thereceiver.
Radio paging systems are described as either on-site or wide area paging systems.
5.2.2 On-site radio paging system
On-site radio paging systems are intended for the internal coverage of a premise or local site completelywithin the user's control.
On-site paging systems include High Frequency (HF), VHF and UHF systems and also induction loopsystems using frequencies below 9 kHz. Some HF, VHF and UHF systems may be authorized to useoutgoing speech facilities, but return speech may only be permitted for emergency services. With aninduction loop system, outgoing and return speech is normally permitted although the return speech istypically in the VHF band.
5.2.3 Wide area paging systems
Paging systems where the radio coverage extends beyond a local site are classified as wide-area.
The reliable range of operation varies considerably depending on the base station location, and systemsare designed to ensure a high probability of a user receiving a call whilst in the published coverage area. Anetwork of base stations may be required for large regional or national systems. Where multiple basestations operate on the same frequency and their coverage areas overlap, then special attention isrequired to co-ordinate the frequency and modulation characteristics of these transmitters to ensure theyoperate in quasi-synchronous mode.
Wide area paging systems often use transmitters of higher power than those in normal PMR systems.

Page 20ETR 053: September 1996
5.2.4 Signalling systems
Voice paging systems usually employ frequency or phase modulation techniques. The addressing ofreceivers is achieved by transmitting two or more audio tones sequentially. The receiver, on recognisingthe correct tone sequence, activates and a voice message is received.
Numeric and alphanumeric display paging systems often use an open standard called Post Office CodeStandardization Advisory Group (POCSAG) which was developed in the UK and accepted by CCIR as aNo. 1 code for wide area paging. The air interface employs frequency shift keying techniques, and thecarrier is modulated by a binary synchronous data stream. The maximum rate at which transitions mayoccur determines the bit rate, which for POCSAG systems may be 512, 1 200 or 2 400 bits per second.The modulation is 2 level FSK with 4,0 kHz, 4,5 kHz or 5 kHz deviation.
A newer signalling system, the European Radio Message System (ERMES), has been adopted by CCIRfor paging use. This specification defines the complete interconnection of networks in addition tospecifications of the air interface. ERMES transmissions are 4-level FSK transmissions, where each levelrepresents the binary digits 00, 01, 10 or 11. This together with a higher signalling rate results in a bit rateof 6,125 kbit/s in a 25 kHz channel, giving the operator greater capacity than that offered by existingPOCSAG systems. ERMES channels lie within the frequency range 169,4 MHz to 169,8 MHz, and as withall wide area systems, transmitters operate at high power. This frequency range lies close to existing PMRbase receiver frequencies, and site operators must ensure that receivers operating in adjacentfrequencies are protected from the ERMES transmissions. Two mechanisms by which interference at asite can be caused have been identified, viz. desensitization (blocking) and generation of intermodulationproducts. To minimize blocking, a notch filter in the receiver antenna downlead, designed to reject theunwanted transmission is recommended, although this becomes difficult if there are several unwantedERMES transmissions. To minimize intermodulation, the use of ferrite isolators in each transmitter'santenna lead is recommended.
5.2.5 Coverage in confined spaces
Paging systems often use radiating cable techniques and repeaters when coverage is required inbuildings and where screening prohibits the use of conventional antenna systems (see subclause 5.4 formore details). Mixtures of radiating cables and conventional antennas are also often used in some systemconfigurations, sometimes with the use of repeaters (see subclause 5.5 for more details).
5.3 Public radiotelephone
5.3.1 Introduction
A public radiotelephone system is designed as a network of contiguous radio cells, together providing anear complete coverage of the service area. Each cell has a Base Transceiver Station (BTS) operating ona dedicated set of radio channels which are different from the channels in adjacent cells. The primaryfunction of the BTS is to provide radio transmission and reception. The BTS may contain one or moretransceivers to provide the required capacity. A cell-site may be omni-directional or split into (typicallythree) directional cells.
A group of base stations is controlled by a Base Station Controller (BSC) for functions such as handoverand power control. A group of BSCs is served by a Mobile services Switching Centre (MSC) which routescalls to and from the Public Switched Telephone Network (PSTN) or other services.
Two types of interference occur, namely co-channel and adjacent channel interference. As these sourcesof interference occur within the system they can be controlled by the designer.
Co-channel interference is controlled by selecting a geographical re-use pattern for frequencies whichensures that the same channels are not used in adjacent cells.
Adjacent channel interference is a possibility in systems using wide deviations for speech and datacompared to the channel spacing. This can be tolerated if adjacent channels are not used in the same celland if the frequency re-use distance ratio is increased.
Cell channel groups are selected to minimize co-site intermodulation products.

Page 21ETR 053: September 1996
5.3.2 Public radiotelephone (analogue)
Each base station provides two types of radio channel: a duplex control channel to transfer informationwhen a call is being set up and a duplex voice channel which is used for the telephone conversation.Adjacent radio base stations operate on different sets of channels to minimize interference, whilenon-adjacent base stations can re-use the same radio frequencies simultaneously (frequency re-use).
As with conventional telephone networks, data and information can be transmitted and received on thepublic radiotelephone systems by the use of appropriate modems.
Examples of typical national analogue cellular telephone networks in use are contained in annex Q.
5.3.2.1 Frequency re-use
Each cellular system is allocated a number of channels. Channels are grouped together in channel setsand allocated to patterns of cells that fit together to give continuous coverage. For each pattern there is adistance D that separates the base stations using the same channel set. When divided by the cell radiusthis is known as the re-use ratio. The smaller the re-use ratio, the fewer the channel groups that arerequired and for a given total number of channels, the higher the trunking efficiency. However, thepotential for co-channel interference is increased as the re-use ratio is decreased, and the hand-overactivity is also increased.
5.3.2.2 Hand-over
During a communication the base station monitors the level of received signals and messages are sent tothe mobile to adjust its transmitter power as required. If the transmission quality falls below an acceptablelevel then the MSC checks the adjacent base stations to determine which can provide the best reception.The mobile is advised of the new channel to be used and the MSC connection is made to the new basestation. This activity is known as hand-over and occurs automatically without the mobile user's knowledgeor intervention and the call continues uninterrupted. Signal quality is not the only criteria used to determinewhether hand-over is required. Distance or position measurement may be used alone or in conjunctionwith signal quality.
5.3.3 Public radiotelephone (digital) - GSM/DCS 1 800
The Global System for Mobile communications (GSM) provides a common standard for mobile phoneoperation. People can drive their cars, fitted with mobile phones, or travel to foreign destinations with theirhand held phones retaining the facility to receive and make calls. This may be done without makingspecial arrangements or additional subscription charge. GSM has been designed to be compatible withthe Integrated Services Digital Network (ISDN) principles.
GSM is designed to use digital technology for performance and reliability. Phones may also be used for awide variety of data services, including the Short Message Service (SMS), facsimile transmission and datacommunications to most common standards, at rates up to 9 600 bits/sec full duplex.
On GSM, subscription is on a Subscriber Identity Module (SIM) card which is a microcomputer withmemory. Once plugged into a GSM phone all calls for that number are directed to it and all outgoing callsare charged to that subscriber.
Security is enhanced by the use of digital encryption, which is effective against unauthorizedeavesdropping on conversations. This applies equally to data transmission.
GSM operates in the 900 MHz frequency band but the same or similar protocols can be used at otherfrequencies.
The Digital Cellular System 1 800 (DCS 1 800), operating in the 1 800 MHz frequency band, is based onthe GSM system but is intended for personal communications. Although it is described as a pan-Europeandigital cellular radiotelephone system, current units are geared towards domestic use, replacing theconventional telephone, rather than the ability to work in Europe.

Page 22ETR 053: September 1996
5.3.3.1 Data bases
The BSC database holds all the parameters for configuring the Base stations. The BSC downloads thedata onto the Base Stations to set parameters which determine the coverage and frequency, as well astheir traffic handling capabilities. The BSC also stores the parameters use to control the cell on which amobile initiates a call and when it should handoff to another cell while the call is in progress. For thesepurposes data is passed to the mobile to allow it to assess the signal path.
Alarm data is set within the BSCs and MSCs to monitor equipment health and site access throughout thenetwork. Equipment failure and other alarms are raised in central control rooms for immediate action.
A Home Location Register (HLR) carries information about subscription levels, supplementary servicesand the network/location currently, or most recently, in use by subscribers. Working in close associationwith the HLR is the Authentication Centre (AUC) which provides the information to authenticate all calls inorder to guard against fraud, stolen subscriber cards or unpaid bills.
A Visitor Location Register (VLR) stores information about subscriber levels, supplementary services andlocation area for a subscriber currently, or most recently, in that (visited) area.
An Equipment Identity Register (EIR) stores information about the type of mobile in use and can bar a callif it considers the mobile is stolen, not type approved or has a fault which may disturb the network.
5.3.3.2 Radio
GSM uses Time Division Multiple Access (TDMA) with 8 time slots (i.e. any one call transmitting for oneeighth of the time). Hence, one radio channel can support 8 "full rate" traffic channels, but a "half rate"scheme will be introduced with 16 traffic channels. A TDMA frame has a period of 4,615 ms(about 217 per second). The radio channel separation is 200 kHz. The frequency band used is890 - 915 MHz for mobile transmit and 935 - 960 MHz for base transmit. Hence there is a 45 MHzseparation between transmit and receive channels.
The peak power of mobile stations depends on the "class". These were originally envisaged as being 20,8, 5, 2 and 0,8 watts for classes 1 to 5. In practice, nearly all the market is occupied by 2 W mobiles(class 4). The mean power per user is one eighth (full rate channel of these figures). To minimizeswitching sidebands, the transmitted power is smoothly ramped up and down at the start of each burst,over a period of 28 ms. At any BTS one radio channel will be transmitting continuously, while additionaltransceivers will only transmit during timeslots occupied by active calls.
Power control (15 steps of 2 dB) is provided to avoid interference and increase battery life. Frequencyhopping may be employed in order to avoid "deadspots" and mitigate the effects of interference.The hopping rate is one hop per TDMA frame.
The method of modulation used is Gaussian Minimum Shift Keying (GMSK), with a Bandwidth Timeproduct (BT) value of 0,3 at a gross rate of 270 kbit/s. Thus it is seen that GSM is a digital radio systemwith a high data rate, so an equalizer must be employed, in particular to cope with a multipath environmentwith up to 16 ms dispersion. Most transmitted data is protected by error correcting codes. Phase andfrequency synchronization must allow for Doppler shift for vehicle speeds of up to 250 km/h as well as forfrequency standard drift. Timing advance must compensate for propagation delay due to round trips forpaths, in cells up to 35 km radius.
All clock and timing frequencies required in a GSM system can be derived by division of a 13 MHz masteroscillator.
5.3.3.3 Traffic and signalling channel
The information transmitted over the radio interface consists of a number of data streams, confusinglyknown as "channels". Information from all of these channels is sub-multiplexed into appropriate timeslotson the radio link. Traffic channels are defined for speech and for data at the rates of 9,6 kbit/s, 4,8 kbit/sand < 2,4 kbit/s.

Page 23ETR 053: September 1996
In addition a number of logical signalling channels are specified. These operate at different rates withindividual functions:
- slow associated control channels Control and supervisory signals associated with trafficchannels;
- fast associated control channels Steal time slots from traffic allocations and use to controlrequirements such as handover;
- dedicated control channels Multiplexed on standard channels for registration, locationupdating, authentication and call set-up;
- broadcast control channels Down link only, providing mobiles with data such as basestation identity;
- paging channel Down link only, informing mobiles that the network wantsto make contact;
- random access channel Up link only for mobiles wanting access to the network;
- access grant channel Down link only, replying to random access and assigninga dedicated control channel for signalling;
- cell broadcast channel Down link only, sending cell broadcast information.
5.3.4 Use of repeaters
To extend the coverage range in areas of poor propagation, repeaters may be used. Further details on theuse of repeaters are contained in subclause 5.5.
The general description and planning aspects of repeaters for use with GSM networks are described inGSM delta specifications to GSM 05.05 and GSM 03.30.
5.4 Confined space engineering
5.4.1 Introduction
In confined spaces such as tunnels, underground buildings, car parks and shopping precincts, standardtechniques of radiocommunication involving antennas as radiation or pick-up devices have severaldisadvantages:
a) due to multiple reflections and high absorption losses, the range for the antenna is reduced to afraction of the range in free space;
b) due to multiple reflections the points of in-phase and out-of-phase reflections would cause erraticcommunications, particularly whilst moving;
c) for VHF, the size of a fixed antenna within a confined space, such as a tunnel, would beimpracticable.
In order to provide reliable communications within a confined space, a specialized antenna system isused. The antenna system can consist of a radiating cable (see subclause 5.4.2), a number of distributedantennas or a combination of both. The radiating cable functions as a continuous antenna so that multiplereflections are minimized.
5.4.2 Characteristics of radiating cable
A radiating cable is a form of transmission line and is typically a coaxial cable with slots or apertures thatallows a controlled portion of a transmitted RF signal to radiate along the entire length of the cable.Conversely, a signal transmitted near to the cable will couple to the cable.

Page 24ETR 053: September 1996
A single radiating cable is a broadband medium and can handle any number of communication systems indifferent frequency bands.
It is recommended that either continuously leaky coaxial cables or coaxial cables with periodic aperturesare used in radiating cable systems.
See clause N.2 for typical characteristics of radiating cables.
5.4.3 Confined space radiocommunication systems
Radio coverage in confined spaces is difficult to engineer by use of an antenna solution at operatingfrequencies below approximately 500 MHz. At higher frequencies, radio coverage may be achieved by acombination of antennas and radiating cables.
A practicable combination of radiating cables, repeaters (see subclause 5.5) and antennas can bearranged to optimize the propagation requirements of an installation whilst keeping installation costs to aminimum.
A practical method of obtaining the best possible coverage consists of terminating a radiating cable in anantenna which continues to provide coverage beyond the end of the radiating cable.
Systems for radiocommunications in confined spaces are described in clause N.1 and clause N.3.
5.4.3.1 Antenna characteristics
The following antenna characteristics affect their use in confined spaces:
- for VHF, the size of antennas make them impracticable to use in confined space engineeringapplications;
- in tunnels, the dimensions of antennas could lead to fixing difficulties due to the loading gauge(e.g. the clearance distance between an antenna and a train or vehicle);
- antennas for frequencies below approximately 900 MHz have a limited life, even in a dryunderground tunnel. It is advisable to replace such an antenna after 10 years;
- antennas for frequencies above approximately 900 MHz are smaller, have a more rugged boom,and the dipole and reflectors can be encapsulated, leading to a longer life;
- the radiated signal is attenuated due to the curvature of a tunnel;
- in the case of buildings, particularly car parks, terminals, bank vaults and underground storage, theuse of antennas offer a practical solution;
- the frangibility (tendency to break) of the antenna system will determine whether the long term useof antennas would give the system security required;
- access for repair and maintenance is also a factor in determining the position of antennasparticularly in large buildings;
- a faulty antenna sited in a restricted position could mean loss of service for a significant period oftime until it is fixed.
5.4.3.2 Recommendations for frequency range 150 kHz to 1 000 MHz
Recommendations are made for the frequency range 150 kHz to 1 000 MHz as follows:
- 150 kHz to 150 MHz:
- no consideration should be given to the use of antennas due to the size, weight and thepractical difficulty of fixing;
Page 25ETR 053: September 1996
- for this frequency range, a radiating cable solution is more practicable and all of the bands inthis part of the spectrum can be coupled by passive networks and radiating cables. It isfortunate that many radiating cables manufactured for higher frequencies (i.e. 500 MHz) willcontinue to operate in a satisfactory manner down to Medium Frequency (MF);
- 150 MHz to 500 MHz:
- there may be a solution that is a compromise, using radiating cables in part and antennas inthose locations that are practical for their mounting. In general however, antennas foroperating frequencies less than 400 MHz are not recommended due to their dimensions andweight;
- 500 MHz to 1 000 MHz:
- in general, the band 471 to 854 MHz is used for UHF television but there may be occasionaluse for PMR in this band. In the frequency range 850 to 960 MHz there are many servicesrequiring coverage in confined spaces e.g. analogue or digital cellular;
- whilst in general the radiating cable can also provide a working solution for this frequencyband there are often cost limitations which make the alternative use of antennas an attractiveoption. At these frequencies the antenna is small enough to be manageable, unobtrusive andcan be made very durable and long lasting.
5.4.4 Installation and maintenance of radiating cables
Radiating cable is routed wherever radiocommunications are required. When mounting radiating cable toconcrete or conductive surfaces, or alongside mains or signal cables, it is recommended that stand offinsulators of at least 65 mm be used in order to minimize attenuation in the cable. Their size will dependon the geometry of individual installations.
Radiating cables installed in underground tunnels should be kept dry and protected from water ingress toprevent undue increase in attenuation.
In some applications, radiating cable may be mounted under the ground but should be protected by aninsulated tube. Cable installed in areas where vandalism or rodent damage could occur should also beprotected by an insulated tube.
Radiating cable installed in road and rail tunnels could be affected by the effects of salt and chemicalsused for de-icing, by carbon deposits from vehicle exhaust emissions and deposits from vehicle brakedust. The radiating cables should be inspected annually and any deposits should be minimized bycleaning the cable with water or steam.
See subclause 6.4.3 for earthing details.
5.5 Repeaters
5.5.1 Introduction
A repeater is a device used to enhance radio signals between base and mobile stations in areas of poorpropagation such as topographically shielded areas, buildings and tunnels.
A repeater receives, amplifies and transmits simultaneously the radiated RF carrier generally in both thedownlink direction (from the base station to the mobile) and in the uplink direction (from the mobile to thebase station), and sometimes in the downlink direction only (e.g. paging).
A repeater is also referred to as a cell enhancer. Generally, a cell enhancer is the term used for abroadband repeater whilst an on-frequency repeater or a channelized cell enhancer indicates anarrowband repeater.
A repeater typically consists of amplifiers, bandpass filters, notch filters, attenuators and an automatic gainsystem but excludes a demodulator. Some repeaters include frequency changing circuits for the signalprocessing.
Page 26ETR 053: September 1996
The power output level per channel of a repeater should be of the order of +20 dBm.
5.5.2 Types of repeater
The following types of repeater are in use:
1) single carrier repeater:
- single carrier repeaters can provide enhancement of a single carrier, which in a traditionalsystem will be associated with a single channel but for digital systems using new technologymay be associated with 4, 8, 12 or more channels;
2) multi-channel narrowband carrier repeater:
- multi-channel narrowband carrier repeaters can provide enhancement of several narrowbandnon-contiguous carriers within a particular frequency band;
3) broadband repeater:
- a broadband repeater provides enhancement of signals over a wide band covering severalchannels;
4) broadband frequency changing repeater:
- in this type of repeater, the input signal frequencies are translated and transmitted in anotherfrequency range.
5.5.3 Repeater characteristics
Repeaters should meet the minimum radio frequency performance of relevant specifications.
For analogue repeaters the bandwidth of transmission through the repeater is often broadband to theextent of covering the entire band allocated to the service, e.g. in Total Access Communications System(TACS) / Extended Total Access Communications System (ETACS) the combined bandwidth isapproximately 38 MHz in each signal path, whereas in the narrowband single channel repeater, thebandwidth can be as little as 12,5 kHz.
The measurement of noise outside of the allocated channel should be defined in each specification inorder that standardization of measurements shall apply throughout Europe.
5.5.4 Installation recommendations
The following recommendations are made regarding the installation of repeaters:
a) a repeater requires two antennas, one a highly directional narrow beam antenna directed to thebase station, the other is a radiating cable and/or omni-directional or directional antenna to coverthe area in which the mobile stations are to be served;
b) the minimum coupling loss between any antenna in the service area and the antenna connected tothe base port should be at least 70 dB;
c) the gain of the repeater should be at least 10 dB smaller than the coupling loss (isolation) betweenthe two antennas (i.e. uplink and downlink antennas) of a repeater. The isolation should bemeasured before installation of the repeater;
d) the output level per channel of a repeater should typically be 20 dBm (input level + gain = outputlevel) but would not normally exceed 1 W except for the single channel case;
e) the noise output level of a repeater should be less than -36 dBm measured in a 10 kHz bandwidth;
f) the downlink antenna directed to the mobiles should have at least 70 dB isolation from the nearestmobile station. This is easily achieved when using a radiating cable but automatic gain control maybe provided as a protection measure against close mobile working causing system saturation;
Page 27ETR 053: September 1996
g) repeaters should not be used in multi-channel, multi-band sites;
h) the physical locations of the uplink and downlink antennas of the repeater should be chosen so thatonly the required areas of poor propagation are covered;
j) for repeaters used in public buildings where other communication systems could operate in closevicinity (less than 5 m) of the repeater antennas, special care should be taken such that out-of-bandsignals are not re-radiated from within the building to the outside via the repeater system and viceversa. When using repeaters with an antenna mounted on the outside of the building, the effect ofany additional height should be considered. If the close coupled communication system is usuallyconstrained within the building, it may be necessary to consider the negation of building penetrationloss when planning the installation. It is the operator's responsibility to ensure that the out-of-bandgain of the repeater does not cause disruption to other existing and future co-locatedradiocommunication equipment. This can be done by careful choice of the repeater antennas andsiting, or if necessary , the inclusion of in-line filters to attenuate the out-of-band signals from othersystems operating in the close vicinity of the repeater.
6 Installation recommendations
6.1 Support structure and mechanical considerations
During the design and construction of support structures the following processes will need to beconsidered. For each of these processes compliance with the relevant National Standards should beachieved:
a) design of structural components;
b) hot dip galvanizing of steel components;
c) spin galvanizing of steel threads;
d) use of lock nuts, spring washers and other locking devices;
e) anodizing of aluminium components;
f) use of protective paints.
NOTE: The anodizing on aluminium is likely to insulate the components and thus producedifficulties in terms of earthing and conductivity of the structure.
6.1.1 Structural integrity
The structural integrity of the mast or tower must be established by a competent structural engineer, theanalysis must include the loads imposed by each antenna system.
6.1.2 Wind loading
The structural design should take into account the wind loading of all the components on the structure,e.g. antennas, feeders and associated hardware. Twist and tilt limitations for parabolic antennas may alsohave a bearing on design or reinforcement.
The design or selection of a suitable support must be by qualified structural engineers. The design of newstructures should where possible take into account the probability of future development.
6.1.3 Protective coatings
The cutting or drilling of protective coated items should not be permitted during installation. On theoccasions when cutting or drilling is unavoidable, consideration should be given to possible structuralweakening, and the affected areas must be treated with a recommended protective coating. The paintingof structures should be considered as an essential part of the post installation programme. A well defined

Page 28ETR 053: September 1996
schedule of time scale and of the exact process should form part of the design of the structure and mustbe implemented rigorously.
In the case of a galvanized structure there will be a recommended period after which a paint processshould be applied.
6.1.4 Use of dissimilar metals
It should be carefully noted that wherever possible all metals used in contact with each other shall be inthe yellow metal series, i.e. copper, brass, silver, nickel, or gold. The iron and steel part of the metals tableshould be avoided at all times as their oxides form nonlinear junctions and can cause intermodulation.
The ideal combinations are silver/brass to copper using nickel plated nuts and bolts.
Structure design must take particular account of corrosion between dissimilar metals: electrolytic contactpotentials between metals in contact in outdoor exposure must be less than 0,25 V, and in indoorsituations should be less than 0,50 V. Annex E gives further information on the position of metals in thegalvanic series and the potential differences that will exist.
6.2 Equipment room
There are several fundamental requirements for equipment rooms on radio sites which must be given fullattention prior to the commissioning of the site. These are as follows:
a) the construction of the installation must provide security against vandalism and casual attack byintruders;
b) if services are to be provided on the site which warrant a high degree of security, then alarmsystems must be fitted;
c) the cables in and out of the equipment room must be hidden or protected in such a way that theycannot be easily damaged;
d) the areas within the equipment room shall be divided off to allow access to individual parties asdictated by the requirements of the site;
e) that a separate area is provided for the common services facility, e.g. mains power supply, filtermulticouplers and incoming feeder cable assemblies;
f) that heating and lighting be provided of a standard suitable for the environmental requirements ofthe site;
g) that there is sufficient space within the enclosure to allow for reasonable expansion.
NOTE: The above criteria shall be judged when taking into account the climatic, access andfuture development conditions pertaining to each individual site. For some locations,e.g. mountain tops, it may not be possible to visit with normal vehicles during severewinter conditions. It will be necessary to provide standby and auxiliary mains powersupplies for many sites where overhead power lines are provided.
6.2.1 Equipment arrangements
The equipment layouts given in annex F are based on the assumption that a choice of position for variousitems within the equipment room can be achieved.
Often, however, equipment rooms are already disposed in certain aspects, e.g. the power supplyarrangements and emergency batteries may already be installed and occupy a critical position adjacent tothe door.
There are some fundamental rules that should apply wherever possible and these are as follows:
a) the filter couplers and associated signal distribution systems should be located in a separate areawhenever possible and locked away from the transmitter and receiver equipment. This is to ensure
Page 29ETR 053: September 1996
that the filter parameters are not adjusted or interfered with by those who are not responsible for thefilter performance;
b) whenever batteries or emergency supplies are involved, these should ideally be housed in aseparate cubicle and ventilated to the outside atmosphere. This is to ensure that no explosivegases or corrosive fumes are present within the equipment room;
c) each frequency band will have its own cable feed and associated harness and therefore it is logicalto present all the equipment in that band with adjacent racks and convenient to the cable tray;
d) it is always advisable to keep receivers and transmitters as far apart as possible and this can bearranged in separate racks within the frequency band and its associated area;
e) in some countries the common band allocations may be quite different from those shown in thediagrams given in annex F and therefore can be interpreted separately for that country.
6.2.2 Environment
Consideration should be given to ensuring that the equipment room is kept at an ambient condition whichnever allows the temperature to fall below the dew point and which keeps within the specified temperaturerange of the equipment, or at an acceptable working temperature for personnel.
It may be necessary to provide heating, ventilation or cooling to achieve this condition.
Precautions may be necessary to exclude pests and vermin from the equipment room.
6.3 Electrical supply, protection and lightning protection
6.3.1 Electrical supplies
The majority of sites will have ac power provided by the local Electricity Supply Authority. It is essential toarrange sufficiently large capacity for future expansion, and wherever possible a sub-division of the inputcircuits should be provided separately for each user function. This ensures that individual fuses or tripsprotecting sub-sections of the site installation cannot interrupt the supply of other users.
In many instances standby power supplies will be required and this should be based on the requirement ofthe service.
There are an increasing number of sites where dc supplies, in the form of large capacity batteries, areused to power equipment and these batteries are charged continuously by means of "float charge"systems. This has the dual advantage of automatic standby and "no-break" characteristics.
6.3.2 Lightning effects, protection and responsibilities
Radio sites can be particularly prone to lightning strikes by virtue of their normally exposed locations andthe presence of relatively tall antenna support structures.
The effects of strikes on a site could comprise any or all of the following:
a) death or injury to personnel;
b) damage to equipment, or loss of service;
c) damage to buildings and structures;
d) loss or corruption of stored data.
It is not possible to provide and guarantee complete protection from these dangers. However, they can beconsiderably reduced by careful attention to earthing, protection devices and the layout of the site itself.

Page 30ETR 053: September 1996
Understandably, site owners and users will be concerned with the protection of equipment to maintain theintegrity of systems. However this concern must go alongside the prime consideration which is the safetyof personnel.
Reference should also be made to various relevant publications. Where any site owner or site user is indoubt about the protection requirements for a particular location, the appropriate authority should beconsulted.
The aims of any protection arrangements should be to provide a suitable path to earth for the lightningcurrent, to ensure adequate bonding between structures, all metalwork on the site and the site commonearthing system in order to reduce the side flashing, and to attempt to prevent the entry of flashes orsurges into buildings.
Connections to site earthing systems (where corrosion may be unavoidable) should be made by means ofa sacrificial anode of a material compatible with the structure being earthed.
All underground clamps on site earthing arrangements should be suitably protected by the use of nonreactive, non setting pastes and tapes.
The resistance to earth should be kept to a minimum and a value of less than 10 Ω is recommended.The important feature is that the system should ideally be equipotential across the whole site.
Reference should generally be made to the appropriate National Standards for the protection of structuresagainst lightning.
Certain authorities and service providers have their own particular practices which may have to befollowed where applicable.
Arrangements will vary considerably from very simple sites to complicated sites with a multiplicity ofbuildings, antenna support structures and associated plant, and may involve integration with existingsystems. Such systems may require upgrading.
Down conductors, bonding interconnections, earth rings and radial tapes should be of uninsulated solidcopper tape of minimum cross sectional area 60 mm2 with all connection clamps and supports protectedby non reactive paste or tape (aluminium conductors may be acceptable).
Where the tape may be subject to chemical attack, e.g. when in close proximity to concrete, it should beprotected by the use of non reactive paste or similar.
Protected test points should be included if appropriate and sacrificial earth lugs should be clearly markedand easily accessible for periodic inspection and replacement if necessary.
6.3.3 Earthing of antenna support structures
A structure will generally act as its own lightning conductor and will not therefore require a conducting tapefrom the apex to its base. A lightning finial may be required to extend the zone of protection to protectequipment mounted on the top of the structure. The finial should extend to at least 1 m above the highestequipment.
Ground mounted support structures should be connected at their base to an earth ring arrangement.This is normally by means of an anode usually in the form of a lug. Towers may require a connection fromeach leg.
Replacement of sacrificial anodes should be part of the site maintenance programme.
An earth ring may consist of copper tape with driven earth electrodes or radial tapes round the base of thestructure as close to it as possible, buried to a depth of approximately 0,60 m where soil conditions allow.
The earth rings should be connected to the main building earth by the most direct route, buried asappropriate.

Page 31ETR 053: September 1996
Roof mounted structures should be connected to the main building earth by the most direct route usingsacrificial anodes and copper tapes as appropriate.
Mast guy wires should be directly bonded at their lowest point to a suitable earth electrode or connected tothe site earth by the most direct route.
6.3.4 Earthing of antennas, feeders and associated plant
All antenna feeders should be bonded to the tower at the upper and lower ends and earthed at the point ofentry into the building (see annex G). Weatherproof earthing kits are available from antennamanufacturers.
Fast acting gas filled surge arrestors can be used on some systems and may provide additionalequipment protection, providing that Voltage Standing Wave Ratio (VSWR) degradation is acceptable.
In the case of radiating cables or RF cables in tunnels, the outer conductor is usually earthed at the pointof entry into equipment rooms. There may be different practices between authorities regarding howearthing at intermediate points should be arranged. In general any metallic structures in tunnels should beearthed to a common point to avoid the possibility of electrocution.
All gantries, fuel tanks, pipes above and below ground, fences and other metalwork within 3 m of thesupport structure or building should be bonded to the earthing system by the most direct route usingcopper tape, buried where appropriate. This should include any reinforcing rods in foundations which arenot already bonded to earth.
Ideally an earth ring should surround the building and be connected to the individual earths associatedwith the feeder entry, antenna support structure, building lightning conductor, equipment room, mainssupply and other facilities. Each connection should be made by the most direct route to minimizeinteraction between the different earthing functions.
The earth ring should consist of copper tape with electrodes or radial tapes, buried to a depth of 0,60 mand at a distance from the building preferably not exceeding 1,00 m.
Buildings may require lightning conductor terminals (finials) where they are not within the zone of anotherprotected structure.
6.4 Antennas and feeders
6.4.1 Choice of antenna type
The principle which governs the choice and siting of transmitting antennas is that only the minimumnecessary erp must be radiated in each desired azimuth direction.
Omnidirectional antennas should be used only when necessary for the service requirements. The simplestexamples of this class of antenna are top-mounted end-fed and coaxial dipoles, monopoles and collineararrays. When omnidirectional characteristics are required of a side mounted array, a number of antennaelements must be placed around the supporting structures.
There are many satisfactory types of directional antennas: common examples are yagi arrays, cornerreflector antennas and panel antennas.
Many antennas in common use fall between the omnidirectional and directional types described. Theyinclude simple dipoles side-mounted from support structures. Many of these antennas have ill-definedradiation pattern performance and are likely to give rise to radiation of intermodulation product frequenciesoriginating from currents excited in the supporting structure. Their use is not recommended formulti-frequency applications.
Page 32ETR 053: September 1996
6.4.2 Antenna specification
The following parameters must all be specified when procuring or selecting antennas.
- electrical:
a) gain;
Specified either in dB relative to an isotropic radiator (dBi) or a half-wave dipole (dBd).
b) VSWR;
Specify the maximum value compatible with the system being considered.
c) radiation pattern;
Specify the beamwidth in the azimuth and elevation planes, together with any necessaryrestrictions on side or rear lobe levels.
d) balance ratio;
This parameter defines the effectiveness of the balun fitted to balanced driven elements andconsequently the acceptable level of currents on the outside surface of the feeder cable. Avalue of 20 dB should be considered as a minimum.
e) input power;
For combined transmitter outputs specify both the mean, and peak powers.
f) intermodulation performance:
The following specifications are desirable:
(i) for single frequency transmit and receiving applications:
-100 dBc;
(ii) for multiple frequency transmission:
-130 dBc;
(iii) for multiple frequency transmission and reception on a single antenna:
- 143 dBc;
The more severe specification will be met using all-welded construction and exceptional carein the encapsulation of antenna terminal arrangement;
g) bandwidth;
Specify the frequency band over which the antenna is to be used, over which all theparameters specified must be met. The practice of regarding the VSWR bandwidth asindicating the useable frequency band is unsound;
- mechanical:
a) structural design of antennas and supports must comply with relevant National Standards;
b) electrolytic contact potentials between dissimilar metals must be less than 0,25 V even forencapsulated assemblies;
c) conformity to a chosen environmental test specification.

Page 33ETR 053: September 1996
6.4.3 Location of antennas
When determining the mounting positions for antennas each antenna must be mounted in a mannerwhich does not impair its performance (see clauses C.1 and C.2). The spacing between antennas mustbe chosen to provide sufficient isolation to allow system intermodulation product targets to be met(see clause C.3).
6.4.4 Radiation pattern
As a general rule, the less directional the radiation pattern of an antenna, the greater the influence themounting environment has on the pattern.
Highly directional antennas such as paraboloidal dishes and antennas with large mesh reflectors havehigh front/back ratio and may be regarded as largely independent of what lies behind them. Antennas ofmoderate front/back ratio such as yagis must be mounted with their rear elements at least one wavelengthfrom the supporting tower if optimum performance is to be achieved.
Nominally omnidirectional antennas (dipoles, stacked dipole and collinear arrays) will only achievegenuine omnidirectional performance when mounted on top of the supporting structure. When sidemounted, large currents flow in the supporting structure, causing distortion of the omnidirectional patternand the probability of intermodulation product radiation due to non-linear joints between structuremembers or mast sections. In practice omnidirectional azimuth patterns can be obtained only by sidemounting several antennas (usually 3 or 4) firing in equispaced radial directions. Radiation patterns maybe most accurately predicted when the individual units of the antenna have a large front/back ratio.As such antennas are very expensive, their use is most attractive when a number of services can bemultiplexed onto a single broadband antenna system.
6.4.5 Gain
The modification of the radiation pattern of an antenna, referred to above, also implies a change in itsdirectivity and hence its gain. In general an antenna will lose forward gain when mounted too close to thesupporting tower since the side and rear lobes will be increased. These changes result in reduced forwardrange and reduced protection against co-channel interference.
6.4.6 Cross-polar performance
The cross-polar performance of base station antennas for the mobile service has in the past beennon-critical, as all stations used vertical polarization. An important change has taken place with theopening of services in Band III (174 - 225 MHz) to the mobile radio service in some European countries aspolarization protection is an important parameter in ensuring low interference levels caused to (and by)continuing overseas television transmissions in that band. Similar consideration will also apply in Band I(41,50 - 67 MHz).
In bands used for fixed services the cross-polar protection provided by link antennas is an important factorin frequency planning and management. The geographical separation between stations using the samefrequency can be reduced when orthogonal polarization is used. The Cross-Polar Discrimination (XPD)achieved by a practical antenna under test range conditions will lie between 20 dB, for a simple yagi ordipole of orthodox construction, and 40 dB, for a paraboloidal reflector illuminated by a well designed feedhorn. The significance of the path to XPD must be considered.
Two commonly seen faults degrade the XPD of an installed antenna:
a) if an antenna is installed in such a position that currents are induced into members of the supportingstructure, these currents, flowing in arbitrary directions, will couple energy from the plane in which itwas radiated into the orthogonal plane. This is a particular hazard for installations of yagi andsimilar antennas of moderate or low directivity;
b) failure to erect antennas with the plane of polarization aligned exactly in the required directionproduces a field component in the orthogonal plane. The XPD of an ideal linearly polarized antennafalls as misalignment increases, as shown in clause C.5.

Page 34ETR 053: September 1996
6.4.7 Voltage standing wave ratio
For a transmission line to deliver RF power efficiently to a load it is necessary for the load to behave as apure resistance equal in value to the characteristic impedance of the line. Impedance discontinuitiescause RF energy to be reflected back from the discontinuity towards the input of the line.
Reflections upset the uniform distribution of RF voltage and current on the line. Standing waves areestablished which cause voltage and current maxima and minima to exist at intervals along the length ofthe line. In severe cases Standing Waves may cause transmitter shutdown or the failure of systemcomponents.
There are two major causes of increased VSWR when an antenna system is mounted for use. In the VHFband, where antennas of low or moderate directivity are used, the proximity of structural or mountingcomponents will change the antenna VSWR; this change will be of most significance when a very lowantenna VSWR is needed. Above VHF (where more directive antennas are generally used) the maincause of degradation is reflection from connectors and from discontinuities in the line itself.
It should be noted that the attenuation of the antenna feeder has the effect of reducing the VSWR seen bythe transmitter.
When designing or working on equipment at radio sites it is frequently necessary to calculate the reflectionperformance or matching condition of components in the RF system. It is often necessary for example topredict the matching condition at a certain point from specification or measurement data obtainedelse-where in the system.
Reflection calculations may be used to determine the worst-case VSWR which may occur with specifiedcomponents, or to determine the component limits when the overall system performance is alreadydetermined.
Traditionally VSWR has been in common use to express the reflection performance of RF systems.In certain situations however, return loss and voltage reflection coefficient prove more useful.
Formulae for conversion between VSWR, return loss and voltage reflection coefficient and methods ofcalculation for reflection performance are dealt with in clause C.6.
6.4.8 Wind vibration
All antennas, mounting steelwork, feeders and ancillary equipment should be securely clamped to protectfeeders and other semi flexible items from damage by vibration throughout the projected life of theinstallation.
Manufacturers' recommended feeder clamp spacings should be observed, with particular attention toexposed areas and transitions from antenna to tower, tower to gantries and gantries into buildings.Feeders should not be laid loose on gantries. Where necessary additional protection should be provided.
6.4.9 Degradation of antenna performance
It is important to appreciate that the performance of an antenna is very dependent on the environment inwhich it is mounted. This is particularly true of many antenna types commonly used in the VHF and UHFbands. The data quoted by manufacturers will generally relate to parameters measured on a test-range inwhich the antenna is erected clear of all obstructions, using the optimum mounting arrangement. Such anenvironment will not normally apply at a typical user's installation, and inferior performance may resultunless particular care is taken.
Clause C.1 shows a number of common configurations and indicates their relative merits.
6.4.10 Cables, cable routes and connectors
It is recommended that wherever possible, solid, semi-rigid or double-screened cables should be used forall RF connections. This is to ensure maximum screening between adjacent cables and feeders and toreduce coupling between equipment. The use of single screened cable (e.g. UR67, UR43, RG58) should

Page 35ETR 053: September 1996
be avoided wherever possible and in particular, in cable runs where several of these conductors arebrought close together.
The direct and shortest route is always the best for minimum radiation and minimum insertion loss.However, it is important that transmitter cables and receiver cables should be installed as far apart aspossible. It is advisable that when they cross they should cross at right angles. Cable trays carryingtransmitter cables should not also be used to carry receiver path cables and it is best if cables areinsulated from each other at all times. It is normal to use cables with insulated outer jackets and the onlypoints at which earth straps and earth bonding should be employed are those specifically chosen for thepurpose.
It is often convenient to break down very large feeder cables to a more convenient size and there is atendency to place connectors just inside the equipment room when reducing the main incoming feeder toa more manageable size. It is best, however, to take the main feeder as close as possible to theequipment to which it is to be connected before interrupting its outer conductor.
The only exception to this rule is to provide an earth connection for lightning conductor purposes.This should be carried out by means of an external clamp on the outer copper conductor and this shouldbe taken via the most direct route.
Incoming feeders must not be interconnected by a "patch panel", traditionally used in the past. The "patchpanel" is a source of earth current coupling and intermodulation and should be avoided.
It is also recommended that high quality connectors be used and a minimum standard would be type N,preferably with a silver-plated finish. The use of such connectors produces maximum screening effect andgives the best RF connection between the various components of the system. Connectors such as type"UHF" have been the cause of many problems and their use should be avoided. All connectors must befitted in conformity with manufacturers' instructions to ensure proper sealing and electrical uniformity.
6.4.11 Feeder identification, terminations and earthing
Feeder cables should be uniquely and permanently identified at each end and at the point of exit from thestructure. More frequent identification may be advisable when cables are buried in a duct.
Connectors and earthing kits should be fitted in accordance with manufacturers' instructions. Connectorfitting should be carried out in dry surroundings wherever possible and feeders should be lifted inaccordance with manufacturers' recommendations, with connectors already fitted to their upper ends andsuitably protected from water ingress.
6.4.12 Sealing
On completion, connectors should be wrapped with PolyIsoButylene (PIB) self-amalgamating tape andover-wrapped with a carefully applied layer of petroleum jelly impregnated waterproof tape. WherePolyVinylChloride (PVC) covers are provided for connectors, they should be removed and the connectorstaped as described.
Feeder and cable entries, external cable or feeder terminations, and earth connections to feeders ontowers or gantries should be suitably sealed or protected against the ingress of moisture using non settingpastes, self amalgamating tapes, neoprene paints as appropriate and in accordance with manufacturersinstructions. Particular attention should be paid to the shedding of surface water.
6.4.13 Inspection for moisture
In cases where the mast is exposed and there is a possibility of moisture gathering at the outer jacket ofthe copper case of the incoming cables, it is wise to remove the outer insulating jacket at a point wellinside the equipment room where it can be inspected for traces of moisture.
Page 36ETR 053: September 1996
7 Problems identified on site
The rapid development of mobile radio, particularly within large cities in Europe, produced a wide range oftechnical and operational problems as a direct result of hurried and badly thought out arrangements onradio sites.
A particularly significant factor was the almost total disregard for technical co-ordination between users onradio sites, and indeed many installations were provided without thought for adjacent systems.
There was also the primitive instinct to provide the highest possible antenna position for each and everysystem and a separate antenna for every transmitter. These antennas were often fed by poor quality andbadly arranged feeder cables which were terminated in a careless way using cheap connectors.
The results merited a great deal of rectification in the 1980s' and one of the major factors that broughtabout improvements was the proliferation of interference causing loss of service in nearly all the mobileradio bands. This ETR highlights the sources of interference and offers solutions that are practical andeffective.
7.1 Generation of unwanted products
Three main sources of radiated products are capable of disturbing other equipment on the same site or onanother in close proximity:
a) broadband noise and spurious products of transmitters;
b) intermodulation products between several source frequencies;
c) intermodulation products caused by external effects.
The apparent nature of the disturbance may be:
1) unwanted received signals which do not result from transmissions on that frequency by the intendeduser or any other operator sharing the frequency. The signals may or may not contain modulationalthough in many cases they are overmodulated (distorted) and they may contain a composite of themodulation from several sources; or
2) an increased level of noise which degrades the useable sensitivity of receivers.
Disturbances of type 1) may be identified with relative ease since the unwanted signals are heard inbetween wanted transmissions or they are of sufficient magnitude that wanted signals are occasionallyobliterated.
Disturbances of type 2) are more insidious since they cannot be heard by the operator. The effect causesa degradation of receiver sensitivity and a reduction in effective range. The operator may not notice thechange or he may mistakenly blame poor propagation conditions.
All these problems show the importance of having adequate isolation between equipment and sites. Theultimate design aim is to preserve the quality of service from the site by eliminating, or at least minimizing,receiver disturbance.
It is usual to decide a system target figure for the sensitivity degradation of the base station receiver whichis acceptable when caused by the operation of co-located or neighbouring transmitters. For example, itmay be decided that a 1 dB sensitivity degradation is acceptable for any one transmitter operating alone,or 3 dB for the worst multiple transmitter combination.
7.1.1 Broadband noise and spurious products of transmitters
All practical transmitters generate unwanted outputs as well as the wanted carrier frequency. Internallygenerated broadband noise may occupy a significant bandwidth on both sides of the carrier frequency (fc)while spurious outputs may be found at the harmonic frequencies 2fc, 3fc, 4fc...

Page 37ETR 053: September 1996
Frequencies which are not harmonically related may be affected by spurious emissions from sometransmitter designs. For transmitters which generate the final carrier frequency (fc) by frequencymultiplication of a lower fundamental frequency (fx) the frequencies fc + fx and fc - fx are particularly at risk.
The current technologies applied to transmitters give reasonable performances compared to the limits ofstandards but, at radio sites where many equipment may be co-located, a specific analysis must beperformed to decide whether additional measures are necessary to avoid disturbances to receivers.
The minimum isolation required between equipment, or the requirements for additional filtering totransmitters, is calculated by the comparison of transmitter noise and spurious emissions with the useablesensitivity and noise floor of receivers.
The notes that follow give an example of the parameters that will apply (see annex B for more detail).
7.1.1.1 Noise considerations
In considering the effects of noise, receiver bandwidth must be taken into account. For the equipment inuse for mobile radio, the worst degradation of sensitivity is obtained for the 12,50 kHz channel spacingstandard having a useable bandwidth of 7,50 kHz.
Typical modern receivers for the 12,50 kHz channel spacing standard have a useable sensitivity of- 110 dBm, corresponding to a signal to noise ratio of 10 dB and a noise floor of -120 dBm.
Additional noise power from external sources of -120 dBm in the 7,50 kHz bandwidth will degrade thereceiver sensitivity by 3 dB.
For 1 dB degradation of sensitivity the noise power from external sources cannot exceed -126 dBm in7,50 kHz.
The noise floor of the present generation of transmitters may be expected to be approximately-140 dBc/Hz within 1 % of fc and -150 dBc/Hz elsewhere.
The Transmitter (TX) power relative to carrier in the useable bandwidth of 7,50 kHz (+ 39 dB relative to1 Hz) therefore approximates to -140 + 39 = -101 dBc within 1 % of fc or -150 + 39 = -111 dBc elsewhere.
Assuming the maximum power of transmitters to be + 43 dBm (20 W) the noise power generated by asingle transmitter, measured in the 7,50 kHz Receiver (RX) bandwidth, may be expected to be-101 + 43 = - 58 dBm within 1 % of fc or - 68 dBm elsewhere.
It follows that to safeguard a receiver from a single transmitter by ensuring that the sensitivity degradationduring transmission is less than 1 dB, where the frequency separation is within 1 % of fc, requires aminimum isolation of -126 - (-58) = 68 dB.
For multiple transmitters the noise power is additive therefore the noise power of N identical transmittersat the same frequency spacing from the carrier is greater by a factor of 10 log (N) dB (e.g. the noise powerfrom four 20 Watt transmitters within 1 % of fc is -58 + 6 = -52 dBm and the minimum isolation required inthe above example would then be 74 dB). For an example of transmitter noise measurement,see annex M.
7.1.1.2 Spurious considerations
Where the disturbance to a receiver is a discrete signal such as in the case of a spurious emission, therequired RF carrier to interference ratio for satisfactory operation is 14 dB.
For the typical 12,50 kHz channel spacing receiver previously described, having a useable sensitivity of-110 dBm, this equates to an unwanted input signal level of -124 dBm.
The limits defined by ETSI in ETS 300 086 [5] state maximum levels for transmitter spurious emissions of-36 dBm in the frequency range up to 1 GHz and -30 dBm above that frequency.

Page 38ETR 053: September 1996
Assuming the above receiver is operating at a frequency below 1 GHz, the minimum isolation requiredfrom a transmitter having an on channel spurious emission at the maximum allowable level is-36 - (-124) = 88 dB.
The design of radio equipment is generally such that direct degradation of the receiver by a companiontransmitter is avoided when a moderate amount of antenna isolation is provided and if a sensiblefrequency separation is chosen during frequency planning. For a single fixed station it is usually onlynecessary to check the isolation from neighbouring sites.
For multiple fixed stations it is necessary to check the isolation from both co-sited transmitters and fromthose of neighbouring sites. In this case the use of combining systems to communal antennas, offering10 to 15 dB minimum isolation improvement by filtering, gives total isolations in the region of 70 dB.This figure is generally adequate to avoid spurious problems and allow the simultaneous transmission of10 to 20 signals each at a power of +43 dBm.
7.1.2 Ambient RF noise levels
It is recognized that any ambient RF noise measurement is only an approximate indication, since it isstrictly applicable to the antenna employed and the noise conditions at the time. The ambient noise levelparticularly at urban sites in the lower VHF bands, has a major influence on system range andperformance.
Precipitation static noise, caused by the exchange of static charges between raindrops and the antennasystem, is a significant source of noise at frequencies below 150 MHz. It may be controlled by the fitting ofinsulating shrouds to antenna elements (see clause C.4).
Ambient RF noise includes atmospheric, sky noise and man made electrical noise. In general this isbeyond the control of the site operator (see annex D).
On a remote green field site it may be possible to operate receivers in the VHF band at levels below-110 dBm. However more realistically the minimum useable signal will be typically -107 dBm.
7.1.3 Intermodulation products between several source frequencies
These products are caused by the mixing of two or more source frequencies which produce well definedsignals which may be of a high level. They are usually the result of inadequate isolation betweentransmitter output stages, which allows coupling of RF energy between them and the generation ofproducts by a mixing process.
The intermodulation factor has been adopted as a standard by which the immunity to these effects may bejudged. It may be considered to be the ratio in dB between the unwanted coupled signal level and the levelof the third order intermodulation products which are produced by the mixing process.
The intermodulation factor facilitates a simple calculation method to determine the level of third orderintermodulation products which can be obtained as a result of transmitter coupling.
If:
- W = wanted RX signal;- XT = Isolation, TX - TX;- XR = Isolation, TX - RX;- Y = Equipment intermodulation factor;- Z = TX power in dBm.
Then:
- (Z - XT) - Y = 3rd order intermodulation product power level = P;- P - XR = disturbing signal level at the RX = D;- W - D = protection ratio in dB.

Page 39ETR 053: September 1996
Design targets:
- PMR = 10 dB;- analogue cellular = 18 dB;- digital cellular = 9 dB.
The protection ratio can be improved by increasing XT, XR or Y as appropriate to the type of serviceinvolved.
The applicable limits for intermodulation factor result from the interpretation of existing standards for fixedstations.
For PMR, the applicable standard is ETS 300 086 [5] and the limits are set according to the intended useof the equipment which may fall into one of two categories:
a) normal - use as a single base station operating alone, for which the intermodulation factor is aminimum of 10 dB;
b) special - use at communal sites where many units may be co-located, for which the intermodulationfactor is a minimum of 40 dB.
EXAMPLE: Two transmitters each having a power output of +43 dBm are operated onneighbouring sites with a total port to port isolation of 70 dB. The output stage ofeach therefore receives an unwanted signal of +43 - 70 = -27 dBm.
The level of the resulting third order intermodulation products is therefore:
- for "normal" intermodulation factor: -27 - 10 = -37 dBm;
- for "special" intermodulation factor: -27 - 40 = -67 dBm.
Assuming that a receiver exists in the vicinity, tuned to the frequency of one of these products, and if theantenna isolation between the transmitter and receiver is also 70 dB:
- the "normal" transmitters give a disturbing product of -37 - 70 = -107 dBm;
- the "special" transmitters give a disturbing product of -67 - 70 = -137 dBm.
Comparing these levels with a receiver having a useable sensitivity of -110 dBm for 10 dB RF signal/noiseratio it is evident that the product of the "normal" transmitters will exceed low level wanted signals on thatfrequency and will give unacceptable disturbance. The products of the "special" transmitters are wellbelow the receiver noise floor and will have no discernible effect.
This short calculation, which has been applied to identical signal levels, can also be applied totransmissions of any signal level. It shows the importance of intermodulation problems which must becarefully examined when determining frequency planning.
EXAMPLE (for GSM): Two transmitters each having a power output of Z = 43 dBm are operated on thesame site with a total port to port isolation of XT = 30 dB. The output stage ofeach, therefore, receives an unwanted signal of 43 - 30 = 13 dBm.
The value of the equipment intermodulation factor Y = 40 dB. The level of the resulting third orderintermodulation power, P, is therefore equal to 13 - 40 = -27 dBm.
The limit sensitivity of a GSM receiver, W, is about -104 dBm and the protection ratio is 9 dB. Thus, thedisturbing signal level, D, should be less than -104 - 9 = -113 dBm at the receiver. This leaves arequirement for XR of greater than 86 dB. However, isolation between transmit and receive antennas canbe as low as 30 dB Therefore additional transmitter filtration of greater than 56 dB is necessary fortransmitted intermodulation falling on the receive frequency.

Page 40ETR 053: September 1996
7.1.4 Intermodulation products caused by external effects
The metallic contacts in masts and antenna hardware can be a source of problems when high fieldstrengths occur on the site and cause them to radiate intermodulation products which disturb equipment atthe same site, or at a neighbouring site.
No standards exist that are able to specify reasonable limits for such effects. The intermodulation factorsused to make these calculations are affected by many parameters and they also depend on electricalresonances in the components which make up the mast and antenna arrays.
The only way to minimize these problems is to follow the guidelines presented elsewhere in this ETR andshould problems occur, to make measurements to locate the origin and establish the necessarymodifications to effect a cure.
7.2 Intermodulation and blocking effects in receiver systems
These problems are usually a result of large signals at the input of a receiving system which causenon-linearity. There are four different sources:
a) intermodulation between received signals;
b) saturation of receiver front end;
c) inadequate receiver selectivity;
d) receiver spurious responses.
Although all operational parameters for receivers are well defined by existing ETSs and I-ETSs used in theLand Mobile Service (LMS), the effect of receiver distribution amplifiers must be considered in addition tothese traditional standards since the amplifiers often operate in a hostile RF environment on denselyutilized sites.
There is a need to define two bandwidths in the receiving system:
1) the useable bandwidth of the receiver when properly aligned on the allocated channel;
2) the RF front end bandwidth of the receiver system whether this is the preselector filter of thereceiver RF amplifier or the input filter of an RX distribution system.
7.2.1 Intermodulation between received signals
The reception of high level signals, within the bandwidth of the first RF filter, is the worst case ofintermodulation in a receiver system. The bandwidth and out of band attenuation of this filter is thereforevery important.
On a communal site, a high performance preselector filter is generally placed at the antenna input to thedistribution amplifier to define the operational frequency band.
For angle modulation systems, receiver intermodulation performance is defined by the existing standardETS 300 086 [5] as a ratio between an on-frequency wanted test signal of -107 dBm and twooff-frequency unwanted signals at 70 dB above this level displaced to cause a third order intermodulationproduct on the wanted channel. Under these conditions an audio output approximately equivalent to a7 dB RF carrier to interference ratio at the receiver input must be obtained. This definition thereforeaccepts that in the presence of the off-frequency signals, the receiver sensitivity required by standardsmay be degraded by 3 dB.
The practical result of this definition is that for unwanted input signals at third order related frequencies,the receiver which just meets intermodulation standards experiences a 3 dB sensitivity degradation whenthe unwanted signals exceed -107 + 70 = -37 dBm. This represents a minimum isolation from other20 W ( + 43 dBm) transmitters of 80 dB.

Page 41ETR 053: September 1996
In the case of receivers which exceed the minimum sensitivity required by standards, the degradationcaused by intermodulation may be much higher. For example, a receiver with a sensitivity of -110 dBmwhich just meets the intermodulation standard at -107 dBm, has in fact been degraded by approximately6 dB.
Considering the RF level of the product as a signal at the receiver input, the 7 dB carrier to interferenceratio relative to a -110 dBm wanted signal represents an equivalent interfering signal level of -117 dBm.
Since the receiver encounters an intermodulation product as a discrete frequency and not as simplewideband noise, the required RF carrier to interference ratio for a 1 dB degradation of sensitivity isidentical to the case of transmitter spurious and must be 14 dB or greater, dictating a maximum equivalentinterfering signal of -110 - 14 = -124 dBm.
For a design aim of 1 dB sensitivity degradation due to intermodulation, to a receiver of sensitivity-110 dBm, the equivalent interfering signal level suggested by standards is too high by 10 dB.
Due to the cubic power law of intermodulation products, the level of the actual unwanted signals istherefore too high by at least 10/3 or 3,33 dB, requiring isolation from the culprit transmitters of80 + 4 = 84 dB when rounded to the nearest dB.
When considering transmitters on the same site, appropriate frequency planning in conjunction withfiltering can achieve the isolation figures required by the design aim.
The isolation figure is also achievable from mobiles when sites are situated away from busy roads or otherareas having a high concentration of mobile transmitters.
Difficulties may arise when considering isolation from other sites if the physical separation or thefrequency planning of neighbouring sites are inadequately co-ordinated.
This results in the necessity for critical attention to the bandwidth of the receiver systems at radio sites.Receiver distribution amplifiers must be arranged with precisely defined bandwidths and they must havean intermodulation performance at least 10 dB better than that required by standards. For example, twoinput signals of -30 dBm produce third order intermodulation products of -120 dBm equivalent to a thirdorder input intercept point of +15 dBm for a unity gain system.
The design aim in receiver distribution systems should always be that the performance is limited by theperformance of the receivers themselves rather than the distribution amplifier.
Fulfilling the above criteria should ensure that intermodulation problems do not originate in the sitereceiver system but probably in the neighbouring transmitters themselves. Careful frequency planning andsite engineering, if applied to all sites, should minimize these difficulties.
7.2.2 Saturation of receiver front end
The consequence of very high level received signals will be that the front end active devices of thereceiver will have a gain reduction resulting in a degradation of sensitivity.
This situation is generally qualified in the existing standards by the blocking performance. The acceptablelimits are defined in the same way as for intermodulation which means that the limit stated corresponds toa received signal of -23 dBm or an isolation of at least 66 dB between source and receiver(assumes +43 dBm source).
Although this problem is basically independent of frequency great care should be taken to identify allcritical signals within the response of the front end filtering of the equipment by monitoring.
7.2.3 Selectivity of the receiver
This parameter defines the ability of a receiver to reject signals at unwanted frequencies. The selectivityfigure not only depends on the characteristic of the intermediate frequency filter but also on the spectralperformance of the local oscillator.

Page 42ETR 053: September 1996
The existing standards define a two signal method of measurement taking all these problems into accountby looking at sensitivity degradation. The limits refer also to a wanted signal of -07 dBm and are 60 dBabove for the worst case (12,50 kHz channel spacing). This means that great care should be taken withthe frequency planning to avoid having signal levels higher than -47 dBm on adjacent channels in thiscase and -37 dBm in a close frequency proximity (up to 5 × channel spacing).
These limits should be reduced by at least 3 dB in the case of using the full sensitivity performance of asite (i.e. -50 dBm on adjacent channels and -40 dBm in close frequency proximity).
7.2.4 Spurious response of the receiver
All receivers have their own frequency conversion plan which can be in either upper or lower mode. Theresult of this process added to the RF filtering response and to the possible spurious signals of the localoscillators used may be the source of other spurious responses at the RF input, resulting from thecomplex mixing of signals. The latest ETSI standards give well defined methods of measurement forthese spurious responses and the calculation of frequencies at which they can occur (including duplexmode) by taking into account all local oscillator sources.
The limits considered are referred to a -107 dBm wanted signal and 70 dB above. They are identical tointermodulation limits and the same comments should apply regarding suitable response of all RF filters.
7.2.5 Receiver protection for low power equipment (I-ETS 300 220 [9])
Low power equipment is commonly used for short range data collection and in some administrations isoperated on an unlicensed (deregulated) basis.
No requirements are currently specified for receiver protection and the deregulated nature ofimplementation increases the probability of operation in proximity to other higher powered VHF/UHFservices.
It is therefore particularly important that performance is checked at the intended site and that suitablefiltering arrangements are provided if necessary.
7.3 EMC issues
It should be noted that current ElectroMagnetic Compatibility (EMC) approval for non-radio equipmentdoes not guarantee sufficient protection to base station receivers when used on a radio site. In suchcircumstances the site operator may require additional EMC suppression before giving approval to theinstallation of suspect equipment.
7.4 Technical responsibility of the site operator
It is essential that the site operator is able to quantify any unwanted products which give rise tounreasonable degradation of service to co-sited installations.
Some solutions to the problems arising from unwanted products are offered in clause 8. There is a needfor further procedures to control the lack of co-ordination that often exists between the site operator, theusers and the licensing authority.
8 Avoiding radio frequency problems
In considering the need to produce this report the urgent priorities were to avoid new systems having thedeficiencies already identified in earlier installations, and to identify the sources of problems and to offerremedies.
This section clearly identifies items which can cause difficulty and offers components that are practicaland economically available to solve the problems.
Practical solutions and experience on sites have been taken as the basis of these recommendations andthe principles of use are not theoretical or academic but are well tried and proven in the field.

Page 43ETR 053: September 1996
8.1 Antenna distribution networks
In the case of a filter system, combining network, or receiver distribution network, it is important that thecables are treated with care and that the distribution network should be mounted away from thetransmitters and receivers whenever possible. Ideally the filter or distribution network should be mountedon the wall adjacent to the antenna incoming feeders and the transmitter section should be connected asfar away from the receiver section as possible.
It should be noted that overloading of a receiver distribution network could affect many other users on thesame system.
The power supply associated with such amplifiers can operate either from mains supply or batteries whichare becoming increasingly common on remote hilltop sites. Again it must be stressed that the reliability ofthe supply is essential for the maintenance of the service and it is usual to provide back-up in the event ofmains failure (see clause H.3 for further details of distribution amplifiers).
8.2 Receiver distribution networks
There are many instances where many receiver systems in the same frequency band are required to beinstalled at the same radio site. It may therefore be appropriate to fit a receiver distribution networkcomprising one antenna input feeding a suitable bandpass filter, followed by a low noise amplifier whichthen distributes its output, usually by a passive network, to the receivers in that band.
The low noise amplifier is carefully chosen to have a very good signal to noise performance to minimizedegradation of the overall system signal to noise performance whilst feeding up to typically 16 receivers inthe same band. The amplifier needs also to be chosen for large signal handling capability together with aninherent protection against damage by transient impulse voltages.
The use of a high quality semiconductor device operated at a small fraction of its rated dissipation willmeet these requirements and provide a Mean Time Between Failure (MTBF) typically in excess of100 000 hours. It is essential to appreciate that the design objectives for the receiver distribution networkwill determine the failure rate of the subsequent systems involved.
8.3 Filters and couplers
8.3.1 Control of unwanted products
The origins of unwanted products are related to mixing processes that take place in any non-linearcomponent of the complete system (see annexes J, K and L). The simple guidelines of increasing theisolation between the components of the mixing process will result in the reduction of the intermodulationproduct level.
8.3.2 The ferrite circulator
The ferrite circulator is a practical component which can be utilized to provide directional isolation at theoutput stage of the transmitter.
A ferrite circulator has directional properties that typically result in additional isolation of between 20 and40 dB. The isolation parameter has to be considered in conjunction with the insertion loss and bandwidth,all parameters being considered in the system design.
For isolation in excess of 40 dB, a dual circulator version may be fitted.
The third port of the ferrite circulator is terminated in a matched load, the power rating of which is intendedto withstand the maximum return power that is envisaged in the worst fault condition that can arise on thesystem (see clause H.2).

Page 44ETR 053: September 1996
8.3.3 The cavity resonator
The cavity resonator is a bandpass circuit, having a centre resonance frequency related to its physicaldimensions. The unloaded Q of such a device depends on its physical volume and at VHF it rangesbetween 2 000 and 10 000. The loaded Q is normally arranged to be between 500 and 1 500 according tothe insertion loss and isolation required.
A system using a cavity resonator gives protection to co-sited receivers by reducing the radiation ofwide-band noise.
Cavity resonators may be connected together to provide additional isolation when used to combineseveral transmitters to a single antenna.
When used in conjunction with ferrite isolators, cavity resonators provide the necessary isolation tocombine several transmitters into a single antenna configuration. This system employs several cavityresonators coupled together with a precisely dimensioned cable harness to allow single antenna workingwith insertion losses of typically 2 dB with a relative frequency separation of 1 %. With high performancecavities the separation can be reduced to 0,25 % and still give isolations greater than 20 dB. When usedin conjunction with a ferrite isolator it is typically possible to attain 50 dB isolation between adjacenttransmitters when coupled to a single antenna (see clause H.1 for details).
8.3.4 The spectrum dividing filter
When the outputs of several transmitters are to be considered as a combined signal it is convenient thateach antenna shall have the frequency spectrum coupled to it defined by a filter having a comparativelybroad, flat topped response. This enables any transmitter to be operated within the specified band withoutexcessive filter insertion loss and ensures the attenuation of signals outside the defined frequency band.
This system defines the band edges, controls spurious emissions and is therefore given the title"spectrum dividing filter".
Spectrum dividing filters can be coupled together by means of a precisely dimensioned cable harness toother similar filters, to provide duplex and combiner facilities for multiple bands to a single antenna system(see clauses H.4 and H.5 for further details).
8.3.5 Control of intermodulation, cross modulation and blocking effects in receiver systemsby filter protection
A common source of receiver problems is that incoming signals outside the band of interest arrive at thereceiver front end at an amplitude which can cause blocking, inter-modulation and distortion of the wantedsignals. This situation is most likely to occur when the receiver is connected to an antenna which may bein close proximity to other antennas on a communal site. An improvement in this situation can be obtainedby positioning the receiver antenna well away from any other installation and in particular from othertransmit antennas. On shared sites this is often not possible.
An alternative procedure is to connect bandpass filters between the antenna and the receiver input. Thesefilters need to have the necessary shape factor to limit the bandwidth to that which is required for thereceiver system.
A single small cavity resonator providing 20 dB isolation at the offending frequency will often provide asolution to receiver interference problems but in those cases where the interfering signal is closer than± 1 % of the centre frequency of resonance to the wanted signal then multiple section filters or large cavityresonators may be required. The typical responses for such filters are given in clause H.4.
9 Environmental effects
9.1 Standards
It should be recognized that corrosion and climatic effects cannot be eliminated. However, the effects cannormally be contained by careful design and selection of materials, high quality manufacturing, highstandards of installation and a maintenance programme planned for the life of an installation.

Page 45ETR 053: September 1996
9.2 Corrosion and climatic effects
The materials which are used in the construction of antennas and their support structures are prone tocorrosion. The European environment combines wet and humid conditions with mild temperatures;industrial pollutants and coastal conditions accelerate corrosion in many locations. With one of thewindiest climates in the world, ice and snow, and the incidence of ultra-violet radiation to degrade paintsand plastics, UK designers of outdoor installations must understand the problems which can arise andrecognize the practices which have proved adequate to overcome them.
Deterioration will take the following forms:
a) corrosion of metallic components, causing structural weakening of antenna elements andmountings. Corrosion will be accelerated at bi-metallic contacts and will give rise to non-linearconduction with consequent generation of intermodulation products. A rise in contact resistance atconnections will increase ohmic losses and reduce antenna gain;
b) water ingress into insulating materials will cause changes in permittivity (giving rise to VSWRchanges) and will increase dielectric losses, especially if the water is polluted or has run off metalliccomponents;
c) water ingress into feeders and connectors produces mismatch and increases loss;
d) wind-induced vibration causes antenna elements to break by fatigue failure and acceleratescorrosion at element clamps;
e) snow and ice cause temporary increases in VSWR and losses of gain and polarization purity.These effects will become permanent if the weight or wind load is large enough to cause permanentdistortion. Freezing splits components into which water has penetrated. Falling ice can causedamage, distorting elements or even breaking off complete antennas;
f) wind-induced vibration and falling ice cause damage to badly mounted feeders. Damage is often inthe form of complete annular cracks in the outer conductor of corrugated semi-flexible cables; theseproduce intermittent faults with high VSWR and severe non-linearity.
The problems listed above result not only in a degraded service for the user of the antenna and feederconcerned, but by loss of directivity, polarization discrimination and linearity may result in problems forother users, whether co-sited or not.
The management of these problems lies in the care with which an installation is designed, carried out andmaintained.
9.3 Ultraviolet degradation
Products liable to degradation by ultraviolet light should not be used in external situations where there isan acceptable alternative. Where the life of an item is known to be limited, its periodic replacement shouldbe included in the site maintenance programme. Replacement only on failure is not generally acceptable.
10 Health and safety
10.1 Introduction
The safety of the working environment on, and in the vicinity of radio sites must always remain aconsideration of high importance to site operators and engineers. This clause of the ETR is not intendedas a comprehensive guide to all of those health and safety aspects, but is intended as a precis of healthand safety issues that will need to be considered by existing and potential site operators.
Health and safety issues are in some European countries subject to national legislation. This legislationhas been introduced for the protection of employers, employees and the public. It is therefore essentialthat in the construction and operation of radio sites professional advice is obtained on the legislativerequirements that prevail in each individual country.

Page 46ETR 053: September 1996
10.2 Radio frequency (non-ionizing radiation) hazards to personnel
Radiation from transmission systems are potential sources of hazards to personnel.
All frequencies used on radio sites are well below that of ultra-violet light, and are classed as non-ionisingradiation. Frequencies above the ultra-violet spectrum are classed as ionising and are known to have thepotential to cause cancers. However, the only known problems at the frequencies used on radio sitescould be caused by high fields raising the body temperature by more than 1 ºC. This may cause burns,cataracts or alteration of body functions. The main problem is converting the 1 ºC rise into a quantitywhich may be determined by RF engineers, such as W/m2. The conversion will differ dependent uponfrequency, because of physical phenomena such as body resonance and depth of penetration into thebody.
Thus personnel require guidelines on areas to be avoided in the vicinity of antenna systems.Full agreement throughout Europe has not yet been reached, although CENELEC has issued apre-standard (ENV 50166-2 [10]). Readers should familiarize themselves with their own national prevailingguidelines. There is not unanimous agreement throughout these documents although a reasonablecompromize for Mean Power Density is given in the CENELEC document as 2 W/m² at VHF rising to10 W/m² at microwaves.
Safe distances should be determined for areas around an antenna. This can be done by calculation ormeasurement. The calculation process may be complicated by the need to allow for near field values.Personnel should be informed of these safe distances and the precautions necessary to avoid exposurebeyond the limits given by the guidelines. Should work be necessary which is liable to take persons closerthan the safe distance, arrangements must be made to either reduce power or switch off transmitters.
10.3 Electrical safety
Accidents that are related to the electrical installation are of the most common occurrences. The designand construction of the electrical installation has already been amply illustrated in this ETR, but too muchemphasis cannot be placed on the importance of electrical safety. The minimum requirement as far as theconsumer is concerned is the use of Earth Leakage Circuit Breakers (ELCB), Residual Current Devices(RCD), or Residual Current Circuit Breakers (RCCB). In particular, it is desirable that anyone whoregularly works in a radio site environment should be aware of the procedures for the first aid treatment ofpersonnel suffering electric shock.
10.4 Physical safety
In most cases common sense is the best guide to the physical safety on radio sites.
A working policy should be in force for all staff, especially those engaged on work external to theequipment room. In many cases the wearing of a hard hat is a legal requirement when work is undertakenon the antenna support structure and the dangers of falling objects makes their use essential.
A consideration that is sometimes overlooked is the danger of falling ice in colder climates during wintermonths. The structure design and site layout should take into account the icing which could reasonably beexpected to occur on structures and antennas in a particular location and the danger of falling ice inrelation to personnel and damage to buildings, equipment, antennas and feeders.
Inside the equipment room care should be taken to ensure that sharp projections are avoided and that thecommon walkways remain clear and unhindered. This is particularly important when additional servicesare added and equipment rooms become crowded.
Where lead acid battery power supplies are installed the first aid aspect of acid splashes must beconsidered and in particular the requirement for eye wash solution in first aid cabinets.
Where soldering irons are in use care should be taken such that hot irons are not left unprotected, but areplaced in suitable holders.
High power devices commonly found on radio sites often contain beryllium, usually in the form of an oxide.Where work is undertaken on such equipment the safety hazards of this substance must be made clear.Beryllium is a toxic substance particularly in its oxide form and is suspected of inducing cancer. In its

Page 47ETR 053: September 1996
mildest form, the inhalation of Beryllium dust can cause inflammation of the nose, throat and chest. If aberyllium device is broken then the utmost care should be taken in removing the fragments and dust fromthe site. It is recommended that professional advice be obtained in all cases before removal of thesubstance is attempted.
Other substances which are commonly found at radio sites and which may cause health hazards include:
- insulating oil from transformers and capacitors (fire hazard and believed to be carcinogenic afterprolonged use);
- teflon from insulators (gives off toxic vapours when heated above 205 °C).
10.5 Fire hazards
Once again, the requirements for the prevention and extinguishing of fires is often governed by legislation.In particular the storage of paper, cardboard boxes, paint and other inflammable goods is not desirable.The number and type of extinguishers that are required at a site should be decided in consultation with theappropriate fire authority.
11 Site administration
11.1 Site discipline
A common problem is caused by mobile transmitters, without power control, having the ability to comewithin a very short distance of the receiving site, e.g. 25 m, in which case signals typically in excess of+ 10 dBm can arrive at the receiver within the wanted frequency band; this is a source of non-linearity. Ona communal site where there is a multiplicity of users, it is likely there will be several potential users in thesame band able to visit the site using their mobile transmitters. This problem can be avoided by strictdiscipline on this topic or a complete ban on the use of mobile transmitters, without power control, on thesite.
A further cause of interference on base station receivers can be distant mobiles using their transmitterswhen on elevated locations or during conditions of enhanced propagation.
These problems can be minimized by co-operation with the distant user, the use of signalling systems, thechoice of site and assignment of frequencies in association with the appropriate authority.
11.2 Site records
The efficient administration of complex radio sites relies on precise detail of physical facilities, users andemissions. Information should be kept centrally, and displayed in a useful form on site, where appropriate,and where security allows.
Physical information should include:
a) antenna types;
b) feeder lengths and types;
c) connector types and sex;
d) distribution harness details;
e) details of mounting hardware.
Electrical information established at systems commissioning provides a useful reference for the diagnosisof later problems. Data recorded for each antenna system should include:
a) VSWR, insulation and attenuation of feeder cables;
b) VSWR measurements on complete antenna systems, bench measurements of power divisionnetworks.

Page 48ETR 053: September 1996
A common practice is to maintain a master outline for each structure, referring to detailed drawings ofmounting arrangements, feeder routes and other information.
11.3 Orientation of support structure and antennas
Orientation should be based on an agreed reference, e.g. True North, although it may be preferred that astatement of magnetic bearing, variation and date is also kept on records. A clear method for referring tothe legs and faces of the structure should be observed.
11.4 Working arrangements
Operations on site must follow safe working practice. Only one user or contractor must work on thestructure at any time and arrangements for lifting equipment past working antennas must be agreed withthe Site Manager.
12 Maintenance recommendations
Maintenance on the basis of remedial action only is a dangerous practice.
12.1 Support structure
The installation of the mast or tower will have been carried out to the specifications required of theauthorities in the region concerned and should therefore include all the basic earthing, lightning protectionand other parameters which are defined elsewhere in this ETR.
It is essential that at certain intervals (and annually would be regarded as the norm,) the structuralinstallation is inspected for condition, protection against rust, tension in guy assemblies and generaldeterioration of the surface.
If any defects are found, they should be recorded and reported immediately so that corrective action canbe taken. The adjustable screws or tensioners for a guy system should be well greased and protected andall mechanical parts should be examined for corrosion beneath the external surface.
Any corrosion should be scraped clean and the material of the structure then prepared for protectivecoating.
Particular note should be taken of earth bonding, lugs, straps or connections that these are free fromcorrosion.
All painted surfaces should be given an undercoat and a topcoat of a suitable protective layer andmicaceous oxide is regarded as a suitable ingredient. The use of red lead has been severely curtailed onaccount of its toxic properties and hazard to health.
Agreement should be obtained between the mast owner and the contractor that the surface coating meetswith the required specifications.
On completion of the work a full inspection should be undertaken to ensure that surfaces that are normallylubricated have not been painted and that the standard of painting is such that a further year of protectionis guaranteed.
12.2 Equipment room
The following notes are the basis for keeping radio sites in good working order over a period of manyyears.
Some of the points raised might be regarded as stating the obvious, but if they are written down andcomplied with, then the results obtained will be commensurably better than currently pertaining on mostradio sites.
Page 49ETR 053: September 1996
Cleaning:
- the site should be regularly inspected and cleaned of all fragments of cable, braid and other rubbishwhich tends to accumulate after modifications to wiring or termination of new equipment etc.;
- these items should not be brushed but removed with a vacuum cleaner, the contents of which areremoved completely from the site;
- it should be stressed that no dust should be raised, particularly from concrete floors, as the resultingfloating debris can be injurious to relays and contact assemblies etc.;
- for plastic surfaces, a moist cloth is best, or alternatively a suction cleaner, but for metal surfacesan approved polish can be applied sparingly;
- it should be noted that the generation of charges must be avoided and therefore manufacturers'recommendations should apply to all cleaning products.
Tidiness:
- it is essential that no superfluous materials, cables, connectors etc. are allowed to clutter up radioequipment rooms. A particular danger exists when faulty or unreliable assemblies for cables andconnectors may be left on site and cause further problems in due course. All doubtful componentsshould be removed from radio sites. A minimum of spares should be held on a radio site and theseshould be located in locked cupboards and clearly identified. There is no purpose in havingequipment on a site which does not relate specifically to equipment in use at that location;
- a tidy site will also encourage others to be equally tidy and leave the equipment room in pristinecondition.
Examination of feeders, connectors, and terminations:
- all terminations should be examined for corrosion, general cleanliness and tidiness and appropriateaction taken if problems are encountered;
- the report on difficulties encountered should be made at the earliest possible time to the equipmentsuppliers or users and the cause of the problem identified in order to avoid repetition;
NOTE: Connectors should not be opened or removed unless a specific fault is found and theoperators of the equipment should be informed and the equipment switched off whereappropriate before disconnection.
- at regular intervals or after intervals agreed with suppliers or contractors, measurements should betaken of the feeder and antenna parameters, but before disconnecting the feeder, the appropriatewarning actions should be taken;
- the results of any measurements taken should be noted in a log book;
- any filters or multicouplers on the site should be examined for condition and if necessary, testmeasurements taken to ensure that the parameters are as defined. No adjustments should beundertaken, nor any connections broken without authority and with the appropriate test equipment;
- if there is obvious physical damage, e.g. resulting from a lightning strike, flood or fire, then sparefilter equipment should be made available before any work is undertaken;
- when routine or restorative maintenance is carried out on radio equipment, it may be appropriate tomake simple checks on the overall performance of the radio site. These checks can then be notedin a log book and compared with the results obtained on previous visits.
The overall performance of the radio site is only as good as the performance of those engineers visitingand maintaining the installation. A good and efficient radio site looks immaculate, is clean, well lit andbears the evidence of careful treatment and high technical standards.

Page 50ETR 053: September 1996
12.3 Electrical supply and lightning protection
There have been many instances in the past where fire and damage has been caused on radio sites dueto overloaded electrical circuits.
It is essential that the rating of the cables, fuses, trips and ancillaries are all within the loading placed uponthem and a very simple check on all the electrical system can be the temperature rise in the cables andconnections. This can be easily detected with a small temperature probe and any part of the installationrunning at 10 °C above ambient is in danger of being overrun and could become dangerous. Theseremarks apply particularly to PVC covered copper cable.
A slightly more sophisticated method of checking would be to use a tong-test current meter to check everycable and connection in the system and record the results in the site logbook.
A physical examination of the installation for untidy wiring or badly connected tails is also well worthcarrying out.
The voltage should be checked at various agreed points within the system and should be within 5 % of thenominal figure.
In some countries there is a legal limit on the maximum excursion from the stipulated voltage and anysevere reduction in voltage can adversely affect the equipment and is an indication of overloading.
With regard to the earth system, it is essential to check that this is still intact and that the earth impedancehas not risen to an unreasonable figure.
In many installations the earth mat connections or spike terminations are contained within pits and can beeasily removed for checking.
The standard earth test should be applied, both for absolute figure of impedance and also for currentcarrying capacity if there are no trips operated by earth leakage. In the latter case, earth trip can bechecked by passing the nominal current from live to the earth connection, at which current the trip shouldcome out.
This test can only be conducted, however, in the presence of radio engineers who will ensure that noadverse effect on any of the equipment on site will be produced.
On no account should the mains supply be broken if there are emergency services present on the site,except with their authority.
12.4 Antennas and feeders
The maintenance of antennas and feeders can be split into two parts:
a) 1 year intervals:
- antenna elements should be inspected for signs of corrosion. Where pitting of the surfacemetal is evident complete replacement is recommended;
- plastic encapsulation forming antenna terminations or balun networks are liable todegradation and splitting subsequently admitting water and should, therefore, be examined indetail for hairline cracks;
- fixing clamps should be checked for rigidity and signs of corrosion paying particular attentionto threaded components which should be treated with non setting bituminous paint;
- feeder trays and securing cleats should be checked for tightness and earthing straps must bechecked for electrical integrity. Cables should be inspected for physical damage which canbe caused by inexperienced riggers climbing on existing cable trays.
Page 51ETR 053: September 1996
b) 5 year intervals:
- far field performance for all antennas on a given site should be measured and compared togain and radiation pattern measurements recorded at installation. Any antenna showingsubstantial deviation should then be further examined to deduce the cause which includesconnectors, feeder and balun if fitted;
- PIB and petroleum based tapes used as wrapping over in line connectors should be checkedand replaced as necessary;
- in general, on sites in a coastal environment, it is recommended that antennas are replacedat intervals not exceeding 5 years due to the accelerated rate of corrosion of aluminiumbased components.
12.5 Filters and couplers
The installation of filters and couplers, particularly on those sites having a separate multicoupler room, iseasily kept under strict control and records can be maintained in the equipment room as well as beingreturned to the site managers office.
These records should include forward and reflected powers taken at the appropriate points in the systemand it is suggested that these are as follows:
a) at the antenna port;
b) at the output of the transmitter couplers;
c) at the transmitter output or the multicoupler input.
There should be a set of predetermined levels which are agreeable between the supplier, manufacturer,installer and operator and there should be a nominal tolerance on these figures which is both practical andrealisable. The accuracy of field test equipment must be considered, particularly for the measurement ofabsolute RF power using broadband instruments.
It is recommended that the figures are checked at not less than annual intervals, but in the case of publicservice operators, they may need to be checked at quarterly or even monthly intervals.
In the event of discrepancies being found in the test figures, a careful analysis and interpretation of theresults should be carried out before any adjustments or physical investigation of the filter coupling systemis undertaken.
In the case of a completely passive network, the most likely event to cause a disruption of the parametersis damage to the antenna and therefore a peculiarity in the reflected power figures throughout the couplingsystem.
It must be remembered that a passive band pass filter system has a transparency to return loss and thattherefore a problem at the antenna can be sent back through the system and cause very confusingresults.
It can be generally stated that passive filter coupling systems should be left alone unless there is evidenceof severe deterioration either visually on casual inspection, or by analysis of the test parameters.
The typical life of a passive filter system should exceed 10 years and would normally be 15 - 20 yearswithout any adjustment.
In very severe environments, e.g. maritime or marine installations, where there may be an element ofvibration, corrosive salts and corrosive atmosphere, then the visual inspection can be a guide to theinternal condition of the components.
Where there are power amplifiers, these should be examined separately and their parameters checked atperhaps annual intervals.
Page 52ETR 053: September 1996
It should also be remembered that in general terms, unless there are moving parts, e.g. ventilating fan orrelays, the MTBF of such devices probably exceeds 100 000 hours.
Most of the difficulties encountered on multicoupled sites are caused by anomalies in the transmitters,e.g. spurious emissions or failure of the output stage and, of course damage to the antenna.
A summary of the position regarding multicoupler installations is that they are best left alone unless thereis evidence of a technical problem.
13 Troubleshooting on radio sites
13.1 Method of approach
In the case of interference being detected, then a logical sequence of steps should be followed to identifythe cause of the problem:
a) check that the receiver front end is not being overloaded; a notch filter tuned to the interfering signalinstalled at the antenna input to the receiver will normally solve an overload problem;
b) check that mixing is not taking place in the front end of the receiver; if the unwanted receivedsignals are within ± 1 % of the unwanted frequency then follow step a), however, normally abandpass filter installed at the antenna input to the receiver will solve this problem;
c) if the interference is not generated in the receiver then the direction of the interference may betraced by using an antenna, with directional properties, connected to a receiver with signal levelindication;
d) when interference has been traced back to a site, and the signals causing the interference havebeen identified, it will be necessary to determine where the mix is occurring;
e) DO NOT tamper with any equipment on site unless the owners prior permission has been obtained.If it is necessary to disconnect the antenna feeder from the transmitter output, ensure that thetransmitter cannot be keyed;
f) it should be noted that when making measurements with sensitive measuring instruments,particularly when tracing intermodulation products in the transmitter output, that appropriateprecautions are taken (such as stop or notch filters, attenuators or directional couplers to protectthe input stages of sensitive equipment);
g) mixing can occur in a transmitter output stage, due to the carrier frequency mixing with anothersignal being fed back via the antenna feeder. This problem can normally be solved by fitting anisolator or bandpass filter in the antenna feeder close to the transmitter output;
h) if interference is still present then mixing is most likely taking place either on the transmitter orreceiver mast structure. It may be possible to overcome the problem by increasing the horizontal orpreferably the vertical separation between the antenna on the existing mast.
Alternatively if the radiating source on the mast can be located, it may be possible to carry out thenecessary maintenance;
j) in extreme cases it may be necessary for one of the users to change sites, to overcome theinterference problems.
13.2 Case studies
The following cases contained in this section are typical examples of interference cases which could havebeen prevented if the guidelines contained in this code had been followed.
Case 23 is included as a reminder that the cause of the problem may be in the users own equipment,therefore it should be ensured that the equipment is regularly maintained.

Page 53ETR 053: September 1996
13.2.1 Cases where the use of cavity resonators, bandpass filters or ferrite isolators provideda cure
Case 1: a high power 150 MHz band transmitter was causing interference to a co-sited 160 MHz marineband receiver by desensitizing the receiver and causing blocking. The transmitter already had an isolatorand bandpass filter fitted to the output antenna feeder. The problem was solved by inserting a bandpasscavity resonator into the antenna feeder to the marine receiver.
Case 2: interference was being received on a police VHF base station receiver. It was suspected that ahigh power radiophone transmitter, located approximately 500 m away, was overloading the front end ofthe receiver. A bandpass filter was inserted into the antenna feeder of the receiver, and although the levelof interference was reduced, a significant signal level was still present.
Further tests showed that the RF signal from the Radiophone transmitter was getting into the output stageof the police transmitter, co-sited with the receiver. The mix between the two carriers produced a resultantproduct on the police receive frequency. An additional band pass filter was inserted in the output feeder ofthe police transmitter. The interference problem was solved by placing bandpass filters in both the policetransmitter and receiver antenna feeders.
Case 3: interference was being received on several base station receivers, located on a communal site.During tests at the site, it was noted that the interference ceased when one particular co-sited transmitterwas keyed. The transmitter used a semiconductor output stage, which was still active even when the drivehad been removed, i.e. the transmitter was in the standby mode. The problem was caused when co-sitedtransmitters were keyed, causing the output stage of the offending transmitter to go unstable and radiatespurious noise.
By installing a bandpass filter and isolator at the output of the transmitter the problem was solved.
Case 4: interference was being caused to a 141 MHz FM base station receiver from a co-sited 138 MHzAM base station transmitter.
It was suspected that the 138 MHz transmitter was overloading the FM receiver. An additional bandpasscavity filter was installed in series with the existing high-Q bandpass filter which is normally fitted to thereceiver input, but produced no improvement. A notch filter tuned to the interfering carrier was then tried inthe receiver, again no improvement was noted.
A spectrum analyser was used to observe the transmitted spectrum, which showed a number of low levelspurious signals, one of them falling directly onto the FM channel. By fitting a bandpass filter at thetransmitter output and retaining the single bandpass cavity at the receiver, the interference was cured.
Case 5: co-channel interference was being caused to a police base station receiver which was locatednear to a communal base station site approximately 500 m away, with some 10 PMR transmitters on site.None of the transmitters had filters or isolators fitted to their outputs, therefore a large number ofintermodulation products were being generated over a wide band. The problem was solved by fittingisolators and filters to the outputs of the offending transmitters.
Case 6: co-channel interference was received on a 141 MHz band base station receiver. The source ofthe interference was traced to a spurious signal being radiated from a 145 MHz amateur band repeater.The repeater transmitter used a local oscillator with a times 36 multiplying stage to obtain the requiredcarrier frequency. A spurious signal, which was due to the 35th harmonic of the local oscillator, was beingradiated.
The problem was solved by inserting an additional bandpass filter at the transmitter output.
Case 7: a third order intermodulation product was traced to a communal site. The two transmitters wereidentified, which already had isolators and filters fitted to their outputs. On further investigation theinterference was traced to a receiver antenna which was radiating the antenna intermodulation product.When the antenna feeder was disconnected from the associated receiver, the interference disappeared.To solve the problem a band pass filter was installed at the input to the receiver.

Page 54ETR 053: September 1996
Case 8: a high band user was complaining of interference on his channel; the system (system A) wasusing free running talk through. The frequency separation between the transmit and receive on a highband channel is 4,80 MHz. A nearby transmitter (system B) operating on a channel 2,40 MHz abovesystem A produced a radiated third order intermod which fell on the receive frequency of system A. Due tothe intermod product system A would remain on whilst system B was transmitting even when the mobilesof system A ceased transmitting.
Case 9: use of multiple common base stations on a communal site exhibits the same problem as any talkthrough stations, that is the generation of transmitter/receiver difference frequencies.
A classic case is that of two VHF high band talk through base stations having standard TX/RX spacing(i.e. 4,80 MHz) in an urban environment where the mobiles of one system have regular access within70 dB of the communal site, the transmitter not being fitted with an isolator. The level of the receivedmobile frequency can be in the order of several milliVolts, and mixing with its own transmitter produces adifference frequency equal to the TX/RX spacing. If now the second base station is keyed, its ownreceiver will be disturbed by the resultant of the mix from the first base station, and so will any subsequentVHF high band transmitters keyed on the site.
In many cases of this type the disturbance to the second system is that of an extremely over-modulatedsignal carrying the modulation of the first base station.
The solution to this problem would be the fitting of suitable ferrite isolators and/or bandpass filters to theoffending transmitters.
Case 10: interference was being received on a private mobile radio base station receiver tuned to172,80 MHz. The receiver employed a local oscillator running at 162,10 MHz(i.e. 172,80 MHz - 10,70 MHz). The interference occurred when a nearby transmitter operating at167,45 MHz was keyed. This transmit frequency (167,45 MHz) was exactly 5,35 MHz (half 10,70 MHz)lower than the wanted signal. The difference between twice the local oscillator and twice the unwantedsignal (i.e. 324,20 MHz and 334,90 MHz respectively) produced an Intermediate Frequency (IF) of10,70 MHz. The receiver thus responded to the unwanted signal. The installation of a cavity resonatorbefore the receiver allowed only the wanted signal to pass. (Alternatively a notch filter installed before thereceiver would have rejected the unwanted signal).
It should be noted that even with receivers that meet existing ETS requirements this problem can occur.
13.2.2 Case where the problem is related to equipment alignment
Case 11: a high band VHF transmitter was set up at the repair depot before being reinstalled on site. Thetransmitter when installed on the communal site was connected to the antenna via a high-Q filter. Whenthe transmitter was keyed high level spurious signals were emitted causing interference to other co-sitedsystems. The problem was solved by retuning the transmitter RF stages to match the filter system.
NOTE: A transmitter should be set up in the workshop into an accurate 50 Ω dummy load.
13.2.3 Cases where the problems are related to broadcast transmitters
Case 12: programmes from a VHF FM broadcast transmitter were received on a police base stationreceiver. Intermodulation products were generated in the structure of the mast on which the policeantennas were mounted, due to the high powered broadcast transmitter.
This problem was solved by removing the receiving antenna to a position above the mast structure using avertically stacked dipole on a 3 m pole. This succeeded in removing the receiving antenna away from thefield of interference caused by the mast structure.
Case 13: interference was received on a public utility base station receiver operating on 106 MHz.Co-sited was a 4 kW local radio broadcast transmitter on 96 MHz and also an automobile club transmitteron 86,525 MHz. No 3rd order intermodulation products were detected from the broadcast transmitter,however, by using a loop antenna connected to an analyser the intermodulation product was traced to thebroadcast antenna. The antenna was checked but no fault could be found.

Page 55ETR 053: September 1996
Some reduction in level was obtained by changing the public utility collinear antenna for two dipoles.Additional reduction was obtained by replacing the antennas further down the mast, i.e. increasing thevertical separation.
Case 14: a fire brigade base station receiver was receiving an FM broadcast programme. The co-channelinterference was traced to a nearby communal base station site. The broadcast transmission was beingpicked up on the antenna feeder, which provided a path to the power amplifier stage of a PMR transmitterwhere the mixing occurred. The broadcast transmitter was several kilometres from the communal site.The problem was solved by earthing the antenna feeder, the cable ducts and equipment racks.
Case 15: a 50 kW erp transmitter operating on 96,70 MHz was radiating spurious signals at a frequencyof 97,483 MHz and 95,917 MHz. Both spurious signals were noted to be 783 kHz from the wanted carrier.
A 20 kW transmitter operating on 783 kHz was located at a distance of 7 km from this site. It was thoughtthat this transmitter could be associated with the problem.
The 783 kHz transmitter was switched off and the spurious emissions ceased. The problem was solved byinserting a low pass filter at the input of the FM transmitter exciter stage. It should be noted that theproblem was one of breakthrough into an audio frequency stage. By suppressing the 783 kHztransmissions at this Audio Frequency (AF) stage the RF spurious emissions were removed.
Case 16: interference was being received on 121,50 MHz and it was known to be caused by a broadcasttransmitting station.
The broadcast transmitter was operating on 102,50 MHz with an output of 500 W erp. The distancebetween the two stations was 30 km.
Spectral analysis of the broadcast transmitter station showed several spurious emissions including121,50 MHz.
Measuring the incident and reflected power of the transmitter showed that the reflected power wasapproximately 25 % of the incident power. The antenna feeder was checked and found to contain water.The problem was solved by changing the coaxial cable and connectors. The transmitter was then retunedto match the new feeder.
Case 17: interference was being received on manually tuned aeroplane receivers when tuned to a radiobeacon on 371 kHz. The problem was found to be caused by intermodulation between two medium wavebroadcast transmitter stations.
One station used a 135 kW erp transmitter on 666 kHz and the other a 120 kW erp transmitter on1 035 kHz. The transmitters were 12 km apart.
The intermodulation product was found to be a mixing problem with the 1 035 kHz transmitter (1 035 kHz -666 kHz = 369 kHz).
The interference problem was solved by installing a bandpass filter into the antenna feeder of the1 035 kHz transmitter.
Case 18: interference was being received on 118,20 MHz and was found to be caused by two FMbroadcast transmitter stations located on the same site. One transmitter was operating on 104,30 MHzwith an output of 40 kW erp. The other transmitter was operating on 90,40 MHz with an output of 1 kWerp. This case is a typical 3rd order intermodulation problem. The intermodulation product is given by
(2 × 104,3 MHz) - 90,4 MHz = 118,2 MHz
The level of the second harmonic of the 104,30 MHz transmitter was measured as -72 dBc.The intermodulation product disappeared when the output power of this transmitter was reduced by 6 dB.
This problem was solved by replacing the 90,40 MHz transmitter until the correct cavity resonator could beobtained and inserted into its antenna feeder.

Page 56ETR 053: September 1996
13.2.4 Cases where the problems are related to cables and connectors
Case 19: a telephone company were experiencing on site problems from their radiophone and pagingtransmitters which were causing breakthrough on the radiophone receivers. After a considerable amountof work on the site, breakthrough was still being experienced. The problem was finally solved by replacingthe existing feeders with double screen cables and using high quality connectors.
Case 20: the operator of a trunked radio system was experiencing a high proportion of lost calls duringpeak traffic periods. The problem was confined to a certain site of his multi site system.
The radio and combining equipment was tested with all ten channels operating into a high power load andisolating cable connected to the combiner antenna access. No problems were observed. When testinginto the antenna, intermodulation products were observed in the receive band whenever seven or moretransmitters were operating.
Inspection of the antenna system feeders at the affected sites revealed the connectors to be the culprit.the type used relied on a spring fingering for the centre contact to the inner conductor of the coaxial cable.The peak power of seven or more transmitters caused this connection to generate intermodulation.
Replacement of the connectors by the soldered and clamped variety effected a complete cure.
13.2.5 Cases where the problems are related to site maintenance
Case 21: an on air intermodulation product was traced to a communal site. Work had recently taken placeat the site on the mast and in the equipment room. The problem was traced to an intermodulation productwhich was being picked up by a feeder cable and radiated from the attached antenna. The feeder cableand antenna were no longer being used at the site. When the feeder cable and antenna were removed theproblem was resolved. It should be noted that all unwanted equipment should be removed from maststructures and equipment rooms.
Case 22: there have been numerous cases of moisture within antennas and feeder cables causing adeterioration of transmission characteristics. In extreme cases severe corrosion takes place at the lowerconnector of the feeder run, where the moisture gathers behind the connector. The source of theproblems are numerous, the main points of entry being:
a) the drain holes in antennas and antenna structures;
b) the connectors and interfaces;
c) cracks and orifices in the outer casing of the antenna feeder cables.
Due to atmospheric changes in temperature and pressure there is a tendency for feeder systems to"breathe" and in extreme wind conditions the "Venturi effect" may be produced sucking moisture into thesystem.
The solution to these problems are mainly inspection and maintenance, since complete abandonment ofdrain holes in antennas can lead to other problems due to ingress of water in the upper part of theantenna, and excessive use of sealants and wrapping of connector assemblies can produce adverseeffects of a secondary nature.
It is possible to provide drip loops and examination points within the equipment room by removing a shortsection of the outer casing of the feeder cable. This provides a means of detecting any moisture that maybe trapped between the outer coaxial tube and the casing. The real solution is to provide annualinspection and regular maintenance of the system.
13.2.6 Cases where the problems are related to faulty equipment
Case 23: interference was being caused to a 141 MHz base station receiver whenever a co-sited139 MHz base station transmitter was keyed.
A bandpass filter was fitted to the receiver which reduced the level of interference. However, the wantedsignal was still unworkable, even at this reduced level of interference. As a result of using a spectrum

Page 57ETR 053: September 1996
analyser it was found that the receiver front end was oscillating at around 140 MHz. When the 139 MHztransmitter was keyed, mixing occurred to produce a 3rd order intermodulation product which fell on to thereceiver channel. No fault was suspected on the receiver since good signals were received from themobile. The receiver was repaired which cured the interference problem.
Case 24: a radiated interference signal was traced to a communal site. The actual source, however couldnot easily be identified, therefore with the owners permission equipment was switched off to try andeliminate the source. With all known equipment off, the interference was still present. The source wastraced to the system master crystal oscillator, which was still running.
Case 25: the symptoms of this case were identical to those in case 24. However, the feeder andconnector system had been checked and eliminated from the investigation. In this case antennasubstitution effected a cure.
On inspection of the faulty antenna, a loose connection was found at the junction of the driven elementand the feeder tail. The joint was dismantled, cleaned and tightened and the antenna returned to service.No further problems were encountered.
In this case, and in case 24 the onset of intermodulation was well defined. Until a certain number oftransmitters was reached no intermodulation occurred. Once started, the effects remained until thenumber of active transmitters approximately halved.
13.2.7 Case where the problem is related to site modifications
Case 26: intermodulation was being received on a high density radio telephone network employing anumber of different VHF and UHF systems. The antenna systems comprized a number of tubular mastsemploying interlocking push-fit sections. These masts were aligned along the top of a building. One of theUHF networks was receiving high level intermodulation products.
The only alteration that had been recently undertaken was the removal of an unused VHF antenna on anadjacent mast. On inspection it was confirmed that the antenna clamp had provided a good bond betweentwo sections of the mast. The removal of the clamp had resulted in a poor contact between the sectionsand created intermodulation. The mast sections were bonded by a continuous earthing strip along thelength of the mast and the intermodulation ceased.
13.2.8 Case where the problem is related to equipment screening
Case 27: a police system comprising four transmitters and receivers coupled to a single antenna wasradiating intermodulation products which caused interference to other installations.
The system was checked into a dummy load and isolating cable. All products were found to be - 70 dBcwhich would be incapable of causing the interference observed.
The system was reconnected to the antenna and the tests for intermodulation were repeated using a linesampler in the main feeder cable. The intermodulation products were now observed to be only - 25 dBc(the antenna was known to be well matched and in good condition).
While testing it was observed that the intermodulation products were variable, depending on position ofcabinet doors, engineers in the room etc.
The site was located in the lift motor room of a tall office building with antennas mounted above the roofon a short stub mast. It was concluded that the intermodulation mechanism was the direct radiation ofenergy from the antenna into the transmitters and associated wiring.
The provision of a screened rack for the radio equipment completely eliminated the problem.

Page 58ETR 053: September 1996
13.2.9 Accidental operation of discarded equipment
Case 28: interference was being received on 121,50 MHz and was caused by a signal generating theusual emergency tone signal.
The interfering transmitter was located some kilometres away and was found to be a discardedEmergency Position Indicating Radio Beacon (EPIRB). This EPIRB was located in a scrap yard andproved very difficult to find.
13.2.10 Examples of lack of isolation between systems
Case 29: a VHF trunked radio system was installed at a rooftop site on a city centre building. The systememployed ten duplex transmitters and receivers multicoupled to a single antenna connection usingisolators, cavity resonators and bandpass filters.
Intermittent severe interference was received on all channels having calls in progress. The modulation ofthe interference was observed to be severely distorted and only occurred if the companion transmitter wason. The interference also coincided with strong signals received within the base receive frequency band.The level of these received transmissions indicated that they must be originating close to the site. Testsshowed that mixing in the base station transmitters was not the source of interference.
The cause was finally traced to the re-radiation of mixing products generated in the nearby mobiletransmitter. These mixing products radiated back into the antenna system to disturb the receivers of otherchannels. No modifications were possible without affecting the coverage of the site.
The problem was solved by restricting the use of mobile transmitters in close proximity to the site.
Page 59ETR 053: September 1996
Annex A: Protection ratios and minimum field strengths required in the mobileservices
ITU-R (ex CCIR) REPORT 358-5
(Question 1/8)
(1966-1970-1974-1978-1982-1986)
1 VHF and UHF land and maritime mobile services
1.1 Protection ratios based on internal noise and distortion in the receiver
The World Administrative Radio Conference, Geneva, 1979, defined the protection ratio as the minimum valueof the wanted-to-unwanted signal ratio, usually expressed in decibels, at the receiver input determined underspecified conditions such that a specified reception quality of the wanted signal is achieved at the receiveroutput (RR No. 164). For further information on the definition see Report 525. This ratio may have differentvalues, according to the type of service desired.
However, in the absence of information submitted to Study Group 8 on subjective measurements made inthe VHF and UHF land and maritime mobile services several administrations submitted the results oflaboratory measurements, using appropriate test signals, of the degradation of the signal-to-noise ratio ofthe wanted test signal, when a co-channel interfering signal is superimposed on the latter. A degradationof the initial signal-to-noise ratio of 20 dB to a signal-to-noise + interference ratio of 14 dB is taken as thecriterion. For some systems this grade of service is acceptable.
In the tests described by the various administrations, the frequency deviations are 70 % or 60 % of themaximum specified frequency deviations, and for amplitude modulation the modulation percentages are70 % or 60 %, for both wanted and unwanted signals. From a study of the documents submitted, it may bededuced that the slight differences in measurement conditions and in the characteristics of the receiversused in the different tests, may result in differences in the measured receiver protection ratios, of up toabout ± 3 dB.
One administration performed tests to determine the protection ratio for the case where the wantednarrowband G3E signal is interfered by a direct-printing F2B signal (see Recommendation 476)[CCIR, 1978-82]. The e.m.f. of the wanted signal at the receiver input was 2 µV. In these tests the level ofthe interfering co-channel F2B signal was so adjusted that the subjective effect on the wanted signal wasthe same as that of an interfering co-channel narrowband G3E signal attenuated by the protection ratio of8 dB laid down in Table I for this case. The peak frequency deviations used for the F2B signal were ± 1,± 3 and ± 5 kHz respectively. The sub-carrier was 1 500 Hz and the frequency shift 170 Hz. 12 dB wasfound to be a suitable representative value for the protection ratio and is therefore included in Table I.
Although the ability of the receiver to receive the wanted signal is dependent on the passbandcharacteristics of the receiver, the frequency difference between the co-channel wanted and unwantedsignals, the frequency deviation, etc., the receiver protection ratios in Table I may be used as the basis forthe calculation of system protection ratios for mobile systems for a minimum grade of service. Additionalprotection should be provided to allow for the effects of multipath propagation, man-made noise, terrainirregularities, and in the case of very closely spaced assignments, adjacent-channel interference(see Report 319).
When using frequency modulation, "capture effect" is enhanced as the frequency deviation of the wantedsignal is increased; therefore, a wideband F3E, G3E system requires less protection than a narrowbandF3E, G3E system for the same type of interfering source.
If a higher grade of service is required a higher protection ratio should be adopted, particularly in the caseof amplitude-modulated wanted emissions.
1.2 Man-made noise
Man-made noise degrades the performance of a mobile system. To maintain a desired grade of service in thepresence of man-made noise, it is necessary to increase the level of the field strength of the wanted signal.

Page 60ETR 053: September 1996
Motor vehicles have been shown, by measurements [US Advisory Committee, 1967], to be the primary sourceof man-made noise for frequencies above 30 MHz. Other noise sources are fewer in number and usuallyradiate from fixed locations.
Table I: Typical receiver protection ratios, for use in calculating system protection ratios
Wanted emission(Note 1)
Unwanted emission(Note 1)
Receiver protection ratio(dB)
Wideband F3E, G3ENarrowband F3E, G3EWideband F3E, G3ENarrowband F3E, G3E
Narrowband F3E, G3E
A3EA3EA3E
Wideband F3E, G3ENarrowband F3E, G3E
A3EA3E
Direct printing F2B
Wideband F3E, G3ENarrowband F3E, G3E
A3E
See Report 319See Report 319
810
12
8 - 17 (note 2)8 - 17 (note 2)
17
Note 1 - Wideband F3E, G3E systems normally employ frequency deviations with a maximum value in therange ± 12 to ± 15 kHz.The narrowband F3E, G3E systems considered here normally employ frequency deviations withmaximum values of either ± 4 or ± 5 kHz.The value of the F2B case is with a peak frequency deviation of ± 5 kHz. Frequency deviations of ± 3 and± 1 kHz do not significantly decrease this value.
Note 2: - The receiver protection ratio may vary within the range shown dependent upon the difference infrequency between the carriers of the wanted and unwanted emissions and the frequency deviation of theunwanted emission. In general, it will tend towards the higher figure as the frequency deviation of theunwanted emission decreases.
For convenience in evaluating the degradation of performance of a base receiver, the following classificationsof noise sources are provided:
- high noise locations - traffic density of 100 vehicles/km2 at any given instant of time;
- moderate noise locations - traffic density of 10 vehicles/km2 at any given instant of time;
- low noise locations - traffic density of 1 vehicle/km2 at any given instant of time;
- concentrated noise sources (hot spots): noise radiated from individual sources or closely spacedmultiple sources which are usually located within 500 m of the receiving antenna, such as a highconcentration of vehicles, manufacturing plants and defective power transmission lines.
Noise data for base stations at high, moderate and low noise locations are presented by a noise amplitudedistribution (NAD) (the number of pulses per second equal to or greater than the value shown as ordinate) andare illustrated in Fig. 1. The amplitude (A) (in dB(µV/MHz)) of noise pulses at a rate of 10 pps(pulse-per-second) is expressed as follows:
A = C + 10 log V - 28 log f
where:
C: constant (tentative value: 106 dB(µV/MHz))
V: traffic density vehicles/km2
f: channel frequency, MHz
Noise data for hot spots can also be presented in the form of a noise amplitude distribution. However, dueto a wide variety of noise sources, it is not yet practical to provide a classified list.

Page 61ETR 053: September 1996
The constant C is a function of the electrical noise suppression applied to vehicles and may also varyaccording to the relative proportion of goods and passenger vehicles if the level of suppression is not thesame for both categories. A tentative value of 106 dB(µV/MHz) is shown and this may be revised as moreinformation becomes available.
FIGURE 1 - Noise amplitude distribution at base station (150 MHz)
For frequencies other than 150 MHz, raise or lower curves H, M and L inaccordance with the formula below.
A = C + 10 log V - 28 log fwhere A = dB (µV/MHz) at 10 pps
Curve H: high noise location (V = 100)Curve M: moderate noise location (V = 10)Curve L: low noise location (V = 1)
1.3 Noise Amplitude Distribution (NAD) determination of degradation
1.3.1 Definitions
1.3.1.1 Noise amplitude distribution
A presentation of impulsive noise data in terms of its basic parameters of spectrum amplitude and impulserate.
1.3.1.2 Spectrum amplitude
The vector sum of the voltages produced by an impulse in a given bandwidth, divided by the bandwidth.
1.3.1.3 Impulse rate
The number of impulses that exceed a given spectrum amplitude in a given period of time.
1.3.1.4 Impulsive-noise tolerance
The spectrum amplitude of impulses at a given pulse-repetition frequency at which the receiver, with aninput signal applied at specific levels, produces standard signal-to-noise ratios at the output terminals.

Page 62ETR 053: September 1996
1.3.2 Determination of degradation
Degradation of receivers can be determined as follows:
1.3.2.1 Measure the impulsive noise tolerance of the receiving equipment in accordance with applicableIEC standards;
1.3.2.2 Measure NAD in accordance with applicable IEC standards;
1.3.2.3 Superimpose the graphs for the receiver impulse noise tolerance and the NAD. An example isshown in Fig. 7.
1.4 Minimum values of field strength to be protected
The minimum values of field strength to be protected in the land mobile service at frequencies above30 MHz are determined by internal noise generated in the receiver, man-made noise usually in the form ofradiation from ignition systems of motor vehicles and the effects of multipath propagation to and frommoving vehicles. Some information on the effects of traffic density is now available. In the maritime mobileservice, the level of man-made noise depends on the number and nature of high level sources of noise onthe ship.
A convenient measure of the threshold of performance for narrowband receivers is a specified value of:
S + N + DN + D
ratio; the conventionally accepted value being 12 dB (see Recommendation 331).
This defines the minimum useable field strength for any particular installation, in the absence ofman-made noise.
The sensitivity of typical receivers is such that an input signal of 0,7 µV e.m.f. (assuming a receiver inputimpedance of 50 Ω) would result in a 12 dB
S + N + DN + D
ratio at the output. A mobile service is characterized by large variations of field strength as a function oflocation and time. These variations may be represented by a log-normal distribution for which standarddeviations of 8 dB at VHF and 10 dB at UHF are appropriate for terrain irregularities of 50 m (seeRecommendation 370). To determine the minimum value of median field strength to be protected, it isnecessary to specify the percentage of time for which the minimum useable field strength should beexceeded for different grades of service. For land mobile radiotelephony, a high grade of service wouldrequire that the value be exceeded for 99 % of the time, but, for a lower (or normal) grade of service, for90 % of the time.
The minimum values of field strength to be protected can be determined subjectively, taking into accountman-made noise and multipath propagation. Ignition systems of motor vehicles are usually the mostprevalent source of man-made noise. Field strength cancellations due to multipath propagation producean annoyance somewhat similar to that created by ignition systems. When a mobile unit is in motion, bothof these annoyances occur at the same time. Only the effects of receiver noise and man-made noiseremain when the mobile unit is stationary. The separation of motor vehicles is generally less withslow-moving or stationary traffic, and under these circumstances, particularly at the lower frequencies, thedegradation experienced in a stationary mobile unit is greater than when it is in motion.
Figures 3 and 4 can be used to determine the combined degradation effects of man-made noise andmultipath propagation for the case of vehicles in motion. These figures are based on subjective testingunder traffic conditions commonly experienced by most mobile vehicles [FCC, 1973]. Specifically, thesetraffic conditions are the following: in motion while in a low noise area, in motion in traffic surrounded byother vehicles and stationary surrounded by other stationary or moving vehicles.

Page 63ETR 053: September 1996
The tendency for the curves of Figs. 3 and 4 to merge at the higher frequencies is due to the almostconstant multipath degradation effect with frequency and the fact that the degradation effect of man-madenoise decreases with frequency.
Degradation is defined as the increase of level necessary in the desired input signal to maintain thereceiving signal at the degree of quality obtainable when by receiver noise only.
Definitions of signal quality are as follows:
Grade Interfering effect:
5 Almost nil Speech understandable4 Noticeable but with increasing3 Annoying effort as the grade2 Very annoying decreases1 So bad that the presence of speech
is barely discernible
Some information on field strengths can be derived from Recommendation 370. Additional informationcan be found in the document of the CCIR, [1966-69], and in the article of Okumura et al. (1968).
Information on protection ratios and minimum field strengths may also be found in the "Special Agreementbetween the Administrations of Belgium, the Netherlands, and the Federal Republic of Germany relatingto the use of metric and decimetric waves for fixed and mobile services in border areas, Brussels, 1963",and in the Final Acts of the Special Regional Conference, Geneva, 1960. Similar information may befound in the Agreement between the Telecommunications Administrations of Austria, the FederalRepublic of Germany, Italy and Switzerland, Vienna, 1969.
The document of the CCIR, [1963-66], deals with the above questions for signal-to-noise ratios of 30 dBand 40 dB at the receiver output.
Until values based on man-made noise and multipath effects are available, the calculated values ofminimum and median values of field strength shown in figure 2 may be used for hand-portable stations.
FIGURE 2 - Minimum useable and medium field strengths for typical hand-portable stationsbased on minimum useable input of 0,7 µV e.m.f., in the absence of man-made noise
Characteristics assumed: antenna gain B and D: 6dBA and C: 9dB
−−

Page 64ETR 053: September 1996
A, B: median, normal gradeC, D: median, high grade E: minimum useable field strength (dipole antenna)
FIGURE 3 - Variation of degradation of mobile reception and minimum values of field strengthto be protected for signal quality grade 4 and receiver sensitivity of 0,7 µV e.m.f.
Field strength = - 41 + d + 20 log f dB(µV/m)
A: mobile vehicle stationary within a high noise areaB: mobile vehicle in motion within a high noise areaC: mobile vehicle in motion within a low noise area

Page 65ETR 053: September 1996
FIGURE 4 - Variation of degradation of mobile reception and minimum values of field strengthto be protected for signal quality grade 3 and receiver
sensitivity of 0,7 µV e.m.f.
Field strength = - 41 + d + 20 log f dB(µV/m)
A: mobile vehicle stationary within a high noise areaB: mobile vehicle in motion within a high noise areaC: mobile vehicle in motion within a low noise area

Page 66ETR 053: September 1996
Annex B: Spectral parameters
B.1 Spectral parameters for TX-RX compatibility
Figure B.1 shows a typical arrangement of a TX-RX system
Figure B.1: a typical arrangement of a TX-RX system
The following figures are taken from a transmitter of current design having a noise figure of 23 dB.The typical driver output for such a device would be +3 dBm. To derive the broadband noise we take thesource noise (kTB) as being -174 dBm/Hz, (since B = 1 Hz). Now add the driver level to the noise figureand the noise source level we get:
Broadband noise = - (3 + 174 - 23) = -154 dBc/Hz
For a typical 12,50 kHz channel spacing the effective bandwidth of the channel will be 7,5 kHz(see ETS 300 086 [5]). The optimum IF filter for a 12,50 kHz channel therefore has an effective noisebandwidth of 7,50 kHz.
Taking the carrier power as C = + 43 dBm, and N = the noise in a 7,50 kHz bandwidth,
10 log 7 500 = 39
and so C/N = -154 + 39 = -115 dB (or -72 dBm at TX output).
The driver noise is assumed to have a better noise figure (15 dB) for a lower output from the mixer(-20 dBm). (Typical value of noise figure for -20 dBm driver = 15 dB):
- (-20 + 174 - 15 - 39) = -100 dBc
This limit applies to ±1 % of the carrier frequency and the characteristics of the filtering is at least12 dB/octave above.
The calculated noise floor for a receiver having a 15 dB noise figure (input figure included) is:
-174 + 15 + 39 = -120 dBm corresponding to -110 dBm sensitivity (C/N = 10 dB).
At the duplex distance from the transmitter frequency.
Assume a 3 dB degradation on sensitivity as being the worst case (see ETS 300 086 [5]).
The isolation for a 3 dB degradation on sensitivity means an addition of the same noise power and 48 dBis therefore required (-120 dBm ± 72 dBm).

Page 67ETR 053: September 1996
For a 1 dB degradation the requirement is between 7 and 10 dB tighter which results in an isolationrequirement of 55 to 58 dB.
The preceding case has assumed duplex spacings of greater than 2 %. For the case where the duplexdistance is less than 2 % it can be seen from the plot that an additional 15 dB of isolation is required.
This is valid for a single channel, single base station situation. On multiple sites with differentcharacteristics the calculation must be performed for each base station.
If further base stations are added to the site the isolation between them is increased by
10 log(n + 1) dB (where n = the number of additional base stations)
This assumes that all additional base stations have similar characteristics and are within the samefrequency band.
It should be noted that additional isolation will need to be applied to the original base station as well as theadditional ones.
For a four base station installation the isolation requirement is increased by 10 log (3 + 1) = 6 dB.
This means an isolation of 61 - 64 dB will be required between each base station.
If we now consider a duplex TX/RX spacing of 1 % of f0 and a permitted degradation of 1 dB then therequired isolation will be at least 76 - 80 dB (i.e. 15 dB more).
To derive the starting point for the plot we must consider the adjacent channel effect on the noise level.Taking a typical receiver having a 12,50 kHz channel spacing we find that the IF selectivity is typically0,015 % at 80 MHz and 0,014 % at 900 MHz. This results in a typical 7,50 kHz bandwidth based on aworst case degradation of 5 dB below the stated limit.
RX blocking performance
The limit is stated in ETSs at -23 dBm which means that for a transmitter having +43 dBm output a 66 dBisolation is required to protect the associated receiver.
Again this is only valid for a single channel, single base station situation.
Spurious and intermodulation
For the case of a single transmitter and receiver there will be no difficulty with spurious andintermodulation, but when multiple installations are brought together on a site, additional filtering will berequired to ensure that the levels shown in the attached plot are obtained.
If a site has been engineered with TX-RX isolations which are adequate to protect the receivers fromdesensitization by transmitter Power Amplifier (PA) noise (at a typical level of -72 dBm), then taking thelimits for spurious from ETS 300 086 [5] of -36 dBm, it can be seen that should a spurious output fall on orclose to a receiver frequency, additional TX filtering in the order of 36 dB would be necessary.
Intermodulation at the receiver input between a local TX signal and a strong external signal with afrequency which gives a third order product at the exact RX frequency is the worst case to consider forinterference and desensitization of receivers.
If sites are designed with a TX to RX isolation which is sufficient to meet the RX blocking limits (-23 dBmfrom ETS 300 086 [5]) then protection of the receivers to their intermodulation limit (-37 dBm fromETS 300 086 [5]) requires 14 dB of additional filtering at the RX input.

Page 68ETR 053: September 1996
B.2 Evaluation of spectral parameters
Most of the previous discussion in clause B.1 applies to analogue systems where there are existingcomprehensive standards clearly specifying limits for spurious radiations in their current modulationbandwidths. With the introduction of digital systems into common use, wideband noise needs to beconsidered more closely to allow limits and appropriate bandwidths to be specified to ensure completecompatibility between all types of mobile radios. These limits must consider a balanced impact on thequality of a call, either from the transmitted noise or from the blocking performance of the receiver, botheffects having the same degradation origin.
B.2.1 Spurious noise and sideband measurements - transmitters
All methods of measurement for sideband spurious noise are based on a power analysis at fixed offsets offrequency from the transmitter unmodulated carrier. The analysis bandwidth is usually compatible with themodulation applied e.g. for analogue transmissions with channel separations of 12,5 kHz or 25 kHz, theanalysis bandwidths are typically 7,5 kHz and 15 kHz respectively, and 30 kHz and 100 kHz for digitaltransmission with a separation of 200 kHz (GSM) depending on the offset considered.
These methods do not separate noise from spurious emissions even though the impact may differdependent on the type of communication being considered.
For example: a so-called spurious emission occupying 400 kHz with a power of -27 dBm will be found in a100 kHz bandwidth at a level of - 33 dBm, and would be considered unsatisfactory for 2 adjacent GSMchannels. Similarly in a narrowband analogue 12,5 kHz channel separation (8 kHz bandwidth) it willproduce a level in the 32 adjacent channels of - 27 + 10 log (8/400) i.e. - 44 dB. This level would be fullyacceptable for each channel, however the same "narrowband spurious" could disturb a single GSM oranalogue channel if it occupies less than 8 kHz.
To occupy a spurious effect as "narrow" or "wideband" the influence of the measuring bandwidth on its"displayed" power must be analysed. When increasing the bandwidth has no further effect on the"displayed" power levels, this indicates that the maximum "occupation" spectrum of the considerablespurious emission has been reached, and this result can be recorded.
B.2.2 Blocking effect of sideband noise
The quality of a call depends on the Signal to Noise (S/N) characteristic seen at the input of thedemodulator of a receiver. Any addition of noise at this level will result in a significant degradation of thisquality. This addition can come from the sideband noise of a transmission directly received on the tunedchannel or it can result from the mixing of the intermediate frequency with a strong unwanted signal at afixed offset of this channel, and the wideband noise of the local oscillator of the receiver at the sameoffset.
When performing a measurement of the blocking immunity of a receiver, it is not possible to differentiatebetween the reduction (usually by a compression of the gain in the front end modules) of the wantedsignal (Sw) or an increase of the power supply to the active part of receivers' front ends or by betterfiltering, the most critical source of blocking problems is the adjacent noise performances of all oscillators.
Consider the case of a GSM receiver which requires a blocking protection of -23 dBm at a fixed offset ofits tuned frequency. The sensitivity of the receiver is -104 dBm, with a usual value of -105 dBm and this isdegraded by 3 dBm to -101 dBm if the natural noise floor (Nf) of the receiver has the same power level asthe unwanted noise (Nu) "mixed" to the intermediate frequency (IF) by any signal received directly orthrough the local oscillator.
The difference between the blocking protection, taking the minimum unwanted signal level (Su) as-23 dBm, and the final sensitivity for the wanted signal (Sw) as -101 dBm is 78 dB. At the IF the minimumSignal/Interference noise required is about 8 dB so that Nu = Nf = (N - 3) = (S - 11) dB.
Considering the spectrum of the unwanted mixed signal at the fixed offset (Su/Nu) this means that thereceiver has to accept the equivalent of noise in its antenna port of (Sw -11) dB so that Su/Nu = + 78 + 11i.e. 89 dBc in the modulation bandwidth of the GSM signals (270 kHz). For a 1 kHz bandwidth this means89 + 10 log 270 000 = 89 + 54,3 = 143,3 dBc/Hz.

Page 69ETR 053: September 1996
The limit applies to wideband spurious performance if the Su/Nu is transmitted by another GSM signal.However if Su/Nu is mixed with the IF through a local oscillator assumed to have worse spectralperformance than the unwanted signal, the limit applies to this local oscillator.
GSM standards specify the widest bandwidth measurement to be 100 kHz, so the calculated limit has tobe corrected by 10 log (270/100) i.e. 4,3 dB. Thus the requirement for the transmitted S/N of any GSMsignal at the fixed frequency offset has to be better than (89 + 4,3) dB i.e. 93,3 dB.
GSM recommendations call for transmitted spurious to be 65 to 75 dBc, so these expected limits are18,3 to 28,3 dBc below the specified figures. Thus it can be considered that either the blockingrequirement of the receivers is so tight that it will never affect a call, or that GSM transmitted spuriousnoise is not strictly dependent on the sideband noise of the unmodulated sources in use but also on othermodulation effects.
For a typical analogue transmission as specified in ETS 300 086 for 12,5 kHz channel separation(7,5 kHz modulation bandwidth), the same calculation can be performed. In this case the blockingrequirement for unwanted to wanted signals is 87 dB, the minimum S/N at IF for reception is 10 dB, givingNu = Nf = (N - 3) = (S - 13) dB. Thus Su/Nu is (87 + 13) dB i.e. 100 dBc in a 7,5 kHz bandwidth orreferring to a 1 kHz bandwidth 100 + 10 log (7 500) i.e. 138,7 dBc/Hz.
B.2.3 Estimation of sideband noise limits
It can be seen that by considering the compatibility between blocking effects of receivers and sidebandnoise performance of oscillators, both GSM and analogue equipment need to have similar spectralcharacteristics close to 140 dBc/Hz. However, the spurious specifications of GSM transmitters are not sotight because of the ability in cellular applications to escape from a degraded situation into a neighbouringcell. In PMR, where such a possibility does not exist, these performances are more critical.
Comparing these calculated results to the sideband noise curves plotted in figure B.2, the difference looksmarginal and it has been proven by physical measurements that such performances were achievable bymany transmitters. These curves show three levels for sideband noise:
a) the oscillator noise up to an offset of 0,1 %;
b) the effect of filtering in the driver of the PA showing a first noise floor within its bandwidth for anoffset of 0,1 % to 1 %;
c) the extreme noise floor from the PA for offsets greater than 1 %.
The cases analysed in this annex can be considered to be in the first noise floor region.

Page 70ETR 053: September 1996
Off
se
t
Figure B.2: TX and RX base station compatibility

Page 71ETR 053: September 1996
Annex C: Antennas and feeder systems
C.1 Common antenna configurations
Figure C.1: Solid structure
Advantages
a) Li t t le gain or pattern changeb) Good cross-polar per formancec) Good intermodulat ion performance
Figure C.2: Triangular metal mast
Figure C.3: Acceptable performance
Advantages
a) Acceptable gain lossb) Small loss of cross-polar performancec) Small degradation of intermodulation
Figure C.4: Pole mounted
Disadvantages
a) Loss of gain and directivityb) Dubious cross-polar performance
Figure C.5: Square section mast

Page 72ETR 053: September 1996
C.2 Stacking and baying data
Table C.1
FrequencyMHz
Dimensions (in metres)
D S
35 80100125140180400430460
0,900,750,600,500,400,400,140,1330,127
3,402,702,401,801,701,400,530,480,43
NOTE 1: When antennas are stacked, correctphasing is essential. The installer mustensure that all dipoles are mounted on thesame side of the booms when erected.
NOTE 2: Dimensions "D" above is a minimumfigure for a 51 mm diameter mast. Therequired polar diagram will determine theactual spacing used. For generalpurposes, a spacing of λ/4 isrecommended. These points refer also tothe installation of a single VHF/UHFantenna.
Figure C.6: Side-mounted dipoles stacking data

Page 73ETR 053: September 1996
Figure C.7: Vertically polarized (stacked) Figure C.8: Horizontally polarized (stacked)
Table C.2
Numberof
elements
DI
M
Frequency (MHz)
80 120 160 400 4602 A
B2,30 m3,10 m
1,50 m2,00 m
1,20 m1,50 m
3 AB
3,00 m3,90 m
2,00 m2,60 m
1,10 m1,90 m
4 AB
3,80 m4,00 m
2,20 m3,40 m
1,70 m2,30 m
6 AB
3,20 m2,80 m
2,30 m2,60 m
8 AB
2,80 m3,00 m
9 AB
0,70 m0,70 m
0,60 m0,60 m
12 AB
1,10 m1,10 m
1,00 m1,00 m
All types C 0,40 m 0,25 m 0,20 m 0,08 m 0,06 m
Figure C.9: Horizontally polarized (baying) Figure C.10: Vertically polarized (bayed)

Page 74ETR 053: September 1996
C.3 Isolation between antennas
Figure C.11: Typical isolation between antennas
S
SS S
Figure C.12: Parallel elements Figure C.13: Collinear elements

Page 75ETR 053: September 1996
C.4 Control of precipitation noise
Figure C.14: Folded dipole with a dielectric shroud
Raindrops, sleet and snow particles which fall in highly convective conditions (not only duringthunderstorms) often carry electrostatic charges.
When such precipitation falls on antenna elements the transfer of electrostatic charges injects noiseimpulses into the associated receiver. The effect is particularly troublesome at the lower VHF frequencieswhere all but the strongest wanted signals may be obliterated.
An insulated shroud may be fitted to the antenna to prevent the direct discharge on the elements. Thedischarging process on the wetted surface of the shroud still radiates some energy but with a shroudproviding 25 to 50 mm radial clearance around the elements, the noise power coupled to the receiver ismuch reduced.
For VHF Yagi antennas, shrouds are usually fitted only to the driven elements.
Yagi antennas operating in the higher UHF bands are often completely encapsulated for protection of theirdelicate elements rather than for the elimination of precipitation noise.
C.5 Achieved Cross Polar Discrimination (XPD) for antennas mounted at anangle to precise horizontal and vertical frames of axes
Table C.3
Angle of plane ofpolarization fromnominal (degrees)
Achieved XPD for various test rangevalues (dB)
Idealantenna
40 30 20
0° (Correctly aligned)0,1°0,5°1,0°2,0°5,0°
∞5541352921
4038,634,631,227,020,2
3029,627,926,123,518,5
2019,619,318,617,414,5

Page 76ETR 053: September 1996
Table C.3 indicates the XPD which is achieved between two antennas mounted with its polarization planeexactly horizontal and the other one exactly vertical, and an antenna mounted with a small angular error.As an example two antennas providing 40 dB XPD when correctly mounted provide a XPD of 27 dB ifmounted with an alignment error of 2°.
The table emphasizes the importance of accurate mounting; the achievement of a XPD of 30 dB or morerequires especial care at frequencies at which the antenna elements are small or inaccessible. In suchcases it is necessary to optimize cross polar performance by electrical measurements.
C.6 Antennas and feeders
C.6.1 Calculation of system reflection performance
For a transmission line to deliver RF power efficiently to a load it is necessary for the load to behave as apure resistance equal in value to the characteristic impedance of the line. Impedance discontinuitiescause RF energy to be reflected back from the discontinuity towards the input of the line.
Reflections upset the uniform distribution of RF voltage and current on the line. Standing waves areestablished which cause voltage and current maxima and minima to exist at intervals along the length ofthe line. In severe cases standing waves may cause transmitter shutdown or the failure of systemcomponents.
In an RF system having several discontinuities, multiple reflections arrive at the system input with randomphase relationships. In the worst case, if the reflections are in phase, voltage addition will occur. The inphase condition will almost certainly exist in a broadband system over some part of the operatingfrequency band.
Traditionally, Voltage Standing Wave Ratio (VSWR) has been in common use to express the reflectionperformance of RF systems. In certain situations however, return loss and voltage reflection coefficientprove more useful. The three terms are related by the following formulae:
To convert from VSWR (σ) to voltage reflection coefficient (ρ):
ρ σσ
= - 1
+1
and conversely:
σ ρρ
= 1+
1-
Note that ρ is always less than 1 for a passive system; when ρ is expressed as a percentage it must firstbe rewritten in standard form, e.g. 7 % = 0,07.
Return loss (AR) is expressed in dB and is given by:
R 10A = - 20 ( )log ρ
or:
r = 10
- RA20

Page 77ETR 053: September 1996
The return loss measured at the input end of a cable is always greater than that at the load end owing tothe attenuation of the cable. The input VSWR is correspondingly lower than that of the load alone. For acable with an attenuation of 2 dB, the input return loss (Ain) is related to the return loss at the load (Ae) by:
in eA = A + 2
C.6.2 Points of note concerning the reflection performance of RF systems
a) the measurement of VSWR below 1,2:1 (20 dB return loss) is unreliable and meaningless. Returnlosses, and to a lesser degree reflection coefficients are measurable and meaningful over a fargreater range;
b) if a transmitter is connected via a transmission line of the correct characteristic impedance to amismatched load, the return loss at the transmitter Lr,in is always greater than that at the load Lr,load
owing to the attenuation of the cable. For a cable of attenuation (A)dB:
r,in r,loadL = L + 2A
c) manufacturers of transmission lines generally guarantee the reflection performance which may beachieved from an installed cable with both connectors fitted and one end terminated in a highquality matched load;
No allowance can be made for cable attenuation in respect of these figures since they are onlyguaranteed to be measurable at the cable input.
In practice, long cables are more likely to suffer discontinuities along their length. However theincreased attenuation inherent in longer cables limits the degradation of reflection performance.
d) in an RF system having several discontinuities, multiple reflections arrive at the system input withrandom phase relationships. In the worst case, if the reflections are in phase, voltage addition willoccur. The in phase condition will almost certainly exist in a broadband system over some part ofthe operating frequency band.
C.6.3 Calculation procedure for system reflection performance
The radio site designer and of the on-site engineer have different needs for a reflection performancecalculation method. The calculations of the Radio Site designer should account for the effects of allpossible sources of mismatch or reflection and they should be able to predict the range of values whichmay be expected at any point in the system in the best and in the worst case.
The on site engineer has need of a rapid calculation method which can give a good indication of theperformance to be expected even though this may overlook the detailed effects of certain minor reflectionsources.
C.6.4 Reflection performance calculations for radio site designers
C.6.4.1 Voltage reflection coefficient method
Detailed calculations of reflection performance should be carried out using voltage ratios and reflectioncoefficients throughout. The adoption of this method enables the effects of multiple reflections, cableattenuations etc. to be reconciled in a single calculation.
C.6.4.2 Recommended procedure
a) all reflection performance values should be expressed as voltage reflection coefficients either bydirect measurement or by conversion from VSWR and return loss using the standard formulae orconversion tables. The coefficients should be listed against the system configuration;
b) the system RF Attenuations should be converted to voltage ratios and listed in order against thesystem configuration;

Page 78ETR 053: September 1996
c) the voltage reflection coefficient at the input to each stage of the system may be calculated by theapplication of the formula:
ρin = Ldev2 x ρout ± ρdev
where:
ρin is the voltage reflection coefficient at the input to the stage in question;
ρout is the voltage reflection coefficient of the load to the stage in question;
ρdev is the voltage reflection coefficient at the input to the stage when it isperfectly matched at the output;
Ldev is the loss of the stage expressed as a voltage ratio.
NOTE: The sign of the calculation allows the best case and the worst case values to be found.
d) the formula is applied systematically working from the output back towards the input therebyobtaining the voltage reflection coefficients existing at the input to each device in the system.
The calculated reflection coefficient values may be converted back to VSWR or return loss valuesusing the conversion formulae or conversion tables as required.
C.6.4.3 Calculation example
An antenna with VSWR of 1,3 is connected via a flexible tail having a 1 dB loss and manufacturer'sreflection coefficient 0,07 to a main feeder having a 3 dB loss and manufacturers reflection coefficient0,01. Calculate the return loss and VSWR to be expected in the best and in the worst case at the input tothe main feeder.
a) Convert all parameters to Voltage Ratios and Reflection Coefficients
Antenna VSWR = 1,30:1Reflection Coefficient ρA = 0,13
Antenna Tail Loss 1 dBVoltage Ratio LT = 0,89Reflection Coefficient ρT = 0,07
Main Feeder Loss 3 dBVoltage Ratio LF = 0,707Reflection Coefficient ρF = 0,01
b) Calculate ρ at the input to the antenna tail
ρin = 0,892 × 0,13 ± 0,070= 0,173 Worst Case= 0,033 Best Case
c) Calculate ρ at the input to the main feeder
In the worst case
ρin = 0,7072 × 0,173 + 0,1= 0,186 5

Page 79ETR 053: September 1996
In the best case
ρin = 0,7072 × 0,033 - 0,1= 0,083 5
d) Convert to VSWR
1 + 0,186 5 = 1,46:1 Worst Case1 - 0,186 5 1 + 0,083 5 = 1,18:1 Best Case1 - 0,083 5
e) Convert to return loss
- 20 log10 (0,186 5) = 14,6 dB Worst Case
- 20 log10 (0,083 5) = 21,6 dB Best Case
C.6.5 Reflection performance calculations for radio site engineers
C.6.5.1 Return loss method
The matching condition or reflection performance of RF systems may be rapidly evaluated by calculationof the return loss to be expected throughout the system.
The method is simple and effective and it lends itself to mental calculation so that an experiencedengineer will have expected values for any measurements he may make on site. This is a considerableadvantage in recognising problems and diagnosing their cause.
The method is based upon the fact that Return Loss (RL) (dB) of a load is modified by any interveningattenuation A (dB) according to the formula:
RLin = RLload + 2A
and therefore conversely:
RLload = RLin - 2A
It is therefore possible to calculate return loss at the distant end of an RF system from a local return lossmeasurement providing the system attenuation is known.
C.6.5.2 Recommended procedure
The following procedure should be followed:
a) all reflection performance values should be expressed as return loss (dB) either by directmeasurement or by conversion from VSWR and reflection coefficient using the standard formulaeor conversion tables;
b) the known system return loss values and RF attenuations should be listed in order against thesystem configuration;
c) the formula should be applied systematically to calculate the return loss at different stages of thesystem.
NOTE: It is not usually possible to calculate the effects of multiple reflection sources using thismethod, however a rule of thumb assessment is possible using the fact that if tworeflections present identical return losses at a point when considered in isolation theresultant return loss when they act together could be up to 6 dB worse.

Page 80ETR 053: September 1996
In most cases one reflection source dominates (has substantially lower return loss) and the effects of theminor reflection are ignored.
C.6.5.3 Example calculations
a) A faulty antenna is connected to a feeder having an attenuation of 6 dB. What is the return loss andVSWR to be expected in the equipment room?
RL of open circuit antenna = 0 dB (assumed)
RL(in) = 0 + 2 × 6= 12 dB
VSWR = 1,67: 1
b) An antenna having a VSWR of 1,50: 1 is fed by a flexible feeder tail of 0,5 dB loss and then via amain feeder of 3 dB to the equipment room. What is the expected return loss and VSWR whenmeasured at the equipment room connector?
Antenna VSWR 1,5: 1 = Return Loss 14 dB
Return Loss at Main Feeder (top) = 14 + 2 x 0,50= 15 dB
Return Loss at Main Feeder (bottom) = 15 + 2 x 3= 21 dB
Return Loss 21 dBVSWR 1,20:1
c) The feeder of b) above becomes damaged and when terminated with a known good 50 Ω load(having return loss > 30 dB) exhibits a return loss of 20 dB at the equipment room. If the cableattenuation is unchanged what return loss and VSWR could be expected when the antenna isconnected?
Assuming that the reflections are in phase:
RL approximately 14 dB or VSWR = 1,50:
If the reflection is in perfect antiphase the cancellation occurs and the match appears to be perfect:
RL > 30 dB+ VSWR < 1,06:1
Table C.4 is included for ease of reference.

Page 81ETR 053: September 1996
Table C.4: Conversion table
VSWR Return loss (dB) Transmission loss(dB)
Voltage reflectioncoefficient ( ρ)
1,00 0,000 0,001,01 46,1 0,000 0,001,02 40,1 0,000 0,011,03 36,6 0,001 0,011,04 34,2 0,002 0,021,05 32,3 0,003 0,021,06 30,7 0,004 0,031,07 29,4 0,005 0,031,08 28,3 0,006 0,041,09 27,3 0,008 0,041,10 26,4 0,010 0,051,11 25,7 0,012 0,051,12 24,9 0,014 0,061,13 24,3 0,016 0,061,14 23,7 0,019 0,071,15 23,1 0,021 0,071,16 22,6 0,024 0,071,17 22,1 0,027 0,081,18 21,7 0,030 0,081,19 21,2 0,033 0,091,20 20,8 0,036 0,091,21 20,4 0,039 0,101,22 20,1 0,043 0,101,23 19,7 0,046 0,101,24 19,4 0,050 0,111,25 19,1 0,054 0,111,26 18,8 0,058 0,121,27 18,5 0,062 0,121,28 18,2 0,066 0,121,29 17,9 0,070 0,131,30 17,7 0,075 0,131,32 17,2 0,083 0,141,34 16,8 0,093 0,151,36 16,3 0,102 0,151,38 15,9 0,112 0,161,40 15,6 0,122 0,171,42 15,2 0,133 0,171,44 14,9 0,144 0,181,46 14,6 0,155 0,191,48 14,3 0,166 0,19
1,50 14,0 0,177 0,201,52 13,7 0,189 0,211,54 13,4 0,201 0,211,56 13,2 0,213 0,221,58 13,0 0,225 0,221,60 12,7 0,238 0,231,62 12,5 0,250 0,241,64 12,3 0,263 0,241,65 12,1 0,276 0,251,68 11,9 0,289 0,25
(continued)

Page 82ETR 053: September 1996
Table C.4 (concluded): Conversion table
VSWR Return loss (dB) Transmission loss(dB)
Voltage reflectioncoefficient ( ρ)
1,70 11,7 0,302 0,261,72 11,5 0,315 0,261,74 11,4 0,329 0,271,76 11,2 0,342 0,281,78 11,0 0,356 0,281,80 10,9 0,370 0,291,82 10,7 0,384 0,291,84 10,6 0,398 0,301,86 10,4 0,412 0,301,88 10,3 0,426 0,31
1,90 10,2 0,440 0,311,92 10,0 0,454 0,321,94 9,9 0,468 0,321,96 9,8 0,483 0,321,98 9,7 0,497 0,332,00 9,5 0,512 0,332,50 7,4 0,881 0,433,00 6,0 1,249 0,503,50 5,1 1,603 0,564,00 4,4 1,938 0,6
4,50 3,9 2,255 0,645,00 3,5 2,553 0,675,50 3,2 2,834 0,896,00 2,9 3,100 0,716,50 2,7 3,351 0,737,00 2,5 3,590 0,75
7,50 2,3 3,817 0,768,00 2,2 4,033 0,788,50 2,1 4,240 0,799,00 1,9 4,437 0,89,50 1,8 4,626 0,81
10,00 1,7 4,807 0,8211,00 1,6 5,149 0,8312,00 1,5 5,466 0,8513,00 1,3 5,762 0,8614,00 1,2 6,040 0,8715,00 1,2 6,301 0,8816,00 1,1 6,547 0,8817,00 1,0 6,780 0,8918,00 1,0 7,002 0,8919,00 0,9 7,212 0,90
20,00 0,9 7,413 0,9025,00 0,7 8,299 0,9230,00 0,6 9,035 0,94

Page 83ETR 053: September 1996
Annex D: Noise power on typical radio sites
Environmental category:A: businessB: residentialC: ruralD: quiet ruralE: galactic
Figure D.1: Mean values of man-made noise for a short verticallossless grounded monopole antenna
The above graph has been taken from CCIR Report 258-4, and has been expanded from 25 to1 000 MHz for ease of reference to the Land Mobile Service.
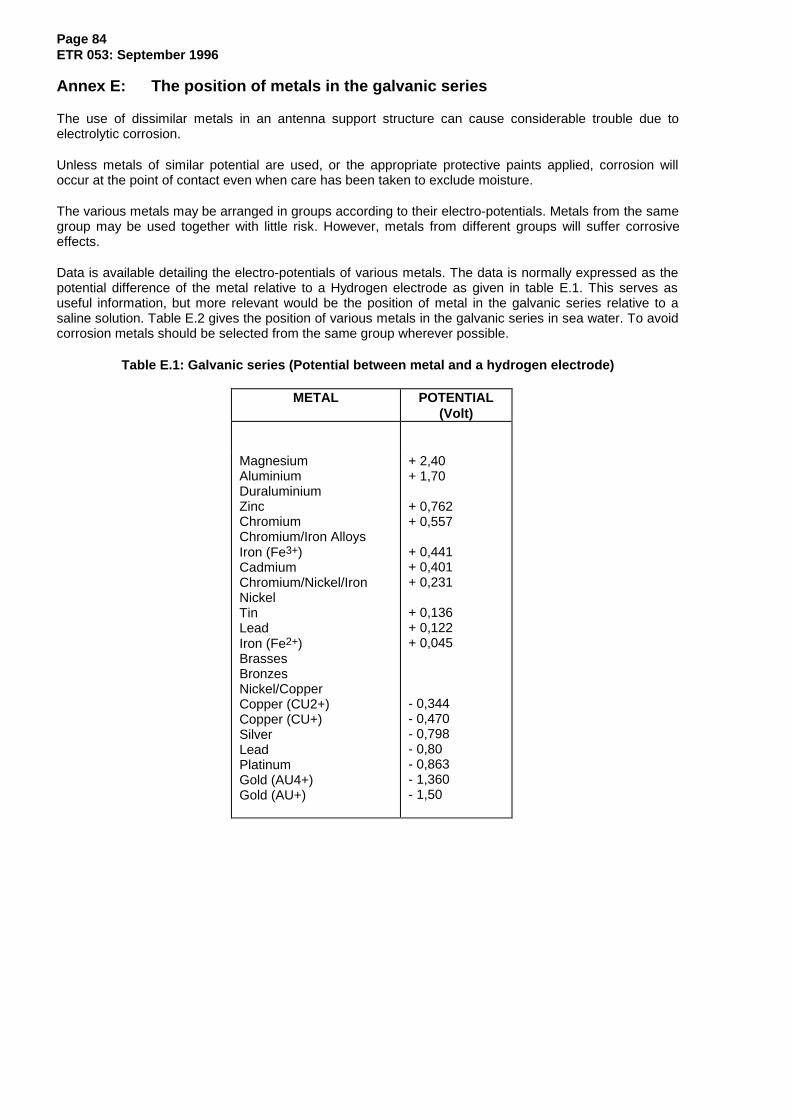
Page 84ETR 053: September 1996
Annex E: The position of metals in the galvanic series
The use of dissimilar metals in an antenna support structure can cause considerable trouble due toelectrolytic corrosion.
Unless metals of similar potential are used, or the appropriate protective paints applied, corrosion willoccur at the point of contact even when care has been taken to exclude moisture.
The various metals may be arranged in groups according to their electro-potentials. Metals from the samegroup may be used together with little risk. However, metals from different groups will suffer corrosiveeffects.
Data is available detailing the electro-potentials of various metals. The data is normally expressed as thepotential difference of the metal relative to a Hydrogen electrode as given in table E.1. This serves asuseful information, but more relevant would be the position of metal in the galvanic series relative to asaline solution. Table E.2 gives the position of various metals in the galvanic series in sea water. To avoidcorrosion metals should be selected from the same group wherever possible.
Table E.1: Galvanic series (Potential between metal and a hydrogen electrode)
METAL POTENTIAL(Volt)
MagnesiumAluminiumDuraluminiumZincChromiumChromium/Iron AlloysIron (Fe3+)CadmiumChromium/Nickel/IronNickelTinLeadIron (Fe2+)BrassesBronzesNickel/CopperCopper (CU2+)Copper (CU+)SilverLeadPlatinumGold (AU4+)Gold (AU+)
+ 2,40+ 1,70
+ 0,762+ 0,557
+ 0,441+ 0,401+ 0,231
+ 0,136+ 0,122+ 0,045
- 0,344- 0,470- 0,798- 0,80- 0,863- 1,360- 1,50

Page 85ETR 053: September 1996
Table E.2: The Galvanic series in sea water
MagnesiumMagnesium alloysZincGalvanized steelGalvanized wrought ironAluminium:52SH, 4S, 3S, 2S, 53STAluminium cladCadmiumAluminium:A17ST, 17ST, 24STMild steelWrought ironCast ironNi-resist13% chromium stainless steel type 410 (active)50-50 lead-tin solder18-8 stainless steel type 304 (active)18-8-3 stainless steel type 316 (active)LeadTinMuntz metalManganese bronzeNaval BrassNickel (active)Inconel (active)Yellow brassAdmiralty brassAluminium bronzeRed brassCopperSilicon bronzeAmbrac70-30 copper-nickelComp.G, bronzeComp.M, bronzeNickel (passive)Inconel (passive)Monel18-8 stainless steel type 304 (passive)18-8-3 stainless steel type 316 (passive)
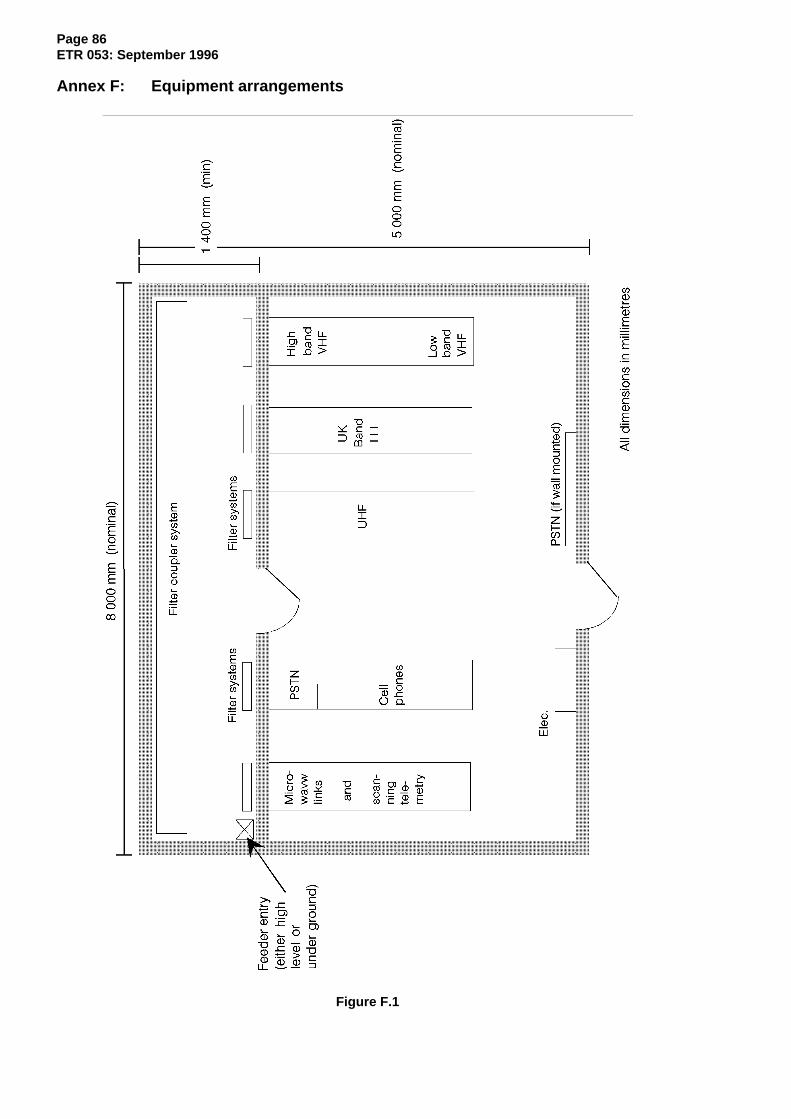
Page 86ETR 053: September 1996
Annex F: Equipment arrangements
Figure F.1

Page 87ETR 053: September 1996
Annex G: Typical example of good earthing practice
(45º below 20m60 m radius above 20 m)
Figure G.1

Page 88ETR 053: September 1996
Annex H: Equipment used to avoid radio frequency problems
H.1 Cavity resonators
H.1.1 Introduction
Throughout this report many references have made to the use of cavity resonators. This clause has beenincluded for the benefit of those encountering cavity resonators for the first time.
H.1.2 General
The main characteristic of cavity resonators is their high selectivity. They can be used to protect receiverinputs from strong off frequency signals which can generate interference and they can also provideisolation between transmitters and reduce spurious emissions. The selectivity curve of a typical high-bandcavity resonator is shown in figure H.1.
Figure H.1: Cavity resonator frequency response
H.1.3 Typical applications
A cavity resonator can be employed when analysing interference problems, particularly those which occurat radio sites. Receiver deficiencies can be identified by inserting the cavity resonator in the lead betweenthe aerial and the receiver. If this cures the interference it indicates that the receiver has a spuriousresponse or is overloaded by off frequency signals. Note that although the selectivity of the cavityresonator is very high the pass-band will include several 12,5 kHz spaced channels.
When monitoring close to radio sites problems can be encountered in the form of breakthrough intoreceiving equipment. A cavity filter can often help in this situation. To be effective, the cavity resonatormust be used ahead of any active stages in the signal path, such as pre-amplifiers and converters. Theslight reduction in the signal to noise ratio, caused by the insertion loss of the cavity resonator, does notusually cause a problem.
When investigating intermodulation problems with a spectrum analyser care should be taken to ensurethat signals displayed on the screen are not internally generated. Figure H.2 shows the display of aspectrum analyser used without a cavity resonator. Signal C is observed only when signals A and B arepresent simultaneously. The difference in level between signals A and B and the third order

Page 89ETR 053: September 1996
intermodulation product (signal C) is greater than the dynamic range of the analyser. Note that signalswhich could cause the analyser to be overloaded can fall outside the part of the spectrum being displayed.
Figure H.2 Figure H.3
In figure H.3 the analyser is used with a cavity resonator. The selectivity curve is shown dotted. Signals Aand B are attenuated so that they are within the dynamic range of the analyser. In this particular casesignal C remains, thus proving that it is being received and not generated within the analyser.
Cavity resonators are used to provide transmitter isolation on multicoupled sites. A typical installation isshown in figure H.4.
Figure H.4
H.1.4 Cavity resonator construction
A cavity resonator is formed when conducting walls surround a space. They are often made cylindrical inshape and the electrical resonant frequency of the cavity is dependent on the physical dimensions and themode of operation. The electrical behaviour of the cavity resonator is similar to a capacitor and inductorcombination. A common form of construction is shown in figure H.5.

Page 90ETR 053: September 1996
Figure H.5
Figure H.6 gives a simplified explanation of how a cavity resonator is derived from a tuned circuit withlumped components. Progressively lower inductances are used to tune a fixed capacitor to higherfrequencies. In figure H.6b, the coil is reduced to a single hairpin loop. In figure H.6c, two loops areconnected to the same capacitor and the inductance is halved. Further loops are added in figure H.6d.The cavity shown in figure H.6e is, in effect, an infinite number of loops in parallel.
Figure H.6
The coaxial construction of the cavity resonator is similar to a quarter-wave section of transmission linethat is open at one end. Like a quarter wave stub, the cavity possesses additional resonances onodd-harmonic frequencies. These resonances can be used to extend the useful frequency range butmake the cavity resonator unsuitable for use as a transmitter harmonic filter.
The factor "Q" is used as a measure of the selectivity of a tuned circuit. It can be found from:
Q = f
b
where:
- Q = loaded Q;- f = centre frequency (Hz);- b = bandwidth to 3 dB points (Hz).
A typical cavity resonator would have a frequency range of 145 to 180 MHz, with a power rating of 100 W,possess a Q in the order of 1 000 with an insertion loss of about 1 dB. One of the coupling loops isnormally adjustable and it's purpose is to provide fine adjustment of the input matching. The cavityresonators are normally supplied with these loops locked in the maximum coupling position. A greater Qcan be achieved at the expense of insertion loss, but this involves changing the loop size. This should notbe attempted.

Page 91ETR 053: September 1996
H.1.5 Alignment
To align the cavity resonator a signal generator is used in conjunction with a spectrum analyser as shownin figure H.7.
Figure H.7
With the locking screw loosened, the central tuning rod is moved in or out until the position for minimumloss (maximum signal) is found. Moving the tuning rod inwards lowers the frequency and vice versa. Thisprovides a coarse method of tuning.
Fine tuning is normally achieved by means of an adjusting nut. It is usually positioned on the tuning rod sothat it is in contact with the collar at the top of the cavity resonator and then tightened to the rod by meansof a screw. Rotation of the nut clockwise or anti-clockwise now provides fine tuning HF or LF respectively.Because there is not usually a return spring, it is necessary to apply a manual pressure to the tuning rodtowards the cavity whilst adjusting the nut. Once the final tuning point has been found the tuning rodlocking screw can be tightened. Check that this final tightening does not alter the tuning. The adjusting nutcan now be removed from the tuning rod.
If the cavity resonator is to be used on the output of a transmitter, as in a multi-coupled system, a moresuitable method of alignment is shown in figure H.8. A power meter is inserted in the lead between thetransmitter and the cavity resonator and the tuning rod is adjusted for minimum reflected power. Thismethod has the advantage of not requiring the power meter to be inserted on the output side of the cavityresonator where the output cable may be acting as a phasing line. Although rotation of the adjustablecoupling loop might improve the matching still further there is a possibility that this would compensate forpoor positioning of the tuning rod and result in excessive insertion loss. The coupling loop should thereforebe left in the position as supplied by the manufacturers.
Figure H.8
Cavity resonators that are primarily designed as bandpass filters can also be used as a notch filter. Asshown in figure H.9, the cavity resonator is used in conjunction with a quarter wave section of cable whichis "T"ed into the transmission line. The quarter wave section of cable transforms the high impedance at

Page 92ETR 053: September 1996
resonance at the cavity terminal to a low impedance at the "T", which attenuates the unwanted signal.Because the coupling loop within the cavity acts as an extension of the quarter wave section of cable, thephysical length of the section needs only to be about 1/8 wavelength. Typical cavity resonators onlyproduce about 10 dB notch when used in this manner (although it is often very sharp). Modification to theloop to obtain a more useful notch should not be attempted.
Figure H.9
Although not specifically designed for the purpose, the cavity resonator can be used in a third-harmonicresonance mode, thus extending their frequency range with reduced performance.
H.2 Ferrite isolators and circulators
H.2.1 Introduction
Throughout this ETR many references have been made to the use of ferrite isolators and circulators. Thisclause has been included for the benefit of those meeting the devices for the first time.
H.2.2 General
The ferrite isolator is a device which allows RF power to flow in only one direction. Power entering at the"IN" port will go to the "OUT" port with a small loss (< 1 dB typical). Power entering the "OUT" port will goto the "LOAD" port to be dissipated in a termination, thus providing isolation (> 25 dB typical). With theload removed from the third port the device can be used as a circulator.
Figure H.10

Page 93ETR 053: September 1996
H.2.3 Typical applications
The non-reciprocal property of the isolator can often be used to reduce or eliminate intermodulationbetween co-sited transmitters. A common situation where intermodulation occurs is shown in figure H.11.Because of the close proximity of the two aerials, the RF power from transmitter 2 finds its way into thepower amplifier (PA) stage of transmitter 1. Non-linearity in the PA stage causes the two carrierfrequencies to mix and unwanted intermodulation products are radiated via the antenna. Similarly, the RFfrom transmitter 1 can find its way into the PA of transmitter 2, where the same effect occurs.
Figure H.11
These unwanted frequencies exist as radiated signals and can sometimes be radiated a considerabledistance. No amount of filtering at the receiver can eliminate those that fall within the receiver passband.
One solution to this problem is shown in figure H.12, where isolators are inserted in the output lead ofeach transmitter and the unwanted RF energy is absorbed in the load associated with each isolator.
Figure H.12

Page 94ETR 053: September 1996
The isolator also protects the transmitter against a high VSWR should the aerial or cable become faulty,as the transmitter power is then diverted to the load. Under such fault conditions the load needs to becapable of handling the full transmitter power.
As a general rule it is better to make sure that the intermodulation problem is not due to a faultytransmitter or antenna system before fitting an isolator as these devices can clear a problem by maskingthe actual fault. Note that the isolator cannot be fitted in a feeder carrying both transmit and receivesignals.
The useful bandwidth over which the non-reciprocal effect occurs is about 1,5 % of the centre frequency.A plot of the forward and reverse attenuation is shown in figure H.13. It can be seen that the isolator issuitable for "close-in" intermodulation problems. If the frequency spacing of the transmitters is greater thanthe isolator bandwidth it is likely that a bandpass filter will provide better isolation.
Figure H.13
As a circulator, the device can be used to split transmit and receive paths for duplex operation, seefigure H.14.
Figure H.14
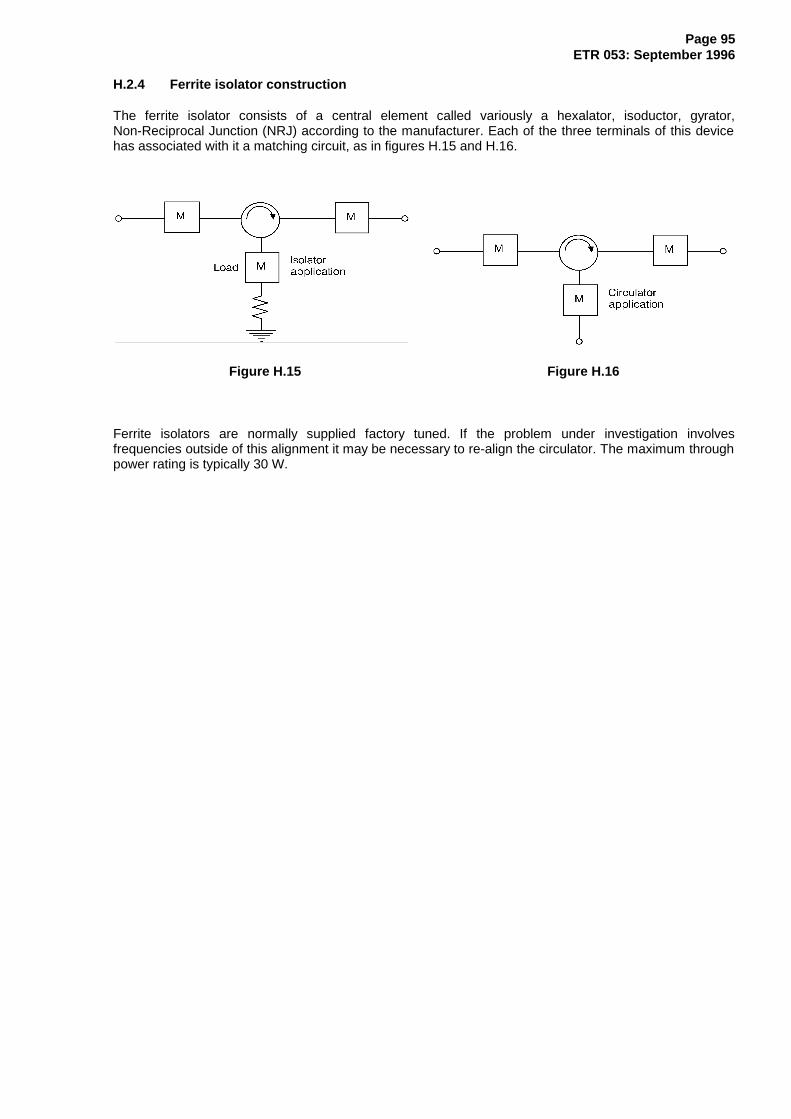
Page 95ETR 053: September 1996
H.2.4 Ferrite isolator construction
The ferrite isolator consists of a central element called variously a hexalator, isoductor, gyrator,Non-Reciprocal Junction (NRJ) according to the manufacturer. Each of the three terminals of this devicehas associated with it a matching circuit, as in figures H.15 and H.16.
Figure H.15 Figure H.16
Ferrite isolators are normally supplied factory tuned. If the problem under investigation involvesfrequencies outside of this alignment it may be necessary to re-align the circulator. The maximum throughpower rating is typically 30 W.
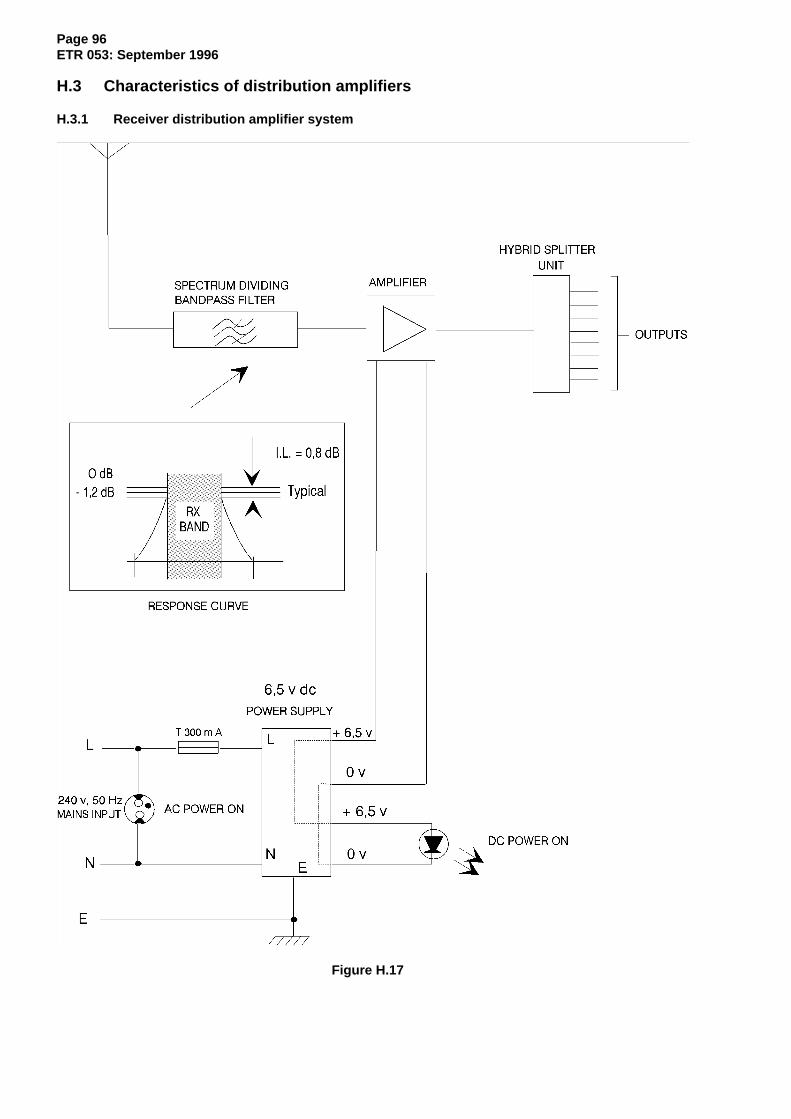
Page 96ETR 053: September 1996
H.3 Characteristics of distribution amplifiers
H.3.1 Receiver distribution amplifier system
Figure H.17

Page 97ETR 053: September 1996
H.3.2 Receiver distribution amplifier in a 4 way multicoupler system
Figure H.18
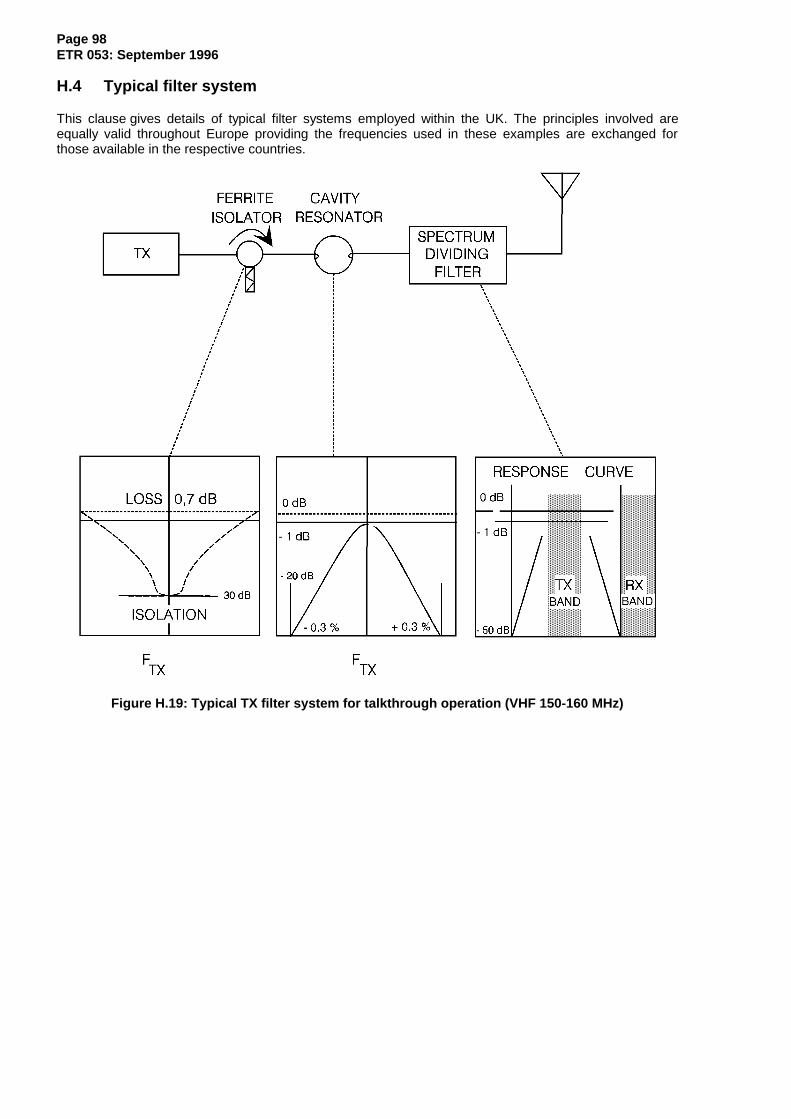
Page 98ETR 053: September 1996
H.4 Typical filter system
This clause gives details of typical filter systems employed within the UK. The principles involved areequally valid throughout Europe providing the frequencies used in these examples are exchanged forthose available in the respective countries.
Figure H.19: Typical TX filter system for talkthrough operation (VHF 150-160 MHz)
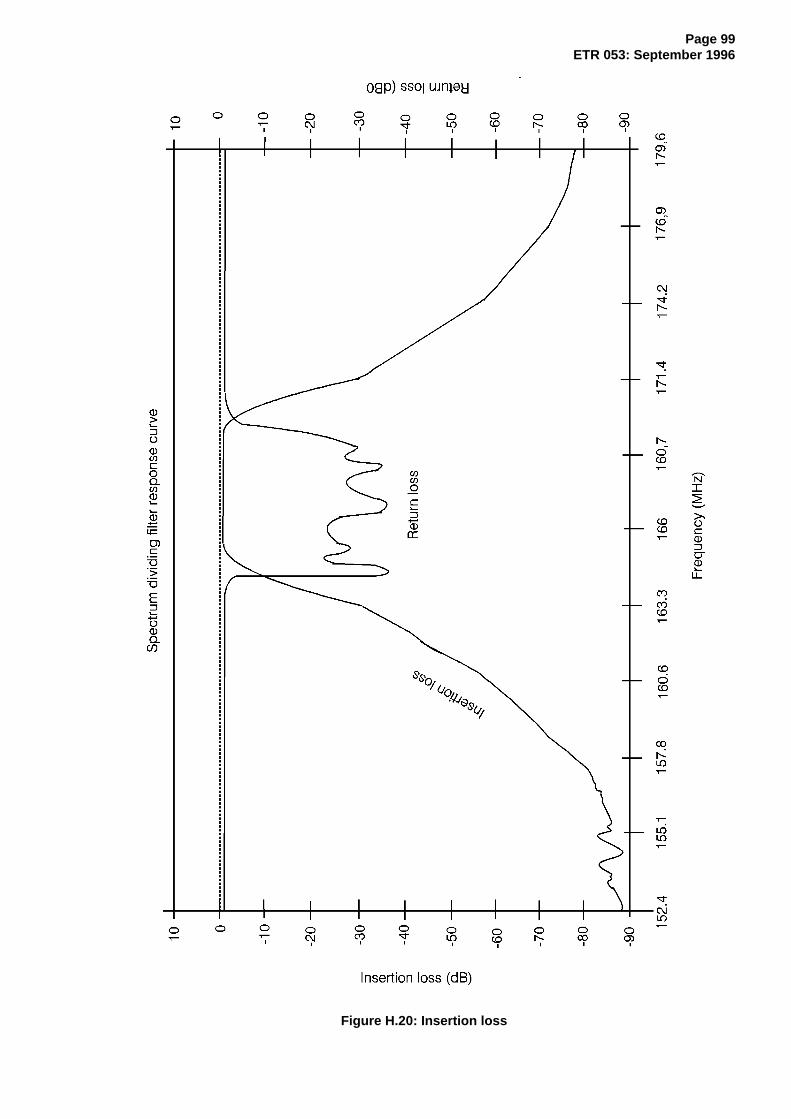
Page 99ETR 053: September 1996
Figure H.20: Insertion loss

Page 100ETR 053: September 1996
Figure H.21: Single antenna UHF system

Page 101ETR 053: September 1996
T
Figure H.22: Typical sub-band TX/RX system

Page 102ETR 053: September 1996
Figure H.23: Spectrum dividing filter response curve

Page 103ETR 053: September 1996
H.5 Trunking combiner
H.5.1 Trunking combiner system
Figure H.24: Typical trunking combiner system
This system is designed to allow single antenna working for a multi-channel trunking installation.
The equipment is configured such that it can operate over various bandwidths (range 1 - 10 MHz).
The system can accommodate up to 16 channels in VHF or UHF.
H.5.2 Specification of a TX/RX trunking combiner
The following specification relates to an 8 channel combiner.

Page 104ETR 053: September 1996
Table H.1: TX/RX trunking combiner specification - TX path
Insertion Loss (from input to antenna port): Typically 2,80 dBTX to TX Isolation: > 55 dBMinimum Frequency Spacing betweenTransmitters:
120 kHz
Input VSWR: Better than 1,10:1 (Return loss 26 dB)Output VSWR: Better than 1,20:1 (Return loss 21 dB)Power handling (each channel): 60 W (17 dBW) 100 W version available)5th Order Intermodulation (for 17 dBW inputs): Better than - 154 dBWTX to RX isolation: > 90 dBNumber of channels: 5, 8, 10 or 16
Table H.2: TX/RX trunking combiner specification - RX path
Overall Gain: Typically + 3 dB (can be adjusted up to 6 dB)Input VSWR: Better than 1,20:1 (Return Loss 21 dB)Output VSWR: Better than 1,20:1 (Return Loss 21 dB)RX to TX Isolation: > 90 dBNoise Figure: 5 dB typicalThird Order Intercept: +25 dBm typicalRX to RX Isolation: 25 dB typical

Page 105ETR 053: September 1996
Annex J: Interference due to intermodulation products in the land mobileservice between 25 and 1 000 MHz
ITU-R (Ex CCIR) REPORT 739-1
(Study Programme 7C/8)
(1978 - 1986)
1 Introduction
Intermodulation causes a degradation to radio services when:
- unwanted emissions are generated in transmitters;
- unwanted emissions are generated in non-linear elements external to the transmitters; or
- in-band intermodulation products are generated in the radio-frequency stages of receivers.
These cases occur with varying probability and varying severity. They may be reduced by equipmentdesign or careful choice of channels, but solutions of the latter type to one case of intermodulation mayincrease another.
2 Transmitters
The last active stage of a transmitter is usually an amplifier. The current in this stage will be repeatedlyswept from zero amplitude to a maximum and the impedance of the output active device is liable tocontain a small amount of non-linearity.
If any other signal from another emission is also present at the output of this stage, the non-linearity willgive rise to a number of products having frequencies with specific frequency relationships to the frequencyof both the wanted and unwanted signals. These products are called intermodulation products, and theirfrequencies may be expressed as:
fi = C1 • f1 + C2 • f2 + ... + Cn • fn (1)
where the sum | C1 | + | C2 | + ... + | Cn • fn | is the order of the product.
The odd-order intermodulation products may be relatively close in frequency to the wanted signalfrequency and thus coupled via the output circuit to the antenna with minimal attenuation.
In order to be able to calculate the effects of these products, it is necessary to establish certain terms.
2.1 Coupling loss A c
The coupling loss Ac, in dB, is the ratio of the power emitted from one transmitter to the power level of thatemission at the output of another transmitter which may produce the unwanted intermodulation product.
Typical values for the coupling loss on a common site are of the order of 30 dB.
2.2 Intermodulation conversion loss, A I
The intermodulation conversion loss AI, in dB, is the ratio of power levels of the interfering signal from anexternal source and the intermodulation product, both measured at the output of the transmitter.
Without any special precautions, typical values for semi-conductor transmitters are to be found in a rangeof 5 to 20 dB and for valve transmitters, in the range of 10 to 30 dB, in respect of the 3rd order product(2f1 - f2).
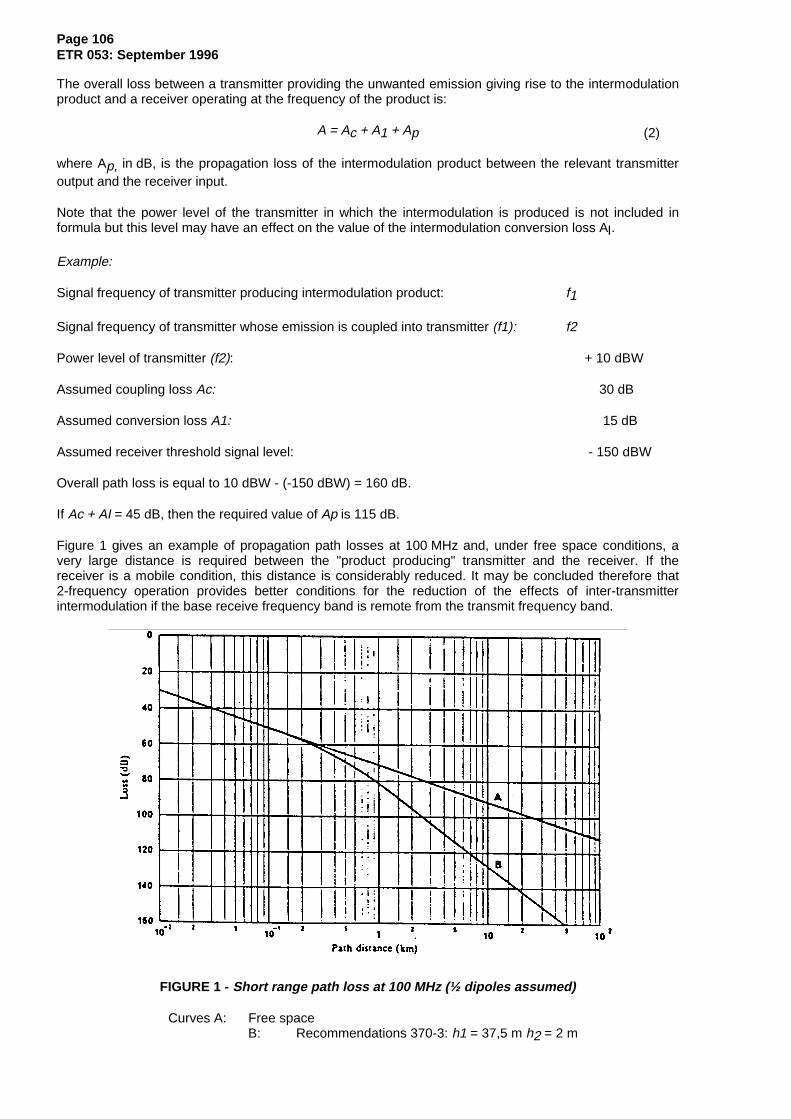
Page 106ETR 053: September 1996
The overall loss between a transmitter providing the unwanted emission giving rise to the intermodulationproduct and a receiver operating at the frequency of the product is:
A = Ac + A1 + Ap (2)
where Ap, in dB, is the propagation loss of the intermodulation product between the relevant transmitteroutput and the receiver input.
Note that the power level of the transmitter in which the intermodulation is produced is not included informula but this level may have an effect on the value of the intermodulation conversion loss AI.
Example:
Signal frequency of transmitter producing intermodulation product: f1
Signal frequency of transmitter whose emission is coupled into transmitter (f1): f2
Power level of transmitter (f2): + 10 dBW
Assumed coupling loss Ac: 30 dB
Assumed conversion loss A1: 15 dB
Assumed receiver threshold signal level: - 150 dBW
Overall path loss is equal to 10 dBW - (-150 dBW) = 160 dB.
If Ac + AI = 45 dB, then the required value of Ap is 115 dB.
Figure 1 gives an example of propagation path losses at 100 MHz and, under free space conditions, avery large distance is required between the "product producing" transmitter and the receiver. If thereceiver is a mobile condition, this distance is considerably reduced. It may be concluded therefore that2-frequency operation provides better conditions for the reduction of the effects of inter-transmitterintermodulation if the base receive frequency band is remote from the transmit frequency band.
FIGURE 1 - Short range path loss at 100 MHz (½ dipoles assumed)
Curves A: Free spaceB: Recommendations 370-3: h1 = 37,5 m h2 = 2 m

Page 107ETR 053: September 1996
The intermodulation caused by two or more mobile transmitters will be worse when the mobiles areclosest together and when the desired signal originates at a mobile at the edge of the service area, anevent which is associated with some (perhaps small) probability. The mobile being interfered with will bereceived at its base as a signal of widely varying level (due to fades and shadows) which will beindependent of the IM interference. These wide and independent variations can allow the IM to reachharmful values for periods of time, even when its average value is much less than that of the signal.
3 External non-linear elements
On most sites, external non-linear elements will be at junctions in masts, feeders, and other antennaswhich are closely coupled to the radiating elements of nearby transmitters.
It would be useful to determine conversion losses for masts etc., of various qualities in terms of isotropicloss between transmitters and the masts, etc. It would then be possible to establish specific values asgood engineering practice.
4 Receivers
An intermodulation response is a response at the output of a receiver from an in-band signal generated inthe RF stages of the receiver. This in-band signal is generated by the presence of two (or more) high-levelsignals in a non-linear section of the RF stages. As with transmitters, the two (or more) unwanted signalsmust have specific frequencies such that the intermodulation product lies within the frequency bandaccepted by the receiver.
This receiver characteristic is normally recorded as a signal measurement with the level of the unwantedsignals equal and is given as a single ratio which is:
the ratio of the level of these two equal signals
to
the apparent level of the intermodulation product at the input to the receiver.
Figure 2 gives examples (3 theoretical and 1 measured) of the overall third order intermodulationcharacteristic of receivers. It shows that intermodulation may easily be a problem when one of theunwanted signals is not excessively high. Such curves can be used to calculate other intermodulationproduct levels when the unwanted signals of not have values equal to those plotted.
For a product with a frequency relationship of the form (2f1 - f2), the level will be proportional to the levelof the signal at frequency f2, but will vary as the square of the level of the signal f1; i.e. the product will
have an amplitude of the form k • •V V12
2, where V1, V2 are the amplitudes of the signals at frequencies
f1 and f2 respectively.
When a mobile receiver is used in a multi-channel system it will be subject to an intermodulation responsedue to many equally spaced high level signals. The following relationship has been suggested by thePeople's Republic of China to relate the maximum permissible signal level with the intermodulationresponse rejection ration of the receiver [CCIR, 1982-86A]:
Es + 3EM ≥ 3EImax + B + k(n,p)where:
ES: wanted signal level (dB) above sensitivity;EImax: maximum interference signal level (dB) above sensitivity;EM: receiver's third-order intermodulation rejection ratio (dB) (for two signals);B: RF protection ratio (dB);k(n,p): a constant dependent on the number of channels n and channel sequence p.
The derivation of this formula and the calculation of k(n,p) are given in annex I.

Page 108ETR 053: September 1996
5 Reduction of intermodulation product levels in transmitters
5.1 Intermodulation conversion loss
It is obvious that a reduction of the non-linearity, particularly of the odd-numbered orders, will improve theoverall performance and increase the value of the intermodulation conversion loss AI.
From the example in § 2, it is evident that a considerable improvement is necessary before the relevantpath loss reduces to manageable values.
5.2 Coupling loss
The coupling loss can obviously be increased by increasing the distance between the relevant transmittersbut it may not always be possible to do so effectively at a particular site.
Ferrite isolators could be used in the output circuits of the transmitter in which the product is generated butpresent production units do not provide much more than 25 dB additional loss and the use of the multipleunits is inhibited by the inherent non-linearity of the isolators themselves. To suppress undesirableproducts filters may be required after such isolators. These isolators are equally effective irrespective ofthe frequency spacing between f1 and f2.
FIGURE 2 - Receiver intermodulation characteristic
Levels of unwanted input signals which together produce a constant product level.
Curves A, B and C: derived characteristics based on a single recorded value of the receiver's third orderintermodulation characteristic, i.e. for (2f1 - f2).
Curves A: based on a single value, with both input levels at a level of 60 dB(µV) (e.m.f. to 50 ohms).B: based on a single value, with both input levels at a level of 70 dB(µV) (e.m.f. to 50 ohms).C: based on a single value, with both input levels at a level of 80 dB(µV) (e.m.f. to 50 ohms).D: measured values for a receiver for which the specified criterion is achieved with equal input signal
levels of 65.5 dB(µV) (e.m.f. to 50 ohms).

Page 109ETR 053: September 1996
Cavity filters can also be used and examples of their theoretical responses are given in Figure 3. Theymay be used in cascade or in more complex series-parallel combinations but in all cases, theirperformance is dependent on the frequency spacing between f1 and f2. They have the advantage thatthey will also attenuate the product level at the input to the antenna or transmission line and thus increaseAI.
FIGURE 3 - Theoretical response of cavity band-pass filters
For values of loaded Q of 250 - 2 500
Note. - The unloaded Q should be at least 5 times the loaded Q and preferably 10 times
An economic and efficient filter is the coaxial cavity resonator, either in its pure quarter-wavelength form orwith varying degrees of modification to reduce the overall length and improve the value of the loaded Q.The resonator should be robust, simple to tune, highly efficient in terms of transmission loss, and providea high degree of isolation at the required frequencies. Resonators for use with transmitters should have alow temperature coefficient and good thermal conductivity, so that their performance is not affected bychanges in ambient temperature or through being heated by transmission losses. Temperaturecompensation can be employed to maintain the length of the centre conductors. Physical robustness isnecessary to avoid changes in technical parameters from being caused by mechanical shock ordeformation. The physical and mechanical design should also prevent the formation of electricaldischarges or corona. Adjustable telescopic centre conductor assemblies permit a variation of resonantfrequency of, typically, ± 15 % of the centre frequency.
Reliable and economical resonators can be manufactured from high-conductivity aluminium for the largerunits, and silver-plated copper or brass for smaller units. Practical limitations of mechanical engineeringgovern the upper limits of Q obtainable with a cavity resonator. As the diameter is increased, the value ofthe unloaded Q is increased but the sensitivity of tuning and the temperature coefficient become morecritical. Practical and satisfactory resonators with a power handling capacity of up to 250 W can, however,be made for the band 150 - 170 MHz, for example, having an unloaded Q as large as 18 000, with adiameter of 0,58 m, and length 0,63 m giving 35 dB discrimination at a frequency 1 % removed from theresonant frequency.

Page 110ETR 053: September 1996
It is not usual to employ cavity resonators for values of Q below 1 000 since there are more satisfactorytechniques, e.g. helical resonators, which can be coupled together to form smaller but relatively efficientfilter units. Tables I and II give the choice of types of filter and their relative costs.
TABLE I - Relative sizes and costs of resonators (150-174 MHz)
1 2 3 4 5 6
Reference Q0 QLAttenuation
at1 % F0 (dB)
Diameter(m)
Relative costof practicalresonators
ABCDEFGHI
9202 3004 6006 9009 20011 70013 80016 10018 400
100250500750
1 0001 2501 5001 7502 000
71421242628303235
0,030,070,140,210,290,370,460,530,58
1,01,72,83,33,94,65,36,87,1
Table II - Relative costs of practical resonators for other frequencies
Resonantfrequency
(MHz)
Cavityheight
(m)Unloaded Q
920 2 300 4 600 6 900 9 200 13 800
50 - 6060 - 8095 - 110120 - 150150 - 174160 - 180400 - 500
1,551,150,850,680,630,520,24
****
1,00,90,8
**
3,32,61,71,51,0
8,75,54,13,32,82,41,5
12,07,35,24,23,32,92,0
14,710,66,45,03,93,42,2
+14,910,78,95,34,63,0
Note. - Items not tabulated are identified as follows:* Helical resonator superior+ Single cavity large and somewhat uneconomic.
Compared with the total cost of the radio equipment at a base station, cavity resonator filters are aneconomical and efficient means of reducing spurious emissions and preventing or minimizing interference.
5.3 Identification of the source of an intermodulation product
The frequency of the third order intermodulation resulting from the interaction of two transmitters may beexpressed as either 2f1 - f2 or 2f2 - f1.
If the product is 2f1 - f2, the mixing is occurring within or close to the transmitter operating on f1.
Conversely, if the product is 2f2 - f1, the mixing is occurring within or close to the transmitter operating onf2.
In the case of FM or PM emissions, the deviation caused by modulation is doubled when a secondharmonic is generated. So if the modulation on one of the intermodulation products appears to beexcessive, this modulation is probably transferred from the f1 signal of a 2f1 - f2 mixing.

Page 111ETR 053: September 1996
6 Reduction of intermodulation products in receivers
As with transmitters, a reduction in the non-linearity of a receiver will improve the performance.
Attenuation at the input of the receiver may be used to reduce the level of an intermodulation product. Thelevels of these products are related to the levels of the signals that produce them, in such a way that theattenuation (in dB) of each "nth" order product will, in most cases, be n times the attenuation (in dB) of thewanted signal.
For example, a 3 dB attenuator will reduce a third order product by 9 dB while reducing the wanted signalby 3 dB. This may also be used as a test device to prove that the intermodulation product is beinggenerated in the receiver.
Cavity filters can be used, either as rejection filters to f1 and/or f2, or as band-pass filters to the wantedsignal. Again the effectiveness of these filters depends on the frequency spacings involved.
7 Reduction of intermodulation interference by frequency arrangements
The frequencies to be used can be arranged so that no receiver on the product frequency is required tooperate in an area where the unwanted signals may produce an intermodulation product of sufficient levelto disturb the service. If this level is at the maximum sensitivity level of the receiver; it will mean receiverscannot be used for distances up to 2 km from the sites of the base station operating at f1 and f2 stationsare separated by several kilometres and thus implies that the base station on the product channel must besited outside the service area of stations operating on f1 and f2. This leads to very poor use of thefrequency spectrum.
In systems that operate a number of frequency channels, most cases of harmful base transmitter andmobile receiver intermodulation within the system can be alleviated by the choice of even channel sets atthe base stations. This means that the channels of each base station are evenly distributed at a constantfrequency separation. In a service area the intermodulation products within the band used will in that casecoincide with channels of the set, and the ratio of the desired signal to the intermodulation product in amobile receiver is independent of the distance and propagation characteristics.
8 Reduction of intermodulation interference by other arrangements
If continuous tone signalling is used, the receiver will operate only in the presence of this signalling toneand it is then necessary only to ensure that the wanted signal on the product channel exceeds the level ofan unwanted product of f1 and f2 by an amount in excess of the required protection ratio. This can be bestassured by siting the product channel base transmitter at the same, or near to, the site of stationsoperating on f1 and f2. Under these conditions, the need for filters or other devices in the transmitter orreceiver is reduced.

Page 112ETR 053: September 1996
Annex K: Sources of unwanted signals in multiple base station sites in theland mobile service
ITU-R (EX-CCIR) REPORT 1019
(Question 7-2/8)
(1986)
1 Introduction
The greatly increased use of land mobile services has resulted in a dramatic increase in the number ofbase stations on any one site, particularly on those sites strategically placed to serve large built-up areas.This has led to instances of severe interference due to unwanted signals being generated at the site. Thisreport is not intended to examine every possible type of interference but rather to indicate the morecommonly occurring sources. It should be particularly noted that transmitters of other services may beinvolved.
2 Simple frequency relationships
As land mobile frequency bands are used throughout the VHF/UHF spectrum there may be harmonicrelationships between frequencies in the various bands. The equipment cabinet, the power supply cablingand land-line cabling can contribute to the level of these unwanted harmonic signals.
Other interfering signals can be caused by simple mixes either in transmitter output stages or at theantenna mast. As an example, if the signal from a VHF broadcasting transmitter at 93 MHz mixes with asignal of the mobile service at 170,5 MHz, a difference signal of 77,5 MHz can be produced. This cancause a problem if it is a receive frequency of the mobile service.
3 Complex frequency relationships
3.1 Generation of intermediate frequency and/or its derivatives
Interference can be caused in a receiver where signals are received from two transmitters whosefrequencies are separated by an amount equal to the IF, or a submultiple of the IF, of the receiver.
3.2 Generation of transmit/receive (TX/Rx) difference frequency
This problem arises on sites where there are several base stations having "repeater" or "talk-through"facilities, i.e. the transmitters and receivers are in use simultaneously. If the TX/Rx spacing is constant(D), an incoming signal from a mobile station will produce in the base station transmitter output stage adifference frequency, D. Any other base station transmitter may now mix with D to produce its ownreceiver frequency in the same band.
4 Intermodulation products
4.1 Generated external to the site
Under this heading, products arise from stations on adjacent sites, and, in particular, the third orderproduct i.e. 2f1 - f2, which is prevalent in large built-up areas. In some instances significant intermodulationproducts up to and including the seventh order have been noted and in exceptional cases the interferencehas been traced to the nineteenth order.
4.2 Intermodulation products generated on-site by non-linear junctions on the mast
More study is required to verify the mechanism and levels of such interference, which certainly exists inthe land mobile bands. However, at lower radiated powers, the significance of these products is reduced,compared with other forms of non-linearity, e.g. § 4.1 and 4.3.
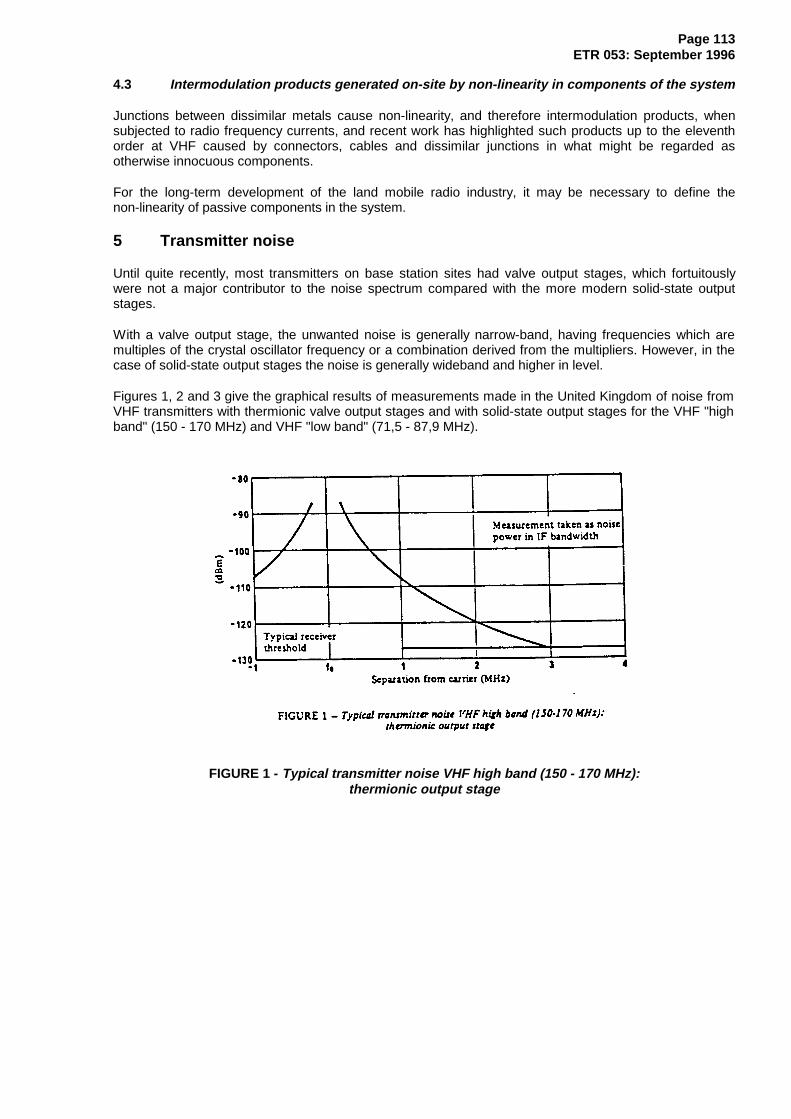
Page 113ETR 053: September 1996
4.3 Intermodulation products generated on-site by non-linearity in components of the system
Junctions between dissimilar metals cause non-linearity, and therefore intermodulation products, whensubjected to radio frequency currents, and recent work has highlighted such products up to the eleventhorder at VHF caused by connectors, cables and dissimilar junctions in what might be regarded asotherwise innocuous components.
For the long-term development of the land mobile radio industry, it may be necessary to define thenon-linearity of passive components in the system.
5 Transmitter noise
Until quite recently, most transmitters on base station sites had valve output stages, which fortuitouslywere not a major contributor to the noise spectrum compared with the more modern solid-state outputstages.
With a valve output stage, the unwanted noise is generally narrow-band, having frequencies which aremultiples of the crystal oscillator frequency or a combination derived from the multipliers. However, in thecase of solid-state output stages the noise is generally wideband and higher in level.
Figures 1, 2 and 3 give the graphical results of measurements made in the United Kingdom of noise fromVHF transmitters with thermionic valve output stages and with solid-state output stages for the VHF "highband" (150 - 170 MHz) and VHF "low band" (71,5 - 87,9 MHz).
FIGURE 1 - Typical transmitter noise VHF high band (150 - 170 MHz):thermionic output stage

Page 114ETR 053: September 1996
FIGURE 2 - Typical transmitter noise VHF high band (150 - 170 MHz):solid-state output stage
FIGURE 3 - Typical transmitter noise VHF low band (71,5 - 87,9 MHz):solid-state output stage
6 External electrical noise
Apart from ignition noise, there are the well-known sources of radio interference, which continue toproliferate, particularly from industrial users, i.e. RF heating, microwave ovens, X-ray and medicalequipment. These normally provide a broad spectrum of noise which tends to vary in frequency.
Screening or suppression of the interfering equipment normally reduces the problem to an acceptablelevel.
There is however, a new family of sources, namely computers and computer peripherals, which arecurrently causing problems with broadband noise over the VHF spectrum.
7 Summary
There are instances where the present engineering practices in multiple transmitter sites have allowed thegeneration of excessive unwanted signals. With the increased use of land mobile radio it is desirable toperfect techniques to reduce interference effects in the future. There is a need for better site engineeringin order to establish "quiet" base station sites for trunking networks and cellular radio.
The following should be considered:
- spurious emissions from transmitters;- filtering of transmitter outputs to reduce spurious emissions and noise at frequencies near the
carrier;- use of directive isolators in transmitter output stages;- additional filtering to provide protection at adjacent frequency bands;- non-linear effects at all points in the system.

Page 115ETR 053: September 1996
Annex L: Intermodulation interference
L.1 Intermodulation spectrum
At the output of a transmitter of frequency B, the level of the interfering signal due to a transmitter onfrequency A will be attenuated by the isolation between the transmitters. In this case the amplitudes of theintermodulation products of the same order will not be equal. (Appendix 3 refers, ITU-R (Ex-CCIR)Report 739-1 [2]).
Figure L.1: Intermodulation spectrum (at the output of transmitter frequency B,interfering signal frequency A)

Page 116ETR 053: September 1996
L.2 Products - combinations of two frequencies A and B excluding pureharmonics
NOTE: Correct for 2 signals only - not drawn to scale
Figure L.2: Intermodulation spectrum for A and B. (Simultaneous inputs of equal amplitude)
Let:
A = fa + ∆f
B = fa - ∆f
where:
fa = A B+
2
f = A B−
2
2nd order products (quantity 2):
- A + B = 2fa;- A - B = 2∆f.
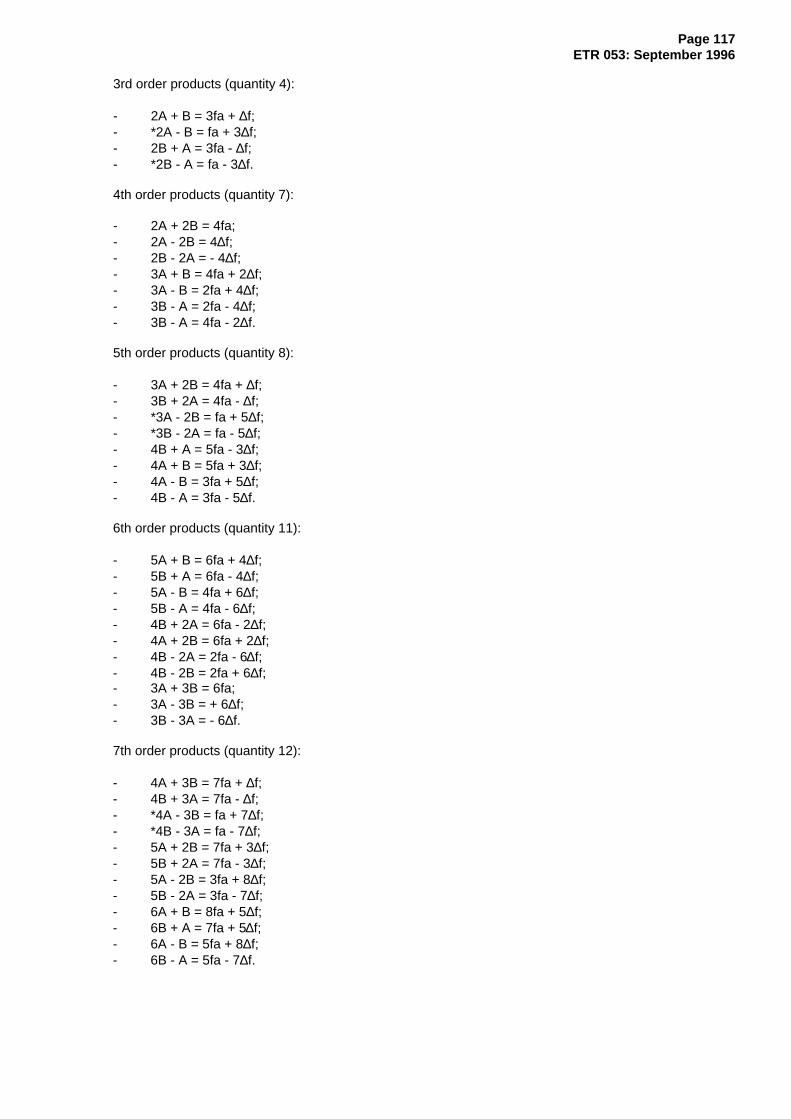
Page 117ETR 053: September 1996
3rd order products (quantity 4):
- 2A + B = 3fa + ∆f;- *2A - B = fa + 3∆f;- 2B + A = 3fa - ∆f;- *2B - A = fa - 3∆f.
4th order products (quantity 7):
- 2A + 2B = 4fa;- 2A - 2B = 4∆f;- 2B - 2A = - 4∆f;- 3A + B = 4fa + 2∆f;- 3A - B = 2fa + 4∆f;- 3B - A = 2fa - 4∆f;- 3B - A = 4fa - 2∆f.
5th order products (quantity 8):
- 3A + 2B = 4fa + ∆f;- 3B + 2A = 4fa - ∆f;- *3A - 2B = fa + 5∆f;- *3B - 2A = fa - 5∆f;- 4B + A = 5fa - 3∆f;- 4A + B = 5fa + 3∆f;- 4A - B = 3fa + 5∆f;- 4B - A = 3fa - 5∆f.
6th order products (quantity 11):
- 5A + B = 6fa + 4∆f;- 5B + A = 6fa - 4∆f;- 5A - B = 4fa + 6∆f;- 5B - A = 4fa - 6∆f;- 4B + 2A = 6fa - 2∆f;- 4A + 2B = 6fa + 2∆f;- 4B - 2A = 2fa - 6∆f;- 4B - 2B = 2fa + 6∆f;- 3A + 3B = 6fa;- 3A - 3B = + 6∆f;- 3B - 3A = - 6∆f.
7th order products (quantity 12):
- 4A + 3B = 7fa + ∆f;- 4B + 3A = 7fa - ∆f;- *4A - 3B = fa + 7∆f;- *4B - 3A = fa - 7∆f;- 5A + 2B = 7fa + 3∆f;- 5B + 2A = 7fa - 3∆f;- 5A - 2B = 3fa + 8∆f;- 5B - 2A = 3fa - 7∆f;- 6A + B = 8fa + 5∆f;- 6B + A = 7fa + 5∆f;- 6A - B = 5fa + 8∆f;- 6B - A = 5fa - 7∆f.

Page 118ETR 053: September 1996
8th order products (quantity 15):
- 5A + 3B = 8fa + 2∆f;- 5B + 3A = 8fa - 2∆f;- 5A - 3B = 2fa + 8∆f;- 5B - 3A = 2fa - 8∆f;- 6A + 2B = 8fa + 4∆f;- 6B + 2A = 8fa - 4∆f;- 6A - 2B = 4fa + 8∆f;- 6B - 2A = 4fa - 8∆f;- 7A + B = 8fa + 6∆f;- 7B + A = 8fa - 6∆f;- 7A - B = 6fa + 8∆f;- 7B - A = 6fa - 8∆f;- 4A + 4B = 8fa;- 4A - 4B = 8fa + 8∆f;- 4B - 4A = 8fa - 8∆f.
9th order products (quantity 16):
- 5A + 4B = 9fa + ∆f;- 5B + 4A = 9fa + ∆f;- *5A - 4B = fa + 9∆f;- *5B - 4A = fa - 9∆f;- 6A + 3B = 9fa + 3∆f;- 6B - 3A = 9fa - 3∆f;- 6A - 3B = 3fa + 9∆f;- 6B - 3A = 3fa - 9∆f;- 7A + 2B = 9fa + 5∆f;- 7B + 2A = 9fa - 5∆f;- 7A - 2B = 5fa + 9∆f;- 7B - 2A = 5fa - 9∆f;- 8A - B = 9fa + 7∆f;- 8B + A = 9fa - 7∆f;- 8A + B = 7fa + 9∆f;- 8B - A = 7fa - 9∆f.
NOTE: * Inband

Page 119ETR 053: September 1996
L.3 Intermodulation products
Intermodulation between frequencies of channels allocated in a bandwidth B Hz will be spread over thespectrum from DC to n times the highest frequency used (where n is the order of the non-linearityproducing the intermodulation). Of particular interest are those products which fall back within and aroundthe band B. This group will extend over a range of n × B Hz, the distribution within this being dependent onthe initial distribution within B. In addition the modulation of the generating carriers will cause eachindividual product to be spread over n times the occupied bandwidth.
For example if the band B were 2 MHz wide from 154 to 156 MHz then 9th order intermodulation productswould extend from 146 to 164 MHz and each product would cover a band of 72 kHz if the occupiedbandwidth is taken as ± 4 kHz.
The number of such products is given in table L.1.
Table L.1: Number of intermodulation products
Non-linearityorder number
numberof channels
3rd 5th 7th 9th
2 2 2 2 23 9 15 21 274 24 64 124 2045 50 200 525 1 0956 90 510 1 770 4 6267 147 1 127

Page 120ETR 053: September 1996
Figure L.3

Page 121ETR 053: September 1996
Annex M: Transmitter noise measurement
M.1 Introduction
As a result of work carried out in the preparation of the radio site engineering report it became veryevident that one of the main sources of interference on radio sites was transmitter noise.
There are many complex equipment on the market which are able to examine spectral pollution, but ingeneral terms there is always the difficulty of carrier power being several orders of magnitude in excess ofthe acceptable level at the input stage of such equipment (typically -20 dBm).
A test method was therefore necessary which could be applied to transmitters in the base stationfrequency range employed on radio sites, and having a dynamic range of test measurements down to thelevel of receiver sensitivities associated with such systems. This means in general terms from +55 dBmdown to -117 dBm (i.e. 172 dBc).
It is also essential that the components of the test system are practical, easy to use, and readily availablein the context of the mobile radio industry. The prime components to enable such a system to workeffectively are a notch reject filter system in the carrier power and a low noise amplifier to feed thedetector system.
The spectrum analyser described in this paper is a well known industry standard and could be replaced bya wide variety of alternatives having similar parameters.
M.2 Measurement system
The layout consists of the equipment under test, followed by a conventional wattmeter suitably calibratedto ensure the accuracy of the experiments.
In order to guarantee a reasonable match to the transmitter under test, an isolating cable comprising inthis case approximately 70 m of RG214AU was used between the wattmeter and the carrier notch rejectassembly.
The reject filters comprise four sections of high Q cavity resonators suitably coupled to the through-line byquarter wave sections. The rejection capability of this filter system was in excess of 80 dB whilst itsinsertion loss was less than 1 dB.
Following on the filter system is a low noise amplifier with a gain of approximately 22 dB, a noise figure of3 dB, and a third order intercept of +42 dBm.
The detector used was a spectrum analyser which was set to 0 dB input attenuation and the bandwidthsetting was selected at 100 kHz. The secondary attenuator, which is for the IF section of the analyser, wasadjusted to bring the trace to a convenient reference level at the top of the screen.
It should be noted that this second adjustment does not affect the RF performance of the spectrumanalyser. A check of the noise figure of the spectrum analyser without the pre-amplifier produced a figureof 29 dB.
At no time was the input level of the spectrum analyser allowed to rise above -20 dBm. The resolutionbandwidth of 100 kHz was chosen for observable convenience.
When setting up the test method, a signal generator was used at an appropriate level to check the precisetuning of the notch filters before the TX was connected. This was in order to ensure that no excessivepower was applied to the detector circuit (-20 dBm).

Page 122ETR 053: September 1996
M.3 Measurement accuracy
The absolute calibration of the system is carried out very simply by substituting an accurate signalgenerator for the TX under test, and calibrating the whole system at each frequency under consideration.
By taking into account the measurement of the notch rejection and by adding the carefully measuredamplifier gain, it was possible to produce a system calibration figure at each frequency.
The absolute accuracy of the spectrum analyser is ±1,50 dB but this can also be overcome by absolutemeasurement from a reference source level, which was done.
For overall system level calculations an absolute standard was available in the form of a power meter withan absolute accuracy ±0,01 dBm.
The absolute level therefore of all these measurements can be clearly stated as being within 1 dB, bearingin mind that the important measurements in these experiments are 100 dB below carrier. It can be easilyseen that the absolute accuracy of the system is well within reasonable limits for the purpose of theexercise.
M.4 Results
It will be seen from the following plots that a wide variety of spectral outputs ware obtained and severaltransmitters were tested, each of different frequency band and manufacture.
The reference level at the top of the screen was in each case referred to a convenient absolute power inorder that the visual dynamic range on the screen could be maximized.
The absolute noise level of the test system was at -107 dBm and this was checked by injecting a-101 dBm signal which was found to be in the correct corresponding position, i.e. 6 dB above the noise.
The test set-up was calibrated before, and after each, measurement in order to ensure that none of thefundamental parameters in the system had changed.
The following graphic results are self-explanatory.
Figure M.1: Transmitter noise measurement - test set-up

Page 123ETR 053: September 1996
Figure M.2: Plot 1/Tx1

Page 124ETR 053: September 1996
Figure M.3: Plot 2/Tx2

Page 125ETR 053: September 1996
Figure M.4: Plot 3/Tx3
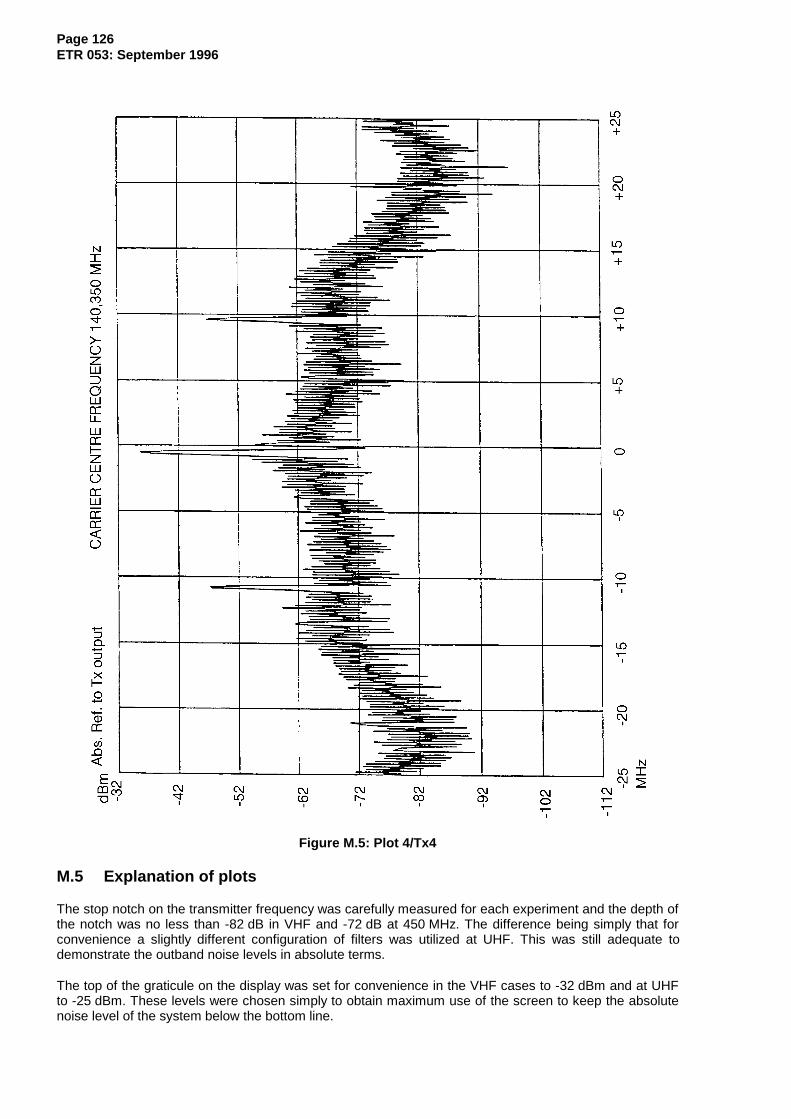
Page 126ETR 053: September 1996
Figure M.5: Plot 4/Tx4
M.5 Explanation of plots
The stop notch on the transmitter frequency was carefully measured for each experiment and the depth ofthe notch was no less than -82 dB in VHF and -72 dB at 450 MHz. The difference being simply that forconvenience a slightly different configuration of filters was utilized at UHF. This was still adequate todemonstrate the outband noise levels in absolute terms.
The top of the graticule on the display was set for convenience in the VHF cases to -32 dBm and at UHFto -25 dBm. These levels were chosen simply to obtain maximum use of the screen to keep the absolutenoise level of the system below the bottom line.

Page 127ETR 053: September 1996
It should be noted that the total dynamic range of the plotting system gives 162 dBc for +55 dBm input andfor the 25 W case, i.e. +43 dBm, the dynamic range of -150 dBc.
M.6 Conclusions
It can be seen from the results that a wide variety of noise levels can be generated from varioustransmitters, but there is conclusive evidence that at frequencies between 1 and 5 MHz away from carrierthe noise levels can be as high as -80 dBc and down to -130 dBc in a 100 kHz bandwidth.
All of these levels are quite large signals in terms of receiver performance, and it becomes extremelyimportant to ensure that when a multiplicity of transmitters are to be located on the same site as theassociated filters that account has been taken of the noise possibilities and the appropriate filters added inthe transmitter outputs.

Page 128ETR 053: September 1996
Annex N: Radiocommunications in confined spaces
N.1 Systems for radiocommunications in confined spaces
In designing a confined space communications system a series of calculations have to be made. Theresults of the calculation will be the confirmation that successful two-way communications will beachieved.
In order to illustrate the calculations required an example of a passive system is given. The example is atunnel 2 km in length with two lengths of radiating cable installed in it. For convenience the radiatingcables are fed at the mid point of the tunnel. Each length of radiating cable is 1 000 m. The base stationequipment is installed at the surface above the tunnel, and the RF signals are connected to the radiatingcable with low-loss feeder cable. A convenient ventilation shaft is used to install the feeder cable. Thegeneral arrangement is shown in figure N.1.
N.1.1 Design consideration
The calculations to be performed are a summation of the gains and losses in the circuit at the frequencyof interest for both the uplink and downlink directions. A separate calculation is performed for eachfrequency band to be used in the system. Generally the highest frequency to be used will dictate the typeof radiating cable to be used. Typical parameters for radiating cables are given in clause N.2.
The calculations are made for the worst possible case that may exist. Typically this is for a portable user,using the highest frequency band, located at the extreme end of the radiating cable, with his transceiverantenna shielded by his body from the cable. In order that a call to this user is successfully initiated theselosses must be initially overcome. Once a call has been established the user may well operate thetransceiver in a position that is more favourable for RF propagation.
The calculations take account of the various factors affecting the transmission path. These may be brokendown into four main areas: base station parameters, cable losses, environmental losses and the mobile orportable parameters.
Tables N.1 and N.2 show the calculated RF power signal levels for the following cases typical of PMRapplications:
VHF Vehicle mounted, 10 W mobile transceiver, four channel system.
UHF Hand held, 1 W portable unit, two channel system.
Downlink refers to the signal path from the base station to the users and uplink to the return path.
Table N.1: Downlink
Frequency 150 MHz VHF 450 MHz UHF UnitBase station output power +40 +40 dBmCombining loss -9,0 -5,5 dBConnecting cable and all connections -0,8 -1,5 dBTunnel splitter loss -3,5 -3,5 dBRadiating cable (1¼ inch diam.) longitudinal loss -10,6 -20 dBRadiating cable median coupling loss (at 2 m) -70 -70 dBCable installation variability -10 -10 dBRadiating efficiency 0 -5 dBSignal level at the receiver input -63,9 -80,5 dBmReceiver threshold -110 -110 dBm
Operating signal margin 46,1 34,5 dB
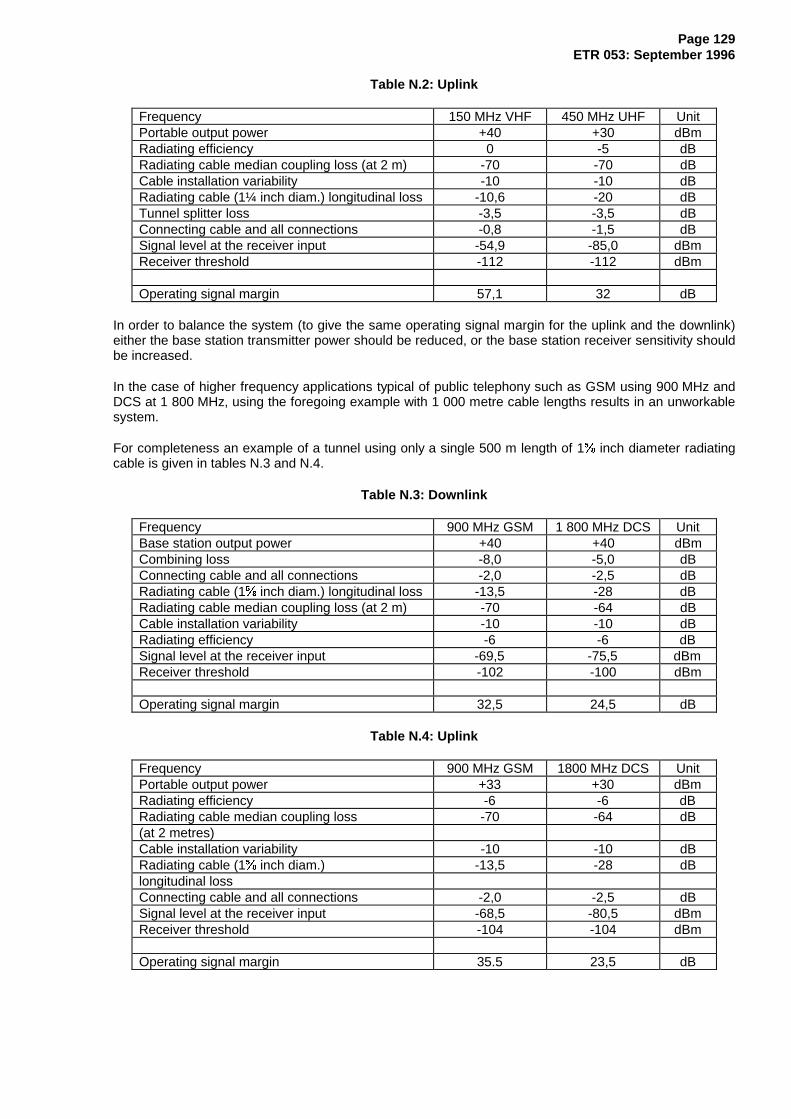
Page 129ETR 053: September 1996
Table N.2: Uplink
Frequency 150 MHz VHF 450 MHz UHF UnitPortable output power +40 +30 dBmRadiating efficiency 0 -5 dBRadiating cable median coupling loss (at 2 m) -70 -70 dBCable installation variability -10 -10 dBRadiating cable (1¼ inch diam.) longitudinal loss -10,6 -20 dBTunnel splitter loss -3,5 -3,5 dBConnecting cable and all connections -0,8 -1,5 dBSignal level at the receiver input -54,9 -85,0 dBmReceiver threshold -112 -112 dBm
Operating signal margin 57,1 32 dB
In order to balance the system (to give the same operating signal margin for the uplink and the downlink)either the base station transmitter power should be reduced, or the base station receiver sensitivity shouldbe increased.
In the case of higher frequency applications typical of public telephony such as GSM using 900 MHz andDCS at 1 800 MHz, using the foregoing example with 1 000 metre cable lengths results in an unworkablesystem.
For completeness an example of a tunnel using only a single 500 m length of 1H inch diameter radiatingcable is given in tables N.3 and N.4.
Table N.3: Downlink
Frequency 900 MHz GSM 1 800 MHz DCS UnitBase station output power +40 +40 dBmCombining loss -8,0 -5,0 dBConnecting cable and all connections -2,0 -2,5 dBRadiating cable (1H inch diam.) longitudinal loss -13,5 -28 dBRadiating cable median coupling loss (at 2 m) -70 -64 dBCable installation variability -10 -10 dBRadiating efficiency -6 -6 dBSignal level at the receiver input -69,5 -75,5 dBmReceiver threshold -102 -100 dBm
Operating signal margin 32,5 24,5 dB
Table N.4: Uplink
Frequency 900 MHz GSM 1800 MHz DCS UnitPortable output power +33 +30 dBmRadiating efficiency -6 -6 dBRadiating cable median coupling loss -70 -64 dB(at 2 metres)Cable installation variability -10 -10 dBRadiating cable (1H inch diam.) -13,5 -28 dBlongitudinal lossConnecting cable and all connections -2,0 -2,5 dBSignal level at the receiver input -68,5 -80,5 dBmReceiver threshold -104 -104 dBm
Operating signal margin 35.5 23,5 dB

Page 130ETR 053: September 1996
It should be noted that a suitable allowance should be made for other, application specific, losses. Forexample a system used for public telephony in an underground railway, should consider the screeningeffects of the railway carriage, and the position in which the radiating cable is mounted relative to thecarriage windows.
The foregoing calculations show that at the highest frequencies, the practical length of cable run is quitesmall when compared to the tunnel lengths that frequently occur.
Figure N.2 shows the arrangement of a typical multi-band RF combiner used to feed a radiating cable in apublic service tunnel. The following services are combined into a single cable:
- FM (Band II) broadcast;- VHF high band PMR;- ERMES paging;- UHF PMR in two sub-bands;- UHF paging;- GSM public mobile telephony;- DCS public mobile telephony.

Page 131
ET
R 053: S
eptember 1996
1
4
3
2
COAXIAL CABLE (LOW LOSS)
POWER DIVIDER
RADIATING CABLE (1,25")
RESISTIVE CABLE TERMINATION
BASE STATION INSTALLATIONINCLUDING MULTICOUPLER
SERVICES BUILDING AT GROUND LEVEL
ACCESS SHAFT
1
23
43
4
50 m
8 mTYPICAL
1 000 m 1 000 m
PORTAL
RADIATING EFFICIENCY
11 mTYPICAL
MEDIANCOUPLING LOSS
TUNNEL
Figure N
.1: Typical confided space R
.F system

Page 132ETR 053: September 1996
Figure N.2: Typical Multi-Band R.F. Combiner Network for use inpublic service tunnels

Page 133ETR 053: September 1996
N.2 Typical characteristics of radiating cable
Radiating cables are manufactured by a number of companies. The figures given in this annex areillustrative only for the more popular size of cable; for specific types of cable for specific purposesreference should be made to the appropriate manufacturer's catalogue.
For general purpose use, most systems require fire retardent cable to be used, so this annex is based ontypical mid range specifications for fire retardent cable.
Table N.5
Cable Type mm (") 13 (½") 22 ( II") 32 (1¼") 41 (1HH")Overall diameter (mm) 15 29 39 48Min. bending radius (mm) 150 350 500 700Weight - kg (m) 0,34 0,77 1,16 1,5Impedance Ω 50 50 50 50Propogation Velocity (%) 88 88 88 88Longitudinal attenuation(dB/100 m) (note 1)
75 MHz 2,1 1,1 0,71 0,6150 MHz 3,1 1,6 1,06 0,88450 MHz 5,6 3,0 2,0 1,7900 MHz 8,3 4,7 3,2 2,7
1800 MHz 23,3 20,8 8,2 5,6Coupling loss (dB) (free space)(note 2)
75 MHz 70 60 66 68150 MHz 70 62 70 73450 MHz 75 65 70 75900 MHz 75 65 68 70
1800 MHz 54 54 62 64NOTE 1: Longitudinal loss: the values are representative for cables mostly working at the
coupling mode. Cables at the radiating mode show an increase of longitudinal lossesabove their cut-off frequency accompanied by a decrease of coupling loss.
NOTE 2: Coupling loss: the values are the median coupling loss (50 %) for cables working in thecoupling mode. The measurement procedure for free space is standardized by IECsub-committee 46A, 1993. The variation of coupling loss from the median (50 %)X dB, is for 95 % cover X+12 dB, and for 5 % cover X-5 dB, where X also has atolerance of ± 10 dB to take account of different antenna orientations andmeasurement uncertainties.
These typical catalogue values are for illustrative purposes only. They are based on the standardizedmeasurement procedure developed in SC IEC 46A, 1993. For a good reproducibility, the cables should bemounted on stand offs approximately 65 mm from the mounting surface. For special applications themanufacturer should be consulted.
N.2.1 Environmental influences
Cable characteristics can be affected seriously by their environment; the amount depends on the cabletype.
Continuously slotted cable is more affected by humidity than cables with large spaces between slots.
Wall standoffs less than half a wavelength lead to an increase of the longitudinal loss; the amountdepends on frequency.
The coupling loss is affected mostly by reflections from surrounding walls. Interference leads to variationsof free space measurement values. For rectangular tunnels variations of ± 5 dB in the cross section haveto be considered. In tunnels of cylindrical shape the conditions can be worse.

Page 134ETR 053: September 1996
N.2.2 Application example
A 78 " cable is required to supply a 500 m tunnel at 900 MHz. Coverage required is 95 %.
System loss = Longitudinal loss + coupling loss
Longitudinal loss: 4,7 dB/100 m × 500 m = 23,5 dB
Coupling loss: 65 dB for 50%
65 dB + 12 dB for 95% = 77,0 dB
System loss: 23,5 + 77 dB = 100,5 dB (± 10 dB)
N.3 Design example for confined space engineering
N.3.1 Design example
A radio system has to supply four services from 150 MHz to 1 800 MHz in a tunnel at a coverage of 95%.The system for each service consists of three cascaded repeaters feeding radiating cables of 1¼"diameter. The system has to be analysed and the maximum trunk lengths of each service band have tobe computed under the same conditions and assumptions.
N.3.2 Conditions
Each repeater is of the same type. The gain compensates the actual cable losses of the appropriate cablesections only. It is assumed that for downlink, the first repeater has a gain of 30 dB.
N.3.3 Design procedure
The design procedure can be demonstrated by the trunk sketch in figure N.3.
The worst cases have been considered where 5 carriers have been transmitted the same time in up- anddownlink. The requirements of maximum third order intermodulation product levels meet the GSMspecifications. The minimum reception level along the cable has to be greater than -95 dBm whilegenerally an additional screening loss of cabin windows is assumed to be 6 dB, location 1. In uplink theworst case is further characterized by locations of minimum coupling loss nearby the input of repeatersoutside trains, location 2.
H eads tation
F eeder s ection 1 F eeder sec tion 2 F eeder s ec tion 3
M ob ile
R epeater 1 R epeater 2
/
B as eS tation
(2) (1 ) (2 ) (1 ) (2 ) (1 )
(1 ) Loc ation of m in im um rec ep tion level: C overage: 95 %
(2) Loc ation of m axim um transm is s ion level: C overage: 5 %
Figure N.3: Sketch of up- and downlink conditions

Page 135ETR 053: September 1996
N.3.4 Conclusions
This example demonstrates that broadband repeater systems are well suited for confined areas applyingradiating cables. Distortions due to noise and intermodulations can be limited to GSM specifications evenin worst case situations. The dynamic ranges are determined by the system losses and the screeningloss. For GSM and DCS 1 800 systems the feature of power control can reduce these ranges in uplinkwithout suppressing the weakest signal.
Table N.6: Summary of computations
Service Rescue Train - Radio GSM DCS1800
General conditions:Minimum reception level (dB/95%) -95 -95 -95 -95Maximum spurious emissions (dBm) -36 -36 -36 -36Number of carriers 5 5 5 5Screening losses (dB) 6 6 6 6Repeater ICP3 (dBm) 50 50 50 50Repeater noise figure (dB) 6 6 6 6Channel bandwidth (kHz) 12,5 12,5 200 200Cable type, diameter (mm) (inch) (1) 32 (1¼) 32 (1¼) 32 (1¼) 32 (1¼)Mobile output level (dBm) 30 30 30 30
Downlink:
Frequency range (MHz) 140 to145
440 to 445 890 to905
1 760 to1 770
Maximum section length (m) 2 254 1 145 778 365Maximum carrier level (dBm) 15 15 15 15Repeater gain (dB) 24 23 25 30Dynamic range (dB) 45 45 47 53Maximum IM level (dBm) -38 -38 -38 -38C/I (dB) 53 53 53 53C/N (dB) (on the cable) 134 133 122 125C/D (dB) 53 53 53 53
Uplink:
Frequency range (MHz) 150 to155
450 to 455 935 to950
1 855 to1 865
Min. repeater output level (dBm) -56 -57 -55 -50Max. repeater output level (dBm) -11 12 -8 3Maximum IM level (dBm) -116 -119 -107 -74C/I (dB) 60 62 52 24C/N (dB) 42 42 30 30C/D (dB) 42 42 30 23,5
Maximum trunk length (m)6 762 3 435 2 334 1 095
NOTE 1: The computations in table N.6 are based on a commercially available cable. Theapplication of other types of the same diameter can lead to different results

Page 136ETR 053: September 1996
Annex P: TETRA parameters
Voice plus data channel multiplexing
PDO uses statistical multiplexing
Modulation rate
Net bit rate
Call set-up time
Call re-establishment
Random access
Digital modulation
Low bit rate codec
Power classes (mobile)
Power classes (base)
Vehicle maximum speed
Cell sizes
TDMA 4 Voice - Data channels per 25 kHz
Fast packet transfer (<100 ms for octets)
36 kbit/s
Up to 19,2 kbit/s
< 300 ms
< 1 s
Slotted aloha
π/4 DQPSK
7,2 kbit/s gross
1, 3 and 10 W
0,6 to 25 W in 9 steps
Up to 200 km/h
Up to 60 km

Page 137ETR 053: September 1996
Annex Q: Typical national analogue cellular telephone networks
Country AMPSUSA
BCATSJapan
C 450Germany,Portugal
ITAL 450Italy
NMT 450Nordic, NL,
Spain, France
NMT 900Nordic
Radiocom2000
France
TACSUK, Ireland
Start ofservice
1979trial 1983
1979 1986 1985 1981 1986 1985 1985
Frequencyband
800 MHz 900 MHz 450 MHz 450 MHz 450 MHz 900 MHz Band III165,2-168,4/169,8-173 MHz414,8-418/424,8-428 MHz
900 MHz
Channelspacing
30 kHz 25 kHz 20 kHz 25 kHz 25 kHz 25 kHz 12,5 kHz 25 kHz
Peak deviation 12 kHz 3,5 kHz 4 kHz 5 kHz 5 kHz 5 kHz 2,5 kHz 9,5 kHzSignalling rate 10 kbit/s 300 bit/s 5,3 kbit/s DTMF
50 ms/character1,2 kbit/s 1,2 kbit/s 1,2 kbit/s 8 kbit/s
Hand-over(nominalbreak)
250 ms 500 ms 300 ms 570 ms 1,25 s 1,25 s 290 ms
Minimaluseable C/I
10 dB 15 dB 15 dB 15 dB 12 dB 10 dB

Page 138ETR 053: September 1996
History
Document history
November 1992 First Edition
September 1996 Second Edition
ISBN 2-7437-0902-2 - Second EditionDépôt légal: Septembre 1996