Embed Size (px)
Citation preview

Release 5.3
ETM® System
Administration and Maintenance Guide
DOC-SA-ETM530-2008-0815

About SecureLogix Corporation
SecureLogix Corporation enables secure, optimized, and efficiently managed enterprise voice networks. The company’s ETM® (Enterprise Telephony Management) System hosts a suite of integrated telecom applications that protect critical network resources from telephony-based attack and abuse, and simplify voice network management.
SecureLogix® Solutions address real-world problems for real-world voice networks. The flexible ETM System scales to support any voice environment, no matter how large or small. Engineered with full hybrid voice technology, the ETM System supports multi-vendor networks containing any mix of converging VoIP and legacy voice systems.
SecureLogix Solutions are currently securing and managing over two million enterprise phone lines. The company’s customers span nearly every industry vertical, from regional banks and hospitals, to the largest military installations and multi-national corporations.
For more information about SecureLogix Corporation and its products and services, visit our website at http://www.securelogix.com.
Corporate Headquarters: SecureLogix Corporation 13750 San Pedro, Suite 230 San Antonio, Texas 78232 Telephone: 210-402-9669 (non-sales) Fax: 210-402-6996 Email: [email protected] Website: http://www.securelogix.com
Customer Support: Telephone: 1-877-SLC-4HELP Email: [email protected] Web Page: http://support.securelogix.com
Training: Telephone: 210-402-9669 Email: [email protected] Web Page: http://training.securelogix.com
Sales: Telephone: 1-800-817-4837 (North America) Email: [email protected]
Documentation: Email: [email protected] Web Page: http://support.securelogix.com

IMPORTANT NOTICE:
This manual, as well as the software and/or Products described in it, is furnished under license with SecureLogix Corporation ("SecureLogix") and may be used only in accordance with the terms of such license.
Except as permitted by such license, no part of this publication may be reproduced, stored in a retrieval system, or transmitted, in any form or by any means, electronic, mechanical, recording, or otherwise, without prior written permission of SecureLogix.
The content of this manual is subject to change without notice. SecureLogix assumes no responsibility or liability for any errors or inaccuracies that may be contained herein or to correct the same.
ETM, SecureLogix, SecureLogix Corporation; and the ETM, Voice Firewall, Usage Manager, Performance Manager, Voice IPS, and Call Recording Emblems; the ETM Application Emblem; and the SecureLogix Diamond Emblem are trademarks or registered trademarks of SecureLogix Corporation in the U.S.A. and other countries. All other trademarks mentioned herein are believed to be trademarks of their respective owners.
© Copyright 1999-2008 SecureLogix Corporation. All Rights Reserved.
Patents No. US 6,249,575 B1, US 6,320,948 B1, US 6,760,421 B2, US 6,687,353 B1, US 6,700,964 B2, US 6,718,024 B1, US 6,735,291 B1, US 6,760,420 B2, US 6,879,671 B2, US 7,133,511 B2, US 7,231,027 B2 and CA 2,354,149. U.S. and Foreign Patents Pending.
ETM is used herein as shorthand notation to refer to the ETM® System.
This product includes:
Data Encryption Standard software developed by Eric Young ([email protected]), © Copyright 1995 Eric Young. All Rights Reserved. (see DESLicense.txt on ETM software CD)
Style Report software owned and licensed exclusively by InetSoft Technology Corp. © Copyright 1996-2000 InetSoft Technology Corp. All Rights Reserved.
Software developed by The Apache Software Foundation (http://www.apache.org/) © Copyright 2000 The Apache Software Foundation. All Rights Reserved. (See ApacheLicense.txt on ETM software CD.)
Linux kernel software developed by Linus Torvalds and others; and Busy Box software developed by Bruce Perens and others. Distributed pursuant to the General Public License (GPL). See the Open Source Code directory on the ETM software CD for related copyrights, licenses, and source code.
GNU C Library software; Distributed pursuant to the Library General Public License (LGPL). See the Open Source Code directory on the ETM software CD for related copyrights, licenses, and source code.
Customer Support for Your ETM® System
1-877-SLC-4HELP (1-877-752-4435)
[email protected] http://support.securelogix.com
SecureLogix Corporation offers telephone, email, and web-based support.
For details on warranty information and support contracts, see our web site at
http://support.securelogix.com

Contents • 5
Contents Preface 11
About the ETM® System Documentation ......................................................................... 11 ETM® System Documentation ............................................................................ 11 Tell Us What You Think .................................................................................... 12 Additional Documentation on the Web .............................................................. 12 Conventions Used in This Guide ........................................................................ 12
User Administration 13 Managing Users ................................................................................................................ 13
User Profiles ....................................................................................................... 13 User Permissions .................................................................................. 14 Creating a User Profile ......................................................................... 16 Changing Security Settings for a User Account ................................... 19 Creating a New User from an Existing User ........................................ 19 Deleting a User ..................................................................................... 20 Resetting a User's Forgotten Password ................................................. 20 Changing the Password for an ETM® System Account........................ 20 Changing a User's Permissions ............................................................. 21 Creating a User for Anonymous Web Portal Login ............................. 21
User Password Security ...................................................................................... 22 Setting the User Password Policy ......................................................... 22
Monitoring User Logins...................................................................................... 24 Viewing Logged-in Users ..................................................................... 24 Disconnecting a User Login ................................................................. 24
ETM® Server Administration 25 Administering the ETM® Server ....................................................................................... 25
Shutting Down a Management Server ................................................................ 25 System Events ..................................................................................................... 26
Setting Track Actions for System Events ............................................. 26 Filtering System Event Tracks ............................................................. 28 Defining System Event Track Filters ................................................... 29 Removing a Track from a System Event .............................................. 31
Login Banner ...................................................................................................... 31 Defining a Login Banner ...................................................................... 31
ETM® Server Properties Tool ............................................................................. 32 Setting Properties in the ETM® Server Properties Tool ....................... 32 Properties in the Tool ........................................................................... 34 Changing User-Defined Directory Listing Field Labels ....................... 39

6 • Contents
Discarding Duplicates in a Directory Import File ................................ 40 Billing Rate Decimal Precision ............................................................ 40 Active-to-Historical Data Transfer Properties ...................................... 40 IPS Detection Engine Polling Interval .................................................. 42 IPS Rule Complete Delay ..................................................................... 42 Number of Reconciliations to Report ................................................... 43 Access Code Import and Distribution Settings ..................................... 43 Failed Login Properties ........................................................................ 44 Span Tool Tip Property ........................................................................ 44 Enabling Anonymous Web Portal Login .............................................. 45 Scheduled Report Retry Settings .......................................................... 46
SMDR Configuration .......................................................................................... 46 SMDR Correlation Settings .................................................................. 47 Setting Track Actions to Refire After SMDR Update .......................... 48 Enabling a Separate SMDR Debug Log per Switch ............................. 49 Ambiguous SMDR Resolution ............................................................. 50
Data Management Tool ...................................................................................... 51 Importing City/State Data ..................................................................... 51 Specifying the Oracle Client Tools Location ....................................... 52
Authorizing Client Connections ......................................................................... 53 Authorizing Cards to Connect to the Management Server ................................. 55 Specifying an Email Server ................................................................................ 56 SNMP ................................................................................................................. 57
The SecureLogix MIB .......................................................................... 58 Rule Fired Traps ................................................................................... 58 Diagnostic Traps ................................................................................... 59 Specifying an SNMP Network Manager .............................................. 60
Report Server Connection Information ............................................................... 61 Viewing and Modifying Report Server Connection Information ......... 61
Log Management ................................................................................................ 62 Enabling SMDR Debug Logging ......................................................... 63 Viewing Current Log Storage............................................................... 64 Enabling Automatic Purging of Logs ................................................... 64
Managing ETM® Server Files from the ETM® Client ........................................ 66 Opening the ETM® Server File Management Tool ............................... 66 Accessing an ETM® Server File from the ETM® Client ...................... 69 Editing an ETM® Server File from the ETM® Client ........................... 70 Copying a File to the ETM® Server from the ETM® Client ................. 70
Standby Mode ..................................................................................................... 71 Fatal Oracle Errors (No Standby Mode) ............................................... 72
Encrypting Values in the twms.properties File ................................................... 73 Encrypting the Passphrases .................................................................. 73 Encryption Hash Key ........................................................................... 74 Modifying an Encrypted Passphrase .................................................... 74
ETM® Database Administration 75 Managing Database Scheduled Tasks ............................................................................... 75
Opening the ETM® Database Maintenance Tool ................................................ 75

Contents • 7
Logging in to the ETM® Database via the ETM® Database Maintenance Tool ................................................................................. 76 Disconnecting from a Database ............................................................ 76
Scheduled Tasks ................................................................................................. 77 Viewing All Tasks for a Database ........................................................ 77 Viewing Tasks for a Specific Instance ................................................. 78 Editing a Scheduled Task ..................................................................... 79 Starting a Scheduled Task Manually .................................................... 80
ETM® Platform Administration 81 Administering the ETM® Platform ................................................................................... 81
Server Authority Over Appliance Configuration ................................................ 81 Viewing Health and Status ................................................................................. 82
Viewing Card-Level Health and Status ................................................ 82 Viewing Span-Level Health and Status ................................................ 83
Codecs ................................................................................................................ 86 Codec Definitions ................................................................................. 86 Viewing a List of Codecs ..................................................................... 86 Viewing or Editing a Codec ................................................................. 87 Setting Excessive Media Rate Limits for a Codec ............................... 88 Setting Call Quality Alert Limits for a Codec ...................................... 89 Creating a Codec Definition ................................................................. 89 Deleting a Codec .................................................................................. 91 Searching for Codecs ............................................................................ 91
Dialing Plans ....................................................................................................... 92 Downloading a Dialing Plan to a Span ................................................. 92
Span Configuration Settings ............................................................................................. 93 Configuring Digital Spans to Restart Offline ..................................................... 93 Placing Offline Digital Spans Inline ................................................................... 94 Viewing a Span's MAC Address ........................................................................ 95 Renaming a Span ................................................................................................ 95 Span Comment/Tool Tip .................................................................................... 96
Adding a Span Comment/Tool Tip ...................................................... 96 Disabling the Span Tool Tip ................................................................. 96
Span Heartbeat Interval Setting .......................................................................... 97 Appliance Debug Event Logging........................................................................ 98 Call Termination Setting ..................................................................................... 99 DTMF Digit Detection...................................................................................... 100 STU Detection Setting ...................................................................................... 101 Ambiguous Call Processing Setting.................................................................. 101 Span Country Code Setting ............................................................................... 102 Local Area/City Code for a Span ...................................................................... 103 Call Type Timeout Setting ................................................................................ 103 SMDR Timeout Setting .................................................................................... 104 Call Established Timeout Setting...................................................................... 105 Loopback Test Pass-Through Mode Setting ..................................................... 105
Loopback Test Pass-Through Mode Limitations ................................ 106 Viewing Loopback Pass-Through Status ............................................ 106 Loopback Test Pass-Through Mode GUI Setting ............................... 109
8 • Contents
Loopback Setting via ETM Command ............................................... 110 Layer 2 Crossover ............................................................................................. 110 Changing the Telco Delay ................................................................................ 110 Extension Masking/Call Redirection ................................................................ 111
Defining an Extension Masking Plan ................................................. 112 Applying Masking or Redirection to a Span ...................................... 116
Proxy/ Gatekeeper Information for a VoIP Span .............................................. 117 Defining a Proxy or Gatekeeper ......................................................... 118 Deleting a Proxy or Gatekeeper .......................................................... 119 Editing a Proxy or Gatekeeper ............................................................ 119 Reordering the Proxies or Gatekeepers List ....................................... 120
Limiting VoIP Call Resources .......................................................................... 120 Maximum Signaling Rate Setting for VoIP Spans ........................................... 120 Packet Policy for VoIP Spans ........................................................................... 121 Configuring Routes or Interfaces for NAT Mode ............................................. 122 Removing an Unused TDM Span in the ETM® 1090 Appliance ..................... 123 Ping Tool .......................................................................................................... 123 Traceroute Tool ................................................................................................ 125 Signaling Dump Tool ....................................................................................... 127 Removing a Span from the Tree Pane .............................................................. 128
Command-Line Interface in the GUI .............................................................................. 129 How to Access the ASCII Management Interface ............................................ 129 Terminating Calls via the ASCII Management Interface ................................. 130
Appliances....................................................................................................................... 131 Creating an Appliance ...................................................................................... 131 Moving Cards to an Appliance ......................................................................... 132 Renaming an Appliance .................................................................................... 132 Deleting an Appliance ...................................................................................... 133
Switches .......................................................................................................................... 134 Viewing Switch Configuration ......................................................................... 134 Associating an Access Code Set with a Switch ................................................ 135 Removing an Access Code Set from a Switch .................................................. 136 Moving a Span to a Switch ............................................................................... 137 Deleting a Switch .............................................................................................. 137 Renaming a Switch ........................................................................................... 138 Selecting a New SMDR Parse File ................................................................... 138 Renaming an NFAS Group ............................................................................... 139 Deleting an NFAS Group ................................................................................. 139 Moving an NFAS Group to a Different Switch ................................................ 140 Moving a Span to an NFAS Group ................................................................... 141 Moving a Span to an SS7 Group....................................................................... 142 Moving an SS7 Group to a Different Switch .................................................... 142 Deleting an SS7 Group ..................................................................................... 143
Card Settings ................................................................................................................... 144 Renaming a Card .............................................................................................. 144 Changing a Card’s IP Address and Subnet ....................................................... 144 Licensing Additional Spans on a Card .............................................................. 145
Viewing the Number of Licensed Spans on a Card ............................ 146 Changing the DES Key for Card/Server Communication ................................ 147 Downloading New Software to a Card ............................................................. 148

Contents • 9
Moving a Card to a Different Management Server ........................................... 149 Changing the Enable Password ......................................................................... 150 Changing the Card Security Level .................................................................... 151 Disconnecting a Card from the Management Server ........................................ 152 Removing a Card from the Tree Pane ............................................................... 152
Managing Telnet Logins ................................................................................................. 153 Authorizing Telnet Clients ................................................................................ 153 Telnet Login to Spans ....................................................................................... 155
Failed Telnet Logins Shut Down Telnet Server ................................. 155 Viewing Telnet Server Status ............................................................. 156 Viewing Time Offset .......................................................................... 156 Restarting the Telnet Server ............................................................... 156
Using Last Resort Card Recovery ................................................................................... 157 About Last Resort ............................................................................................. 157 Using Last Resort ............................................................................................. 157
Recovering a Card Using Last Resort ................................................ 158 Using Fail Safe when Last Resort is Installed .................................................. 160
Uninstalling, Modifying, or Repairing the ETM® Applications 161 How to Uninstall, Modify, or Repair the ETM® Applications ........................................ 161
Administering the Applications on Windows ................................................... 161 Administering the Applications on Solaris ....................................................... 162
Viewing the Installation Packages ...................................................... 162 Removing the Applications ................................................................ 163
Appendix: System Event Descriptions 165 About System Events ...................................................................................................... 165
Types of System Events .................................................................................... 165 Error Events ........................................................................................ 165 Panic Events ....................................................................................... 166 Policy Events ...................................................................................... 166 Security Events ................................................................................... 166 Start/Stop Events ................................................................................ 168 Telco Events ....................................................................................... 169 VoIP Events ........................................................................................ 170 Warning Events .................................................................................. 170
Index 173

10 • Contents

Preface • 11
Preface
About the ETM® System Documentation The complete documentation for the ETM® System consists of a set of user guides in PDF format and in-depth, context-sensitive online Help. Printed copies of the user guides can be ordered separately. The electronic PDFs are available from the SecureLogix directory on the Start menu (Windows systems), the Documentation folder in the ETM System installation directory (all systems), and the root of the ETM Software installation CD.
The following set of guides is provided with your ETM® System:
ETM® System User Guide—Explains ETM System Concepts and provides task-oriented instructions for using the ETM System, including a Quick Start.
ETM® System Installation Guide—Provides task-oriented installation and configuration instructions and explanations for technicians performing system setup.
Voice Firewall User Guide—Provides an overview of the Voice Firewall, examples of and instructions for creating and managing Firewall Policies, and instructions for viewing results of Policy monitoring and enforcement.
Voice IPS User Guide—Provides an overview of the Voice IPS (Intrusion Prevention System), examples of and instructions for creating and managing IPS Policies, and instructions for viewing results of Policy monitoring and enforcement.
ETM® Call Recorder User Guide—Provides an overview of the Call Recorder system, instructions for installing, configuring and using the system, examples of and instructions for creating and managing Call Recorder Policies, and instructions for accessing and managing the recordings.
Usage Manager User Guide—Provides task-oriented instructions and tutorials for producing reports of telecommunications accounting and Policy enforcement. Includes an appendix describing each of the predefined Reports and Elements.
ETM® System Administration and Maintenance Guide—Provides task-oriented instructions for using the ETM System to monitor telco status and manage ETM System Appliances.
ETM® System Documentation

12 • Preface
ETM® System Technical Reference—Provides technical information and explanations for system administrators.
ETM® Database Schema—Outlines the schema of the SecureLogix database, to facilitate use of third-party reporting tools.
ETM® Safety and Regulatory Compliance Information—Provides statements regarding safety warnings and cautions; includes statements required for compliance with applicable regulatory and certification authorities. (Provided as a package insert with new Appliance hardware.)
We welcome your suggestions or comments on the user guides and the online Help provided with your ETM® System. Please send your documentation feedback to the following email address:
SecureLogix Corporation provides corrections and additional documentation for its products via the SecureLogix Knowledge Base online at the following web address:
http://support.securelogix.com
The following conventions are used in this guide:
• Functions that require two or more mouse clicks to open a dialog box or make a selection are written using the pipe symbol. For example:
Click View | Implied Rules.
• Names of keys on the keyboard are uppercase. For example:
Highlight the field and press DELETE.
• If two or more keys must be pressed at the same time, the PLUS SIGN (+) is used as follows:
Press CTRL+ALT+DELETE.
• Bold text indicates GUI labels, menu items and options, literal file names, and paths. For example:
Click Edit, and then click Preferences.
C:\Program Files\SecureLogix\ETM\TWLicense.txt
• Keyboard input is indicated by monospaced font. For example:
In the Name box, type: My report tutorial
• Italics indicate web addresses and names of publications.
• ETM System components and features are capitalized.
Tell Us What You Think
Additional Documentation on the Web
Conventions Used in This Guide

User Administration • 13
User Administration
Managing Users User accounts are specific to the Management Server on which they are defined. This section explains how to:
• Create user profiles for a Management Server and the Appliances it controls.
• Change a user's password or permissions.
• Define a security policy for user accounts.
• Monitor user logins to a Management Server and the Appliances it controls.
Note that you must have Manage Users permission to perform any of the procedures in this section other than changing your own password.
A user profile:
• Specifies the login username and password that authorize a user to log in to a Management Server.
• Define the permissions granted to the user.
The default admin account provides all permissions, allowing complete control of all aspects of the system. You can modify or delete the default admin account, but you must have at least one user account with Manage Users permission.
When users log in, they see only the client tools for which they have permission. For client tools with subpermissions, application features for which the user does not have permission are grayed out or hidden when that user is logged in.
For information about AAA users, see "Managing AAA Service Users" in the Voice Firewall User Guide.
User Profiles

14 • User Administration
The following user permissions govern access to the ETM System:
• Manage Users—Create/edit user profiles. Usernames of users with permission to edit other users appear in red in the Users box. Users who do not have permission to edit other users do not see the list of other users; only their own information is visible to them, but is grayed out. Note that users do not need Manage Users permission to change their own passwords; this is governed by the user password security policy. See "User Password Security" on page 22 for details.
• Manage Server—Modify all settings in the Server Administration Tool.
• View Access Codes—View Access Codes in Reports and onscreen. For users who do not have this permission, the Access Code appears as a series of asterisks in Reports, and the SMDR Access Code column is unavailable in Logs. Note that this permission is automatically selected if Manage Access Code Sets is selected.
• Access Directory Manager—Open the Directory Manager and view its contents.
– Manage Directory Entities—Add, edit, delete, and import Directory content.
Manage Access Code Sets—View, edit, and distribute Access Code Sets.
• Access Usage Manager—Open the Usage Manager and view its contents; run and schedule reports; define new templates, elements, and relative date ranges.
– Administer Scheduled Reports—Manage all other users' scheduled reports. Users without this permission who have Access Usage Manager permission can create and manage their own scheduled reports, but cannot see or control those of other users.
• Access Performance Manager—Open the Performance Manager.
– Log in to Card/Span via Telnet/Serial—Connect to Cards and Spans via Telnet or the Console port using this username and password. Only users with this permission are able to directly access the Cards and Spans. When you define or modify and save a user profile with Log in to Card/Span via Telnet/Serial permission, it is also downloaded to each of the Cards and Spans owned by that Management Server.
– Access Policy Features—Define and manage Span Groups and other items used in ETM System Policies (Contacts, Times, Tracks, Durations, Service Types, Billing Plans, Intervals).
User Permissions

User Administration • 15
View & Reinstall Firewall Policies—See the Firewall Policies subtree in the Performance Manager, view any Firewall Policy, and reinstall Firewall Policies that are already installed (for example, when Listings used in the Policy change).
Full Control—Create, edit, delete, uninstall, or install any Firewall Policy.
View & Reinstall IPS Policies—See the IPS Policies subtree in the Performance Manager, view any IPS Policy, and reinstall IPS Policies that are already installed (for example, when Listings used in the Policy change).
Full Control—Create, edit, delete, uninstall, or install any IPS Policy.
View & Reinstall Recording Policies—See the Recording Policies subtree in the Performance Manager; view any Recording Policy, and reinstall Recording Policies that are already installed (for example, when Listings used in the Policy change).
Full Control—Create, edit, delete, uninstall, or install any Recording Policy.
– Manage Telecommunications Configuration—View and change configuration of all items in the Platform Configuration and Telco Configuration subtrees (Appliances, Cards, Spans, NFAS Groups, SS7 Groups, Switches); authorize Card IP addresses; manage Codecs and Extension Masking Plans.
– Terminate Calls—Terminate calls via the Call Monitor or ASCII Management Interface.

16 • User Administration
To create a user profile
1. On the ETM System Console main menu, click Servers | User Administration. The User Administration Tool appears.
2. Click Add. The Add New User dialog appears.
3. In the Username box, type the string of characters the user will type
as the login username. A username can be a maximum of 25 characters, and can include any combination of letters, numbers, spaces, and the following special characters: ! @ . & ( ) + = '
Creating a User Profile

User Administration • 17
4. In the Password box, type the string of characters the user will type as the login password. A password can consist of any combination of letters, digits, spaces, and special characters except the | ("pipe") symbol. It must be a minimum of eight characters and include at least one change of case and one digit.
5. In the Confirm New Password box, type the same password again.
6. Click OK. The new username appears in the list of users in the User Administration Tool and is selected.
7. On the Personal Info tab, type identifying information for this user. In particular, the email address you type here is automatically supplied in some Usage Manager Report activities.
8. Click the Permission Info tab, and then select the permissions for this user. Refer to "User Permissions" on page 14 for a description of each of the available permissions.
See "User Password Security" on page 22 for instructions regarding the user password security policy.

18 • User Administration
9. (Optional) Click the Security Info tab, and then select any of the following options that you want to apply to this account:
• User must change password at next logon—The next time
this user attempts to log into the system, a Change Password dialog box is presented in which the user must change the password before being allowed to log in.
• User cannot change password—This user cannot change the password. By default, users can change their own passwords, regardless of their other assigned permissions.
• Password never expires—This user account password never expires, regardless of the setting in the global user password security policy defined for this Management Server in the Server Administration Tool.
• Account disabled—Prevents login to the system from this account. Note that this setting prevents future logins from this account, but does not terminate an active login. See "Monitoring User Logins" on page 24 for instructions for viewing current logins and disconnecting current logins.
User Administration • 19
To change user account security settings
1. On the ETM System Console main menu, click Servers | User Administration. The User Administration Tool appears.
2. In the Users list, click the username for which you want to change account security settings.
3. (Optional) Click the Security Info tab, and then select any of the following options that you want to apply to this account:
• User must change password at next logon—The next time this user attempts to log into the system, a Change Password dialog box is presented in which the user must change the password before being allowed to login.
• User cannot change password—This user cannot change the password. By default, users can change their own passwords, regardless of their other assigned permissions.
• Password never expires—This user account's password will not expire, regardless of the setting in the global user password security policy defined for this Management Server in the Server Administration Tool.
• Account Disabled—Prevents login to the system from this account. Note that this setting prevents future logins from this account, but does not terminate an active login. See "Monitoring User Logins" on page 24 for instructions for viewing current logins and disconnecting current logins.
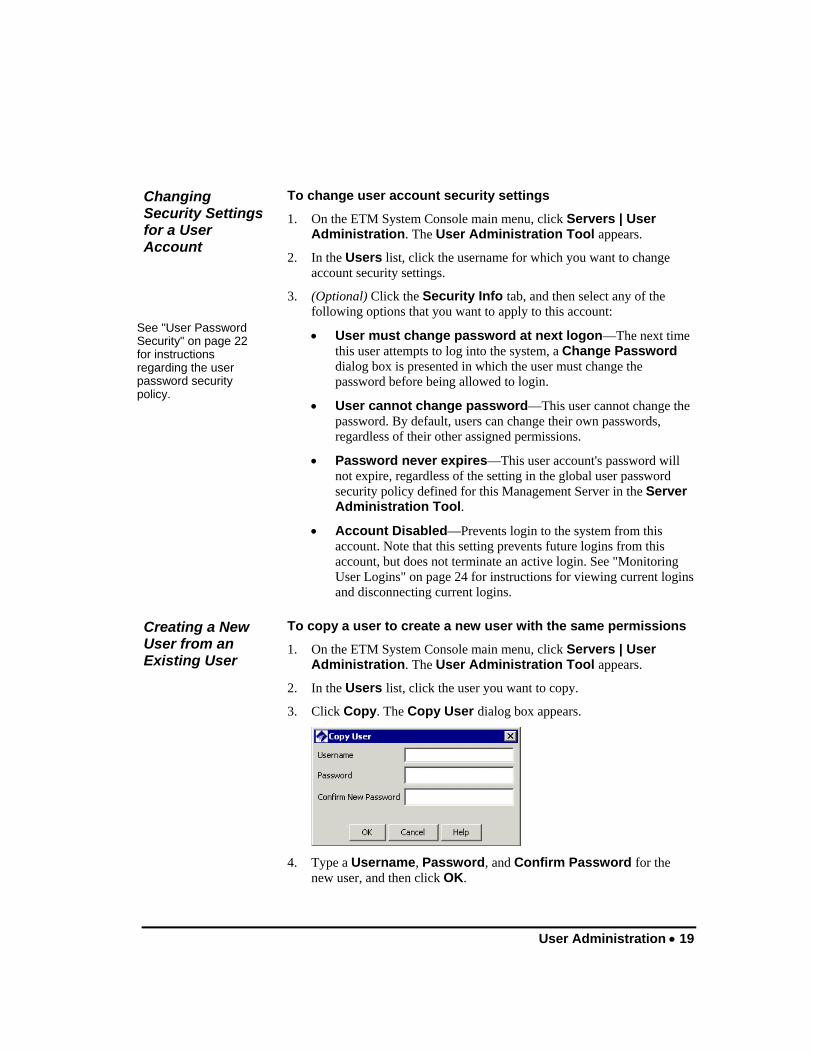
To copy a user to create a new user with the same permissions
1. On the ETM System Console main menu, click Servers | User Administration. The User Administration Tool appears.
2. In the Users list, click the user you want to copy.
3. Click Copy. The Copy User dialog box appears.
4. Type a Username, Password, and Confirm Password for the
new user, and then click OK.
Changing Security Settings for a User Account
See "User Password Security" on page 22 for instructions regarding the user password security policy.
Creating a New User from an Existing User
20 • User Administration
5. Click the Personal Info tab of the User Administration Tool, and then type identifying information for the new user. In particular, the email address you type here is automatically supplied in some Usage Manager Report activities.
6. Click the Permission Info tab and verify that the permissions are as you intend.
7. Click Save to save the new user.
When you delete a user account, the user's Usage Manager <user> folder and its contents are deleted, as are any scheduled report tasks the user scheduled.
To delete a user
1. On the ETM System Console main menu, click Servers | User Administration. The User Administration Tool appears.
2. In the Users list, click the user you want to delete.
3. Click Delete.
4. A confirmation message appears. Click Yes.
Use this procedure when you need to reset a user's forgotten password.
You do not need to know the user's current password to reset the password, but you must have Manage Users permission.
To change a user's password
1. On the ETM System Console main menu, click Servers | User Administration. The User Administration Tool appears.
2. In the Users list, click the user whose password you want to change, and then click the Password Info tab.
3. In the Your Current Password box, type the password that you used to log in to the Management Server.
4. Type the new password in both the New Password and Confirm Password boxes, and then click Save.
You do not need Manage Users permission to change your own password. All users can change their own passwords unless the ETM System administrator has specifically disabled that ability on your account. For information about disabling a user's ability to change his or her password, see "Changing Security Settings for a User Account" on page 19.
To reset another user's password, you do not need to know a user's current password, but you must have Manage Users permission.
Deleting a User
Resetting a User's Forgotten Password
Changing the Password for an ETM® System Account

User Administration • 21
To change a user's password
1. On the ETM System Console main menu, click Servers | User Administration. The User Administration Tool appears.
2. In the Users list, click the user whose password you want to change, and then click the Password Info tab.
3. In the Your Current Password box, type the password that you used to log in to the Management Server.
4. Type the new password in both the New Password and Confirm Password boxes, and then click Save.
To change a user's permissions
1. On the ETM System Console main menu, click Servers | User Administration. The User Administration Tool appears.
2. In the Users list, click the user whose permissions you want to change, and then click the Permissions tab.
3. Select the check boxes for permissions you want to authorize for this user; clear the check boxes for permissions you do not want this user to have. See "User Permissions" on page 14 for a description of each of the available permissions.
4. Click Save.
To enable anonymous Web Portal login, you define a user account to be used for anonymous logins. You then supply the username associated with that account as the value for the WebETMAnonymousUsername property in the ETM Server Properties Tool. If no username is supplied, anonymous login is disabled.
To create a Web Portal anonymous login account
1. Define a user account as usual and then see the next step for information about how permissions affect Web Portal access.
2. The Web Portal provides access to reporting features and recorded calls based on the user permissions granted to the account.
• To provide access to call recordings, select the View and Reinstall Recording Policies check box.
• To provide access to reporting features, select Access Usage Manager.
You must provide at least one of these permissions to allow access via the Web Portal, but you can provide both.
Changing a User's Permissions
Tip: You cannot change the permissions for the account from which you are currently logged in, regardless of your user permissions.
Creating a User for Anonymous Web Portal Login

22 • User Administration
If only Call Recorder permission is provided, the screen for that feature appears automatically when you access the Web Portal. If Access Usage Manager or both permissions are provided, the Main page appears when you access the Web Portal. You then select the option you want to access.
See “Enabling Anonymous Web Portal Login” on page 45 for instructions for supplying the username in the ETM Server Properties Tool.
The user password security policy determines:
• Whether user account passwords expire, and if so, how often. By default, ETM® System passwords do not expire.
• If passwords are set to expire, whether a warning is presented in advance, and if so, how far in advance.
• Whether new passwords are checked for uniqueness against previous passwords, and if so, with how many they are compared.
By default, the user password policy applies to all user accounts on a Management Server; however, you can prevent the passwords on specific accounts from expiring. See "Changing Security Settings for a User Account" on page 19 for more information.
To set the user password policy
1. On the ETM System Console main menu, click Servers | Server Management. The Server Administration Tool appears.
2. Click the User Password Policy tab.
User Password Security
Setting the User Password Policy

User Administration • 23
3. In the Maximum password age area, select one of the following:
• Passwords never expire—Users are never required to change their passwords.
• Passwords expire after n days—All users whose accounts are not specifically exempted from the user password expiration policy must change their passwords at the specified interval. If you select this option, type or select the number of days, from 1 to 999.
4. If you selected Passwords expire after n days, in the Password expiration warning area, select one of the following options:
• Do not warn prior to expiration—Users are not warned prior to password expiration; they are simply presented with a prompt when the password expires.
• Warn starting n days prior to expiration—Type or select the number of days prior to expiration that users are to be warned that their password will expire in a certain number of days.
5. In the Password Uniqueness area, select one of the following options:
• Do not check for uniqueness—Any valid password is accepted, regardless of whether this user has used it before or how long ago it was used.
• Compare with last n passwords—Type or select the number of previous passwords with which to compare the new password for uniqueness. For example, if you type 5, users cannot reuse any of their last five passwords.

24 • User Administration
You can view information about each user logged in to the Management Server, including the username, client host computer, and start date/time of the login. You can also disconnect a login.
To monitor user logins
1. On the ETM System Console main menu, click Servers | Server Management. The Server Administration Tool appears.
2. Click the Users tab.
• Account shows the username of the logged-in user.
• Host shows the hostname and IP address of the client tool from which the user logged in.
• Start Date shows the date and time at which the user logged in.
• Web indicates whether the user is logged in via the ETM System Web Portal.
To disconnect a user login
1. On the ETM® System Console main menu, click Servers | Server Management. The Server Administration Tool appears.
2. Click the Users tab. A list of all of the logged in users appears.
3. Click the user you want to disconnect, and then click Disconnect.
Monitoring User Logins
Viewing Logged-in Users
Disconnecting a User Login

ETM® Server Administration • 25
ETM® Server Administration
Administering the ETM® Server Management Server administration includes the following tasks:
• Shutting down the Management Server from the ETM® System Console.
• Setting Track actions for system events.
• Defining a login banner that appears upon login to the Management Server.
• Authorizing remote Client Tool connections.
• Specifying an email server for Email Tracks.
• Associating the Management Server with its Report Server.
• Managing storage of call, error, diagnostic, IPS, and debug logs.
• Specifying one or more SNMP managers for SNMP traps.
• Changing Server Database properties.
To stop the Management Server from the ETM System Console, you must have Manage Server permission. (The admin account has this permission by default.) Note that you cannot remotely start the Management Server; you must have physical access to the Server computer to start the Server.
To stop the Management Server
1. In the ETM System Console, click the Server you want to stop.
2. Click Servers | Shutdown Server.
3. A confirmation message appears. Click Yes.
Shutting Down a Management Server

26 • ETM® Server Administration
ETM System operation can generate a variety of system events that indicate such things as telecom or system configuration changes or errors, and potential security violations. System events are managed per ETM Server and appear in the Diagnostic Log for that ETM Server.
You can track specific types of System Events by assigning one or more Tracks to cause follow-up actions, such as email notification or Real-Time Alert, that result each time that type of System Event occurs. You can also apply filters to applied System Event Tracks to limit when they are triggered. For example, if one person is in charge of the telco equipment at Switch A and a different person is in charge of the telco equipment at Switch B, you can add a filter to applied Email Tracks so that the responsible parties receive telco event notifications only for the Switch for which they are responsible. For a description of each type of system event to which you can assign a track, see "Types of System Events" on page 165.
Note that not all available types of Tracks are appropriate for all types of events. For example, a Real-Time Alert for Standby Mode is not effective, since Real-Time Alerts are sent only to connected clients, and all clients lose connection when the Server enters Standby Mode.
To set a Track action for a system event
1. On the ETM System Console main menu, click Servers | Server Management. The Server Administration dialog box appears.
2. Click the System Events tab.
System Events
Setting Track Actions for System Events
For a description of each type of system event, see "Types of System Events" on page 165.
Multiple tracks can be assigned to an event.

ETM® Server Administration • 27
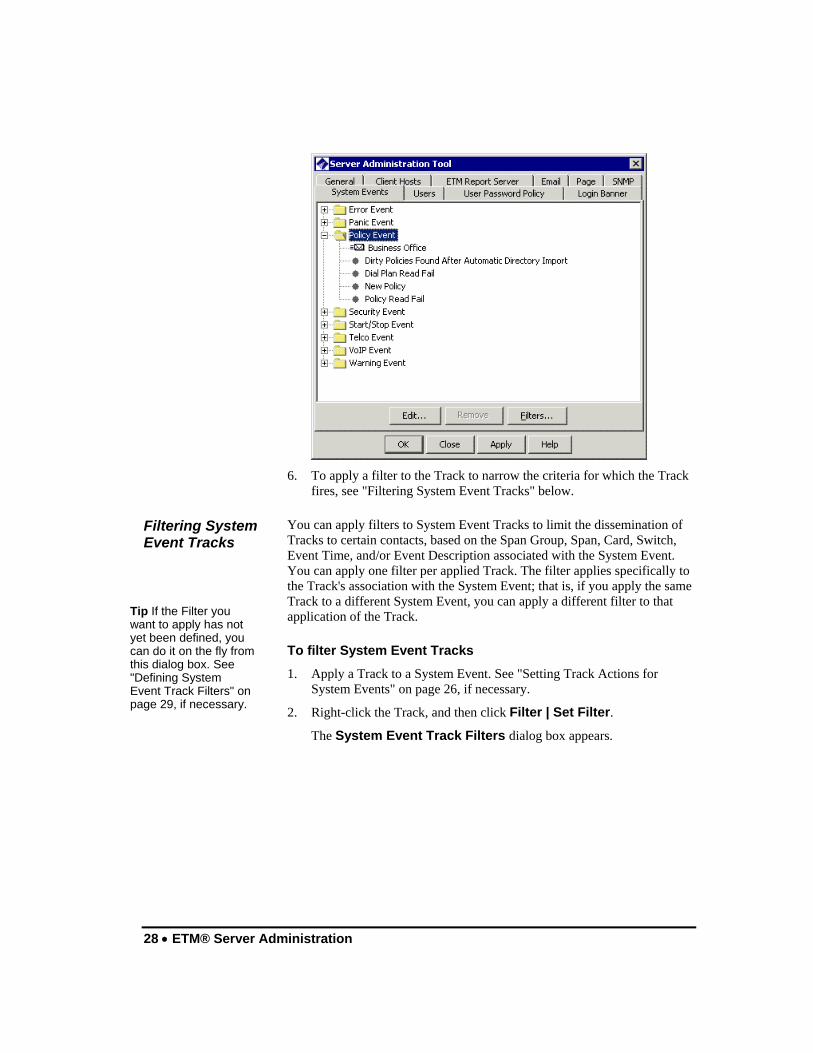
3. Click the event type or subtype you want to track, and then click Edit.
• To apply the Track only to a subcategory or to a single event within a category, click the PLUS SIGN next to the category node to expand the tree and view the subcategories. If you add a Track to the top-level event, the Track applies to all of the subcategories of that event.
The System Event Tracks dialog box appears.
4. In the Not in group box, click one or more Tracks that you want to
assign to the selected system event, and then click Add. The selected Track(s) move(s) to the In group box.
5. Click OK. An icon for each specified Track appears on the System Events tab beneath the event to which it was applied. If the event was added to the category, any event in that category causes the specified Track(s) to occur.
See "Tracks" in the ETM® System User Guide for instructions for defining email tracks.
28 • ETM® Server Administration
6. To apply a filter to the Track to narrow the criteria for which the Track
fires, see "Filtering System Event Tracks" below.
You can apply filters to System Event Tracks to limit the dissemination of Tracks to certain contacts, based on the Span Group, Span, Card, Switch, Event Time, and/or Event Description associated with the System Event. You can apply one filter per applied Track. The filter applies specifically to the Track's association with the System Event; that is, if you apply the same Track to a different System Event, you can apply a different filter to that application of the Track.
To filter System Event Tracks
1. Apply a Track to a System Event. See "Setting Track Actions for System Events" on page 26, if necessary.
2. Right-click the Track, and then click Filter | Set Filter.
The System Event Track Filters dialog box appears.
Filtering System Event Tracks
Tip If the Filter you want to apply has not yet been defined, you can do it on the fly from this dialog box. See "Defining System Event Track Filters" on page 29, if necessary.

ETM® Server Administration • 29
3. Click the Filter you want to apply to the selected Track action, and then
click OK.
To define a System Event Track Filter
1. On the ETM System Console main menu, click Servers | Server Management. The Server Administration Tool appears.
2. Click the System Events tab.
3. Click Filters. The System Event Track Filters dialog box appears.
4. Click File | New. The System Event Filter dialog box appears.
Defining System Event Track Filters

30 • ETM® Server Administration
5. In the Name box, type a unique name for the filter.
6. Optionally, in the Comment box, type a comment, perhaps to identify the intent of the filter.
7. Double-click Any System Event. The Filter dialog box appears. This is the same dialog box used to define filters in Usage Manager Reports, the Call Log, and so forth.
8. Select one of the following:
• Exclude—Only data for events that do not match the filter criteria is included.
• Include—Only data for events that match the filter criteria is included.
9. In the first Field box, click the down arrow, and then select a field. The following fields are available: Event Time, Description, Span Name, Span Group Name, Switch Name, Card Name. If you select Event Time, the Date Filter dialog box appears; if you select any other field, the String Filter appears. See "Filters for Monitoring Tools" in the ETM® System User Guide for detailed instructions for defining filters.

ETM® Server Administration • 31
10. When you have defined the filter criteria, click OK.
11. Click OK in the System Event Filter dialog box. The new Filter appears in the System Even Track Filters dialog box.
To remove a Track from a System Event
1. On the ETM System Console main menu, click Servers | Server Management. The Server Administration Tool appears.
2. Click the System Events tab.
3. Click the PLUS SIGN to the left of the system event from which you want to remove the Track, to expand the tree.
4. Right-click the Track, and then click Remove, or click the Track, and then click Remove.
You can define a custom login banner that is presented when a user logs in to the Management Server. For example, you might want to provide an improper-use warning. The same banner appears when you log in via the ETM System Console, standalone Usage Manager, or Web Portal.
To define a login banner
1. On the ETM System Console main menu, click Servers | Server Management. The Server Administration Tool appears.
2. Click the Login Banner tab.
3. Select the Display Login Banner check box.
Removing a Track from a System Event
Login Banner
Defining a Login Banner
32 • ETM® Server Administration
4. In the Login Banner Title box, type (or copy and paste) the words that are to appear in the title bar of the login banner (up to 50 characters). For example, type: Welcome to the ETM System!
5. In the Login Banner Text box, type (or copy and paste) the words that are to appear as the message portion of the login banner (up to 1500 characters). For example, type: All activity on this system is monitored.
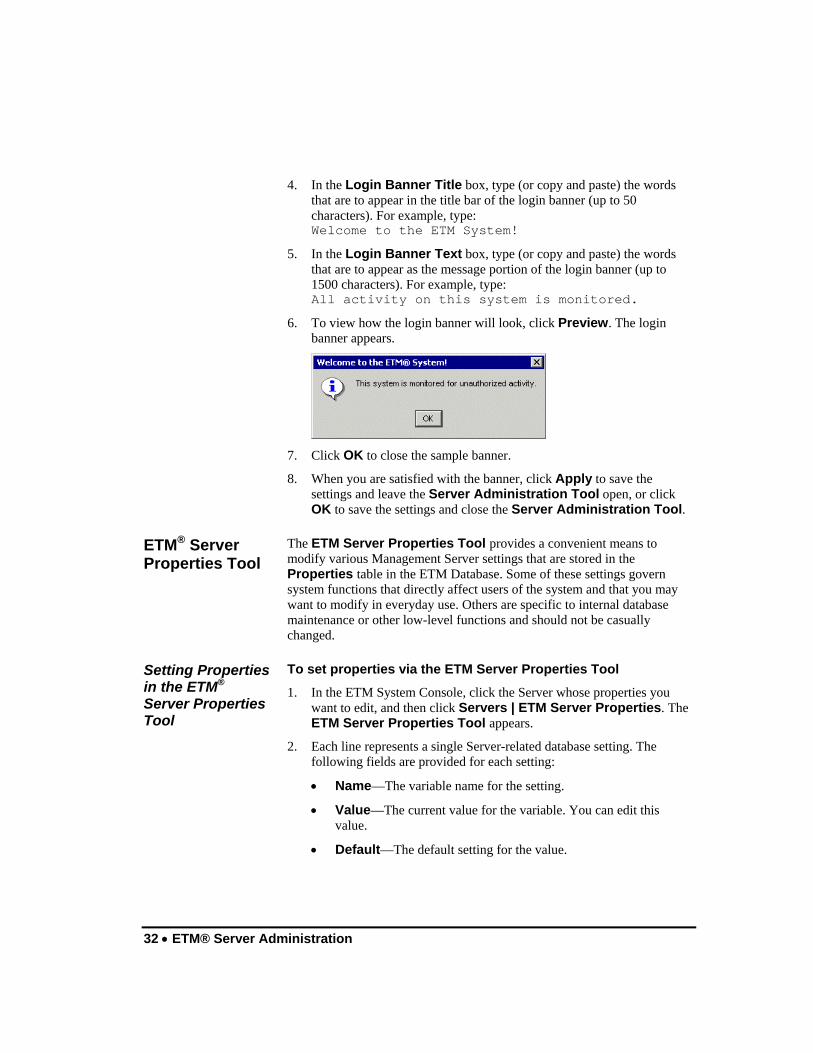
6. To view how the login banner will look, click Preview. The login banner appears.
7. Click OK to close the sample banner.
8. When you are satisfied with the banner, click Apply to save the settings and leave the Server Administration Tool open, or click OK to save the settings and close the Server Administration Tool.
The ETM Server Properties Tool provides a convenient means to modify various Management Server settings that are stored in the Properties table in the ETM Database. Some of these settings govern system functions that directly affect users of the system and that you may want to modify in everyday use. Others are specific to internal database maintenance or other low-level functions and should not be casually changed.
To set properties via the ETM Server Properties Tool
1. In the ETM System Console, click the Server whose properties you want to edit, and then click Servers | ETM Server Properties. The ETM Server Properties Tool appears.
2. Each line represents a single Server-related database setting. The following fields are provided for each setting:
• Name—The variable name for the setting.
• Value—The current value for the variable. You can edit this value.
• Default—The default setting for the value.
ETM® Server Properties Tool
Setting Properties in the ETM® Server Properties Tool

ETM® Server Administration • 33
• Dynamic—Whether the Management Server must be restarted for a new value to take effect. True means the value takes effect without a Server restart; False means the value only takes effect after the next Server restart. Some properties that do not require a Server restart only appear in the GUI after it is closed and reopened. If the GUI does not update when you change a value, close and reopen the ETM Client.
3. Do either of the following:
• To view a description of each setting, click the line containing the setting, and then click Description.
• To edit a property, click the row for the property, and then click Edit. The Modify Property dialog box appears. Type the new value, and then click OK.
4. If the property you changed has False in the Dynamic field, restart
the Management Server for the change to take effect. If it has True in the Dynamic field, the value will be read in the next time the Server performs the action (if it is an ongoing task) or the next time you open the affected GUI (for label and presentation changes).
IMPORTANT No error checking is performed on the typed value. If you enter an invalid value, the default is used.
34 • ETM® Server Administration
You can use the ETM Server Properties Tool to change the properties listed below. If a property has False in the Dynamic field, restart the Management Server for the change to take effect. If it has True in the Dynamic field, the value will be read the next time the Server performs the action (if it is an ongoing task) or the next time you open the affected GUI (for label and presentation changes).
• AccessCodeSetDistributionBatchSize—The number of emails distributed before Access Code Set distribution pauses for the time set in the AccessCodeSetDistributionThrottlePeriod property. The valid range is from 0 to 10,000. Setting the value to 0 disables throttling. The default is 50 emails. Dynamic.
• AccessCodeSetDistributionErrorThreshold—The number of allowable errors before an Access Code Set import should automatically abort. Setting the value to -1 disables this functionality. The default is 100. Dynamic.
• AccessCodeSetDistributionThreadCount—The number of threads to use for delivering Access Code Set distribution messages to the email server. The valid range is 1 or more. The default is 10. Dynamic.
• AccessCodeSetDistributionThrottlePeriod—The amount of time to pause between sending the number of emails specified in the AccessCodeSetDistributionBatchSize property. Setting the value to 0 disables throttling. The default is 1 second. Dynamic.
• AccessCodeSetImportErrorThreshold—The number of allowable errors before an Access Code Set distribution should automatically abort. Setting the value to -1 disables this functionality. The default is 100. Dynamic.
• BillingRuleGUI.RatePrecision—The number of decimal places that can be specified for the rate in a Billing Rule. The default is 4. Dynamic.
• CheckIndexesDeletePercent—The percentage of an index dedicated to deleted entries. This is the measure of fragmentation. For example, if the procedure is run with a percentage of 40, then all indices that have 40% of their capacity dedicated to deleted entries are rebuilt. Normally, this number should be between 0 and 100. If the percentage is larger than 100, no indexes are rebuilt; If the percentage is less than 0, all indexes are rebuilt. The default is 20. Dynamic.
Properties in the Tool

ETM® Server Administration • 35
• CheckIndexesOnline—A Boolean representing whether the rebuild process should happen online, that is, whether updates are allowed on an index while it is being rebuilt. Valid values are TRUE and FALSE. Specifying online as TRUE on a highly concurrent system might be beneficial, but in a test on an idle system (with no updates occurring), it was shown that rebuilding online doubles the execution time of the script. The default is False. Dynamic.
• ComputeStatsEstimatePercent—The percentage of rows to sample when estimating statistics. The valid range is 0.000001 to 100. The default is 10. Dynamic.
• DBDiagnosticsProcessFrequency—The frequency at which the ETM Server checks and processes any diagnostics messages originating from the scheduled database tasks. The default is 1 minute. Dynamic.
• DataFileLocation—The location at which the data files related to CCMI are stored. The default is ps/data. Dynamic.
• DelDupsOnImport—When you import phone numbers into an Import Set in the ETM Database, duplicates in the file are allowed by default. If you change this property to TRUE, duplicate phone numbers are deleted from the import file before reconciliation occurs. If the flag is set to 'TRUE', when duplicate entries are encountered in an import file, only the LAST duplicate entry in the import file is saved. Valid values are TRUE or FALSE. The default is False. Dynamic.
• DeleteActionsBatchSize—Specifies how many call, IPS, and Diagnostic Log records are deleted at a time from the active area of the database during the deletion records previously copied to the historical area. The default is 10,000 records. Dynamic.
• DeleteActionsFrequency—Specifies how often call, IPS, and Diagnostic Log data records that have already been copied to the historical call table are deleted from the active call table. The default is 12 hours. Dynamic.
• DirListUser1Label—The label for the first user-defined Directory Listing field, labeled Custom 1 by default. Dynamic.
• DirListUser2Label—The label for the second user-defined Directory Listing field, labeled Custom 2 by default. Dynamic.
• DirListUser3Label—The label for the third user-defined Directory Listing field, labeled Custom 3 by default. Dynamic.
• DisplayAppToolTips—Specifies whether the Span comment tooltip appears in the Performance Manager. The default is True. Dynamic.
• FailedLoginLockoutCount—The number of failed login attempts after which an account is locked. The default is 4 attempts. Dynamic.

36 • ETM® Server Administration
• FailedLoginLockoutPeriod—The amount of time for which an account is locked if the FailedLoginLockoutCount is exceeded. The default is 15 minutes. Dynamic.
• FailedLoginLockoutRetryPeriod—The period for which failed login attempts are counted against an account. Begins at the first failed attempt. The default is 30 minutes. Dynamic.
• FileDownloadCheckInterval—Specifies how often the Management Server verifies that the download of the import set file is progressing. The default is 1 minute. Dynamic.
• FileDownloadChunkSize—Specifies in bytes the size of the packets that are read from the Client to the Server. Testing during development showed that 256K (262144 bytes) is the ideal size. The default is 262144 bytes.
• IPSPollInterval—The frequency at which the polling mechanism runs for the Voice IPS detection engine. This value can be set to a smaller setting to enable quicker breach detections, but this may have an adverse effect in that the Management Server and DB machine will use more CPU. The default is 5 minutes. Dynamic.
• IPSRuleCompleteDelay—The amount of time that a Rule continues to collect IPS Rule-fired values from the Spans after the Interval has ended. This value is intended to allow compensation for late-arriving messages. The default is 5 minutes. Dynamic.
• IPSPollRetryCount—The number of times the IPS poller retries if it receives an Oracle Resource Busy message. The default is 5. Dynamic.
• InsertActionsBatchSize—Specifies how many call, IPS, and Diagnostic Log data records are copied at a time during copy of records from the active to historical call table. The default is 10,000 records. Dynamic.
• InsertActionsFrequency—Specifies how often call, IPS, and Diagnostic Log data records are copied from the active to the historical call table. The default is 6 hours. Dynamic. Note that you should not set the copy frequency to a very small value (a minimum of 30 minutes), or long-running reports may fail with a "stale rollback segment" error (depending on your call volume and rollback segment size).
• LDAPDefaultNorthAmericanNumbers—Specifies whether the LDAP importer treats unformatted 10- and 11-digit numbers as North American Numbers. If the value is TRUE, an unformatted 10- or 11-digit number that begins with 1 is treated as a North American Number; if the value is FALSE, the format of the imported number determines how it is imported, based on the locale selected. The default is True. Dynamic.

ETM® Server Administration • 37
• LOCALE—The location (for example, United States) where the Management Server is installed; initialized by the ETM Database Maintenance Tool according to user selection when the data instance is created; provides certain default locale-specific values. Not dynamic; you must restart the ETM Server for a change to take effect.
• OraClientToolsPath—The path to the directory on the ETM Server host that contains the Oracle Client Tools; used for Directory Listing and city/state data imports. Not dynamic; you must restart the ETM Server for a change to take effect. You can change this value in the Data Management Tool instead and then you do not need to restart the Server.
• REFIRE_REGEX—This property only applies to outbound calls; it specifies whether any Tracks are to be refired after SMDR data is received. By default, Tracks fire once when a call is first identified as matching a Rule, when all of the call data may not yet be available. This optional value is defined as a regular expression and is compared against a call's Destination Flag to determine if a Rule should refire after the SMDR Data arrives. You may want Tracks for certain types of Rules to refire. For example, you may want Tracks for the Emergency Rule to refire when the source of the call has been obtained from SMDR. The default is blank (no Tracks refire). Dynamic.
• ReconciliationReportHistoryCount—This value specifies the number of reconciliation reports that are archived and displayed in the Import Set Details dialog box in the Directory Manager. The default is 5. Dynamic.
• RecordingJugglerWaitTimeout—How long the ETM Server waits between recording chunks received from the Call Recording Cache before the session times out. If the session times out, the .wav file request is cancelled and an error message is generated. The default is 30 seconds. Dynamic.
• RecordingListGetterWaitTimeout—How long the ETM Server waits between messages received from the Call Recording Cache when attempting to retrieve the file list. If this timeout is exceeded, the request is cancelled and an error is generated. The default is 30 seconds. Dynamic.
• SchRptRetryCount—The number of times to attempt to run a scheduled report when the first attempt fails. The default is 0, meaning no retries occur. Dynamic. See “Scheduled Report Retry Settings” in the Usage Manager User Guide for details about this setting. Not dynamic.
• SchRptRetryDelay—The amount of time between Scheduled Report retry attempts. The default is 30 minutes. See “Scheduled Report Retry Settings” in the Usage Manager User Guide for details about this setting. Not dynamic.

38 • ETM® Server Administration
• smdr.AccessCodeTimeOffset—Synchronizes the Access Code record start time value in the ETM Server with that of the PBX. The default is 3 minutes. Not dynamic.
• smdr.CorrelateDelay—Specifies the delay after SMDR data is parsed before finding requests for the data. The default is 5 seconds. Not dynamic.
• smdr.DebugPerSwitch—Determines whether SMDR debug logs are to be segregated per Switch (True) or consolidated in one file (False). The default is False. Dynamic.
• smdr.DriftDelta—Specifies the acceptable margin of error for calculating the time drift between the ETM Server and the PBX. The default is 15 seconds. Not dynamic.
• smdr.DurationAmbigThresh—Specifies a bounding period that must contain only one matching call's duration for the call to be considered an exclusive match. If multiple matching calls have a duration within this period, the SMDR match algorithm will continue to execute and may end up with an ambiguous resolution. See also smdr.StartTimeAmbigThreshold. The default is 6 seconds. Not dynamic.
• smdr.DurationOffset—Defines the allowable difference in duration between the data received via SMDR and the duration as measured by the ETM System. The default is 3 minutes. Not dynamic.
• smdr.FailedResolvesWarningCount—Specifies the count of sequential unmatched outbound SMDR records before a Diagnostic Log message is generated. The default is 100. Not dynamic.
• smdr.NumRetainedAccessCodes—Specifies how many uncorrelated Access Codes extracted from SMDR are to be retained at a time. Uncorrelated Access Codes are Access Codes that have been extracted from SMDR but have not yet matched an SMDR request. The default is 1000. Not dynamic.
• smdr.NumRetainedRequests—Specifies the number of uncorrelated SMDR requests that will be retained at a time. Uncorrelated requests are Span requests for SMDR from the Server that have not yet matched a parsed SMDR record. The default is 1000. Not dynamic.
• smdr.PreferCompletedCalls—Determines whether completed calls take precedence over calls in progress (True) when both match an SMDR record. The default is True. Not dynamic. Note: It is strongly recommended that you leave this setting at the default for best results.
• smdr.RequireCompletedCalls—Determines whether only completed calls can match SMDR data (True) or whether incomplete calls are also considered potential matches (False). The default is True. Not dynamic. Note: It is strongly recommended that you leave this setting at the default for best results.
ETM® Server Administration • 39
• smdr.SampleCount—Denotes the number of samples to use when calculating time drift between the ETM Management Server and the PBX. The default is 100. Not dynamic.
• smdr.StartTimeAmbigThresh—Specifies a bounding period that must contain only one matching call's start time for the call to be considered an exclusive match. If multiple matching calls start within this period, the SMDR match algorithm will continue to execute and may end up with an ambiguous resolution. See also smdr.DurationAmbigThreshold. The default is 6 seconds. Not dynamic.
• smdr.StartTimeOffset—Defines the allowable difference in start time between the data received via SMDR and the start time as measured by the ETM System. The default is 30 seconds. Not dynamic.
• smdr.UnresolvedInboundRequestsWarningCount—Specifies the count of sequentially received unresolved requests for inbound SMDR at which a Diagnostic Log message is generated. The default is 100. Not dynamic.
• smdr.UnresolvedRequestsWarningCount—Specifies the count of sequentially received unresolved requests for outbound SMDR at which a Diagnostic Log message is generated. The default is 100. Not dynamic.
• WebETMAnonymousLoginUser—Specifies the username associated with anonymous login to the WebETM application. If no username is specified, anonymous login is disabled. Dynamic.
To change the labels for the user-defined Directory Listing fields
1. In the ETM System Console, click the Server whose properties you want to edit, and then click Servers | ETM Server Properties. The ETM Server Properties Tool appears.
2. Click the heading of the Name column to sort the entries in alphabetical order.
3. Locate the fields named DirListUser1Label, DirListUser2Label, and DirListUser3Label. These fields correspond to the fields labeled Custom 1, Custom 2, and Custom 3 by default in a Directory Listing, as denoted by the Default column.
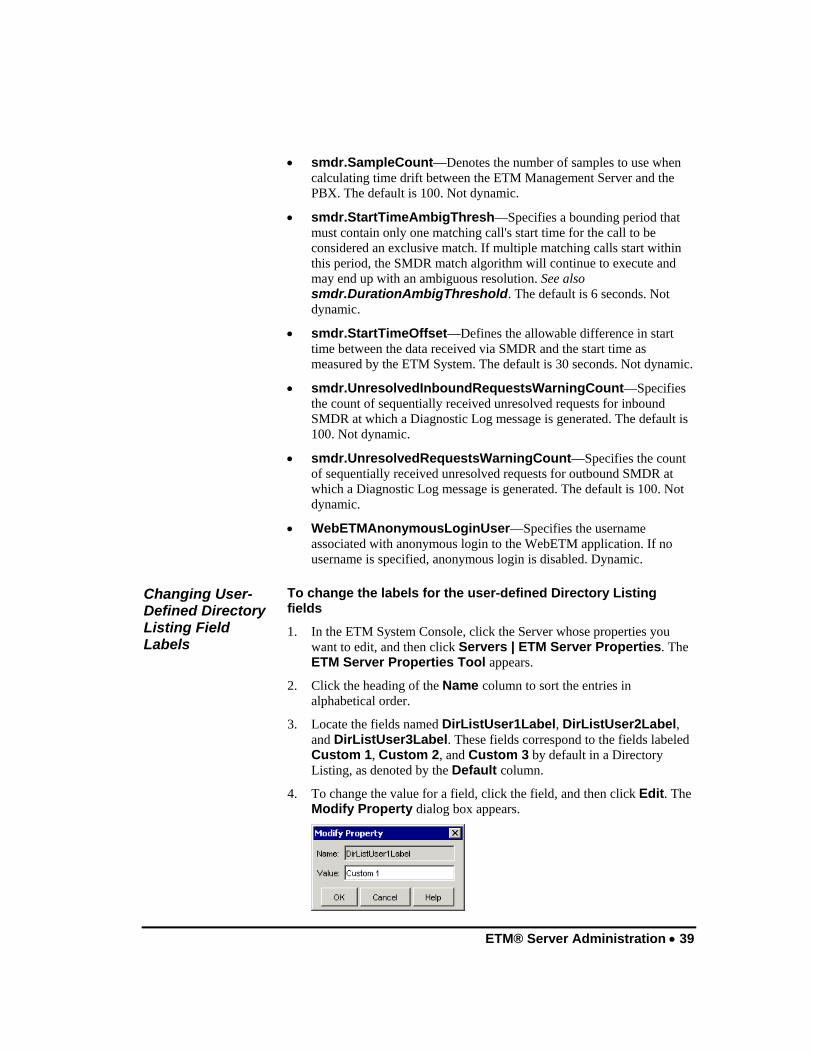
4. To change the value for a field, click the field, and then click Edit. The Modify Property dialog box appears.
Changing User-Defined Directory Listing Field Labels

40 • ETM® Server Administration
5. In the Value box, replace the current text with the text you want as the label.
6. Click OK. The change is saved and applied. Note that the Dynamic field for this property contains True, which means you do not have to restart the Server for the change to take effect.
7. Click Close.
By default, duplicate entries in a Directory Listing import file are processed. If you want duplicates to be discarded before reconciliation occurs, modify the DelDupsOnImport value in the ETM Server Properties Tool. If the value is set to 'TRUE', when duplicate entries are encountered in an import file, only the LAST duplicate entry in the import file is saved.
To modify the value
1. In the ETM System Console, click the Server whose properties you want to edit, and then click Servers | ETM Server Properties. The ETM Server Properties Tool appears.
2. Click the DelDupsOnImport property, and then click Edit. The Modify Property dialog box appears.
3. Type the value in the Value field. Valid values are TRUE (duplicates are discarded), and FALSE (duplicates are processed).
4. Click OK. This property is dynamic, so you do not need to restart the Server for it to take effect.
Billing rate decimal precision governs the number of decimal places that can be specified for the rate in a Billing Rule. The default is 4.
To change the decimal precision for Billing Rules
1. In the ETM System Console, click the Server whose properties you want to edit, and then click Servers | ETM Server Properties. The ETM Server Properties Tool appears.
2. Click the BillingRuleGUI.RatePrecision property, and then click Edit. The Modify Property dialog box appears.
3. Type an integer in the Value field.
4. Click OK. This property is dynamic, so you do not need to restart the Server for it to take effect.
It is recommended that you contact SecureLogix Customer Support for advice before changing these properties.
Each instance in the ETM Database stores two sets of call, IPS, and Diagnostic Log data: active and historical. This enables the ETM Database to function as both a transactional and data warehouse database, and improves performance for reports.
Discarding Duplicates in a Directory Import File
Billing Rate Decimal Precision
Active-to-Historical Data Transfer Properties

ETM® Server Administration • 41
The Policy Log retrieves data from the active data area; the Usage Manager retrieves data from the historical data area. Once data has been copied to the historical area, it is available for reports. Once data has been deleted from the active area, it is no longer viewable in the Policy Log. By default, the copy frequency is twice as often as the delete frequency. Note that data is never deleted from the active area unless it has been copied to the historical area and is older than the specified delete frequency. By default, data is copied to the historical area every 6 hours and copied data is deleted from the active area every 12 hours. You can change these values using the ETM Server Properties Tool in the ETM System Console.
The process that migrates the data from the active tables to the historical tables reads the property values governing the transfer every time it performs a migration task (that is, at the specified copy and delete frequencies). You do not need to restart the Management Server for changes to take effect unless you want them to take effect immediately. Note that only positive numbers are allowed as values. If the value you type for these fields is non-numeric or negative, the system logs an error and uses the defaults.
To change the active-to-historical transfer settings
1. In the ETM System Console, click the Server whose properties you want to edit, and then click Servers | ETM Server Properties. The ETM Server Properties Tool appears.
2. Double-click the property you want to change, make changes, and then click OK. These properties are dynamic, so you do not need to restart the Server for them to take effect unless you want them implemented immediately.
The following properties govern how often data is copied and deleted and the batch size for these actions:
• DeleteActionsBatchSize specifies how many records are deleted at a time during the deletion of previously copied records. The default is 10,000 records.
• DeleteActionsFrequency specifies how often records that have already been copied to the historical call table are deleted from the active call table. The default is 12 hours.
• InsertActionsBatchSize specifies how many records are copied at a time during copy of records from the active to historical call table. The default is 10,000 records.
• InsertActionsFrequency specifies how often records are copied from the active to the historical call table. The default is 6 hours. Note that you should not set the copy frequency to a very small value (a minimum of 30 minutes), or long-running reports may fail with a "stale rollback segment" error (depending on your call volume and rollback segment size).
To view a description of a property, click the row for the property, and then click Description.
These values are instance specific. Changes apply only to the instance used by the Server you are logged in to.
42 • ETM® Server Administration
By default, the IPS detection engine executes to evaluate the thresholds every 5 minutes. Depending on the number of thresholds being monitored, you can change this frequency to a higher value to decrease processing load on the Management Server computer.
To change the Detection Engine Polling Interval
1. In the ETM System Console, click the Server whose properties you want to change.
2. On the main menu, click Servers | ETM Server Properties. The ETM Server Properties Tool appears.
3. Click the item named IPSPollInterval, and then click Edit. The Modify Property dialog box appears.
4. In the Value box, type the value, and then click OK. Valid values are 30 seconds to 60 minutes. Note that the Dynamic field for this property is true. This means you do not have to restart the Server for the change to take effect; the polling engine reads the new value at its next execution, at which time it changes to the new value.
After the interval for an IPS Rule has completed, call data being received from the Spans continues to be applied to the accumulations for a user-configurable amount of time, to allow for late-arriving messages. The default is 5 minutes.
To change the Rule complete delay value
1. In the ETM System Console, click the Server whose properties you want to change.
2. On the main menu, click Servers | ETM Server Properties. The ETM Server Properties Tool appears.
3. Click the item named IPSRuleCompleteDelay, and then click Edit. The Modify Property dialog box appears.
4. In the Value box, type the new value. Note that the Dynamic field for this property is true. This means you do not have to restart the Server for the change to take effect; it is read by the polling engine at its next execution, at which time it changes to the new value.
IPS Detection Engine Polling Interval
IPS Rule Complete Delay

ETM® Server Administration • 43
By default, each Import Set in the Directory Manager retains five reconciliation histories. You can use the ETM® Server Properties Tool to set this to a different value.
To change the number of reconciliation reports retained
1. In the ETM® System Console, click the Server whose properties you want to change.
2. On the main menu, click Servers | ETM Server Properties. The ETM Server Properties Tool appears.
3. Click the item named ReconciliationReportHistoryCount, and then click Edit. The Modify Property dialog box appears.
4. In the Value box, type a positive integer, and then click OK. This property is dynamic, so you do not need to restart the Server. If the Directory Manager is open, close and reopen it to see the change.
To prevent overwhelming the mail server when Access Codes are distributed, you can set the number of emails to be sent at once and the interval between batches sent. You can also specify the allowable number of errors before an Access Code distribution or import attempt should abort and you can set the number of threads to be used.
To change the Access Code import and distribution settings
1. In the ETM® System Console, click the Server whose properties you want to change.
2. On the main menu, click Servers | ETM Server Properties. The ETM Server Properties Tool appears.
3. Double-click the setting for which you want to change the value, make changes, and click OK.
The following settings apply to Access Code distribution throttling and errors. These settings are dynamic, which means you do not need to restart the Management Server for them to take effect.
• AccessCodeDistributionBatchSize specifies how many emails are sent to the mail server at once before pausing so the mail server can process the queue. The default is 50. Setting this value to 0 disables throttling.
• AccessCodeDistributionThrottlePeriod specifies the delay between sending batches of emails to the email server. The default is 1 second. Setting this value to 0 disables throttling.
Number of Reconciliations to Report
Access Code Import and Distribution Settings
To view a description of a property, click the row for the property, and then click Description.

44 • ETM® Server Administration
• AccessCodeSetDistributionErrorThreshold specifies the number of allowed distribution errors before an Access Code Set distribution attempt aborts. The default is 100. To disable aborting based on errors, set this value to -1.
• AccessCodeSetImportErrorThreshold specifies the number of allowed parsing errors before an Access Code Set import attempt aborts. The default is 100. To disable aborting based on errors, set this value to -1.
• AccessCodeSetDistributionThreadCount specifies the number of threads to be used in distributing an Access Code Set. The default is 10. Valid values are 1 or more. When delivering email to an email server, the inherent delay caused by email server processing makes it advisable to use multiple threads for email distribution. Using a single thread significantly slows down distribution, and the threads are not resource-intensive.
To change failed login properties
1. In the ETM® System Console, click the Server whose properties you want to change.
2. On the main menu, click Servers | ETM Server Properties. The ETM Server Properties Tool appears.
3. Double-click the property you want to change, make changes, and then click OK.
The following properties govern failed login attempts:
FailedLoginLockoutCount—The number of failed login tries after which an account is locked. The default is 4 attempts.
FailedLoginLockoutPeriod—The amount of time for which an account is locked if the FailedLoginLockoutCount is exceeded. The default is 15 minutes.
FailedLoginLockoutRetryPeriod—The period for which failed login attempts are counted against an account. Begins at the first failed attempt. The default is 30 minutes.
By default, if a Span contains a comment on the General tab of its Configuration dialog box, a tool tip containing the comment appears when you hover the mouse cursor over the Span icon in the Performance Manager tree pane. This feature applies to all resources below the Card level in the Telco Configuration subtree, including AAA Servers, Spans, Signaling Links, and Caches. You can optionally disable this tool tip.
These values are instance specific. Changes apply only to the instance used by the Server you are logged in to.
Failed Login Properties
Span Tool Tip Property

ETM® Server Administration • 45
To disable the Span tool tip
1. In the ETM System Console, click the Server for which you want to disable the Span tool tip.
2. On the main menu, click Servers | ETM Server Properties. The ETM Server Properties Tool appears.
3. Double-click the property named DisplayAppToolTips. The property opens in the Modify Property dialog box.
4. To disable the tool tip feature, select False. To re-enable the tool tip,
select True.
This property is dynamic, so you do not have to restart the Server for the change to take effect. However, if the Performance Manager is open, you must close and reopen it before the change is reflected.
To enable anonymous Web Portal login, you define a user account for anonymous logins and then supply the username associated with that account as the value for the WebETMAnonymousUsername property in the ETM Server Properties Tool. If no username is supplied, anonymous login is disabled.
To enable anonymous Web Portal login
1. Define a user account to be used for anonymous Web Portal login. See “Creating a User Profile” on page 16 for instructions, if necessary.
2. In the ETM Server Properties Tool, click the property named WebETMAnonymousLoginUser, and then click Edit. The Modify Property box appears.
3. In the Value box, type the username of the user account you created for anonymous Web Portal logins.
4. Click OK. This property is dynamic, so you do not need to restart the Server for it to take effect.
Enabling Anonymous Web Portal Login

46 • ETM® Server Administration
Two settings govern whether failed Scheduled Reports are retried, and if so, how many times and how far apart. See “Scheduled Report Retry Settings” in the Usage Manager User Guide for details about these settings. These settings are not dynamic; you must restart the Server for changes to take effect.
• SchRptRetryCount specifies the number of retry attempts. When set to 0 (the default) no retry occurs.
• SchRptRetryDelay specifies the time between retries. The default is 30 minutes.
For SMDR to work properly, a number of settings are configured to work together. These include:
• Settings in the Switch Properties dialog box that enable SMDR to be used by identifying the SMDR Provider Card, the type of SMDR, time correlation settings, correct parse file for the SMDR format, SMDR extension conversion information, and associated Access Code Set. See “Configuring a Switch for SMDR” in the ETM® System Installation and Configuration Guide for details.
• SMDR resolution settings in the ETM Server Properties Tool that govern SMDR correlation thresholds. See “SMDR Correlation Settings” on page 47 and “Ambiguous SMDR Resolution” on page 50 for details.
• The Request Inbound SMDR and Request Outbound SMDR settings on the Channel Map tab of the Span Configuration dialog box. See “Channel Map Tab” in the ETM® System Installation and Configuration Guide for details.
• The SMDR Timeout setting on the Telephony tab of the Span Configuration dialog box. See “SMDR Timeout Setting” on page 104 for details.
Other optional SMDR settings include:
• Setting Track Actions to refire when SMDR is received. See “Setting Track Actions to Refire After SMDR Update” on page 48 for details.
• Enabling a separate SMDR debug log per Switch for troubleshooting, instead of having all of the information in one file for all Switches. See “Enabling a Separate SMDR Debug Log per Switch” on page 49 for details.
Scheduled Report Retry Settings
SMDR Configuration

ETM® Server Administration • 47
The following properties in the ETM Server Properties Tool govern SMDR resolution thresholds.
• smdr.AccessCodeTimeOffset—Synchronizes the Access Code record start time value in the ETM Server with that of the PBX. The default is 2 seconds. Not dynamic.
• smdr.CorrelateDelay—Specifies the delay after SMDR data is parsed before finding requests for the data.. The default is 5 seconds. Not dynamic.
• smdr.DebugPerSwitch—Determines whether SMDR debug logs are to be segregated per Switch (TRUE) or consolidated in one file (FALSE). The default is FALSE. Dynamic.
• smdr.DriftDelta—Specifies the acceptable margin of error for calculating the time drift between the ETM Server and the PBX. The default is 15 seconds. Not dynamic.
• smdr.DurationAmbigThresh—Specifies a bounding period that must contain only one matching call's duration for the call to be considered an exclusive match. If multiple matching calls have a duration within this period, the SMDR match algorithm will continue to execute and may end up with an ambiguous resolution. See also smdr.StartTimeAmbigThreshold. The default is 6 seconds. Not dynamic.
• smdr.DurationOffset—Defines the allowable difference in duration between the data received via SMDR and the duration as measured by the ETM System. The default is 3 minutes. Not dynamic.
• smdr.FailedResolvesWarningCount—Specifies the count of sequential unmatched outbound SMDR records before a Diagnostic Log message is generated. The default is 100. Not dynamic.
• smdr.NumRetainedAccessCodes—Specifies how many uncorrelated Access Codes extracted from SMDR are to be retained at a time. Uncorrelated Access Codes are Access Codes that have been extracted from SMDR but have not yet matched an SMDR request. The default is 1000. Not dynamic.
• smdr.NumRetainedRequests—Specifies the number of uncorrelated SMDR requests that will be retained at a time. Uncorrelated requests are Span requests for SMDR from the Server that have not yet matched a parsed SMDR record. The default is 1000. Not dynamic.
SMDR Correlation Settings
48 • ETM® Server Administration
• smdr.PreferCompletedCalls—Determines whether completed calls take precedence over calls in progress (TRUE) when both match an SMDR record. The default is TRUE. Not dynamic. Note: For best results, it is strongly recommended that you leave this setting at the default.
• smdr.RequireCompletedCalls—Determines whether only completed calls are considered when matching SMDR data (TRUE) or whether incomplete calls are also considered potential matches (FALSE). The default is TRUE. Not dynamic. Note: For best results, it is strongly recommended that you leave this setting at the default.
• smdr.SampleCount—Denotes the number of samples to use when calculating time drift between the ETM Management Server and the PBX. The default is 100. Not dynamic.
• smdr.StartTimeAmbigThresh—Specifies a bounding period that must contain only one matching call's start time for the call to be considered an exclusive match. If multiple matching calls start within this period, the SMDR match algorithm will continue to execute and may end up with an ambiguous resolution. Not dynamic. See also smdr.DurationAmbigThreshold. The default is 6 seconds.
• smdr.StartTimeOffset—Defines the allowable difference in start time between the data received via SMDR and the start time as measured by the ETM System. The default is 3 minutes. Not dynamic.
• smdr.UnresolvedInboundRequestsWarningCount—Specifies the count of sequentially received unresolved requests for inbound SMDR at which a Diagnostic Log message is generated. The default is 100. Not dynamic.
• smdr.UnresolvedRequestsWarningCount—Specifies the count of sequentially received unresolved requests for outbound SMDR at which a Diagnostic Log message is generated. The default is 100. Not dynamic.
Because SMDR data may not be available until a call has ended, termination cannot be enforced, but multiple actions specified for a Rule triggered by the call can be performed. For outbound calls, you can configure the Management Server to refire email notifications, SNMP traps, and real-time alerts after SMDR data is received. For example, if the Firewall Policy Emergency Rule fires on a Span that requires SMDR for outbound source, you can specify that the actions for the Rule fire again after SMDR is received (after the call ends) so that you can identify the source of the call.
You can enable this behavior for all calls, or only for specific types of calls, such as emergency calls.
Setting Track Actions to Refire After SMDR Update
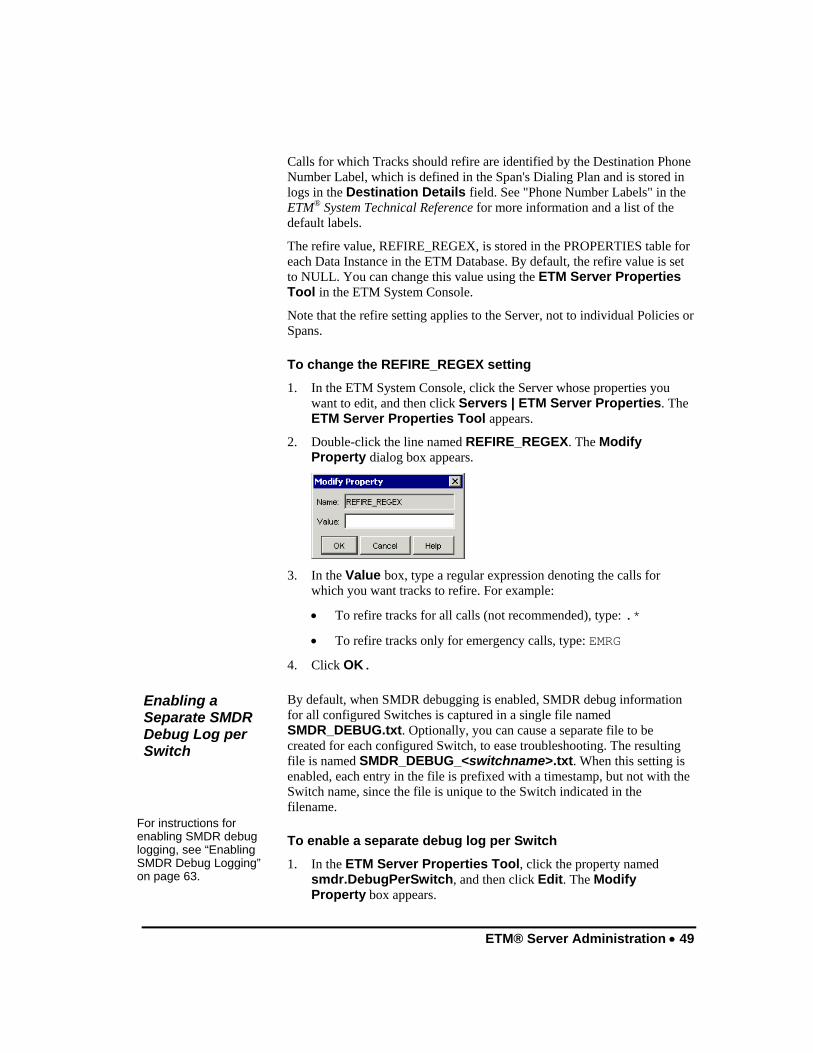
ETM® Server Administration • 49
Calls for which Tracks should refire are identified by the Destination Phone Number Label, which is defined in the Span's Dialing Plan and is stored in logs in the Destination Details field. See "Phone Number Labels" in the ETM® System Technical Reference for more information and a list of the default labels.
The refire value, REFIRE_REGEX, is stored in the PROPERTIES table for each Data Instance in the ETM Database. By default, the refire value is set to NULL. You can change this value using the ETM Server Properties Tool in the ETM System Console. Note that the refire setting applies to the Server, not to individual Policies or Spans.
To change the REFIRE_REGEX setting
1. In the ETM System Console, click the Server whose properties you want to edit, and then click Servers | ETM Server Properties. The ETM Server Properties Tool appears.
2. Double-click the line named REFIRE_REGEX. The Modify Property dialog box appears.
3. In the Value box, type a regular expression denoting the calls for
which you want tracks to refire. For example:
• To refire tracks for all calls (not recommended), type: .*
• To refire tracks only for emergency calls, type: EMRG
4. Click OK.
By default, when SMDR debugging is enabled, SMDR debug information for all configured Switches is captured in a single file named SMDR_DEBUG.txt. Optionally, you can cause a separate file to be created for each configured Switch, to ease troubleshooting. The resulting file is named SMDR_DEBUG_<switchname>.txt. When this setting is enabled, each entry in the file is prefixed with a timestamp, but not with the Switch name, since the file is unique to the Switch indicated in the filename.
To enable a separate debug log per Switch
1. In the ETM Server Properties Tool, click the property named smdr.DebugPerSwitch, and then click Edit. The Modify Property box appears.
Enabling a Separate SMDR Debug Log per Switch
For instructions for enabling SMDR debug logging, see “Enabling SMDR Debug Logging” on page 63.

50 • ETM® Server Administration
2. Select True.
3. Click OK. This property is dynamic, so you do not need to restart the Server for it to take effect.
In most environments, SMDR resolution properly correlates calls with called and calling numbers. Some calling environments, however, present challenges in uniquely identifying the called and calling numbers for a call. For example, if multiple internal callers dial the same phone number at nearly the same second, such as for conference calls, SMDR correlation may be ambiguous. These calls are represented in the Source Details field of the Call Log as AMBIG_nnnn, where n is the extension that could not be uniquely correlated with a call. If multiple SMDR records are potential matches for the same call, the Source Details field contains all of those extensions, up to a maximum of 60 characters. Several values in the ETM Server Properties Tool, along with the Duration field in the SMDR parse file, allow you to fine-tune the thresholds for labeling SMDR extensions as ambiguous.
• When set to TRUE, the smdr.RequireCompletedCalls property prevents SMDR from being correlated with in-progress calls. Whether a call is complete is determined at the time of correlation, which occurs a user-definable number of time after the Server receives the SMDR data from the SMDR provider. The property smdr.CorrelateDelay governs the delay between receiving the data and beginning correlation.
• The smdr.StartTimeAmbigThresh property defines a bounding period that must contain only one matching call's start time for the call to be considered an exclusive match. If multiple calls fall within that threshold, they are deemed ambiguous, unless the Duration calculation (below) provides a unique resolution.
• If the SMDR data contains both Start Time and Duration and the SMDR parse file is defined to parse the Duration, smdr.DurationAmbigThresh is used to further evaluate a potentially ambiguous match. In this case, only if two calls have the same call destination, have a start time within the smdr.StartTimeAmbigThresh value and have a Duration within the smdr.DurationAmbigThresh value, are they flagged as ambiguous. This can minimize the number of calls that are determined to be ambiguous.
Ambiguous SMDR Resolution

ETM® Server Administration • 51
The Data Management Tool is used to:
• Specify the location of the Oracle Client Tools used to import city/state data and text files of Directory Listings.
• Import city/state data files periodically as the information changes.
You can include city/state and other locale-based information about called and calling numbers in Usage Manager reports. Periodic import of updated data files keeps the data up-to-date. Updated files are available periodically on the SecureLogix website or by contacting SecureLogix Customer Support.
To import city/state data
1. In the ETM System Console, click the ETM Server for which you want to import data.
2. On the main menu, click Servers | ETM Server Data Management. The Data Management Tool appears.
3. Click the City/State Data tab.
4. Click Select File to browse for the file. By default, the Open dialog box opens in the ETM Server installation directory.
5. Click CCMI.slc, and then click Open.
6. Click Start Update.
Data Management Tool
Importing City/State Data
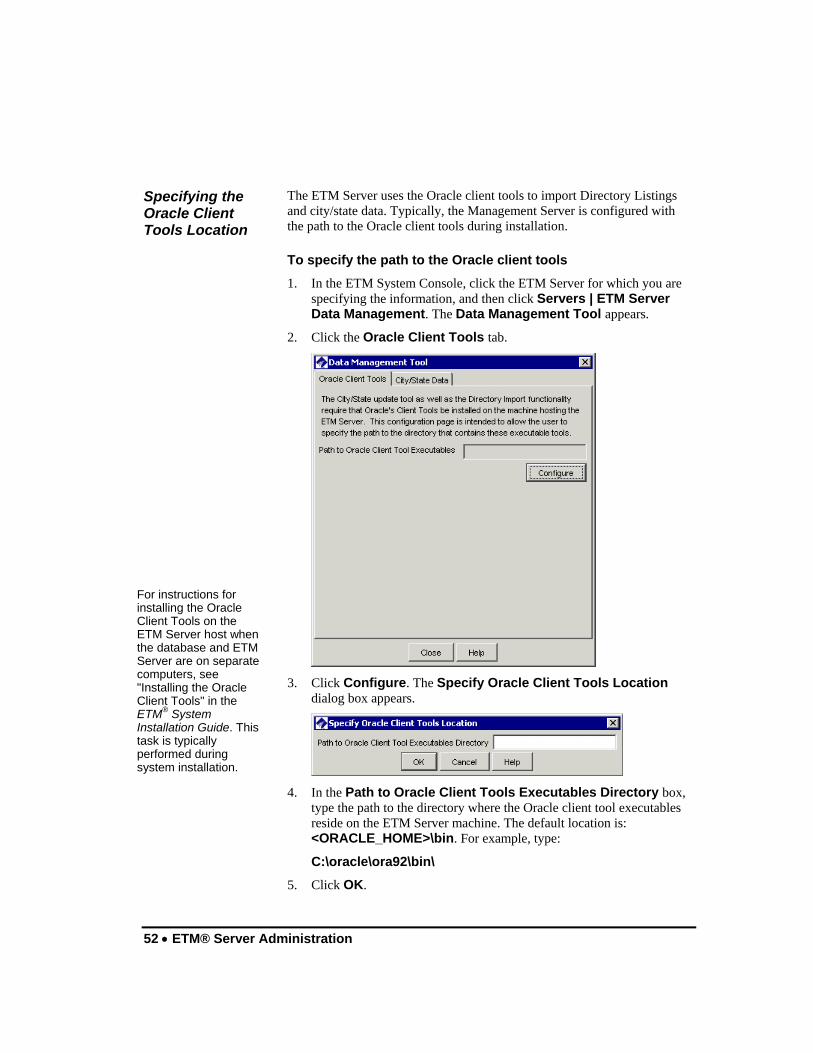
52 • ETM® Server Administration
The ETM Server uses the Oracle client tools to import Directory Listings and city/state data. Typically, the Management Server is configured with the path to the Oracle client tools during installation.
To specify the path to the Oracle client tools
1. In the ETM System Console, click the ETM Server for which you are specifying the information, and then click Servers | ETM Server Data Management. The Data Management Tool appears.
2. Click the Oracle Client Tools tab.
3. Click Configure. The Specify Oracle Client Tools Location
dialog box appears.
4. In the Path to Oracle Client Tools Executables Directory box,
type the path to the directory where the Oracle client tool executables reside on the ETM Server machine. The default location is: <ORACLE_HOME>\bin. For example, type:
C:\oracle\ora92\bin\
5. Click OK.
Specifying the Oracle Client Tools Location
For instructions for installing the Oracle Client Tools on the ETM Server host when the database and ETM Server are on separate computers, see "Installing the Oracle Client Tools" in the ETM® System Installation Guide. This task is typically performed during system installation.
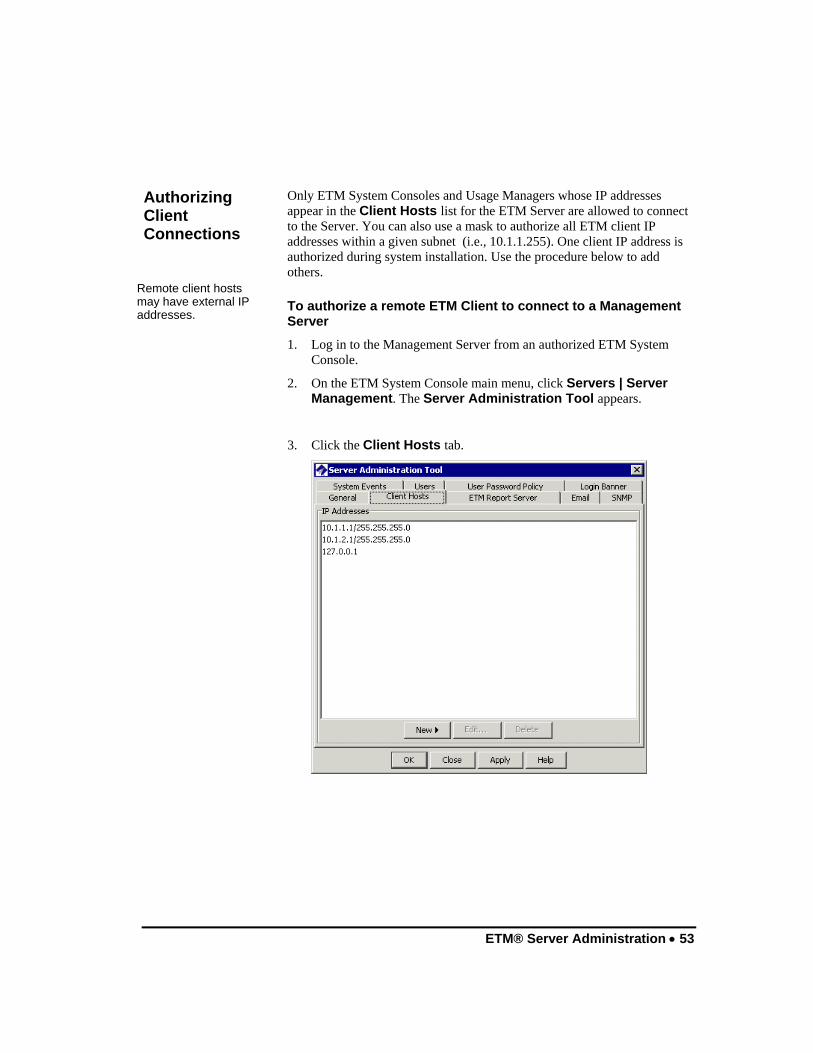
ETM® Server Administration • 53
Only ETM System Consoles and Usage Managers whose IP addresses appear in the Client Hosts list for the ETM Server are allowed to connect to the Server. You can also use a mask to authorize all ETM client IP addresses within a given subnet (i.e., 10.1.1.255). One client IP address is authorized during system installation. Use the procedure below to add others.
To authorize a remote ETM Client to connect to a Management Server 1. Log in to the Management Server from an authorized ETM System
Console.
2. On the ETM System Console main menu, click Servers | Server Management. The Server Administration Tool appears.
3. Click the Client Hosts tab.
Authorizing Client Connections
Remote client hosts may have external IP addresses.

54 • ETM® Server Administration
4. Do one of the following:
• To authorize a specific IP address, click New and then click IP Address. The Client Host dialog box appears.
a. Type the IPv4 or IPv6 address of the Client.
b. Click OK.
• To authorize a range of IP addresses, click New and then click IP Range. The Client Hosts dialog box appears.
a. In the IP Address box, type the IPv4 or IPv6 base
address.
b. If you typed an IPv6 address, click the down arrow and select Prefix, and then type the prefix length.
c. If you typed an IPv4 address, select Mask and type the subnet mask or select Prefix and type a prefix length.
d. Click OK.
5. Click OK to save the changes and close the dialog box or Apply to save the changes and leave the dialog box open.
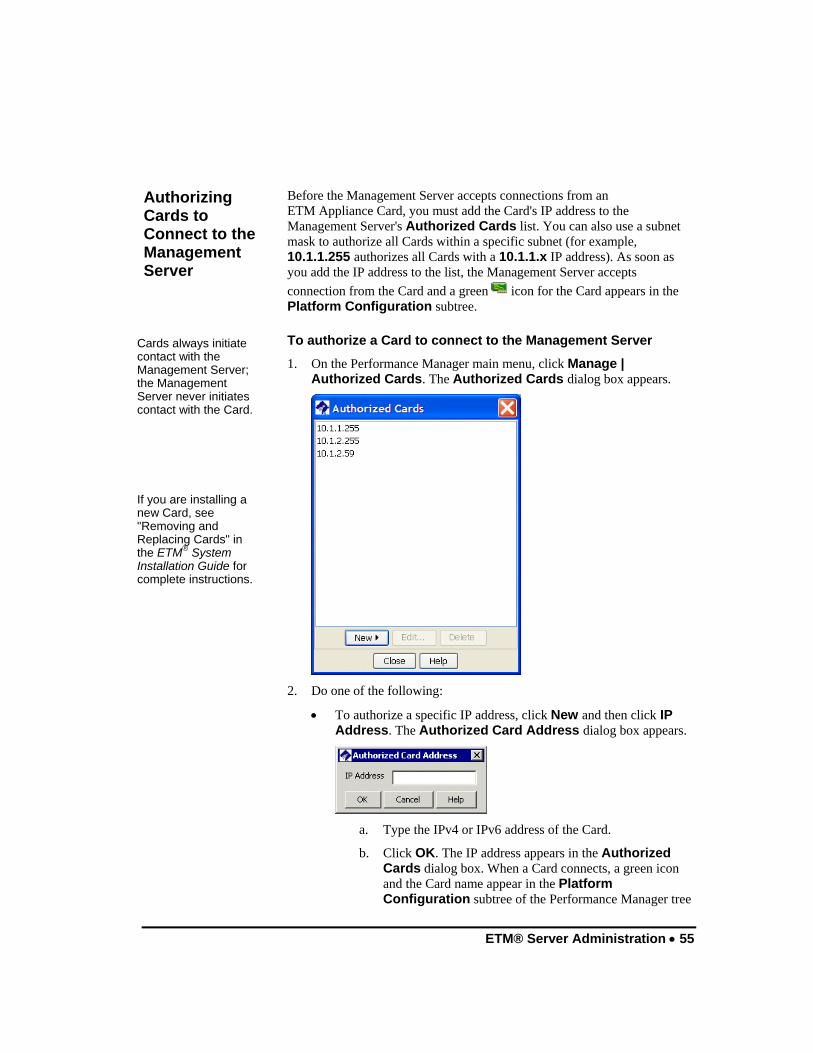
ETM® Server Administration • 55
Before the Management Server accepts connections from an ETM Appliance Card, you must add the Card's IP address to the Management Server's Authorized Cards list. You can also use a subnet mask to authorize all Cards within a specific subnet (for example, 10.1.1.255 authorizes all Cards with a 10.1.1.x IP address). As soon as you add the IP address to the list, the Management Server accepts connection from the Card and a green icon for the Card appears in the Platform Configuration subtree.
To authorize a Card to connect to the Management Server
1. On the Performance Manager main menu, click Manage | Authorized Cards. The Authorized Cards dialog box appears.
2. Do one of the following:
• To authorize a specific IP address, click New and then click IP Address. The Authorized Card Address dialog box appears.
a. Type the IPv4 or IPv6 address of the Card.
b. Click OK. The IP address appears in the Authorized Cards dialog box. When a Card connects, a green icon and the Card name appear in the Platform Configuration subtree of the Performance Manager tree
Authorizing Cards to Connect to the Management Server
Cards always initiate contact with the Management Server; the Management Server never initiates contact with the Card.
If you are installing a new Card, see "Removing and Replacing Cards" in the ETM® System Installation Guide for complete instructions.
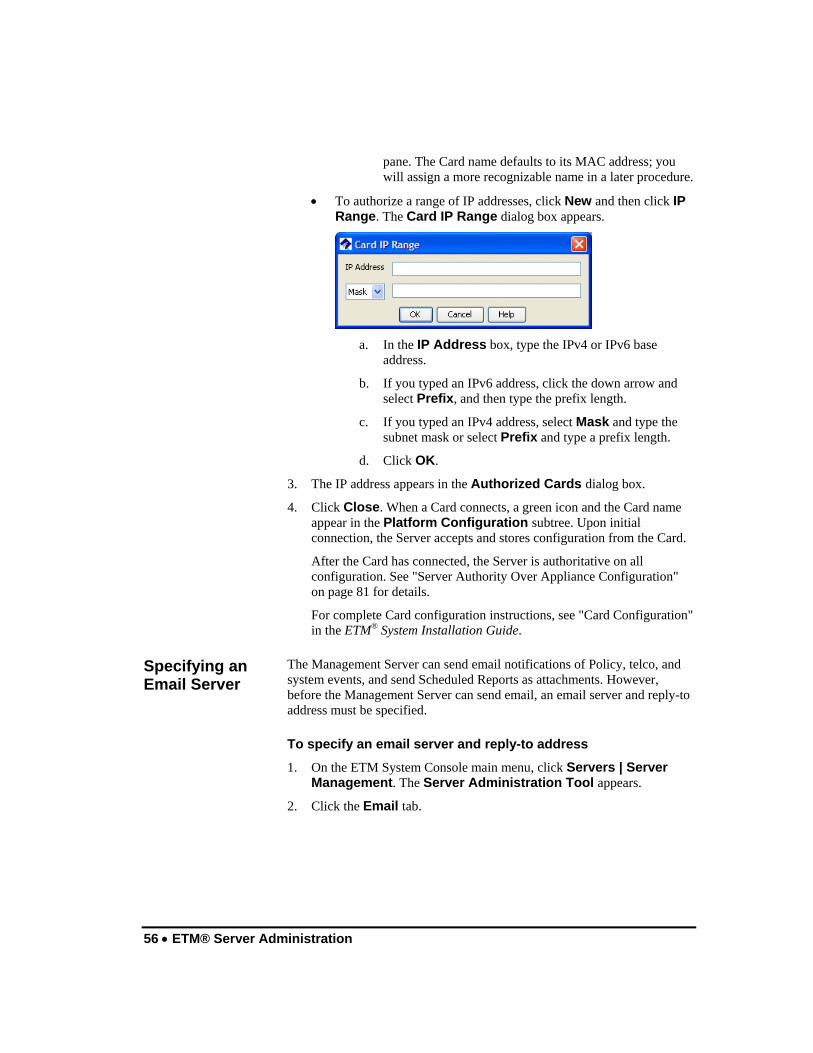
56 • ETM® Server Administration
pane. The Card name defaults to its MAC address; you will assign a more recognizable name in a later procedure.
• To authorize a range of IP addresses, click New and then click IP Range. The Card IP Range dialog box appears.
a. In the IP Address box, type the IPv4 or IPv6 base
address.
b. If you typed an IPv6 address, click the down arrow and select Prefix, and then type the prefix length.
c. If you typed an IPv4 address, select Mask and type the subnet mask or select Prefix and type a prefix length.
d. Click OK.
3. The IP address appears in the Authorized Cards dialog box.
4. Click Close. When a Card connects, a green icon and the Card name appear in the Platform Configuration subtree. Upon initial connection, the Server accepts and stores configuration from the Card.
After the Card has connected, the Server is authoritative on all configuration. See "Server Authority Over Appliance Configuration" on page 81 for details.
For complete Card configuration instructions, see "Card Configuration" in the ETM® System Installation Guide.
The Management Server can send email notifications of Policy, telco, and system events, and send Scheduled Reports as attachments. However, before the Management Server can send email, an email server and reply-to address must be specified.
To specify an email server and reply-to address
1. On the ETM System Console main menu, click Servers | Server Management. The Server Administration Tool appears.
2. Click the Email tab.
Specifying an Email Server
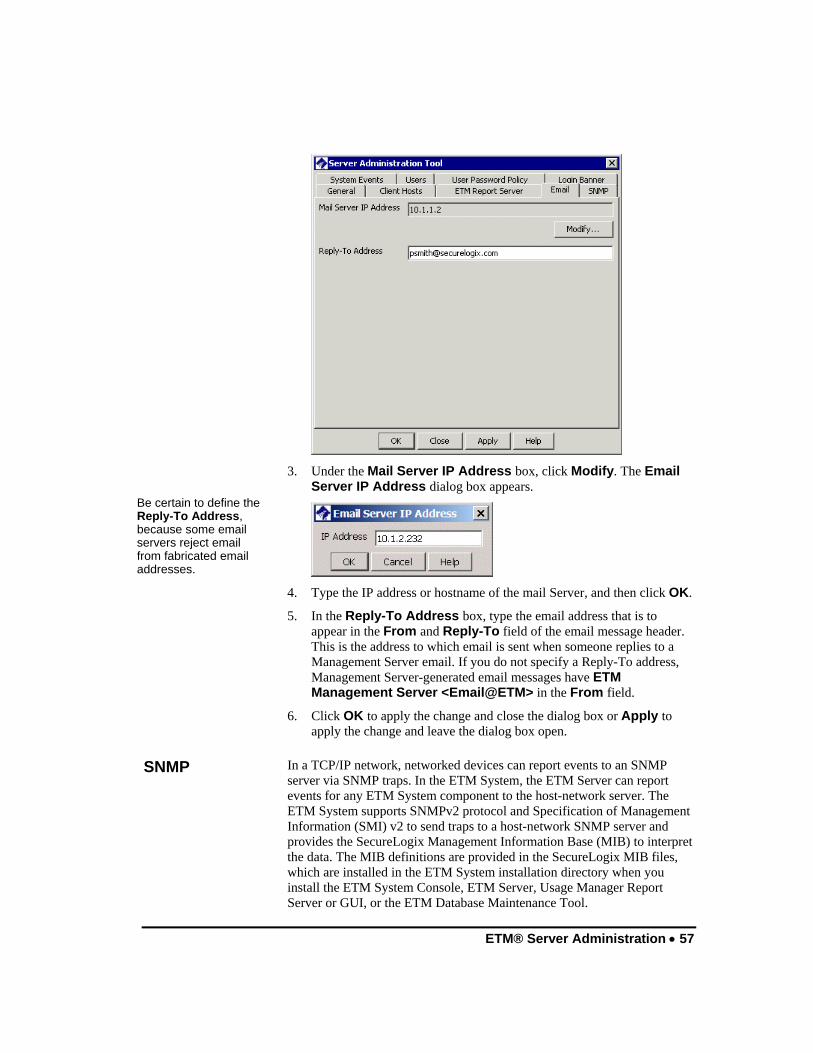
ETM® Server Administration • 57
3. Under the Mail Server IP Address box, click Modify. The Email
Server IP Address dialog box appears.
4. Type the IP address or hostname of the mail Server, and then click OK.
5. In the Reply-To Address box, type the email address that is to appear in the From and Reply-To field of the email message header. This is the address to which email is sent when someone replies to a Management Server email. If you do not specify a Reply-To address, Management Server-generated email messages have ETM Management Server <Email@ETM> in the From field.
6. Click OK to apply the change and close the dialog box or Apply to apply the change and leave the dialog box open.
In a TCP/IP network, networked devices can report events to an SNMP server via SNMP traps. In the ETM System, the ETM Server can report events for any ETM System component to the host-network server. The ETM System supports SNMPv2 protocol and Specification of Management Information (SMI) v2 to send traps to a host-network SNMP server and provides the SecureLogix Management Information Base (MIB) to interpret the data. The MIB definitions are provided in the SecureLogix MIB files, which are installed in the ETM System installation directory when you install the ETM System Console, ETM Server, Usage Manager Report Server or GUI, or the ETM Database Maintenance Tool.
Be certain to define the Reply-To Address, because some email servers reject email from fabricated email addresses.
SNMP

58 • ETM® Server Administration
The SecureLogix MIB files contain the traps and their descriptions used for ETM Server-generated SNMP traps. When a trap is sent, it is in the format 1.3.6.1.4.1.4790.3.1.1.3.0.9 and contains a text description of the trap; the format in which it appears on the receiving end depends on the configuration of your network's MIB manager. A prefix of 1.3.6.1.4.1.4790.3.1.1 indicates an SNMP trap in the SecureLogix ETM System private MIB; the numbers at the end of the sequence indicate the trap that was sent. For example, 1.3.6.1.4.1.4790.3.1.1.3.0.9 specifies that a Firewall Rule fired.
If you installed the ETM System in the default location, the path to the MIB files is:
Solaris
/opt/SecureLogix/ETM/SNMP Windows
C:\Program Files\SecureLogix\ETM\SNMP
For proper configuration, ask your network administrator to import the SecureLogix MIB files into the host network's SNMP manager.
The topics below describe the traps provided by the ETM System.
The following types of Policy-Rule-fired traps are provided: Firewall Policy Rule Fired, IPS Policy Rule Fired, and AAA Service Rule Fired.
Firewall Policy Rule Fired traps include:
• Call Information: Start Time, Direction, Call Label, Call Type, Status (allowed or terminated), Source (Name, Site, Department, Location), Destination (Name, Site, Department, Location)
• Span Name
• Switch
• Server Name
• Policy Information: Name, Rule Number, Rule Comment
The SecureLogix MIB
Rule Fired Traps

ETM® Server Administration • 59
AAA Service Rule Fired traps include:
• Call Information: Start Time, Direction, Call Label, Call Type, Status (allowed or terminated), Source (Name, Site, Department, Location), Destination (Name, Site, Department, Location)
• Span Name
• Switch
• Server Name
• Policy Information: Name, Rule Number, Rule Comment
• AAA username and user ID.
IPS Policy Rule Fired traps include:
• Server Name
• Policy Information: Name, Rule Number, Comment, Action
• Interval Information: Create Time, End Time, Current and Completed Count, Current and completed Duration, Current and Completed Cost, Threshold Count, Threshold Duration, and Threshold Cost
Four types of Diagnostic traps are provided: Management Server, Card, Span, and AAA Server. All of these traps contain the following information:
• Source—MAC address plus Span offset. Span offset for Spans is the Span number (1-4); for Cards, it is -1; and for AAA Services it is 0.
• Application type
• Management Server name
• Diagnostic type and subtype
• Timestamp
• Resource
• Description
Card Diagnostics also include Card name, Appliance, and Card model.
Span Diagnostics also include Span name, Span type, Appliance, Card model, Switch, and Span number (1-4).
AAA Service Diagnostics include AAA Server name, Appliance model, and AAA service comment.
Diagnostic Traps

60 • ETM® Server Administration
Before the Management Server can send SNMP traps, the IP address(es) of one or more SNMP network managers must be specified.
You can specify multiple SNMP Network Managers to receive ETM System traps. When an SNMP trap is generated, it is sent to all of the Network Managers listed in this dialog box.
To specify an SNMP Network Manager
1. On the ETM System Console main menu, click Servers | Server Management. The Server Administration Tool appears.
2. Click the SNMP tab.
3. Click New. The SNMP Network Manager dialog box appears.
4. Modify fields as needed for your Network Manager, and then click OK.
5. Repeat for additional Network Managers, if needed.
Specifying an SNMP Network Manager
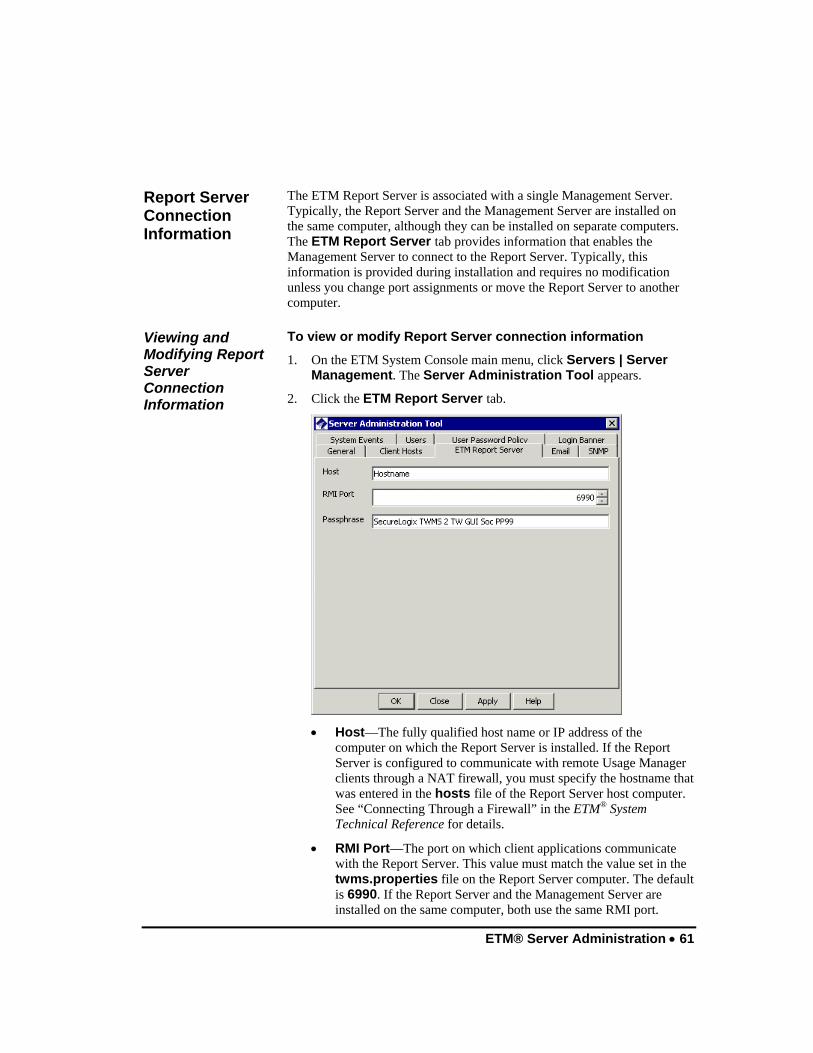
ETM® Server Administration • 61
The ETM Report Server is associated with a single Management Server. Typically, the Report Server and the Management Server are installed on the same computer, although they can be installed on separate computers. The ETM Report Server tab provides information that enables the Management Server to connect to the Report Server. Typically, this information is provided during installation and requires no modification unless you change port assignments or move the Report Server to another computer.
To view or modify Report Server connection information
1. On the ETM System Console main menu, click Servers | Server Management. The Server Administration Tool appears.
2. Click the ETM Report Server tab.
• Host—The fully qualified host name or IP address of the
computer on which the Report Server is installed. If the Report Server is configured to communicate with remote Usage Manager clients through a NAT firewall, you must specify the hostname that was entered in the hosts file of the Report Server host computer. See “Connecting Through a Firewall” in the ETM® System Technical Reference for details.
• RMI Port—The port on which client applications communicate with the Report Server. This value must match the value set in the twms.properties file on the Report Server computer. The default is 6990. If the Report Server and the Management Server are installed on the same computer, both use the same RMI port.
Report Server Connection Information
Viewing and Modifying Report Server Connection Information

62 • ETM® Server Administration
• Password—The DES key password for encrypted communication between the Usage Manager and the RMI registry. Initial communication is always encrypted to validate the connection. This DES key is specified in the twms.properties file on the Report Server computer, in the section labeled RegistryPassword. If the Report Server and the Management Server are installed on the same computer, both use the same RMI password.
Log types include the following:
• Appliance debug Logs, stored on the Management Server’s hard drive, are only created if enabled for troubleshooting system issues.
• Call records, stored in the database, contain telecommunications monitoring and Firewall Policy processing data.
• Diagnostic records, stored in the database, contain messages relating to ETM System and telecom operation.
• Error logs, stored on the Management Server's hard drive, contain records of system and user errors.
• IPS records, stored in the database, contain IPS Policy processing data.
• SMDR debug logs, stored on the Management Server's hard drive, are only created if enabled for troubleshooting SMDR resolution issues.
By default, the ETM System stores data permanently, with the only size limit being the amount of disk space available on the computer where the data is stored, or settings you have defined in your ETM Database to limit the size. However, you can specify log storage limits for call, IPS, error, and diagnostic logs and enable the ETM System to automatically adjust data storage according to the limits you specify.
SMDR debug and Appliance debug event logs cannot be automatically purged; when they are no longer needed, they should be manually deleted. See "Accessing an ETM® Server File from the ETM® Client" on page 69 for instructions for remotely deleting the unneeded files. The contents of these logs are described in "Error and Debug Logs" in the ETM® System Technical Reference.
Log Management
The Oracle DBMS provides settings that can control database size. Refer to your Oracle documentation for information.

ETM® Server Administration • 63
SMDR debug logging can be used for configuring the ETM System to use SMDR data and for troubleshooting SMDR resolution issues. When enabled, SMDR debug logging captures SMDR data and debugging information in a file on the hard drive of the Server computer. By default, SMDR information for all configured Switches is captured in a single file named SMDR_DEBUG.txt. Each message is prefixed with a timestamp and the Server name. Optionally, you can cause a separate file to be created for each configured Switch, to ease troubleshooting. For instructions for generating a separate file per Switch, see “Enabling a Separate SMDR Debug Log per Switch” on page 49.
By default, SMDR debug files are located at the following path:
Solaris
/opt/SecureLogix/ETM/ps/debug Windows
C:\Program Files\SecureLogix\ETM\ps\debug
To enable/disable SMDR debug logging
1. On the ETM System Console main menu, click Servers | Server Management. The Server Administration Tool appears.
Enabling SMDR Debug Logging

64 • ETM® Server Administration
2. On the General tab, in the SMDR Debugging area:
• Select the Enabled check box to capture raw SMDR data.
• Clear the Enabled check box when you no longer need to store the data, so that it does not unnecessarily consume hard drive space.
3. Click OK to apply the setting and close the dialog box, or Apply to apply the setting and leave the dialog box open.
4. SMDR data and debugging information is captured and stored until you disable this setting.
For instructions for viewing this log file from the ETM Client, see "Accessing an ETM® Server File from the ETM® Client" on page 69.
See "Reading the SMDR Debug Log" in the ETM® System Technical Reference for details about the contents of the log.
To view current log storage
1. On the ETM System Console main menu, click Servers | Server Management. The Server Administration Tool appears.
2. Click the General tab, if not already selected.
3. In the Log type box, click the down arrow, and then click the type of log for which you want to view information: IPS Records, Error Logs, Call Records, or Diagnostic Records. The area below the box changes to reflect the type of log selected.
4. Click Update. The information is updated.
• For call, IPS, and diagnostic logs, the date and time of the earliest record and the total record count are shown.
• For error logs, the date of the earliest log file and the cumulative log size in MB are shown.
By default, the Management Server stores log data permanently, with the only size limit being the amount of disk space available. However, you can allow the ETM System to automatically delete old logs according to storage limits you specify. When enabled, purging occurs daily at midnight.
To set data storage limits
1. On the ETM System Console main menu, click Servers | Server Management. The Server Administration Tool appears, as shown on the next page.
2. Click the General tab.
Viewing Current Log Storage
Enabling Automatic Purging of Logs
SMDR debug and Appliance debug logs cannot be automatically purged; they should be manually deleted when no longer needed.

ETM® Server Administration • 65
3. In the Log type box, click the down arrow, and then click the type of
log for which you want to enable automatic purging: IPS Records, Error Records, Call Records, or Diagnostic Logs. The area below changes to reflect information specific to the selected log type. Settings you make in this area apply only to the selected log type. No other data store is affected.
4. Select the Enable automated purging check box.
5. Do one of the following:
• For Call, IPS, or Diagnostic data storage, do one of the following:
- To specify purging based only on a previous amount of data to retain, select Retain the last and then specify a count and a unit. For example, to retain the last year's data, select 1 and year(s). This results in a sliding window of data from the current date.
- To specify purging based on both a current and previous amount of data to retain: Select Retain the current... and then select the unit (day, week, month, or year). Then select how many historical instances of that same unit to retain. For example, you might specify "Retain the current month and the previous 12 months." When determining the dates for purging, the same values are used as those used in Retrieval Ranges in Usage Manager Reports: call data is based on End Time, Diagnostic data is based on Event Time, and IPS data is based on Complete Time.
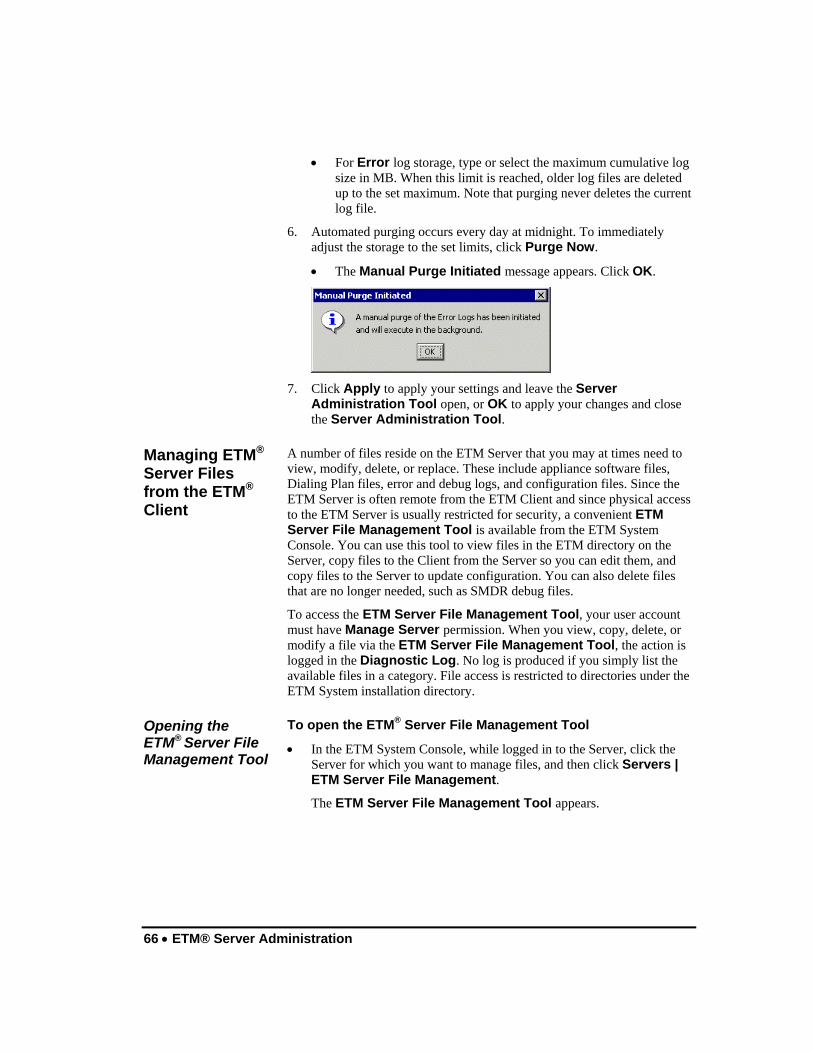
66 • ETM® Server Administration
• For Error log storage, type or select the maximum cumulative log size in MB. When this limit is reached, older log files are deleted up to the set maximum. Note that purging never deletes the current log file.
6. Automated purging occurs every day at midnight. To immediately adjust the storage to the set limits, click Purge Now.
• The Manual Purge Initiated message appears. Click OK.
7. Click Apply to apply your settings and leave the Server
Administration Tool open, or OK to apply your changes and close the Server Administration Tool.
A number of files reside on the ETM Server that you may at times need to view, modify, delete, or replace. These include appliance software files, Dialing Plan files, error and debug logs, and configuration files. Since the ETM Server is often remote from the ETM Client and since physical access to the ETM Server is usually restricted for security, a convenient ETM Server File Management Tool is available from the ETM System Console. You can use this tool to view files in the ETM directory on the Server, copy files to the Client from the Server so you can edit them, and copy files to the Server to update configuration. You can also delete files that are no longer needed, such as SMDR debug files.
To access the ETM Server File Management Tool, your user account must have Manage Server permission. When you view, copy, delete, or modify a file via the ETM Server File Management Tool, the action is logged in the Diagnostic Log. No log is produced if you simply list the available files in a category. File access is restricted to directories under the ETM System installation directory.
To open the ETM® Server File Management Tool
• In the ETM System Console, while logged in to the Server, click the Server for which you want to manage files, and then click Servers | ETM Server File Management.
The ETM Server File Management Tool appears.
Managing ETM® Server Files from the ETM® Client
Opening the ETM® Server File Management Tool
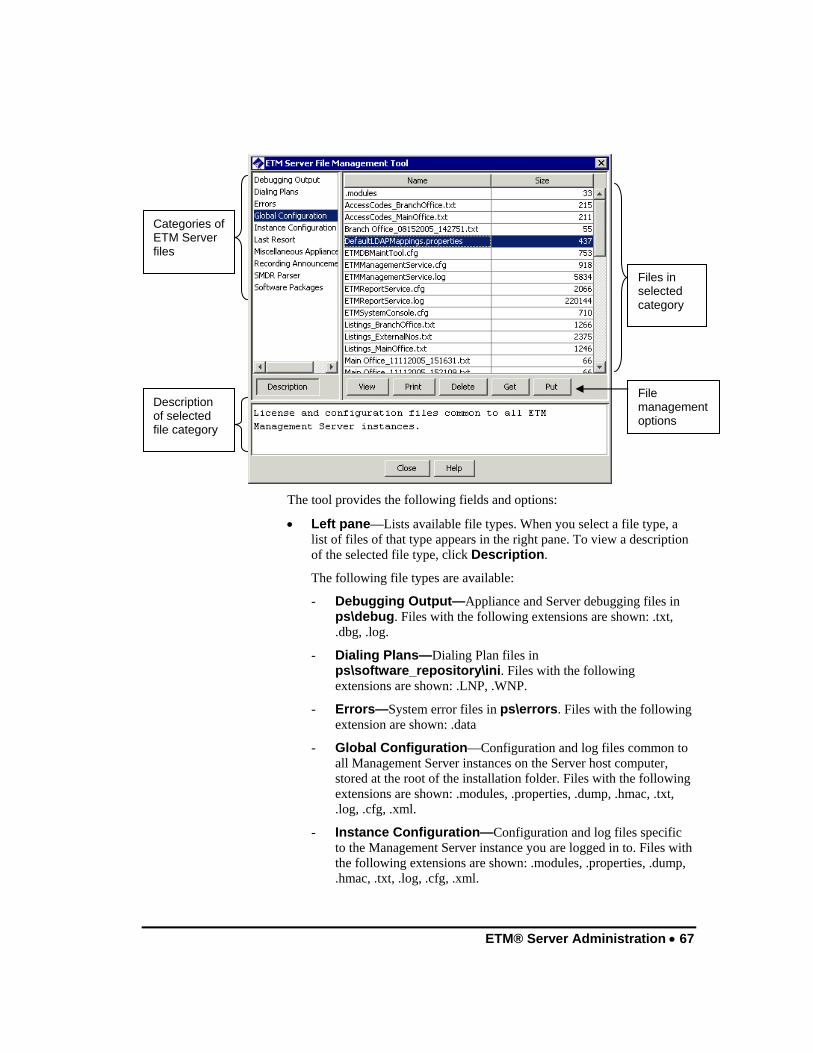
ETM® Server Administration • 67
The tool provides the following fields and options:
• Left pane—Lists available file types. When you select a file type, a list of files of that type appears in the right pane. To view a description of the selected file type, click Description.
The following file types are available:
- Debugging Output—Appliance and Server debugging files in ps\debug. Files with the following extensions are shown: .txt, .dbg, .log.
- Dialing Plans—Dialing Plan files in ps\software_repository\ini. Files with the following extensions are shown: .LNP, .WNP.
- Errors—System error files in ps\errors. Files with the following extension are shown: .data
- Global Configuration—Configuration and log files common to all Management Server instances on the Server host computer, stored at the root of the installation folder. Files with the following extensions are shown: .modules, .properties, .dump, .hmac, .txt, .log, .cfg, .xml.
- Instance Configuration—Configuration and log files specific to the Management Server instance you are logged in to. Files with the following extensions are shown: .modules, .properties, .dump, .hmac, .txt, .log, .cfg, .xml.
Categories of ETM Server files
Description of selected file category
Files in selected category
File management options
68 • ETM® Server Administration
- Last Resort—Last resort support files in ps\software_repository\last_resort. All files in the directory are shown.
- Miscellaneous Appliance Files—Files in ps\software_repository\misc. All files in the directory are shown.
- Recording Announcements—Call recording announcements in ps\software_repository\wav_announce. Files with the following extension are shown: .wav.
- SMDR Parser—SMDR parse files in ps\software_repository\smdr. Files with the following extension are shown: .txt.
- Software Packages—Card software packages in ps\software_repository\package. Files with the following extension are shown: .pkg.
• Description—Works as a toggle to show or hide a description of the file type selected in the left pane.
• Right pane—Displays the list of available files of the type selected in the left pane; shows name and size of each file. When you select a file in the list, the option buttons below the pane become active. Not all options apply to all files; only applicable options become available.
- View—Loads the selected file into a viewing window for inspection, if the file is a viewable type. You cannot edit the file in this window, but you can print it or save it to a disk drive location from which you can open and edit it. Files with the following extensions are considered text and are therefore viewable: .txt, .log, .xml, .properties, .WNP, .LNP, .data, .dump, .modules. See also Put and Get.
- Print— Prints the contents of the selected file, if the file is a viewable type. See View above for a list of viewable file types.
- Delete—Deletes the selected file from the Server.
- Get—Retrieves the selected file and opens the Save File As dialog box for you to browse to a location to save a copy of the file. After you have saved it, you can edit the copy and then use Put to copy the edited file to the Server.
- Put—Opens the Select File to Transfer dialog box for you to browse for and select a file, and then copies the file to the directory on the ETM Server represented by the selection in the left pane.
• Close—Closes the dialog box.
• Help—Opens the context-sensitive Help topic for the dialog box.

ETM® Server Administration • 69
Some instructions below refer to "viewable file types." Viewable files are those expected to be text. Files with the following extensions are considered text and are therefore viewable: .txt, .log, .xml, .properties, .WNP, .LNP, .data, .dump, .modules.
To access an ETM Server file from the ETM Client
1. Open the ETM Server File Management Tool.
2. In the left pane, click the category of file. A list of the files in that category appears in the right pane. The size of each file is also shown.
3. In the right pane, click the file you want to access. The applicable option buttons become available.
• (Viewable file types only) To view the file contents, click View. The file is transferred to the ETM Client and appears in the File Viewer. This viewer is read only.
- If you want to edit the file, save a copy to disk by clicking the Save icon.
- To print it or save a copy to disk on the Client, click the applicable icon.
• (Viewable file types only) To print the file, click Print.
Accessing an ETM® Server File from the ETM® Client

70 • ETM® Server Administration
• To delete the selected file, click Delete. The file is permanently deleted from the Server. WARNING If you delete a system file, system operation will be impaired or disabled. You cannot delete the .jar files.
• To copy the file to the ETM Client, click Get. A Save File As dialog box appears for you to select the location to which to save the file. Browse to the location and then click Save.
To edit an ETM Server file from the ETM Client
1. In the ETM Server File Management Tool, select the file you want to edit.
2. Click Get. The Save File As dialog box appears.
3. Browse for the location on the Client where you want to save the file, and then click Save. The file is copied from the Server to the Client.
4. Open the saved file and edit as needed, and then save the file.
5. In the ETM Server File Management Tool, click the file type in the left pane, and then click Put. The Select File to Transfer dialog box appears.
6. Browse for and select the file you edited, and then click Put.
- If the file has the same name as an existing file on the ETM Server, a Confirm File Overwrite message appears. Click Yes.
7. The file is copied to the Server. When complete, a Transfer Complete message appears. Click OK.
To copy a file to the ETM Server from the ETM Client
1. Open the ETM Server File Management Tool.
2. In the left pane, click the file type, and then click Put. The Select File to Transfer dialog box appears.
3. Browse for and select the file you want to copy to the Server, and then click Put.
- If the file has the same name as an existing file on the ETM Server, a Confirm File Overwrite message appears. Click Yes.
4. The file is copied to the Server location selected in the left pane. When complete, a Transfer Complete message appears. Click OK.
Editing an ETM® Server File from the ETM® Client
Copying a File to the ETM® Server from the ETM® Client

ETM® Server Administration • 71
The ETM Server must be connected to the ETM Database to actively function. Should communication between the ETM Server and the Database be temporarily interrupted (for example, if the Database computer is rebooted or an unexpected Oracle error occurs), the ETM Server enters standby mode. While in standby mode, the ETM Server periodically attempts to reinitialize at a user-definable interval (by default, every 60 seconds) until the Database is again available.
If you are logged in to the ETM Server when it enters standby mode, an error message similar to the following appears:
• To read a detailed description of the event that caused the ETM Server
to enter standby mode, click Details. This information is also written to the System Error log in the ETM Server installation directory at the following path:
<install_dir>\ps\errors
• Click OK to close the message dialog box.
If you attempt to log in to the ETM Server while it is in standby mode, you are presented with one of two messages, depending on whether you have the Manage Server user permission.
• If you have Manage Server permission, an error message similar to the following appears:
- To read a detailed description of the event that caused the ETM
Server to enter standby mode, click Details. This information is also written to the System Error log in the ETM Server installation directory.
Standby Mode
See "Variables in the twms.properties File" in the ETM® System Technical Reference for instructions for modifying this value.

72 • ETM® Server Administration
- To attempt to manually restart the ETM Server, click Yes. The Login dialog box appears. Attempt to log in as usual. If the issue that caused the ETM Server to enter standby mode is resolved and the ETM Server has restarted, and then login succeeds. If the issue has not yet resolved, the above error message appears again. Wait a few minutes and attempt to log in again. In either case, inform your ETM System administrator.
- To allow the ETM Server to attempt to automatically reinitialize at the reinitialization interval, click No. Wait 60 seconds and attempt to login again.
• If you do not have Manage Server permission, an error message similar to the following appears:
- To read a detailed description of the event that caused the ETM
Server to enter standby mode, click the Details button. This information is also written to the System Error log in the ETM Server installation directory.
- Click OK. Wait at least 60 seconds and attempt to log in again. If the issue has been resolved that caused the ETM Server to enter standby mode, login succeeds. Inform your ETM System administrator.
- If you continue to be unable to log in, contact your ETM System administrator so he or she can determine the cause of the extended disconnection.
IMPORTANT Certain Oracle database errors cause the Management Server to terminate rather than enter standby mode. These errors, which must be evaluated and corrected by your ETM System administrator or Oracle database administrator, include the following:
ORA-600 ORA-602 ORA-18
ORA-601 ORA-1000 ORA-604
Fatal Oracle Errors (No Standby Mode)

ETM® Server Administration • 73
By default, several potentially sensitive values that the ETM Server needs for initialization are stored in clear text in the twms.properties file in the ETM Server installation directory. These include the database passphrase and the DES Key passphrases. Since access to the ETM Server should be limited by physical security measures, such as housing the Server host computer in a secure server closet, many organizations do not need these values to be encrypted.
However, some organizations prefer to encrypt these values. For example, one group in the organization may control database access while another group provides server management functions, and the database management group may not want the database connection information available to the server management group.
For organizations that prefer to encrypt the values, the ETM System provides an encryption utility in a shell script called SecureConfig..
To encrypt the passphrases in the twms.properties file
1. Open a command prompt and navigate to the directory that contains the twms.properties file you want to encrypt.
• To encrypt the global twms.properties file, run the script from the root of the ETM System installation directory.
• To encrypt an instance-specific file, run the utility from the ps_<instance_name> directory.
2. Execute SecureConfig:.
• On Windows, at the prompt, type: secureconfig twms.properties
• On Solaris, type: ./SecureConfig.sh twms.properties
3. The script executes and encrypts the passphrase values in the twms.properties file, as shown in the illustration below.
Encrypting Values in the twms.properties File
Encrypting the Passphrases
74 • ETM® Server Administration
Encrypted values are denoted in the file by the word "Encrypted." For example, an encrypted database passphrase is shown below.
## The passphrase to log into the database
DatabasePassphrase=ENCRYPTED_66b8753de0e89f
When you run the utility, an Encryption Hash Key is produced that is then used in the encryption. If you would rather use a hash key you provide instead of the generated one, type the following line at the end of the twms.properties file before running the utility:
EncryptionHashKey=<hash_key>
where <hash_key> is a text string. A length of 32 characters is suggested, although strings of 1 or greater can be processed.
If you need to modify the value for an encrypted passphrase, simply delete the current value, beginning with the word "ENCRYPTED," and type a new value, and then rerun the encryption utility. Only values that are currently unencrypted are affected by the utility. Those that are already encrypted are not changed.
Encryption Hash Key
Modifying an Encrypted Passphrase

ETM® Database Administration • 75
ETM® Database Administration
Managing Database Scheduled Tasks When the ETM® database and data instance(s) are created, several important tasks are automatically scheduled to run at default intervals. You can use the ETM Database Maintenance Tool to change the frequency of these tasks or force them to run immediately at a time other than when scheduled.
The ETM Database Maintenance Tool is typically installed on the ETM Server computer, but can also be installed on any computer where a remote ETM System Console is installed. For installation instructions, see "Installing the ETM Software" in the ETM® System Installation Guide.
The ETM Database Maintenance Tool can also be used to perform other more technical database administration tasks. These tasks are discussed in the ETM® System Technical Reference.
To open the ETM® Database Maintenance Tool
• Do one of the following:
Windows: Click Start | Programs | SecureLogix | ETM System Software| Utilities | ETM Database Maintenance Tool
Solaris: Execute the following script, located in the ETM software installation directory on the computer where the ETM Database Maintenance Tool is installed: ETMDBMaintTool
The ETM Database Maintenance Tool appears.
Opening the ETM® Database Maintenance Tool
For instructions for creating an ETM Database object, see "Creating a Database Object" in the ETM® System Technical Reference.

76 • ETM® Database Administration
To log in to the ETM® Database via the ETM® Database Maintenance Tool
1. In the Databases node of the ETM Database Maintenance Tool, right-click the database, and then click Connect. The Login dialog box appears.
2. In the Username box, type the username with which the ETM Server
connects to the database.
3. In the Password box, type the password for the database username.
4. Click OK.
The ETM Database Maintenance Tool connects to the database and verifies each of the tables in the database. When verification is complete, an icon appears next to each table, indicating its status.
Icon Meaning
Indicates the table is valid.
Indicates an error in the table. Right-click the table, and then click Repair Table to correct the problem.
Indicates a missing expected table. Right-click the table, and then click Create Table to create the table.
Indicates an unknown table. These are typically temporary tables created during database operation, or tables created by DBAs rather than by the ETM System. These do not represent an invalid Database state and does not impair system operation. Contact SecureLogix Customer Support before deleting any tables.
Indicates views and temporary tables created and managed by the ETM Management Server.
To disconnect from a Database
• Right-click the applicable database in the Databases tree, and then click Disconnect.
Logging in to the ETM® Database via the ETM® Database Maintenance Tool
Disconnecting from a Database

ETM® Database Administration • 77
When the ETM database and data instance are created, several scheduled tasks are created and scheduled to execute periodically. The execution of these tasks greatly improves database performance and efficiency. Some of the tasks are global and apply to the database as a whole (statistics calculation and index maintenance), while others apply to each instance (partitioning). You cannot delete these tasks, but you can change the start time at which they first run and the schedule at which they execute. You can also manually force them to run at a specific time and disable them to prevent them from running as scheduled (not recommended during normal operation).
Use this procedure to view both global and Instance-specific scheduled tasks for the database and all of its data Instances. To view tasks only for a specific Data Instance, see "Viewing Tasks for a Specific Instance" on page 78.
To view all scheduled tasks for a Database
• While logged into the Database, in the Databases node of the ETM Database Maintenance Tool, right-click the database, and then click View all Tasks. The All Scheduled Tasks dialog box appears.
Each row in the dialog box represents one scheduled task. To sort the dialog box according to a specific field, click the field name. The direction of the arrow indicated the sort direction (ascending or descending). For each scheduled task, the following information is provided:
• Enabled—Whether the task is enabled to run.
• Instance—The name of the instance to which the task applies. <GLOBAL> means the task applies to all instances.
• Task—The name of the task.
• Start Date—The first date and time the task is to/was run.
• Interval—The frequency at which the task is to run.
• Job Number—A number assigned to the task by Oracle.
Scheduled Tasks
Viewing All Tasks for a Database
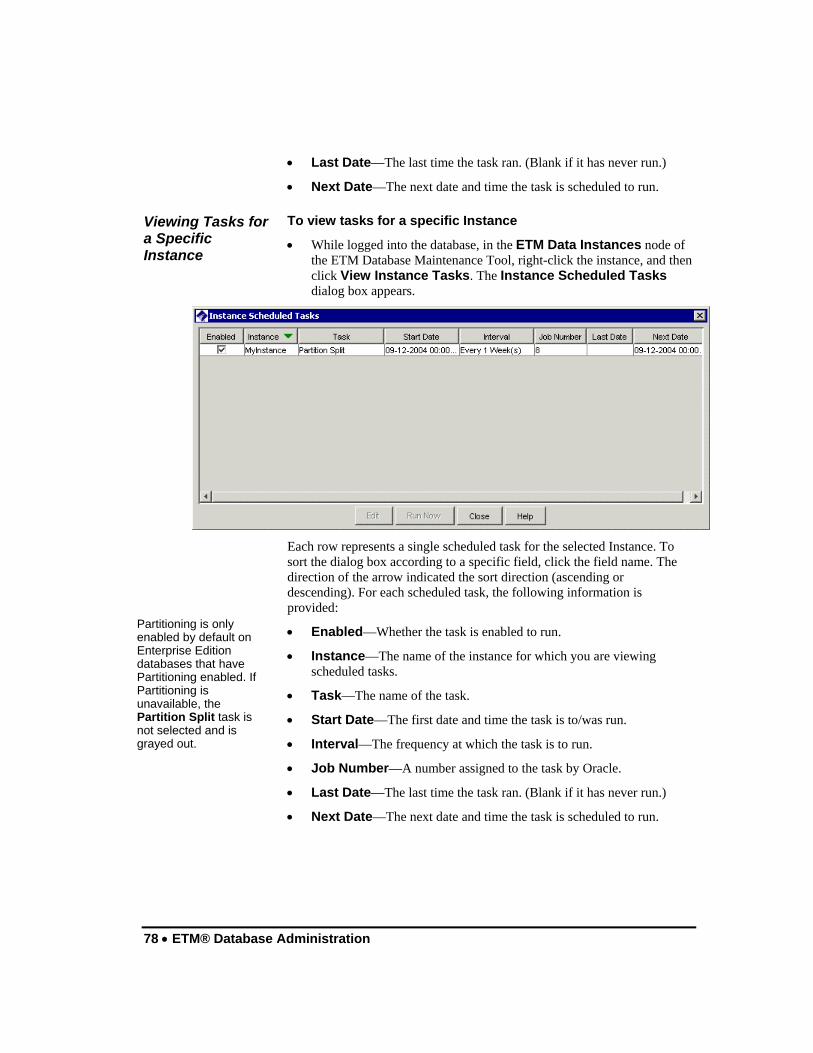
78 • ETM® Database Administration
• Last Date—The last time the task ran. (Blank if it has never run.)
• Next Date—The next date and time the task is scheduled to run.
To view tasks for a specific Instance
• While logged into the database, in the ETM Data Instances node of the ETM Database Maintenance Tool, right-click the instance, and then click View Instance Tasks. The Instance Scheduled Tasks dialog box appears.
Each row represents a single scheduled task for the selected Instance. To sort the dialog box according to a specific field, click the field name. The direction of the arrow indicated the sort direction (ascending or descending). For each scheduled task, the following information is provided:
• Enabled—Whether the task is enabled to run.
• Instance—The name of the instance for which you are viewing scheduled tasks.
• Task—The name of the task.
• Start Date—The first date and time the task is to/was run.
• Interval—The frequency at which the task is to run.
• Job Number—A number assigned to the task by Oracle.
• Last Date—The last time the task ran. (Blank if it has never run.)
• Next Date—The next date and time the task is scheduled to run.
Viewing Tasks for a Specific Instance
Partitioning is only enabled by default on Enterprise Edition databases that have Partitioning enabled. If Partitioning is unavailable, the Partition Split task is not selected and is grayed out.
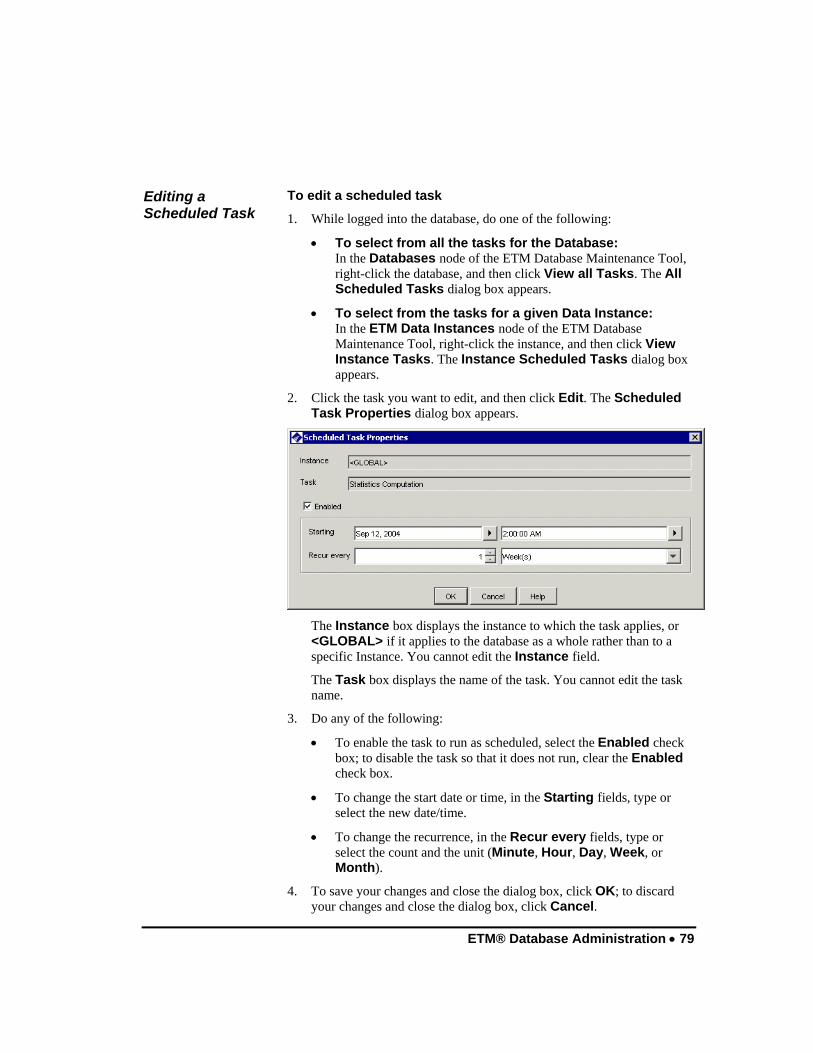
ETM® Database Administration • 79
To edit a scheduled task
1. While logged into the database, do one of the following:
• To select from all the tasks for the Database: In the Databases node of the ETM Database Maintenance Tool, right-click the database, and then click View all Tasks. The All Scheduled Tasks dialog box appears.
• To select from the tasks for a given Data Instance: In the ETM Data Instances node of the ETM Database Maintenance Tool, right-click the instance, and then click View Instance Tasks. The Instance Scheduled Tasks dialog box appears.
2. Click the task you want to edit, and then click Edit. The Scheduled Task Properties dialog box appears.
The Instance box displays the instance to which the task applies, or <GLOBAL> if it applies to the database as a whole rather than to a specific Instance. You cannot edit the Instance field.
The Task box displays the name of the task. You cannot edit the task name.
3. Do any of the following:
• To enable the task to run as scheduled, select the Enabled check box; to disable the task so that it does not run, clear the Enabled check box.
• To change the start date or time, in the Starting fields, type or select the new date/time.
• To change the recurrence, in the Recur every fields, type or select the count and the unit (Minute, Hour, Day, Week, or Month).
4. To save your changes and close the dialog box, click OK; to discard your changes and close the dialog box, click Cancel.
Editing a Scheduled Task
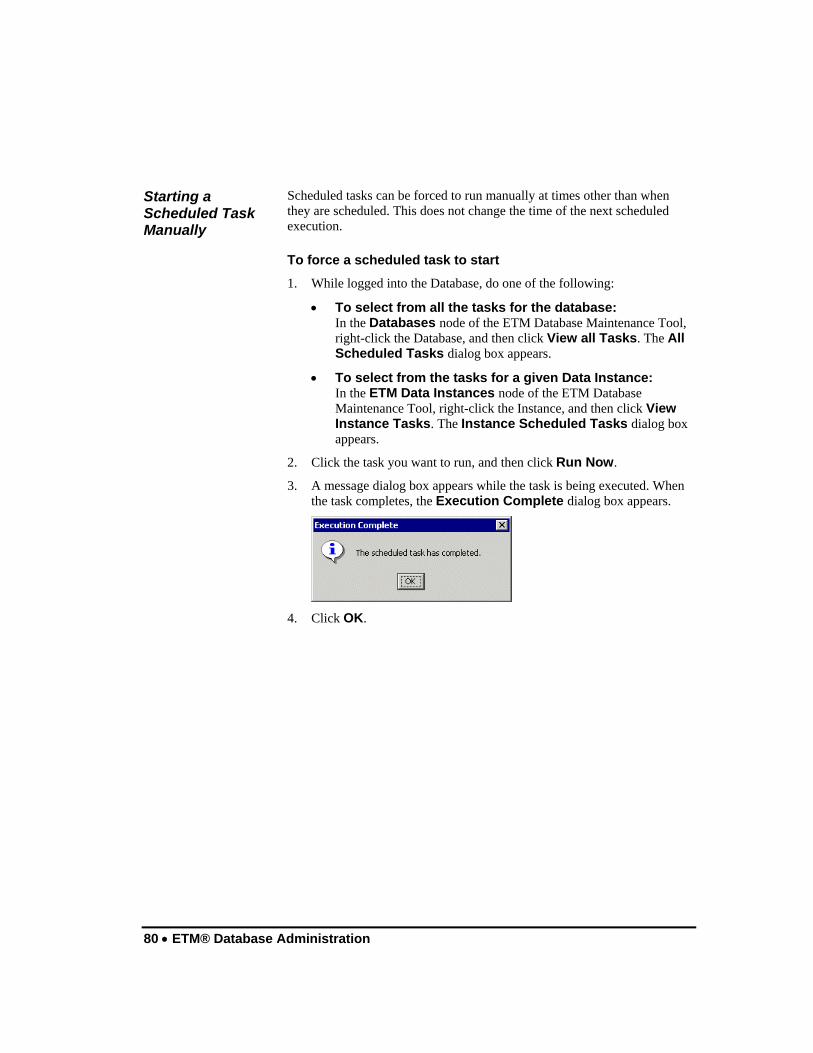
80 • ETM® Database Administration
Scheduled tasks can be forced to run manually at times other than when they are scheduled. This does not change the time of the next scheduled execution.
To force a scheduled task to start
1. While logged into the Database, do one of the following:
• To select from all the tasks for the database: In the Databases node of the ETM Database Maintenance Tool, right-click the Database, and then click View all Tasks. The All Scheduled Tasks dialog box appears.
• To select from the tasks for a given Data Instance: In the ETM Data Instances node of the ETM Database Maintenance Tool, right-click the Instance, and then click View Instance Tasks. The Instance Scheduled Tasks dialog box appears.
2. Click the task you want to run, and then click Run Now.
3. A message dialog box appears while the task is being executed. When the task completes, the Execution Complete dialog box appears.
4. Click OK.
Starting a Scheduled Task Manually
ETM® Platform Administration • 81
ETM® Platform Administration
Administering the ETM® Platform You can and should perform most Appliance configuration and monitoring tasks from the Performance Manager. Direct access to the Appliances is not necessary. In fact, since the ETM Server is authoritative on configuration settings, most configuration changes are not retained unless they are performed from the Performance Manager, as explained below.
Note that Appliance components are configured during installation and most settings should not be changed unless you are instructed to do so by SecureLogix Customer Support. Improper Card or Span settings may impair call monitoring, prevent Policy processing, and degrade or prevent proper signal traffic.
Instructions are provided below for settings that you may need to change at some time (such as installing a new Dialing Plan that addresses a change to your calling area or installing an upgrade version of Card software). If you are installing a new Card, detailed instructions for complete Card and Span configuration are provided in the ETM® System Installation Guide.
For AAA Appliance configuration and status information, see the Voice Firewall User Guide and online Help.
For CRC and recording configuration information, see the Call Recorder User Guide and online Help.
After Cards and Spans have initially established communication with their owning Management Server, the Server stores a copy of the component’s configuration and is authoritative over all configuration settings. This means that each time the Card or Span connects to the Server, the Server determines whether the component’s configuration matches the copy stored on the Server. If they differ, the Server automatically pushes its copy of the configuration settings to the Card or Span.
Since the Server is authoritative, if you change a component's configuration via the Console port on the Card or via Telnet, the changes are overwritten the next time the component connects to the Server.
You can make permanent changes to configuration settings using the Performance Manager. When you save your changes, they are automatically pushed to the component.
Server Authority Over Appliance Configuration
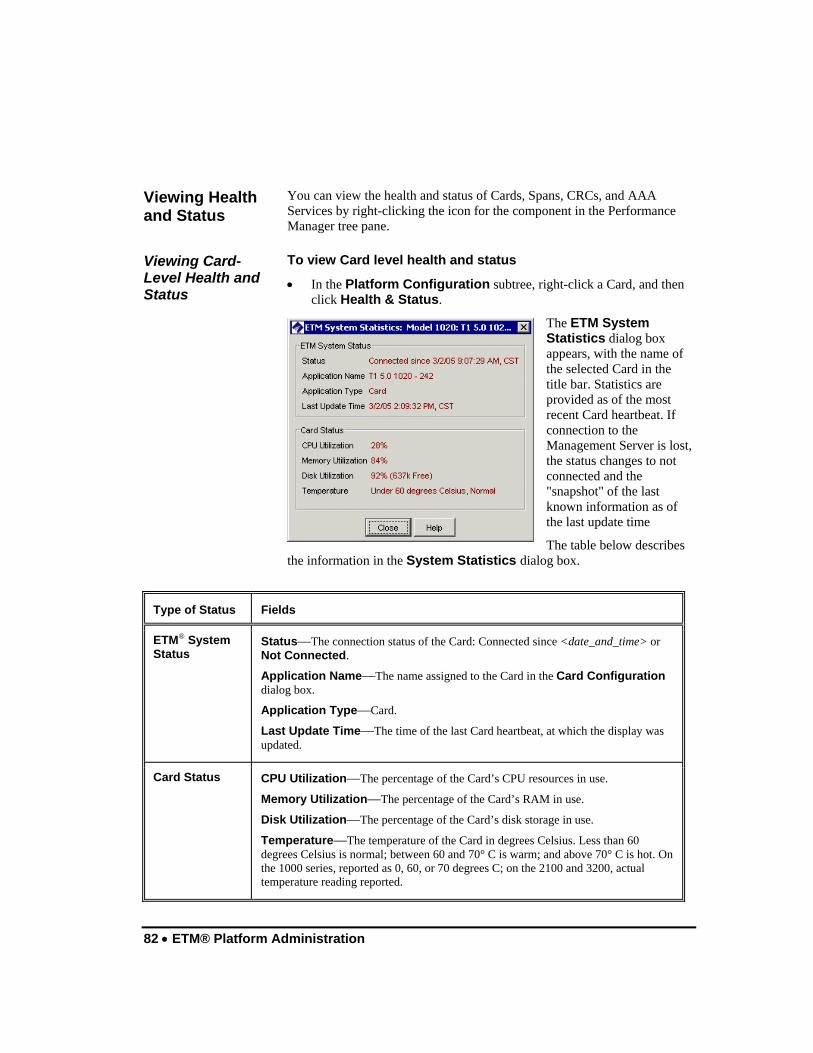
82 • ETM® Platform Administration
You can view the health and status of Cards, Spans, CRCs, and AAA Services by right-clicking the icon for the component in the Performance Manager tree pane.
To view Card level health and status
• In the Platform Configuration subtree, right-click a Card, and then click Health & Status.
The ETM System Statistics dialog box appears, with the name of the selected Card in the title bar. Statistics are provided as of the most recent Card heartbeat. If connection to the Management Server is lost, the status changes to not connected and the "snapshot" of the last known information as of the last update time
The table below describes the information in the System Statistics dialog box.
Type of Status Fields
ETM® System Status
Status—The connection status of the Card: Connected since <date_and_time> or Not Connected.
Application Name—The name assigned to the Card in the Card Configuration dialog box.
Application Type—Card.
Last Update Time—The time of the last Card heartbeat, at which the display was updated.
Card Status CPU Utilization—The percentage of the Card’s CPU resources in use.
Memory Utilization—The percentage of the Card’s RAM in use.
Disk Utilization—The percentage of the Card’s disk storage in use.
Temperature—The temperature of the Card in degrees Celsius. Less than 60 degrees Celsius is normal; between 60 and 70° C is warm; and above 70° C is hot. On the 1000 series, reported as 0, 60, or 70 degrees C; on the 2100 and 3200, actual temperature reading reported.
Viewing Health and Status
Viewing Card-Level Health and Status
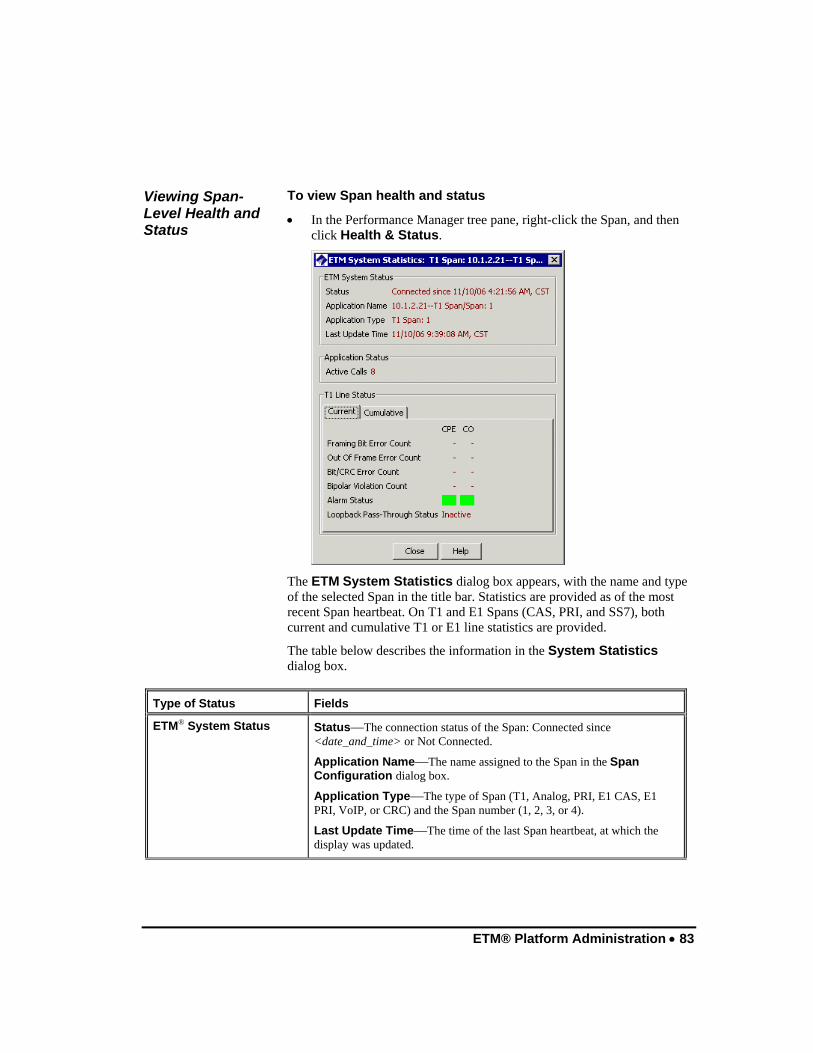
ETM® Platform Administration • 83
To view Span health and status
• In the Performance Manager tree pane, right-click the Span, and then click Health & Status.
The ETM System Statistics dialog box appears, with the name and type of the selected Span in the title bar. Statistics are provided as of the most recent Span heartbeat. On T1 and E1 Spans (CAS, PRI, and SS7), both current and cumulative T1 or E1 line statistics are provided.
The table below describes the information in the System Statistics dialog box.
Type of Status Fields
ETM® System Status Status—The connection status of the Span: Connected since <date_and_time> or Not Connected.
Application Name—The name assigned to the Span in the Span Configuration dialog box.
Application Type—The type of Span (T1, Analog, PRI, E1 CAS, E1 PRI, VoIP, or CRC) and the Span number (1, 2, 3, or 4).
Last Update Time—The time of the last Span heartbeat, at which the display was updated.
Viewing Span-Level Health and Status
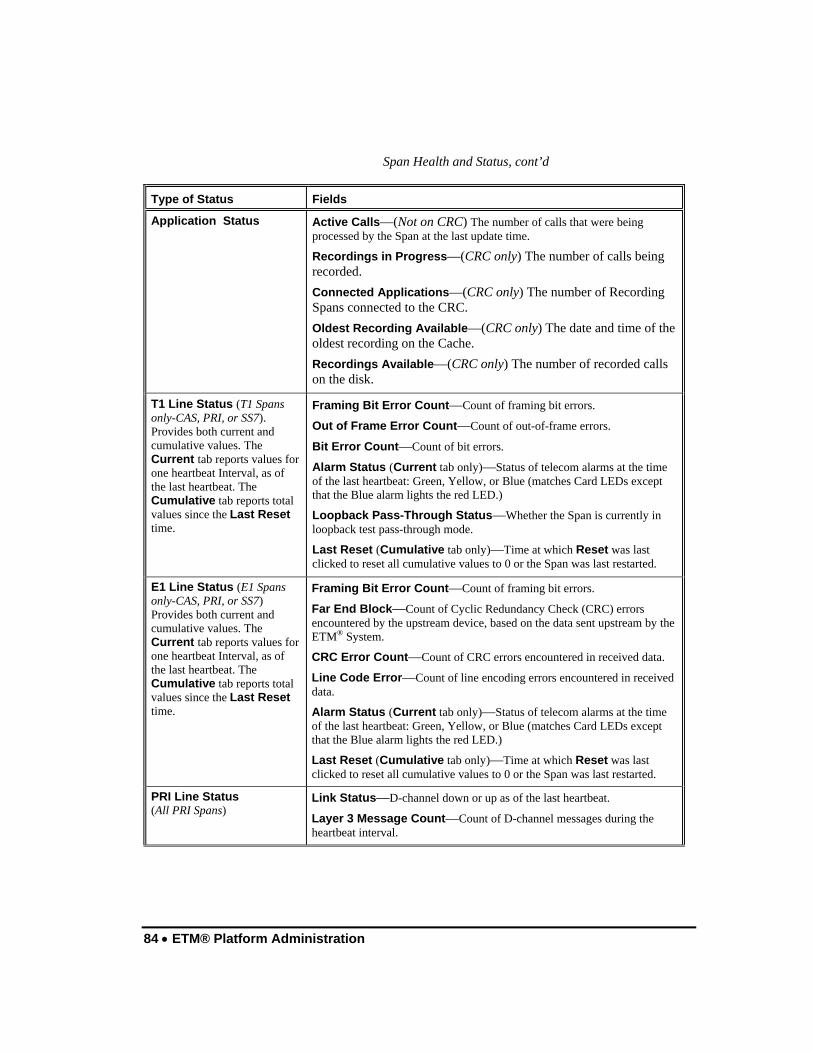
84 • ETM® Platform Administration
Span Health and Status, cont’d
Type of Status Fields
Application Status Active Calls—(Not on CRC) The number of calls that were being processed by the Span at the last update time.
Recordings in Progress—(CRC only) The number of calls being recorded. Connected Applications—(CRC only) The number of Recording Spans connected to the CRC. Oldest Recording Available—(CRC only) The date and time of the oldest recording on the Cache. Recordings Available—(CRC only) The number of recorded calls on the disk.
T1 Line Status (T1 Spans only-CAS, PRI, or SS7). Provides both current and cumulative values. The Current tab reports values for one heartbeat Interval, as of the last heartbeat. The Cumulative tab reports total values since the Last Reset time.
Framing Bit Error Count—Count of framing bit errors.
Out of Frame Error Count—Count of out-of-frame errors.
Bit Error Count—Count of bit errors.
Alarm Status (Current tab only)—Status of telecom alarms at the time of the last heartbeat: Green, Yellow, or Blue (matches Card LEDs except that the Blue alarm lights the red LED.)
Loopback Pass-Through Status—Whether the Span is currently in loopback test pass-through mode.
Last Reset (Cumulative tab only)—Time at which Reset was last clicked to reset all cumulative values to 0 or the Span was last restarted.
E1 Line Status (E1 Spans only-CAS, PRI, or SS7) Provides both current and cumulative values. The Current tab reports values for one heartbeat Interval, as of the last heartbeat. The Cumulative tab reports total values since the Last Reset time.
Framing Bit Error Count—Count of framing bit errors.
Far End Block—Count of Cyclic Redundancy Check (CRC) errors encountered by the upstream device, based on the data sent upstream by the ETM® System.
CRC Error Count—Count of CRC errors encountered in received data.
Line Code Error—Count of line encoding errors encountered in received data.
Alarm Status (Current tab only)—Status of telecom alarms at the time of the last heartbeat: Green, Yellow, or Blue (matches Card LEDs except that the Blue alarm lights the red LED.)
Last Reset (Cumulative tab only)—Time at which Reset was last clicked to reset all cumulative values to 0 or the Span was last restarted.
PRI Line Status (All PRI Spans)
Link Status—D-channel down or up as of the last heartbeat.
Layer 3 Message Count—Count of D-channel messages during the heartbeat interval.

ETM® Platform Administration • 85
Span Health and Status, cont’d
Type of Status Fields
VoIP Network Status (VoIP Spans only)
Eth1—Status of the public Ethernet port, labeled Ethernet 0 on the Card, used for signaling and media. Green if up, Red if down, Black if not connected. Eth2—Status of the private Ethernet port, labeled Ethernet 1 on the Card, used for signaling and media. Green if up, Red if down, Black if not connected. Management Server—Status of the connection to the Management Server. Green if up, Red if down, Black if not connected. Tx and Rx display the number of bytes currently being transmitted/received for the indicated interface..
SS7 Bearer (SS7 bearer Spans only)
Signaling Message Count—Count of Signaling Link messages in the heartbeat interval.
SS7 Signaling Link (SS7 Spans only) Status shown as of the last heartbeat.
Link Status—Link status (Up or Down) for each link as of the last heartbeat.
CO LSSU Message Count PELSSU Message Count
CO ISUP Message Count PE ISUP Message Count
CO SNM and SNT Message Count
PE SNM and SNT Message Count

86 • ETM® Platform Administration
The ETM System includes a number of predefined voice and video codec definitions, including G.711(PCMU), G.723.1, and G.729. The Codecs dialog box is flexible and allows you to add additional codec definitions as they become available. In addition, if a VoIP call occurs for which no codec is currently defined, as much information as possible is extracted for the codec and a new codec definition is added to the VoIP Codecs dialog box. These extracted codecs have a call type classification of Unknown. You can edit them to provide the missing information and associate them with a call type classification when available. The call type reported for a given call is based on the codec classification.
When a VoIP Span connects to the Server, the list of codecs and their properties is sent to the Span. When you change any codec properties via the Codecs dialog box (accessed from the Performance Manager Manage menu), the Management Server automatically distributes the changes to each connected VoIP Span.
The ETM System recognizes the following codecs:
• Voice—DV14(11), DV14(22), CN, QCELP, G721, G723, G728, G729, MPA, L16(1), L16(2), G722, PCMA, LCP, DVI4(8), DVI4(16), GSM, 1016, PCMU
• Video—H261, NV, JPEG, CELB
To view a list of the codec definitions
• On the Performance Manager main menu, click Manage | Codecs. The VoIP Codecs dialog box appears.
Codecs
Codec Definitions
Viewing a List of Codecs

ETM® Platform Administration • 87
Each row provides summary information for a single codec. To view details, double-click the row.
Right-clicking a row in the VoIP Codecs dialog box opens a submenu of options, which are also available from the toolbar:
New— Opens a dialog box in which you can define a new codec definition. See "Creating a Codec Definition" on page 89.
Open— Opens a dialog box in which you can view details and edit the properties of the selected codec definition. See "Viewing or Editing a Codec" on page 87.
Delete— Deletes the selected codec definition. You cannot delete the predefined codec definitions. See "Deleting a Codec" on page 91.
Search— Opens a dialog box in which you can define a search for one or more codecs matching specified criteria. See "Searching for Codecs" on page 91.
To view or edit a codec definition
1. On the Performance Manager main menu, click Manage | Codecs. The VoIP Codecs dialog box appears.
2. Do one of the following:
• Double-click the codec that you want to view or edit.
-or-
• Click the codec that you want to view or edit, and then click the Open icon on the task bar.
The Codec Properties dialog box appears containing the properties of the selected codec.
Viewing or Editing a Codec

88 • ETM® Platform Administration
3. Edit the codec properties as needed. Note that all fields are required and
must have a value greater than 0. See "Creating a Codec Definition" on page 89 for a description of the fields. Note that when you edit a predefined codec, you cannot change RTP number, RTP identifier, Sample rate, Channels, or Classification.
4. Click Apply to accept the changes without closing the dialog box, or click OK to save the changes and close the dialog box.
To set excessive media rate limits for a codec
1. On the Performance Manager main menu, click Manage | Codecs. The VoIP Codecs dialog box appears.
2. Double-click the codec to which you want to apply the limit. The Codec Properties dialog box appears.
Setting Excessive Media Rate Limits for a Codec

ETM® Platform Administration • 89
3. In the Excessive Media Rate area, specify when the media rate is considered excessive as follows:
a. Select one of the following options:
• Number of packets per second
• Payload bytes per second
• Total number of bytes per second.
b. Type a value greater than 0 for the selected value.
c. Specify the minimum number of seconds for which the specified value is exceeded before the rate is considered excessive. Calls are tracked to verify that their media rate conforms to the expected characteristics of the codec. You can use the Attributes field of Firewall Policies to prescribe actions (such as call termination) based on this value. You can also define system events to notify applicable personnel.
The Call Quality Alert Limit triggers a system event if a call using this codec exceeds the specified value:
To set call quality alert limits for a codec
1. On the Performance Manager main menu, click Manage | Codecs. The VoIP Codecs dialog box appears.
2. Double-click the codec to which you want to apply the limit. The Codec Properties dialog box appears.
3. In the Call Quality area, specify the limits that trigger an alert (values must be greater than 0). If either value is exceeded, an alert is triggered.
• Packet loss of n packets per second for n seconds.
• Jitter of n per second for n seconds.
The ETM System provides flexibility to add new codec definitions as they become available.
You must have the Access Policy Features user permission to create new codec definitions.
To define a new codec
1. On the Performance Manager main menu, click Manage | Codecs. The VoIP Codecs dialog box appears.
2. Click File | New. The Codec Properties dialog box appears.
Setting Call Quality Alert Limits for a Codec
Creating a Codec Definition

90 • ETM® Platform Administration
The table below describes each field in a Codec definition. All fields are required and values must be greater than 0.
Codec Field Description Definition Name—Identifier of the codec (must be unique), between 1 and 38 characters.
RTP number—The RTP number of the codec (number between 1-127). RTP Identifier—The identifier of the codec. Sample rate—The rate per second at which the voice path data is sampled. Channels—The number of channels (1-9) the codec uses. Classification—Call type associated with the codec: Voice, Video, Fax, Data, or Unknown. Expected packet delay—The expected time, from 1 to 10000 milliseconds, between two successive packets. A packet delay of 20ms, for example, would correspond to a frequency of 50 packets per second. As you change this value, the information in the Calculated Values area updates. Expected packet payload—Bandwidth in bytes per second; a number from 1 to 4294967296. As you change this value, the information in the Calculated Values area updates.
Calculated values Packet rate—Packets per second Payload bandwidth—Bytes per second Total bandwidth—Bytes per second
Excessive Media Rate To specify when the media rate is considered excessive:
1. Select one of the following options, and then type a value greater than 0: Number of packets per second, Payload bytes per second, or Total number of bytes per second.
2. Specify the minimum number of seconds for which the specified value is exceeded before the rate is considered excessive. Calls are tracked to verify that their media rate conforms to the expected characteristics of the codec. You can use the Attributes column of firewall policies to prescribe actions (such as call termination) based on this value. You can also define system events to notify applicable personnel.
Call Quality Triggers a system event if a call using this codec exceeds either of the following values (values must be greater than 0): Packet loss of n packets per second for n seconds or jitter of n per second for n seconds
3. Click OK to save the changes and close the dialog box.
The new codec definition appears in the VoIP Codecs dialog box.
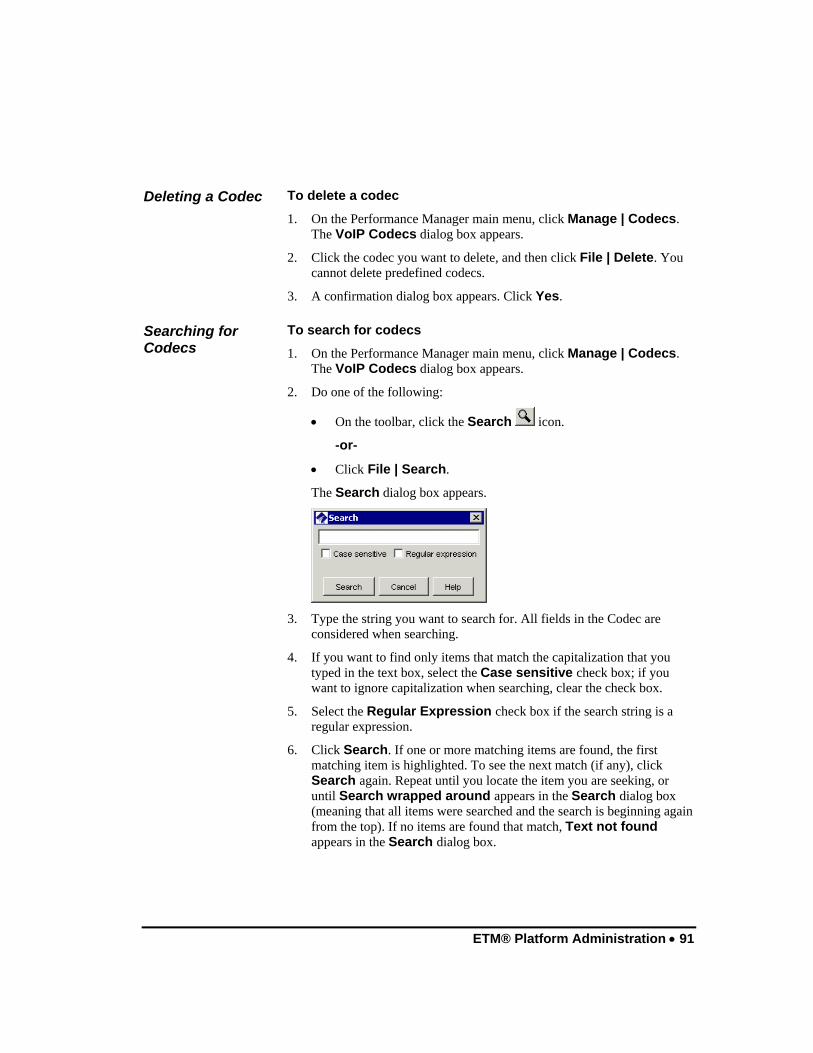
ETM® Platform Administration • 91
To delete a codec
1. On the Performance Manager main menu, click Manage | Codecs. The VoIP Codecs dialog box appears.
2. Click the codec you want to delete, and then click File | Delete. You cannot delete predefined codecs.
3. A confirmation dialog box appears. Click Yes.
To search for codecs
1. On the Performance Manager main menu, click Manage | Codecs. The VoIP Codecs dialog box appears.
2. Do one of the following:
• On the toolbar, click the Search icon.
-or-
• Click File | Search.
The Search dialog box appears.
3. Type the string you want to search for. All fields in the Codec are
considered when searching.
4. If you want to find only items that match the capitalization that you typed in the text box, select the Case sensitive check box; if you want to ignore capitalization when searching, clear the check box.
5. Select the Regular Expression check box if the search string is a regular expression.
6. Click Search. If one or more matching items are found, the first matching item is highlighted. To see the next match (if any), click Search again. Repeat until you locate the item you are seeking, or until Search wrapped around appears in the Search dialog box (meaning that all items were searched and the search is beginning again from the top). If no items are found that match, Text not found appears in the Search dialog box.
Deleting a Codec
Searching for Codecs
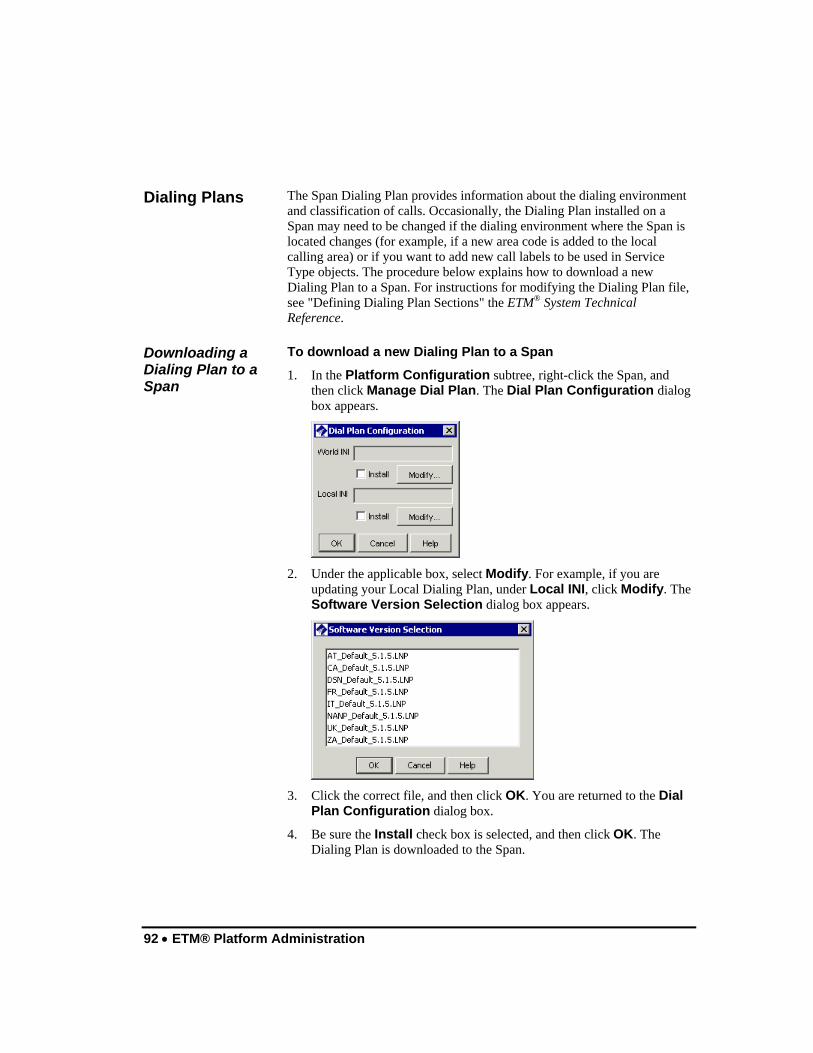
92 • ETM® Platform Administration
The Span Dialing Plan provides information about the dialing environment and classification of calls. Occasionally, the Dialing Plan installed on a Span may need to be changed if the dialing environment where the Span is located changes (for example, if a new area code is added to the local calling area) or if you want to add new call labels to be used in Service Type objects. The procedure below explains how to download a new Dialing Plan to a Span. For instructions for modifying the Dialing Plan file, see "Defining Dialing Plan Sections" the ETM® System Technical Reference.
To download a new Dialing Plan to a Span
1. In the Platform Configuration subtree, right-click the Span, and then click Manage Dial Plan. The Dial Plan Configuration dialog box appears.
2. Under the applicable box, select Modify. For example, if you are
updating your Local Dialing Plan, under Local INI, click Modify. The Software Version Selection dialog box appears.
3. Click the correct file, and then click OK. You are returned to the Dial
Plan Configuration dialog box.
4. Be sure the Install check box is selected, and then click OK. The Dialing Plan is downloaded to the Span.
Dialing Plans
Downloading a Dialing Plan to a Span

ETM® Platform Administration • 93
Span Configuration Settings Span configuration settings provide the Span with telecom and call processing information specific to the telecom environment where the Span is located. These settings enable the Span to properly process calls and enforce Policies.
These settings are configured during installation; most settings are unlikely to need to be modified during system operation unless the telecom system itself changes. Others, such as the Span Name, Loopback Passthrough Mode, Extension Masking, and Call Termination setting, may need to be changed.
WARNING Do not change Span line settings unless instructed to do so by SecureLogix Customer Support. Improper settings can impair the ETM System’s ability to monitor calls and may degrade telecom network operation.
(Does not apply to Analog) The Manual Inline check box allows you to configure a digital Span so that it does not automatically go inline after it is rebooted or restarted. When this box is selected, the Span remains offline until the ETM Command SPAN INLINE is executed. To allow the Span to automatically go inline after it is rebooted or restarted, clear the check box.
To cause a Span to always restart/reboot offline
1. In the Performance Manager tree pane, right-click the Span, and then click Edit Span(s). The Span Configuration dialog box appears.
2. Do one of the following:
• On VoIP Spans, click the VoIP tab.
• On T1 Spans, click the T1 Setup tab.
• On E1 Spans, click the E1 Setup tab.
Configuring Digital Spans to Restart Offline

94 • ETM® Platform Administration
3. Select the Manual Inline check box. When this check box is selected,
the Span is offline after a reboot or restart until the ETM Command SPAN INLINE is executed.
• To allow the Span to automatically go inline after it is rebooted or restarted, clear the check box.
4. Click OK to download the configuration change to the Span.
To place offline digital Spans inline
1. In the Performance Manager tree pane, right-click the Span and click ASCII Management.
• To select multiple Spans, hold down CTRL or SHIFT and select each Span, and then right-click the selection and click ASCII Management. The ASCII Management Interface appears.
2. In the Enter Command box, type SPAN INLINE and then press ENTER.
Placing Offline Digital Spans Inline

ETM® Platform Administration • 95
The media access control (MAC) address of the Span is the same as that of the Card. It is a unique hardware identifier specific to a given Card; it cannot be modified.
To view the MAC address of the Span
• In the Platform Configuration subtree of the Performance Manager tree pane, right-click the Span, and then click Edit Span(s). The Span Configuration dialog box appears with the Span tab selected. The MAC Address appears on this tab.
The Name box contains the user-defined name used to represent the Span in the Performance Manager tree pane, logs, and monitoring tools. This procedure applies to all Span types.
To rename a Span
1. In the Platform Configuration subtree, right-click the Span, and then click Edit Span(s). The Span Configuration dialog box appears, with the General tab selected.
2. In the Name box, type the new Span name.
3. When you have finished your changes to this Span, click OK to apply the changes and close the dialog box.
4. A confirmation message appears. Click Yes to download the changes to the Span.
Viewing a Span's MAC Address
Renaming a Span
96 • ETM® Platform Administration
Each Appliance component below the Card level has an optional Comment field that, by default, generates a tool tip when you hover over the icon in the Performance Manager tree pane. You can use this field to provide at-a-glance information, perhaps identifying the rack location, type of Span, and IP address, or some other key information. You can optionally disable the tool tip display. For instructions, see "Disabling the Span Tool Tip" below.
To add a Span comment/tool tip
1. In the Performance Manager tree pane, right-click the Span or other applicable resource and click Edit.... The Configuration dialog box for the selected resource appears with the General tab selected. Note: This feature applies only to resources that appear below the Card level in the Platform Administration subtree.
2. In the Comment field, type a descriptive comment. You can optionally use basic HTML tags to format the tool tip display.
IMPORTANT Since HTML tags are enclosed in angle brackets, use of angle brackets in the Comment field has the following limitation: If you want to display a left angle bracket, you must type the following code to denote it: <
In HTML, a typed left angle bracket character is never displayed, a right angle bracket is not displayed if a left angle bracket precedes it anywhere in the text, and any text enclosed in angle brackets is assumed to be a tag and not displayed.
For example, if you type This is <span_2> in the Comment field, the tool tip displays only This is. If you instead type This is <span_2>, the tool tip displays This is <span_2> as you intended.
3. Click OK to save changes and download them to the Span.
4. Click OK when the confirmation message appears.
By default, the comment on the General tab of a Span (or other resource below the Card level) appears as a tool tip when you hover over the icon in the Performance Manager tree pane. You can disable this Span tool tip feature in the ETM Server Properties Tool.
To disable the Span tool tip
1. In the ETM System Console, click the Server for which you want to disable the Span tool tip.
2. Click Servers | ETM Server Properties. The ETM Server Properties Tool appears.
Span Comment/Tool Tip
Adding a Span Comment/Tool Tip
Disabling the Span Tool Tip

ETM® Platform Administration • 97
3. Double-click the entry called DisplayAppToolTips. The Modify Property dialog box appears for the selected property.
4. Select False, and then click OK. This property is dynamic, so you do not need to restart the Server for the change to take effect. However, if the Performance Manager is open when you change the value, you must close and reopen the Performance Manager before the change is reflected.
The Heartbeat Interval on the Preferences tab of the Span Configuration dialog box specifies how often the Span sends health and status messages to the Management Server. The default heartbeat interval is one minute. It is strongly recommended that you do not change this setting. More frequent heartbeats increase network load and do not increase reliability, although a shorter heartbeat interval decreases the time until the Management Server becomes aware of a lost connection in some network configurations.
Span Heartbeat Interval Setting

98 • ETM® Platform Administration
To capture Span-specific Appliance debugging information in a file on the hard drive of the Management Server for troubleshooting purposes, use the following procedure. Be certain to clear this check box when you no longer need to store this information. Debug logging can quickly generate a large file and greatly increases the amount of network traffic and Appliance load, potentially impacting Appliance performance.
To enable Appliance debug event logging
1. In the Platform Configuration subtree, right-click the Span, and then click Edit Span(s). The Span Configuration dialog box appears.
2. Click the Preferences tab.
3. In the Logging area, select the Log Appliance Debug Events to
File check box Be certain to clear this check box when you no longer need to store this information, to prevent unnecessary use of hard drive space. Debug logging can quickly generate a large file.
The file is saved in the ETM System installation directory on the Management Server computer at the following path:
<INSTALL_DIR>/debug/<macaddress_Spannumber_uniqueid>.dbg
4. When you have finished your changes to this Span, click OK to apply the changes and close the dialog box.
5. A confirmation message appears. Click Yes to download the changes to the Span.
Appliance Debug Event Logging

ETM® Platform Administration • 99
(Not on SS7 Signaling Links) The Terminate Policy setting on the Span Configuration dialog box determines whether calls can be terminated on this Span, either manually or by Policies. If this check box is not selected, no calls can be terminated, regardless of the Action field setting in any Policy Rules or a user's permission.
To enable/disable call termination Rules for a Span
1. In the Platform Configuration subtree, right-click the Span, and then click Edit Span(s). The Span Configuration dialog box appears.
2. Click the Firewall tab.
3. In the Terminate Policy area:
• To allow termination of calls on this Span, select the Allow Call Terminations check box.
• To prevent termination of calls on this Span, clear the Allow Call Terminations check box.
4. When you have finished your changes to this Span, click OK to apply the changes and close the dialog box.
5. A confirmation message appears. Click Yes to download the changes to the Span.
Call Termination Setting

100 • ETM® Platform Administration
(Not on VoIP or SS7 Signaling Links) If you want DTMF digits to be captured throughout the call, rather than just during call establishment, perform the following procedure. Note that suffix digits (such as PIN codes) are also not captured and reported unless this check box is selected. This setting applies to all calls on all channels, since DTMF digits are passed once the call is established, even if MF digits are used for signaling.
To capture mid-call DTMF digits
1. In the Platform Configuration subtree, right-click the Span, and then click Edit Span(s). The Span Configuration dialog box appears.
2. Click the Firewall tab.
3. In the DTMF Detection area, select the Detect and Collect
Throughout Entire Call check box.
4. When you have finished your changes to this Span, click OK to apply the changes and close the dialog box.
5. A confirmation message appears. Click Yes to download the changes to the Span.
DTMF Digit Detection
Suffix digits are still seen in the Raw Destination field, regardless of this setting.
ETM® Platform Administration • 101
(Not on VoIP or SS7 Signaling Links) If STU phones are in use on monitored lines, the Actively Detect STUs check box must be selected before the ETM System reports them as STUs. If this is not selected, STU calls are reported as Modem Energy.
To enable STU detection
1. In the Platform Configuration subtree, right-click the Span, and then click Edit Span(s). The Span Configuration dialog box appears.
2. Click the Firewall tab.
3. Select the Actively Detect STU check box.
4. When you have finished your changes to this Span, click OK to apply the changes and close the dialog box.
5. A confirmation message appears. Click Yes to download the changes to the Span.
(Not on SS7 Signaling Links) An ambiguous call occurs when insufficient call data is available to evaluate a particular call against a Policy Rule. For example, if a Rule specifies outbound Source but the source is not available in the call data on the line, the call is ambiguous because it cannot be determined whether the source of the call matches the source in the Rule. Ambiguous Call Processing determines how such calls are processed.
To change the ambiguous call processing setting
1. In the Platform Configuration subtree, right-click the Span, and then click Edit Span(s). The Span Configuration dialog box appears.
2. Click the Firewall tab.
3. Select one of the following options:
• Skip the rule—If an ambiguous call is encountered, the Rule is skipped, and processing continues with the next Rule.
• Skip the rule only on an inbound call—If an ambiguous call is encountered during an inbound call, the Rule is skipped and processing continues with the next Rule in the Policy. When an ambiguous call is encountered during an outbound call, the Firewall Policy stops executing and no Tracks (except logging) are executed.
STU Detection Setting
Ambiguous Call Processing Setting
Ambiguous calls are always logged in the Policy Log, regardless of the Track setting, unless Skip the rule is selected.

102 • ETM® Platform Administration
Inbound calls are distinguished from outbound calls because SMDR data can be used to resolve outbound calls that were ambiguous because the source phone number was unavailable during the call. When SMDR data is available to provide the source number, the outbound call is again processed against the Firewall Policy and any applicable Tracks are executed.
• Do not skip the rule—If an ambiguous call is encountered during any call, the Firewall Policy stops executing and no Tracks (except logging) are executed. If SMDR is in use, outbound calls that were ambiguous due to missing source number are reprocessed against the Firewall Policy when SMDR data is available to provide the source, and any applicable Tracks are executed.
4. When you have finished your changes to this Span, click OK to apply the changes and close the dialog box.
5. A confirmation message appears. Click Yes to download the changes to the Span.
(Not on SS7 Signaling Links)
To view the Span's Country Code
• In the Performance Manager tree pane, right-click the Span, and then click Edit Span(s). The Span Configuration dialog box appears. The Span's Country Code appears in the Country Code box on the Telephony tab.
Span Country Code Setting

ETM® Platform Administration • 103
(Not on SS7 Signaling Links)
To view the Span's local area/city code
• In the Performance Manager tree pane, right-click the Span, and then click Edit Span(s). The Span Configuration dialog box appears. The Span's local city/area code appears in the Local City/Area Code box on the Telephony tab. This setting only needs modified if the area code where the Span is located changes.
(Not SS7 Signaling Links) Call Type Timeout only applies to calls where lack of activity on the line prevents the Span from identifying the call type. The Call Type Timeout specifies the length of time the Span waits to identify the call type before first classifying a silent or indistinguishable call as Voice. Setting this value too low can cause an excessive number of call type changes.
To change the Call Type Timeout
1. In the Performance Manager tree pane, right-click the Span, and then click Edit Span(s). The Span Configuration dialog box appears.
2. Click the Telephony tab.
3. In the Call Type Timeout box, type or select the timeout value in
minutes and seconds.
Local Area/City Code for a Span
Call Type Timeout Setting

104 • ETM® Platform Administration
4. When you have finished your changes to this Span, click OK to apply the changes and close the dialog box.
5. A confirmation message appears. Click Yes to download the changes to the Span.
(Not on VoIP or SS7 Signaling Links) The SMDR Timeout specifies how long the Span is to wait for an SMDR result from the Server after the call ends.
To set the SMDR Timeout
1. In the Performance Manager tree pane, right-click the Span, and then click Edit Span(s). The Span Configuration dialog box appears.
2. Click the Telephony tab.
3. In the SMDR Timeout box, type or select the timeout value in
minutes and seconds.
4. When you have finished your changes to this Span, click OK to apply the changes and close the dialog box.
5. A confirmation message appears. Click Yes to download the changes to the Span.
SMDR Timeout Setting

ETM® Platform Administration • 105
(Not on VoIP or SS7 Signaling Links) The Call Established Timeout setting is used on analog and T1 loop start and ground start calls, which do not provide answer supervision. It specifies how long after the last digit is dialed until the call is marked as established.
To view the Call Established Timeout
• In the Performance Manager tree pane, right-click the Span, and then click Edit Span(s). The Span Configuration dialog box appears. The Call Established Timeout setting appears on the Telephony tab. The default is 20 seconds, which corresponds with the timeout value of most telephone network Switches. If your network differs, adjust this value accordingly.
To prevent errors on T1 lines during loopback testing, the ETM System supports loopback pass-through functionality on T1 Spans (CAS, PRI, SS7 Signaling Link, and SS7 Bearer).
The following pass-through modes are available:
On—The telephony data is transmitted through the Span and no call monitoring or Policy enforcement occurs. When Loopback Test Pass-Through Mode is on, D-channel re-establishment and error-count threshold checking/logging are disabled. An error count of 0 is sent to the Management Server.
Off—(Default) Loopback Test Pass-Through Mode is disabled. The telephony data is transmitted through the Span; call monitoring and Policy is enforcement occurs.
Autodetect—Causes the Span to automatically detect standard loop-up and loop-down codes and enter pass-through within 5 seconds of loop-up or loopdown. When Autodetect is selected, you can also specify a timeout value, from 1 second to 1 day (1 hour is the default), at which Loopback Test Pass-Through Mode is turned off if no loopdown code has been detected. This prevents the Span from remaining in pass-through mode indefinitely.
When a Span is brought inline, restarted, or rebooted, it resumes in the previous pass-through state. If the pass-through mode is set to Auto, the Span resumes in the pass-through inactive state.
Call Established Timeout Setting
Loopback Test Pass-Through Mode Setting

106 • ETM® Platform Administration
The following are important to note regarding loopback test pass-through mode:
• Only standard CSU loop-up/loop-down codes are supported:
– In-band CSU (10000/100)
– ESF data link line (11111111 01110000/11111111 00011100)
– ESF data link payload (11111111 00101000/11111111 01001100)
• Autodetect does not detect in-band loop codes that gap the loop codes for the framing bits. If these loop codes are in use, set loopback pass-through ON or set the Span offline before beginning the test.
• When the loopback test is performed, if the framing type does not match the framing of the Span, the Span will go into alarm and the loopback test will be corrupted.
• When Autodetect is selected, if the automatic timeout expires before the test is complete, a message appears in the Diagnostic Log.
• On T1 Spans, call traffic is prevented when Loopback Test Pass-Through Mode is set to ON; ensure that the affected trunk is placed out of service or set the Span offline before setting Loopback Test Pass-Through Mode ON. When Loopback Test Pass-Through Mode is set to Automatic, ghost calls may occur on either side of the loopback test and other errors may occur.
• The ETM System must detect the loop-up or loop-down code for 5 seconds; if the CSU goes to loop-up or loop-down in less than 5 seconds, the ETM System will not recognize the code and will not loop-up or loop-down.
The Span's pass-through status is sent to the Management Server with each heartbeat and when a change of state occurs. Pass-through status is reported in the Performance Manager tree pane via an icon next to the associated Span, in the Management Server's system events, in the ETM System Statistics dialog box for the Span, and via the SHOW STATUS ETM Command in the ASCII Management Interface, Telnet, or serial connection.
When pass-through is active, T1 alarm status is unavailable and shown as black in the ETM System Statistics dialog box for the Span.
Loopback Test Pass-Through Mode Limitations
Viewing Loopback Pass-Through Status
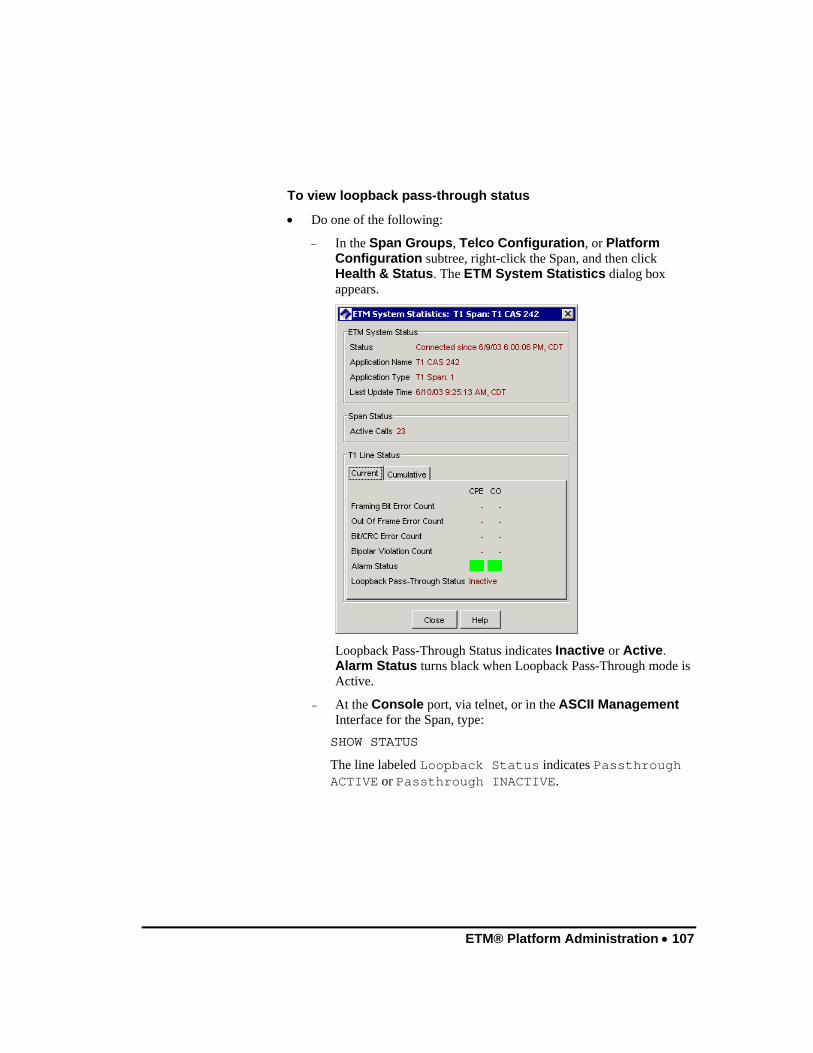
ETM® Platform Administration • 107
To view loopback pass-through status
• Do one of the following:
– In the Span Groups, Telco Configuration, or Platform Configuration subtree, right-click the Span, and then click Health & Status. The ETM System Statistics dialog box appears.
Loopback Pass-Through Status indicates Inactive or Active. Alarm Status turns black when Loopback Pass-Through mode is Active.
– At the Console port, via telnet, or in the ASCII Management Interface for the Span, type: SHOW STATUS
The line labeled Loopback Status indicates Passthrough ACTIVE or Passthrough INACTIVE.

108 • ETM® Platform Administration
– At the Console port of the Card, via telnet, or in the ASCII
Management Interface, type: SHOW T1
The Loopback Mode (ON, OFF, or AUTO), current loopback mode status (ACTIVE or INACTIVE), and the loopback mode timeout setting are included in the output.
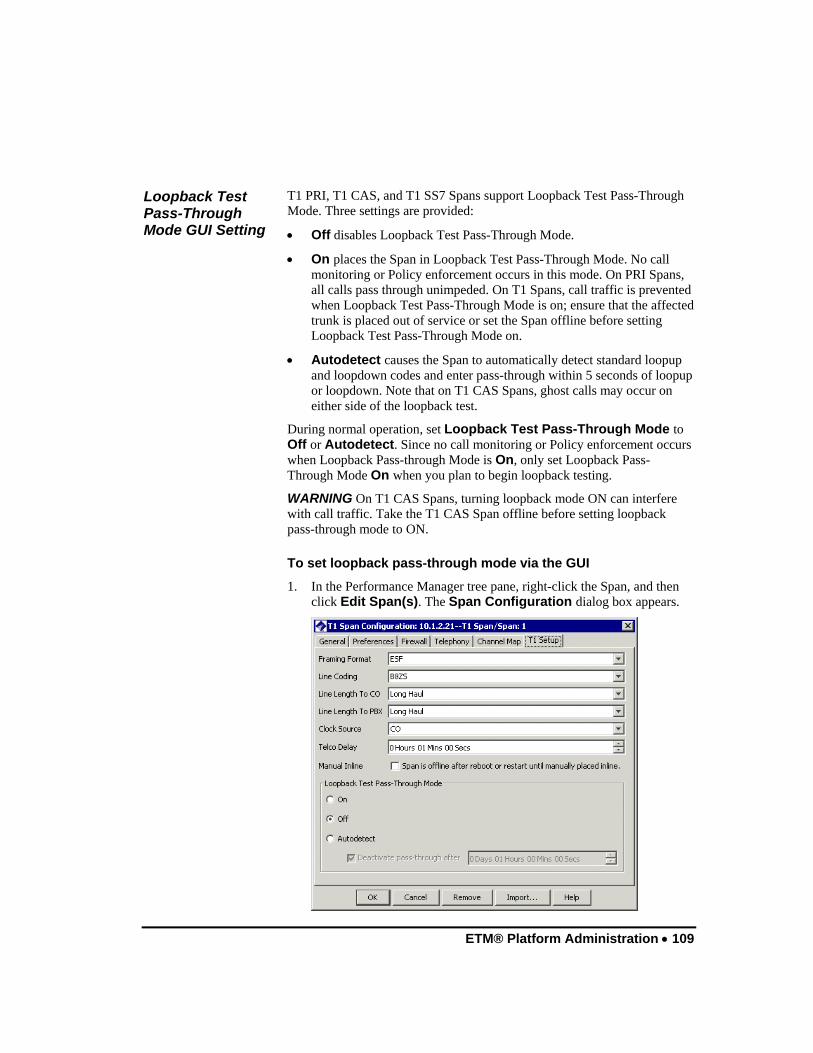
ETM® Platform Administration • 109
T1 PRI, T1 CAS, and T1 SS7 Spans support Loopback Test Pass-Through Mode. Three settings are provided:
• Off disables Loopback Test Pass-Through Mode.
• On places the Span in Loopback Test Pass-Through Mode. No call monitoring or Policy enforcement occurs in this mode. On PRI Spans, all calls pass through unimpeded. On T1 Spans, call traffic is prevented when Loopback Test Pass-Through Mode is on; ensure that the affected trunk is placed out of service or set the Span offline before setting Loopback Test Pass-Through Mode on.
• Autodetect causes the Span to automatically detect standard loopup and loopdown codes and enter pass-through within 5 seconds of loopup or loopdown. Note that on T1 CAS Spans, ghost calls may occur on either side of the loopback test.
During normal operation, set Loopback Test Pass-Through Mode to Off or Autodetect. Since no call monitoring or Policy enforcement occurs when Loopback Pass-through Mode is On, only set Loopback Pass-Through Mode On when you plan to begin loopback testing.
WARNING On T1 CAS Spans, turning loopback mode ON can interfere with call traffic. Take the T1 CAS Span offline before setting loopback pass-through mode to ON.
To set loopback pass-through mode via the GUI
1. In the Performance Manager tree pane, right-click the Span, and then click Edit Span(s). The Span Configuration dialog box appears.
Loopback Test Pass-Through Mode GUI Setting

110 • ETM® Platform Administration
2. Click the T1 Setup tab.
3. In the Loopback Test Pass-Through Mode area, select On, Off, or Autodetect.
4. If you select Autodetect, the Deactivate pass-through after field becomes available. This field specifies a timeout at which Loopback Test Pass-Through Mode is turned off if no loopdown code has been detected. This prevents the Span from remaining in pass-through mode indefinitely. Type or select a value. The default is 1 hour.
5. When you have finished your changes to this Span, click OK to apply the changes and close the dialog box.
6. A confirmation message appears. Click Yes to download the changes to the Span.
You can also turn loopback mode on or off using ETM Commands in the ASCII Management Interface or via a telnet or serial connection.
• To turn loopback mode on type:
T1 LOOPBACK MODE ON
• To turn loopback mode off type:
T1 LOOPBACK MODE OFF
The Layer 2 Crossover setting is used for debugging PRI issues to allow logical insertion/isolation from layer 2 and 3 on PRI Spans. Only change this setting if instructed to do so by SecureLogix Support personnel.
To change the Layer 2 Crossover setting
1. In the Performance Manager tree pane, right-click the Span, and then click Edit Span(s). The Span Configuration dialog box appears.
2. Click the PRI tab.
3. In the Layer 2 Crossover box, click the down arrow and select an option. Valid values are ON, OFF, and AUTOMATIC. (AUTOMATIC is not supported for DASS2 protocol variant.)
Telco Delay applies to T1 and E1 Spans and specifies the time (hours, minutes, and seconds) before notification that the trunk is down is sent to the Diagnostic Log (at which time any specified System Event Tracks are executed, such as email alerts). The default is 60 seconds.
To change the Telco Delay
1. In the Performance Manager tree pane, right-click the Span, and then click Edit Span(s). The Span Configuration dialog box appears.
2. Click the T1 Setup or E1 Setup tab.
Loopback Setting via ETM Command
Layer 2 Crossover
Changing the Telco Delay

ETM® Platform Administration • 111
3. In the Telco Delay box, type or select a value in hours, minutes, and seconds.
On PRI Spans, you can restrict the calling party number from being transmitted to the called party, while still allowing it to be sent to the Appliance for call monitoring. You can mask CPN for all source numbers on outbound calls on a given Span, or for specific sources and/or destinations. You can also specify a replacement set of digits or a null value to be transmitted on outbound calls in lieu of the actual calling party number, change the presentation indicator, and redirect certain calls to other destinations, such as a recorded message.
Extension Masking Plans enable you to mask calling extensions and redirect calls on PRI lines based on source, destination, and/or direction. For example, you can:
• Redirect harassing inbound calls from known sources to the security department.
• Supply a substitute source number to be transmitted to called destinations.
• Redirect calls to your CEO and other executives for which Caller ID has been blocked to a recorded message that explains such calls are not accepted.
You can define Extension Masking Plan rules for any entity in the ETM Directory (Listings, Groups, Ranges, Filters, and Wildcards), for caller ID restricted calls, and for calls with no source.
IMPORTANT NOTES
• Extension Masking Plan rules are processed in the order in which they appear in the Masking Plan Properties dialog box, and only the first rule that matches the call is executed.
• Masking results do not appear in the Call Monitor, Logs, or Reports; that is, the original number is reported rather than the substitution.
• If you want to mask or restrict CPN for all calls on a specific Span, rather than implementing different rules based on source and/or destination, and do not need to redirect calls, use the Masking Config setting on the PRI tab of the Span Configuration dialog box instead of an Extension Masking Plan. See "Applying Masking or Redirection to a Span" on page 116.
• After you define an Extension Masking Plan, you associate it with the PRI Span(s) to which it applies in the Span Configuration dialog box. See "Applying Masking or Redirection to a Span" on page 116.
Extension Masking/Call Redirection

112 • ETM® Platform Administration
You must have the Manage Telecommunications Configuration permission to view or edit masking plans.
To define an extension masking plan
1. On the Performance Manager main menu, click Manage | Extension Masking Plans.
The Masking Plans dialog box appears.
2. Right-click in the white area of the dialog box, and then click New
Masking Plan. The Masking Plan Properties dialog box appears.
Defining an Extension Masking Plan

ETM® Platform Administration • 113
3. In the Name box, type a unique identifier for this masking plan.
4. Optionally, in the Comment box, type a descriptive comment.
5. Click one of the Add Rule icons to add a rule. These icons function exactly as those used for Policies in the Performance Manager.
6. A new blank rule appears in the Masking Plan Properties dialog
box.
7. Define the fields. You must set a value for source and destination
(Any, one or more directory entities, or Caller ID Restricted). The other fields are optional. IMPORTANT Only if you specify a replacement source or destination should you specify a different corresponding TON or Numbering Plan, because changing these values for an unchanged phone number may render the call unroutable. To prevent this, such changes are ignored by the Span.
• Call Direction—Specifies the call direction to which the rule applies: Inbound calls, Outbound calls, or Any calls. Any is the default. This field also denotes whether the source or destination is internal or external.
- To change the value, click in the field, and then click an option in the list.

114 • ETM® Platform Administration
• Source—Required. Specify the source(s) to which the rule applies. You can specify Any or one or more Directory Entities (Listings, Groups, Ranges, Filters, or Wildcards), Caller ID Restricted, or No Source.
- To add a source, right-click in the field, click Add, and then click the source.
• Destination—Required. Specify the destination(s) to which the rule applies. You can specify Any or one or more Directory Entities (Listings, Groups, Ranges, Filters, or Wildcards).
- To add a value, right-click in the field, click Add, and then click the destination.
• Source Replace—Used to send a replacement value instead of the actual source number. The value you specify replaces any of the Source numbers specified in the Source field. Unchanged is the default. Leave the default, which transmits the actual source, type the digit string that is to replace the actual source number, or clear the field to send a NULL value. IMPORTANT The replacement number must be routable by the PBX or CO switch to which the call is being sent. In other words, if an inbound call has its 4 digit DID number replaced with a 10 digit external number, the PBX may not correctly route the call back out to this number. Likewise, to redirect an outbound call to an internal extension, you must supply a number that the CO can use to route the call to that internal extension.
- To change the value, right-click in the field, click Edit, and then type the replacement digits, or clear the field to send a NULL value. This field accepts up to 33 numeric characters.
- To revert to the default, right-click in the field, and then click Unchanged.
• Dest Replace—Used to reroute a call. Calls from any of the sources in the Source field to any of the destinations in the Destination field are rerouted to the replacement destination. Unchanged is the default. Leave the default, which uses the dialed digits to route the call; or type the digit string that is to replace the dialed digits in routing the call. Note that this string represents the raw destination, or actual dialed digits.
- To change the value, right-click in the field, and then click Edit, and then type the number to which the call is to be redirected. This field accepts from 1 to 33 numeric characters and the pound # sign.
- To revert to Unchanged, right-click in the field, and then click Unchanged.

ETM® Platform Administration • 115
• Source TON—Specifies a value to replace the source TON value in the PRI messaging. Only modify this value if you specified a replacement source number and that number has a different TON. Unchanged is the default. Leave the default, which leaves the actual TON in the messaging, or select one of the following: International, National, Subscriber, Network Specific, or Abbreviated.
- To specify a value or revert to Unchanged, click in the field, click the down arrow, and then click an option.
• Source Number Plan—Specifies a value to replace the source number plan (NP) in the PRI messaging. Only modify this value if you specified a replacement source number and that number uses a different NP. Unchanged is the default. Leave the default, which leaves the actual source NP in the messaging, or select one of the following options: Unknown, ISDN, Data, Telex, Standard, or Private.
- To specify a value or revert to the default, click in the field, click the down arrow, and then click an option.
• Source Presentation—Specifies the source presentation indicator for the call. You can change this value whether or not you specify a replacement source or destination. Unchanged is the default. Leave the default, which leaves the presentation indicator as set by the caller; or select a value to which presentation indicator is to be set regardless of what was set by the caller. Values are Allow, Restricted, or Not Available.
- To select a value or to revert to Unchanged, click in the field, and then click the down arrow, and then click an option.
• Dest TON—Specifies a value to replace the destination TON value in the PRI messaging. Only modify this value if you specified a replacement destination number and that number has a different TON. Unchanged is the default. Leave the default, which leaves the actual destination TON in the messaging, or select one of the following: International, National, Subscriber, Network Specific, or Abbreviated.
• Dest Number Plan—Specifies a value to replace the destination number plan (NP) in the PRI messaging. Only modify this value if you specified a replacement destination number and that number uses a different NP. Unchanged is the default. Leave the default, which leaves the actual destination NP in the messaging, or select one of the following options: Unknown, ISDN, Data, Telex, Standard, or Private.
- To specify a value or revert to Unchanged, click in the field, and then click the down arrow, and then click an option.
8. Repeat above steps for additional rules as needed.

116 • ETM® Platform Administration
9. Masking plan rules are processed in the order in which they appear in the Masking Plan Properties dialog box, and only the first rule that matches the call is executed. To reorder the rules, click the rule you want to move, and then click the Up or Down arrow.
10. When you have defined each of the rules for this masking plan, click OK to save the changes and close the dialog box. The new masking plan appears in the Masking Plans dialog box and is available to use on any PRI Span. Remember that a masking plan has no effect until it is assigned to a PRI Span. Each PRI Span can use only one masking plan. See "Applying Masking or Redirection to a Span" below for instructions for associating a masking plan with a Span.
If you want to use an Extension Masking Plan to mask extensions or redirect calls based on the source, destination, and/or direction of the call, use the preceding procedure, "Defining an Extension Masking Plan," to define the Extension Masking Plan, if you have not already done so. Then use this procedure to associate the plan with the Span. If you simply want to mask source numbers for all outgoing calls on the Span, use the procedure below; you do not need to define an Extension Masking Plan.
To mask extensions and/or redirect calls
1. In the Performance Manager tree pane, right-click the Span, and then click Edit Span(s). The Span Configuration dialog box appears.
2. Click the PRI tab.
Applying Masking or Redirection to a Span
ETM® Platform Administration • 117
3. In the CPN Masking area, do one of the following:
• To mask or redirect calls based on source, destination, and/or direction, select Masking Plan.
a. Click Edit. The Masking Plans dialog box appears.
b. Click the masking plan that applies to this Span, and then click OK. If the masking plan has not yet been defined, you can define it by right-clicking in this dialog box. For instructions for defining a masking plan, see "Defining an Extension Masking Plan" on page 112.
• To mask source numbers on all outgoing calls on the Span, select Masking Config and then do any of the following (each of these fields functions independently of the others):
a. To prevent the calling party number from being transmitted, select the Restrict Calling Party Number checkbox.
b. To replace the outbound CPN with a substitute string, select the Modify Calling Party Number check box, and then type the substitute number in the box. You can type up to 18 digits. You can also leave the box blank, if desired, to send a null value (blank).
c. In the Calling Party Number Type box, click the down arrow, and then select the TON for the number you specified in the Modify Calling Party Number box: Unknown, International, National, Subscriber, Network Specific, or Abbreviated. In the USA, National is most common.
4. When you have finished your changes to this Span, click OK to apply the changes and close the dialog box.
5. A confirmation message appears. Click Yes to download the changes to the Span.
To view the proxy/gatekeeper information for a VoIP Span
1. In the Performance Manager tree pane, right-click the Span, and then click Edit Span(s). The VoIP Span Configuration dialog box appears.
2. Click the VoIP tab.
Proxy/ Gatekeeper Information for a VoIP Span
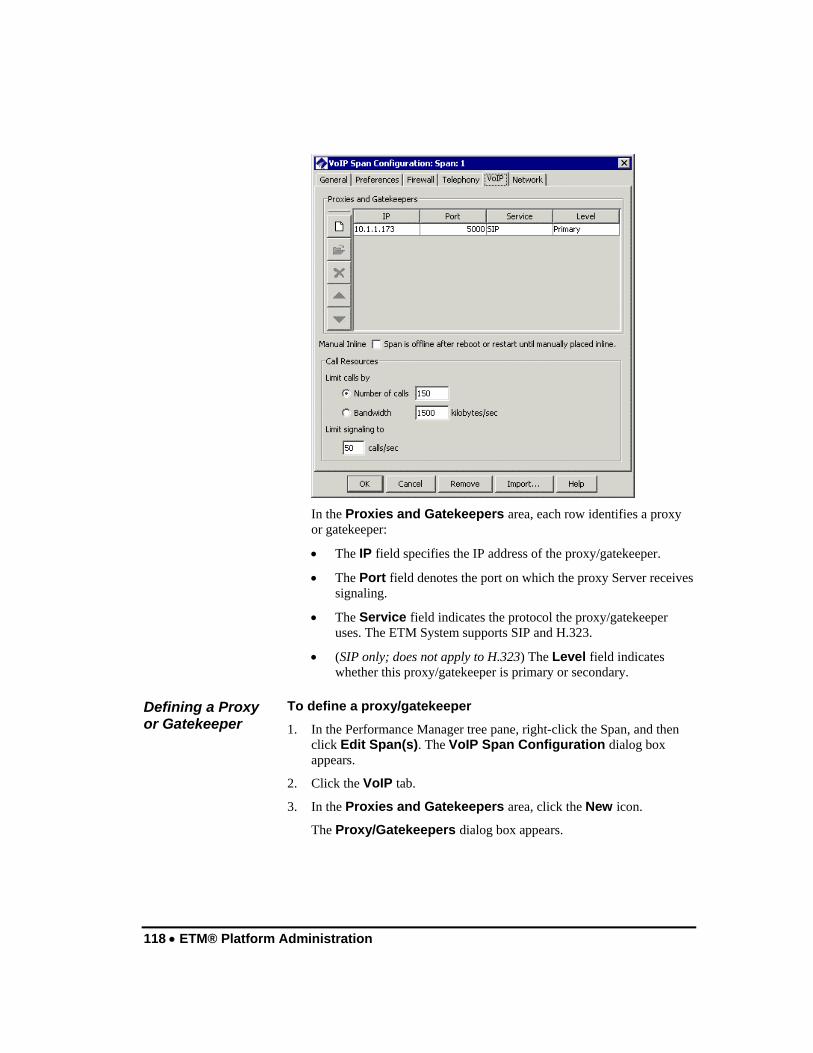
118 • ETM® Platform Administration
In the Proxies and Gatekeepers area, each row identifies a proxy or gatekeeper:
• The IP field specifies the IP address of the proxy/gatekeeper.
• The Port field denotes the port on which the proxy Server receives signaling.
• The Service field indicates the protocol the proxy/gatekeeper uses. The ETM System supports SIP and H.323.
• (SIP only; does not apply to H.323) The Level field indicates whether this proxy/gatekeeper is primary or secondary.
To define a proxy/gatekeeper
1. In the Performance Manager tree pane, right-click the Span, and then click Edit Span(s). The VoIP Span Configuration dialog box appears.
2. Click the VoIP tab.
3. In the Proxies and Gatekeepers area, click the New icon.
The Proxy/Gatekeepers dialog box appears.
Defining a Proxy or Gatekeeper

ETM® Platform Administration • 119
4. In the IP address box, type the IPv4 or IPv6 address of the
proxy/gateway.
5. In the Port box, type the port on which the proxy Server receives signaling.
6. In the Service box, select the protocol the proxy/gateway uses. The ETM System supports SIP and H.323.
7. (SIP only; does not apply to H.323) In the Level box, click the down arrow and select whether this proxy/gatekeeper is primary or secondary. If NAT mode is to be used, place the primary to be NAT'd at the top of the list. Use the Up arrow to move the proxy, if needed. Secondary proxies/gatekeepers are typically used only if the primary fails. If traffic is seen on the secondary proxy/gatekeeper, a system event is generated.
8. Click OK. The proxy or gatekeeper appears on the VoIP tab.
9. Click OK to download the configuration change to the Span.
To delete a proxy/gatekeeper
1. In the Performance Manager tree pane, right-click the VoIP Span, and then click Edit Span(s). The VoIP Span Configuration dialog box appears.
2. Click the VoIP tab.
3. Click the proxy or gatekeeper you want to delete, and then click the Delete icon.
To edit a proxy/gatekeeper definition
1. In the Performance Manager tree pane, right-click the VoIP Span, and then click Edit Span(s). The VoIP Span Configuration dialog box appears.
2. Click the VoIP tab.
3. Double-click the proxy/gatekeeper you want to edit, or click it and then click the Open icon. The Proxy/Gateway dialog box appears. See "Defining a Proxy" on page 118 for instructions, if needed.
If any phone on your network uses a different port than the one specified for the proxy, you may need to change the phone's port to match the one specified here or add an additional entry in the proxies/ and gatekeepers list that matches the phone's port.
Deleting a Proxy or Gatekeeper
Editing a Proxy or Gatekeeper

120 • ETM® Platform Administration
When the Span is in NAT mode, place the proxy to which you want NAT applied in the top position in the list.
To reorder the proxies and gatekeepers list
1. In the Performance Manager tree pane, right-click the VoIP Span, and then click Edit Span(s). The VoIP Span Configuration dialog box appears.
2. Click the VoIP tab.
3. Click the proxy or gatekeeper you want to move, and then click the up or down arrow.
To limit VoIP call resources
1. In the Performance Manager tree pane, right-click the Span, and then click Edit Span(s). The VoIP Span Configuration dialog box appears.
2. Click the VoIP tab.
3. In the Call Resources area, select one of the Limit Calls by options and then type a value. The dialog box automatically provides conversion between Number of Calls and Bandwidth, based on a G.711 codec with 20ms packets.
• Number of Calls—Allows you to specify call resource limits by total number of calls. View the Bandwidth field to see the required bandwidth for the number of calls you specify.
• Bandwidth—Allows you to specify call resource limits by maximum bandwidth in kbps. The Span uses the number of calls value, but you can specify a value in bandwidth and it will be automatically converted to number of calls.
IMPORTANT If the Span is in NAT mode, you must allocate at least the minimum number of media ports required for the call resources you have specified. If you are in bridge (non-NAT) mode, you do not need to allocate media ports.
4. Click OK to download the configuration change to the Span.
To set the maximum signaling rate for a VoIP Span
1. In the Platform Configuration subtree, right-click the VoIP Span, and then click Edit Span(s). The VoIP Span Configuration dialog box appears.
2. Click the VoIP tab.
3. In the Limit signaling to n messages per second box, type the maximum number of messages per second for signaling. The default is
Reordering the Proxies or Gatekeepers List
Limiting VoIP Call Resources
Maximum Signaling Rate Setting for VoIP Spans

ETM® Platform Administration • 121
50 signaling messages per second. A Diagnostic Log message is generated when traffic exceeds this limit. This can be useful for identifying possible threats, such as denial-of-service attacks. When this rate is exceeded, no new calls are allowed to begin until the rate drops below the limit; current calls are unaffected.
4. Click OK to download the configuration change to the Span.
(Not applicable in NAT mode; all non-VoIP TCP and UDP packets are discarded.) If a VoIP Span is in bridge mode, you use the Packet Policy area to define one or more rules that govern what happens to non-VoIP packets that pass through the Span: allow or drop. For example, if you want to allow traffic from a certain subnet but deny it from others, you can define a first rule that specifies the allowed subnet, and then a second rule that specifies that packets from all other subnets are to be dropped. Or you might define rules to block all traffic on port 80 but allow traffic on other ports.
To define a packet rule
1. In the Platform Configuration subtree, right-click the VoIP Span, and then click Edit Span(s). The VoIP Span Configuration dialog box appears.
2. Click the Network tab.
3. Clear the Span operates in NAT mode check box, if selected.
4. Right-click in the Packet Policy area, and then click New.
The Packet Rule dialog box appears.
Packet Policy for VoIP Spans

122 • ETM® Platform Administration
5. For each packet rule, you specify any of the following:
Source—Any means all IP addresses, or you can specify a certain IP address or subnet.
Source port—Any means packets from any source port, or you can type a specific port.
Destination—Any means all IP addresses, or you can specify a certain IP address or subnet.
Destination port—Any means packets directed to any destination port, or you can type a specific destination port.
Protocol—The default is UDP or TCP, which means the rule applies to packets using either protocol. Or select TCP to limit the rule to TCP packets or UDP to limit the rule to UDP packets.
Action—Allow or discard packets that match the rule.
6. Click OK.
7. Repeat for additional rules.
8. Use the up and down arrows to place the rules in the order in which they are to be processed. For example, place a rule allowing specific traffic before a rule denying all other traffic.
9. In the Span Configuration dialog box, click OK to download the configuration change to the Span.
See “Network Tab” in the ETM System Installation Guide for instructions.. Configuring Routes or Interfaces for NAT Mode

ETM® Platform Administration • 123
The ETM 1090 Appliance is a hybrid Appliance that provides one VoIP Span and one TDM digital Span. When the ETM 1090 Appliance connects to the Management Server, a VoIP Span and a TDM Span both appear in the Performance Manager in the Platform Configuration subtree. If you are using only the VoIP Span, you can remove the unused TDM Span from the tree, but first, you must disable communication between the Server and the TDM Span. In the ETM 1090 Appliance, the TDM Span is Span 1 and the VoIP Span is Span 2.
To remove a Span
1. In the Platform Configuration subtree, right-click the Span that you want to remove, and then click ASCII Management. The ASCII Management Interface appears.
2. In the Enter Command box, type
SERVER COMM OFF 1
then press ENTER.
Communication between the Management Server and the Span is now disabled.
3. Right-click the disabled Span, and then click Edit.
4. The Span Configuration dialog box appears. Click Remove.
5. A verification message appears. Click Yes to accept the changes.
The unused TDM Span is removed from the tree.
To enable the Span again, type the following command via the ASCII Management Interface for the VoIP Span or at the Console port of the Card: SERVER COMM ON 1. Once communication is enabled between the Server and the Span, the Span reconnects and reappears in the tree.
(Not available on AAA or dedicated CRC Appliance) Ping functionality is provided to aid in troubleshooting Span network connectivity issues. Ping is available from both the Ping Tool in the Performance Manager and a command line (ASCII Management Interface, Telnet, or a serial connection). To ping from a command line, use the following ETM Command: PING <IP_address>
To ping using the Ping Tool
1. In the Performance Manager tree pane, right-click the Span, and then click Tools | Ping. The Ping Tool appears.
Removing an Unused TDM Span in the ETM® 1090 Appliance
Ping Tool

124 • ETM® Platform Administration
2. In the Ping boxes, type the IP address of a network resource that
should be reachable from the Span (for example, the ETM Server host).
3. Press ENTER or click the Start the job icon. Below is a sample of the output from a successful ping:
• To pause a running job, click the Pause the running job icon.
• To stop a running job, click the Stop the running job icon.
• To clear the screen of text, click the Clear the screen text icon.
• To prevent the screen from automatically scrolling to new text, click the Auto scroll to new text icon, which is selected by default.

ETM® Platform Administration • 125
(Not available on AAA or dedicated CRC appliance) Traceroute functionality is provided to aid in troubleshooting Span network connectivity issues. Traceroute is available from both a Traceroute Tool in the Performance Manager and a command line (ASCII Management Interface, Telnet, or a serial connection).
To execute traceroute from a command line, use the following ETM Command: TRACEROUTE<IP_address>, where <IP_address> is the IP address of a network resource that should be reachable from the Span, such as the Management Server host. To execute traceroute from the Traceroute Tool in the Performance Manager, use the following procedure.
To execute traceroute from a Span with the Traceroute Tool
1. In the Performance Manager tree pane, right-click the Span, and then click Tools | Traceroute.
The Traceroute Tool appears.
2. In the Traceroute boxes, type the IP address of a network resource
that should be reachable from the Span (for example, the ETM Server host).
3. Press ENTER or click the Start the Job icon.
Traceroute Tool

126 • ETM® Platform Administration
• To pause a running job, click the Pause the running job icon.
• To stop a running job, click the Stop the running job icon.
• To clear the screen of text, click the Clear the screen text icon.
• To prevent the screen from automatically scrolling to new text, click the Auto scroll to new text icon, which is selected by default.
Sample Traceroute output

ETM® Platform Administration • 127
On VoIP Spans using SIP, you can use the Signaling Dump Tool in the Performance Manager to view the payload for SIP signaling packets as seen by the Span on the bridged interfaces.
To view a signaling dump in the Signaling Dump Tool
1. In the Performance Manager tree pane, right-click a VoIP Span, and then click Tools | Signaling Dump. The Signaling Dump Tool appears.
2. In the Show <protocol> signaling field, leave the default of Any.
Only SIP signaling is shown.
3. Press ENTER or click the Start the Job icon. Sample output appears on the next page.
Signaling Dump Tool
You can also view signaling via ETM Commands at a command line.

128 • ETM® Platform Administration
• To pause a running job, click the Pause the running job icon.
• To stop a running job, click the Stop the running job icon.
• To clear the screen of text, click the Clear the screen text icon.
• To prevent the screen from automatically scrolling to new text, click the Auto scroll to new text icon, which is selected by default.
You can only remove Span icons when the Span is not communicating with the Management Server. This removes the Server’s copy of the Span’s configuration. If the Span subsequently reconnects to the Server, the Server accepts and stores the Span’s configuration as though it were a new Span.
To remove a Span from the tree pane
1. In the Platform Configuration subtree, right-click the Span, and then click Edit Span(s). The Span Configuration dialog box appears.
2. Click Remove.
Removing a Span from the Tree Pane

ETM® Platform Administration • 129
Command-Line Interface in the GUI The ASCII Management Interface in the Performance Manager provides a command-line interface from which you can view Card and Span settings and status information using ETM Commands. Changes made via the ASCII Management Interface are identical to those made via the Card or Serial port; they do not change the Server’s copy of the configuration.
See "Alphabetical Listing of Commands" in the ETM® System Technical Reference for an alphabetical listing and explanation of the ETM Commands, or type Help in the ASCII Management Interface.
To open and use the ASCII Management Interface
1. In the Platform Configuration subtree, right-click the Card or Span you want to manage, and then click ASCII Management. The ASCII Management Interface appears.
2. In the Enter Command box, type the command, and then press
ENTER.
IMPORTANT If you open the ASCII Management Interface by right-clicking a Card, you can see and change settings for the Card and for Span 1 on the Card. To manage other licensed Spans on the Card, right-click the specific Span in the Platform Configuration subtree.
How to Access the ASCII Management Interface

130 • ETM® Platform Administration
To manually terminate calls, Allow Call Terminations must be selected on the Firewall tab of the Span Configuration dialog box.
To manually terminate calls using the ASCII Management Interface
1. In the Span Groups or Platform Configuration subtree of the Performance Manager tree pane, right-click the Span that monitors the channel on which the call is occurring, and then click ASCII Management. The ASCII Management Interface appears with the name of the selected Span in the title bar.
2. In the Enter Command box, type one of the following:
• To terminate the current call on a specific channel, type
TERMINATE <channel number>
For example, to terminate the current call on channel 8, type
TERMINATE 8
• To terminate all calls in progress on the Span, type TERMINATE ALL
3. Press ENTER. The call on the specified channel(s) is immediately terminated.
Terminating Calls via the ASCII Management Interface
For a complete list of ETM® Commands, see "Alphabetical Listing of Commands" in the ETM® System Technical Reference.
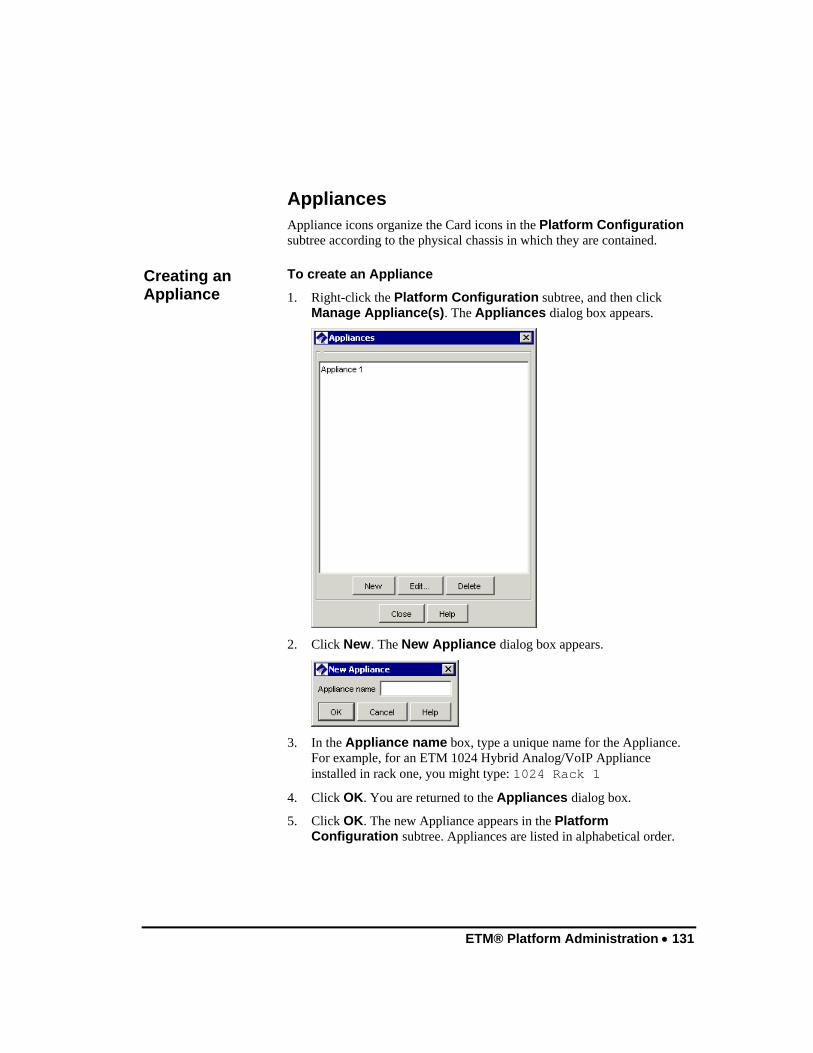
ETM® Platform Administration • 131
Appliances Appliance icons organize the Card icons in the Platform Configuration subtree according to the physical chassis in which they are contained.
To create an Appliance
1. Right-click the Platform Configuration subtree, and then click Manage Appliance(s). The Appliances dialog box appears.
2. Click New. The New Appliance dialog box appears.
3. In the Appliance name box, type a unique name for the Appliance.
For example, for an ETM 1024 Hybrid Analog/VoIP Appliance installed in rack one, you might type: 1024 Rack 1
4. Click OK. You are returned to the Appliances dialog box.
5. Click OK. The new Appliance appears in the Platform Configuration subtree. Appliances are listed in alphabetical order.
Creating an Appliance

132 • ETM® Platform Administration
Once you move a Card icon to an Appliance icon, you can move it to a different Appliance, but you cannot place it so that it is unassociated with any Appliance. This procedure applies to both initially associating a Card with an Appliance and for moving a Card from one Appliance to another.
To move a Card to an Appliance
1. In the Platform Configuration subtree, right-click the Card, and then click Move Card. To move multiple Cards at once, hold down CTRL while clicking. The Move Card(s) to Appliance dialog box appears.
2. Click the Appliance with which the selected Card is to be associated,
and then click OK. The Card icons move below the specified Appliance in the Platform Configuration subtree.
To rename an Appliance
1. In the Platform Configuration subtree, right-click the Appliance, and then click Edit Appliance(s). The Edit Appliance Name dialog box appears.
2. In the Appliance name box, type the new name, and then click OK.
Moving Cards to an Appliance
Renaming an Appliance
You can also click Edit in the Appliances dialog box to rename the Appliance.

ETM® Platform Administration • 133
You cannot delete an Appliance icon while it contains Cards; you must first move any Cards it contains to another Appliance.
To delete an Appliance
1. Right-click the Platform Configuration subtree, and then click Manage Appliance(s). The Appliances dialog box appears.
2. Click the Appliance you want to delete, and then click Delete.
3. Click Close.
Deleting an Appliance

134 • ETM® Platform Administration
Switches Switches are used to represent the PBX associated with the Appliances and to configure the ETM System for SMDR, NFAS, and SS7 Groups. See "Configuring SMDR, NFAS, and SS7 Groups" in the ETM® System Installation Guide for complete instructions for creating and configuring Switches, NFAS Groups, and SS7 Groups. The procedures below provide instructions for viewing settings and changing various configuration.
To view Switch configuration
• In the Telco Configuration subtree, right-click the Switch, and then click Edit Switch. The Switch Properties dialog box appears.
The Switch Properties dialog box has three tabs:
• General specifies the Switch name and is used to configure basic SMDR processing.
• Advanced is used to associate an Access Code with the Switch and define algorithms for converting partial SMDR extensions to fully qualified phone number.
Viewing Switch Configuration
See "Configuring a Switch for SMDR" in the ETM® System Installation Guide for instructions for configuring the ETM System to use SMDR. See "About SMDR Parse Files" in the ETM® System Technical Reference for instructions for configuring SMDR Parse Files.
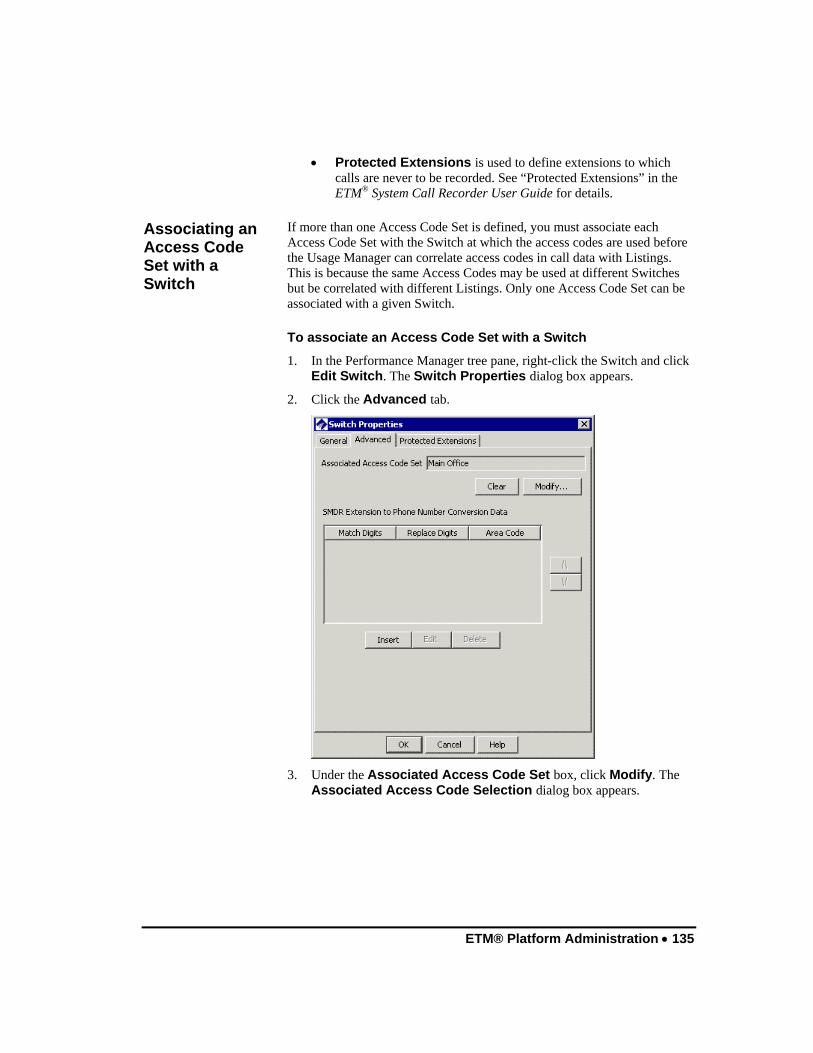
ETM® Platform Administration • 135
• Protected Extensions is used to define extensions to which calls are never to be recorded. See “Protected Extensions” in the ETM® System Call Recorder User Guide for details.
If more than one Access Code Set is defined, you must associate each Access Code Set with the Switch at which the access codes are used before the Usage Manager can correlate access codes in call data with Listings. This is because the same Access Codes may be used at different Switches but be correlated with different Listings. Only one Access Code Set can be associated with a given Switch.
To associate an Access Code Set with a Switch
1. In the Performance Manager tree pane, right-click the Switch and click Edit Switch. The Switch Properties dialog box appears.
2. Click the Advanced tab.
3. Under the Associated Access Code Set box, click Modify. The
Associated Access Code Selection dialog box appears.
Associating an Access Code Set with a Switch

136 • ETM® Platform Administration
4. Click the Access Code Set that contains the Access Codes used on this
Switch.
5. Click OK.
To remove an Access Code Set from a Switch
1. In the Performance Manager tree pane, right-click the Switch and click Edit Switch. The Switch Properties dialog box appears.
2. Click the Advanced tab.
3. Under the Associated Access Code Set box, click Clear.
Removing an Access Code Set from a Switch

ETM® Platform Administration • 137
Switches are used to organize Spans in the Telco Configuration subtree according to location and to configure SMDR, NFAS, and SS7 Groups.
To move a Span to a Switch
1. In the Telco Configuration subtree, right-click the Span, point to Move Spans, and then click To Switch. The Move Span to Switch dialog box appears.
• To move multiple Spans at once, hold down CTRL or SHIFT and select the Spans, and then right-click the selection.
2. Click the Switch to which the Span is to be moved, and then click OK.
The Spans appear in the Switch node of the Telco Configuration subtree.
You cannot delete a Switch that contains Spans. You must first move the Spans to a different Switch.
To delete a Switch
1. Do one of the following:
• Right-click the Telco Configuration subtree, and then click Manage Switches.
• On the Performance Manager main menu, click Manage | Switches. The Switches dialog box appears.
2. Click the Switch you want to delete, and then click Delete.
Moving a Span to a Switch
Deleting a Switch

138 • ETM® Platform Administration
To rename a Switch
1. Do one of the following:
• Right-click the Telco Configuration subtree, and then click Manage Switches. The Switches dialog box appears. Click the Switch you want to rename, and then click Edit.
• On the Performance Manager main menu, click Manage | Switches. The Switches dialog box appears. Click the Switch you want to rename, and then click Edit.
• Right-click the Switch you want to rename, and then click Edit Switch.
The Switch Properties dialog box appears.
2. In the Switch Name box, type the new name. The name can consist of up to 50 characters and can include any special characters, spaces, digits, and letters.
3. Click OK. The Confirm Changes message appears.
4. Click OK.
WARNING Only select a new SMDR parse file if instructed to do so by SecureLogix Support personnel.
Before you can select an SMDR parse file, it must be placed in the Management Server installation directory in the following folder:
<INSTALL_DIR>\ps\software_repository\smdr
To select a new SMDR parse file
1. Under the SMDR Type box, click Modify. The SMDR Data File Selection dialog box appears.
2. Click the SMDR parse file that applies to the PBX in use.
3. Click OK.
Renaming a Switch
Selecting a New SMDR Parse File

ETM® Platform Administration • 139
4. Click OK to apply the changes. The Confirm Changes message appears.
5. Click OK.
To rename an NFAS Group
1. In the Telco Configuration subtree, right-click the NFAS Group and click Edit NFAS Group. The NFAS Group Properties dialog box appears.
2. In the NFAS Group Name box, type the new name.
3. Click OK. The Confirm Changes message appears.
4. Click OK.
To delete an NFAS Group
1. In the Telco Configuration subtree, right-click the Switch to which the NFAS Group belongs, and then click Manage NFAS Groups. The NFAS Groups dialog box appears.
Renaming an NFAS Group
Deleting an NFAS Group
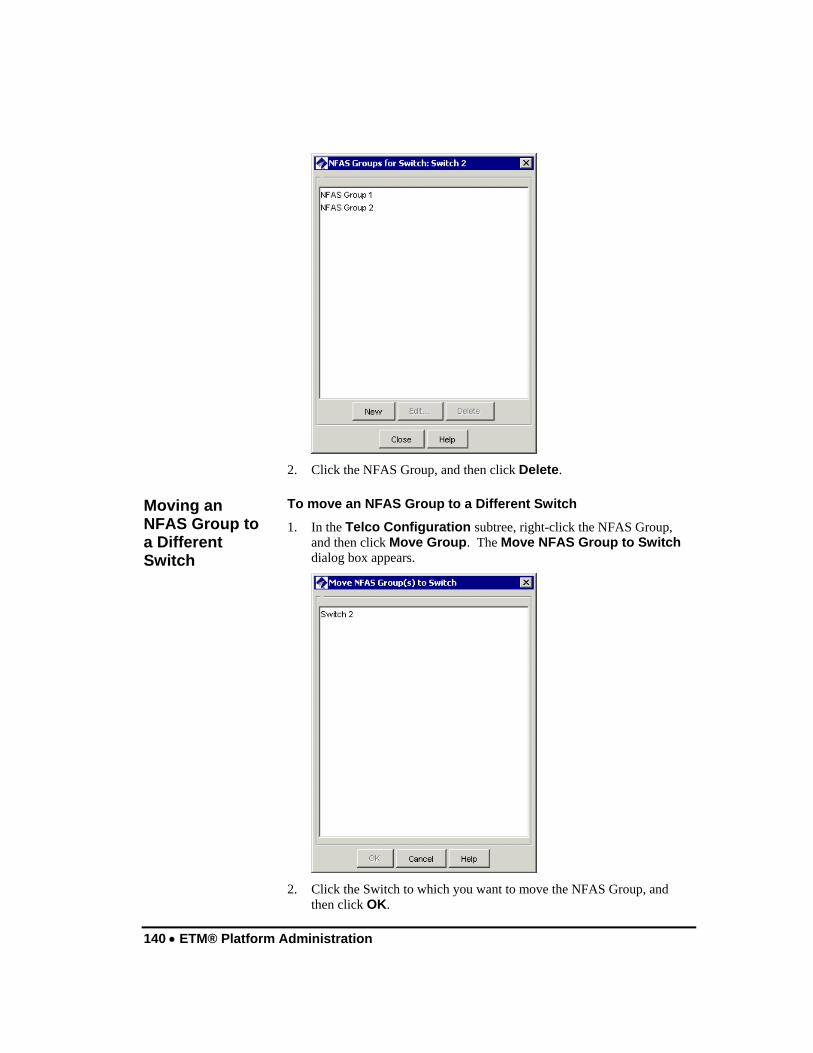
140 • ETM® Platform Administration
2. Click the NFAS Group, and then click Delete.
To move an NFAS Group to a Different Switch
1. In the Telco Configuration subtree, right-click the NFAS Group, and then click Move Group. The Move NFAS Group to Switch dialog box appears.
2. Click the Switch to which you want to move the NFAS Group, and
then click OK.
Moving an NFAS Group to a Different Switch
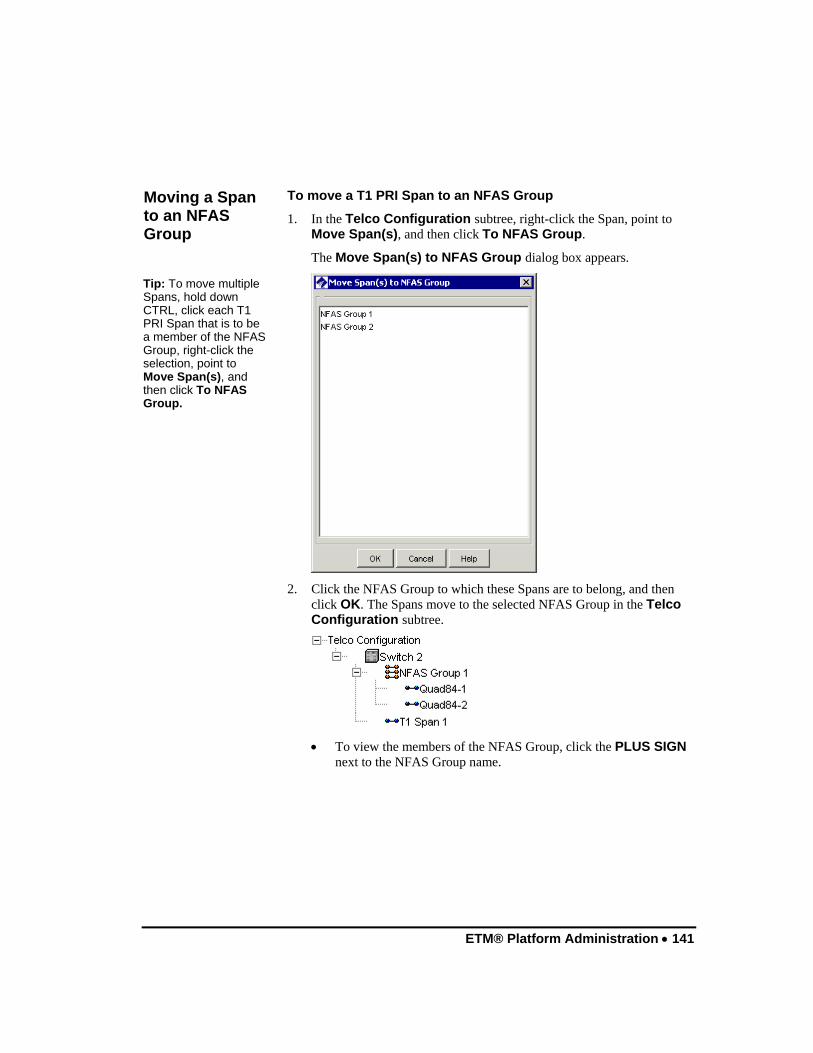
ETM® Platform Administration • 141
To move a T1 PRI Span to an NFAS Group
1. In the Telco Configuration subtree, right-click the Span, point to Move Span(s), and then click To NFAS Group.
The Move Span(s) to NFAS Group dialog box appears.
2. Click the NFAS Group to which these Spans are to belong, and then
click OK. The Spans move to the selected NFAS Group in the Telco Configuration subtree.
• To view the members of the NFAS Group, click the PLUS SIGN
next to the NFAS Group name.
Moving a Span to an NFAS Group
Tip: To move multiple Spans, hold down CTRL, click each T1 PRI Span that is to be a member of the NFAS Group, right-click the selection, point to Move Span(s), and then click To NFAS Group.
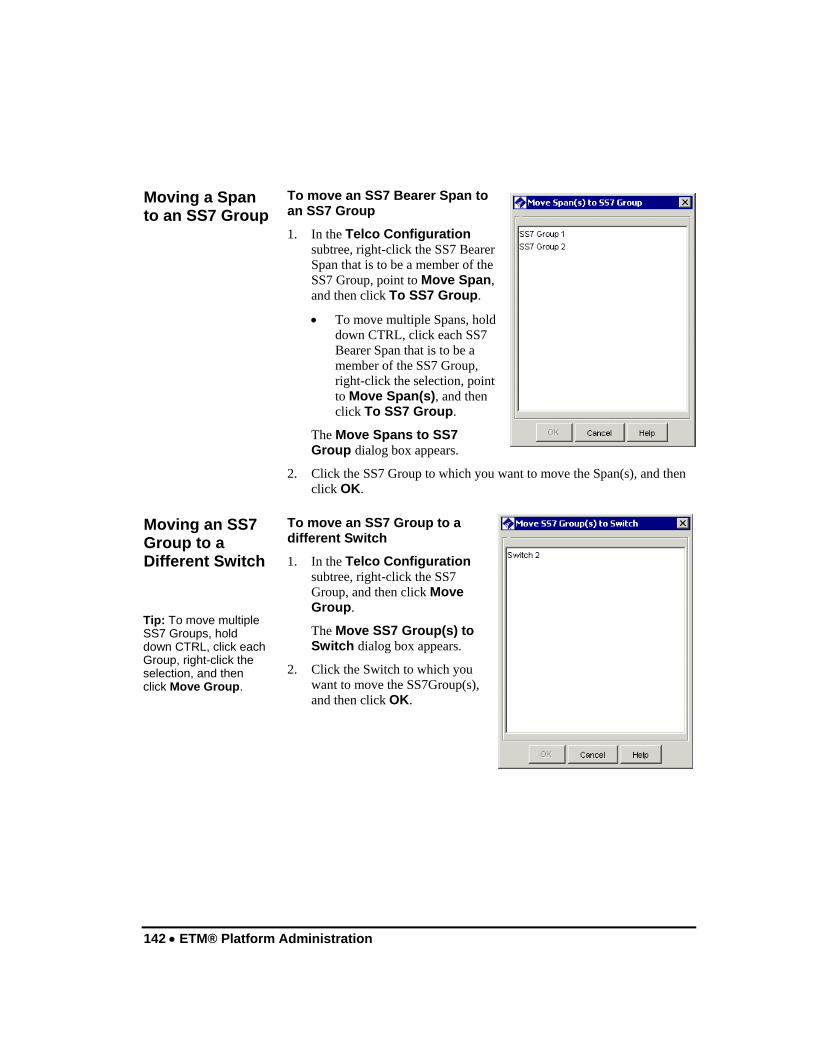
142 • ETM® Platform Administration
To move an SS7 Bearer Span to an SS7 Group
1. In the Telco Configuration subtree, right-click the SS7 Bearer Span that is to be a member of the SS7 Group, point to Move Span, and then click To SS7 Group.
• To move multiple Spans, hold down CTRL, click each SS7 Bearer Span that is to be a member of the SS7 Group, right-click the selection, point to Move Span(s), and then click To SS7 Group.
The Move Spans to SS7 Group dialog box appears.
2. Click the SS7 Group to which you want to move the Span(s), and then click OK.
To move an SS7 Group to a different Switch
1. In the Telco Configuration subtree, right-click the SS7 Group, and then click Move Group.
The Move SS7 Group(s) to Switch dialog box appears.
2. Click the Switch to which you want to move the SS7Group(s), and then click OK.
Moving a Span to an SS7 Group
Moving an SS7 Group to a Different Switch
Tip: To move multiple SS7 Groups, hold down CTRL, click each Group, right-click the selection, and then click Move Group.

ETM® Platform Administration • 143
To delete an SS7 Group
1. Right-click the Switch to which the SS7 Group belongs, and then click Manage SS7 Groups. The SS7 Groups for Switch dialog box appears.
2. Click the Group you want to delete, and then click Delete.
Deleting an SS7 Group

144 • ETM® Platform Administration
Card Settings Card configuration provides network connectivity information that allows the Card and its Spans to communicate on the TCP/IP network and connect to the ETM Server. Cards are initially configured during installation. Refer to the procedures below if you need to change any settings. For complete instructions for installing and configuring a new Card, see the ETM® System Installation Guide.
To rename a Card
1. In the Platform Configuration subtree, right-click the Card, and then click Edit Card(s). The Card Configuration dialog box appears.
2. In the Card Name box, type the new name, and then click OK. The
change is downloaded to the Card and appears in the Platform Configuration subtree.
Important If you change a Card’s IP address (for example, if your network environment changes), be sure to also add the new IP address to the list of authorized Card IPs accessed via the Manage menu.
To change a Card’s IP address and/or subnet
1. In the Platform Configuration subtree, right-click the Card, and then click Edit Card(s). The Card Configuration dialog box appears.
2. Click the Details tab.
Renaming a Card
Changing a Card’s IP Address and Subnet
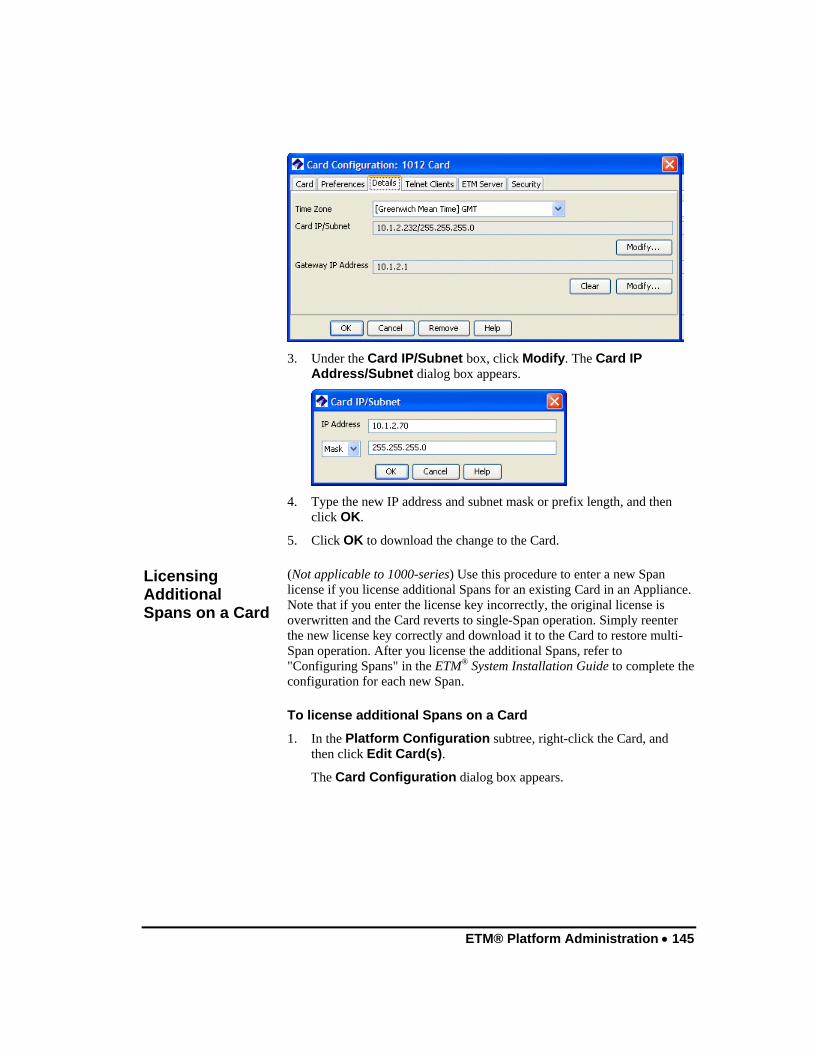
ETM® Platform Administration • 145
3. Under the Card IP/Subnet box, click Modify. The Card IP
Address/Subnet dialog box appears.
4. Type the new IP address and subnet mask or prefix length, and then
click OK.
5. Click OK to download the change to the Card.
(Not applicable to 1000-series) Use this procedure to enter a new Span license if you license additional Spans for an existing Card in an Appliance. Note that if you enter the license key incorrectly, the original license is overwritten and the Card reverts to single-Span operation. Simply reenter the new license key correctly and download it to the Card to restore multi-Span operation. After you license the additional Spans, refer to "Configuring Spans" in the ETM® System Installation Guide to complete the configuration for each new Span.
To license additional Spans on a Card
1. In the Platform Configuration subtree, right-click the Card, and then click Edit Card(s).
The Card Configuration dialog box appears.
Licensing Additional Spans on a Card

146 • ETM® Platform Administration
2. In the Span License Key box, type or paste the new key.
3. Click OK. The key is downloaded to the Card and the newly licensed Spans appear in the Performance Manager tree pane.
To view how many Spans are licensed on the current Card
1. Right-click the Card, and then click ASCII Management. The ASCII Management Interface appears.
2. In the Enter Command box, type SHOW LICENSE, and then press
ENTER.
Viewing the Number of Licensed Spans on a Card

ETM® Platform Administration • 147
When a Card initially establishes connection with the Server, its DES Key must match the default value in the Management Server’s twms.properties file for the Server to accept the connection. Once the Server has stored a copy of the Card’s configuration, you can change the DES Key to a unique value using the Card Configuration dialog box. This value is then pushed to the Card, and becomes the value that the Server requires to accept connection from that Card.
IMPORTANT You can set this value simultaneously for multiple Cards when you want them to have the same value.
To change the DES Key
1. In the Platform Configuration subtree, right-click the Card, and then click Edit Card(s). The Card Configuration dialog box appears.
• To set the value simultaneously for multiple Cards, hold down CTRL or SHIFT and select the Cards, and then right-click the selection, and then click Edit Card(s).
2. Click the Security tab.
3. In the DES KEY String box, type the new DES key. The DES Key
must contain 16-50 characters and can consist of any combination of letters, digits, spaces, and special characters except the pipe ( | ) symbol.
Changing the DES Key for Card/Server Communication
148 • ETM® Platform Administration
IMPORTANT Only perform this procedure when instructed to do so by SecureLogix personnel.
You can install software on multiple Cards at once when the Cards are the same model. Otherwise, you must select individual Cards.
WARNING When you download a software package to an Appliance Card, it is imperative that you do not reboot or power cycle the Card until the upgrade is complete, or the firmware may become corrupted, rendering the Card inoperable. The Card automatically reboots when the upgrade is complete. If you believe the Card has become unresponsive, be certain that 15 minutes have elapsed since you began the download before you manually power cycle or reboot the Card. Before power cycling the Appliance, connect via a serial connection if possible and call SecureLogix Customer Support.
How long a Card upgrade takes varies depending on the size of the package and which firmware devices are being reprogrammed. During a Card upgrade, the compact flash (hard drive) is first reprogrammed; then, depending on the upgrade, the boot flash and one to six other firmware devices may be reprogrammed. The firmware devices are verified against the new code; if different, they are reprogrammed. Verification can take from 20 to 120 seconds per device (depending on the size of the device) and reprogramming can take from 30 to 240 seconds per device.
During reprogramming of the devices, interrupts are ignored, so the Card is very quiet. This is normal and does not indicate a problem. When reprogramming is complete, the Card automatically reboots. This should occur in no more than 15 minutes.
In rare cases, errors do occur that render the Card unresponsive. Should the Card become completely unresponsive, a "watchdog timer" will normally cause the Card to automatically reboot. If it does not and you believe the Card is completely unresponsive, be certain that 15 minutes have elapsed since you began the download, connect via a serial connection if possible, and call SecureLogix Customer Support. Do not manually power cycle or reboot the Card.
To download new software to a Card
1. In the Platform Configuration subtree, right-click the Card, and then click Manage Software. To select multiple same-model Cards, hold down CTRL, and then click each Card.
The ETM Platform Software Installation dialog box appears.
Downloading New Software to a Card

ETM® Platform Administration • 149
2. Under the Software Package box, click Modify.
The Software Version Selection dialog box appears.
3. Click the correct software file, and then click OK. You are returned to
the ETM Platform Software Installation dialog box.
4. Be sure that the Install box is selected, and then click OK. The software is downloaded to the Card.
If you need to assign one or more Cards to a different Management Server (or if the Management Server's IP address is to change), use the procedure below. This procedure applies only to Cards that are already communicating with a Management Server.
CAUTION When you change the Management Server IP address, and then click OK, the Card will disconnect from this Server and attempt to connect to the new Server. Before you click OK to push the configuration changes to the Card, be sure that the Management Server Port specified on the ETM Server tab and the DES Key String specified on the Security tab of the Card Configuration dialog box match those specified in the twms.properties file of the new Server. Otherwise, the Card will fail to connect to any Server and you must use an authorized Telnet client or a direct serial connection to the Card to change the TCP/IP port and/or DES Key to enable communication.
Moving a Card to a Different Management Server
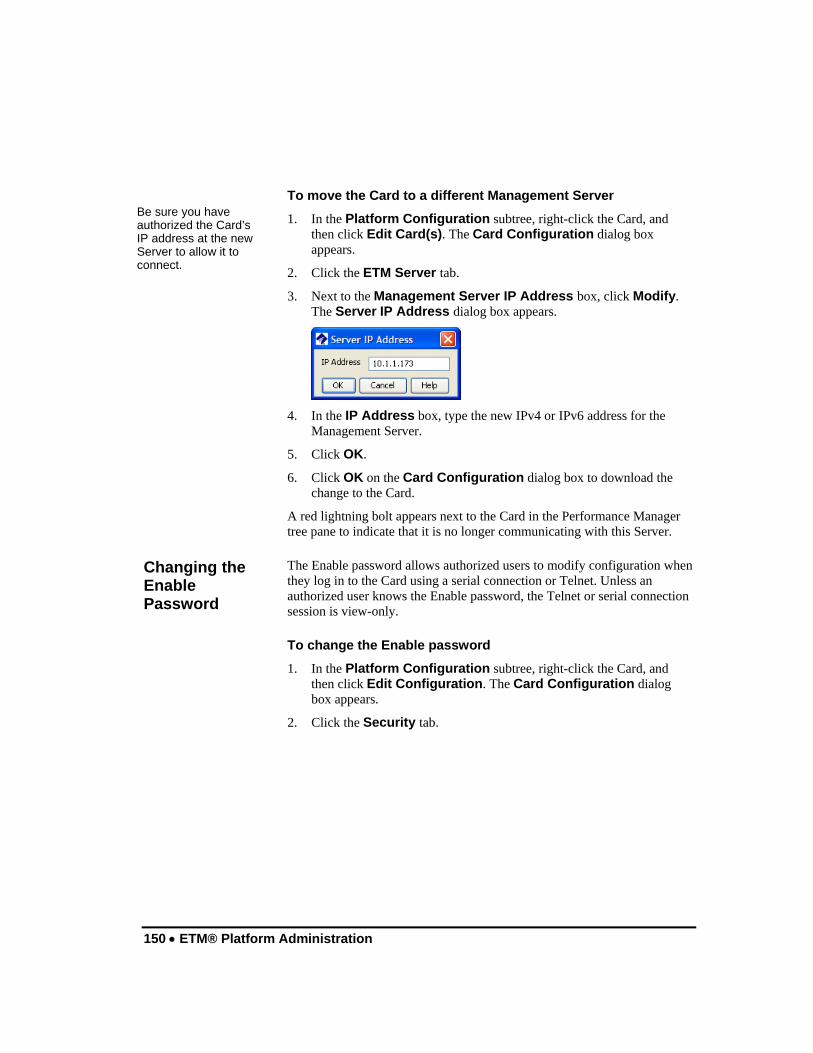
150 • ETM® Platform Administration
To move the Card to a different Management Server
1. In the Platform Configuration subtree, right-click the Card, and then click Edit Card(s). The Card Configuration dialog box appears.
2. Click the ETM Server tab.
3. Next to the Management Server IP Address box, click Modify. The Server IP Address dialog box appears.
4. In the IP Address box, type the new IPv4 or IPv6 address for the
Management Server.
5. Click OK.
6. Click OK on the Card Configuration dialog box to download the change to the Card.
A red lightning bolt appears next to the Card in the Performance Manager tree pane to indicate that it is no longer communicating with this Server.
The Enable password allows authorized users to modify configuration when they log in to the Card using a serial connection or Telnet. Unless an authorized user knows the Enable password, the Telnet or serial connection session is view-only.
To change the Enable password
1. In the Platform Configuration subtree, right-click the Card, and then click Edit Configuration. The Card Configuration dialog box appears.
2. Click the Security tab.
Be sure you have authorized the Card’s IP address at the new Server to allow it to connect.
Changing the Enable Password

ETM® Platform Administration • 151
3. In the Enable Password and Confirm Enable Password boxes,
type the new password.
4. Click OK.
If the Card Security level is currently Low or Med, use the following procedure to change the level. If the security level is currently set to High, you must change the security level using ETM Commands from a serial connection to the Console port. See "ETM® Commands" in the ETM® System Technical Reference for instructions.
Only the following network- and security-related Card configuration settings are affected by the Security Level setting; the Card security level does not affect other configuration items:
• Telnet access—Telnet is only allowed when the Security level is set to Low.
• Network connection information—Netmask, gateway IP address, Management Server IP address, Management Server port.
• Security settings—DES Key, Card security level, Enable password.
To change the Card security level
1. In the Platform Configuration subtree, right-click the Card, and then click Edit Card(s). The Card Configuration dialog box appears.
2. Click the Security tab.
3. In the Card Security Level box, click the down arrow and select the appropriate security level.
Changing the Card Security Level
152 • ETM® Platform Administration
Low—Telnet allowed from authorized Telnet clients. Change security- and network- related configuration via the Performance Manager, Telnet, or the Card serial port.
Medium—No Telnet allowed. Change security- and network- related configuration via the Performance Manager or the Card serial port.
High—No Telnet allowed. Change security- and network- related configuration via the Card serial port only.
To disconnect a Card from the Management Server
1. On the Performance Manager main menu, click Manage | Authorized Cards. The Authorized Cards dialog box appears.
2. Click the IP address of the Card you want to disconnect, and then click Delete.
3. Click OK to accept the changes and close the dialog box.
4. In the Platform Configuration subtree, right-click the Card, and then click ASCII Management. The ASCII Management Interface for the selected Card appears.
5. Type Reboot and press ENTER. The Card disconnects from the Server and a red bolt appears next to the Card in the tree.
6. See "Removing a Card from the Tree Pane" on page 152 for instructions for deleting the Card icon, if necessary.
A Card must be inactive (that is, not communicating with the Management Server) before you can remove it from the tree pane. If a red bolt appears beside the Card icon, the Card and its Spans are not communicating with the Server. Use the procedure "Disconnecting a Card from the Management Server" on page 152 to disconnect the Card before removing it.
To remove an inactive Card from the tree pane
• Open the Card Configuration dialog box for the Card, and then click Remove.
Disconnecting a Card from the Management Server
Removing a Card from the Tree Pane

ETM® Platform Administration • 153
Managing Telnet Logins Authorized users can Telnet to a Span to view and set Card and Span configuration. The following security features protect the Cards and Spans from unauthorized Telnet access:
• The IP address of a Telnet client must be authorized to connect to the Card. Each Card has a Telnet Clients list and rejects Telnet connections from any computer not listed. For instructions for allowing Telnet clients, see "Authorizing Client Connections" on page 53.
• A valid username and password must be provided to connect via Telnet, and the Enable password for the Card must be provided to modify settings.
• If three login attempts fail within 10 minutes, the Telnet port closes; if six Telnet login attempts fail within 10 minutes, the Card shuts down its Telnet Server for 60 real-time minutes, preventing Telnet access. For details about failed Telnet login attempts, see "Failed Telnet Logins Shut Down Telnet Server" on page 155.
Telnet is only allowed when the Card Security Level is set to Low. For more information about the Card Security Level, see "Changing the Card Security Level" on page 151.
You can authorize certain computers as Telnet clients from which authorized users can access the Card and its Spans to view or change configuration. You can authorize up to 64 Telnet clients. Telnet access can be useful, for example, if network problems interrupt communication between the ETM Server and the Cards/Spans. As a security feature, Telnet is only allowed from computers whose IP addresses are listed in this tab. A Card and its Spans only accept Telnet connections if the Card security posture is set to LOW.
To authorize Telnet clients
1. In the Platform Configuration subtree, right-click the Card, and then click Edit Card(s).
The Card Configuration dialog box appears, as shown on the following page.
2. Click the Telnet Clients tab.
Authorizing Telnet Clients
See "Changing the Card Security Level" on page 151 for more information. See "Telnet Login to Spans" on page 155 for more information about Telnet access to Cards and Spans.

154 • ETM® Platform Administration
• To authorize a specific IP address, click New and then click IP
Address. The Telnet IP Address dialog box appears.
a. Type the IPv4 or IPv6 address of the Card.
b. Click OK.
• To authorize a range of IP addresses, click New and then click IP Range. The Telnet IP Range dialog box appears.
a. In the IP Address box, type the IPv4 or IPv6 base
address.
b. If you typed an IPv6 address, click the down arrow and select Prefix, and then type the prefix length.
c. If you typed an IPv4 address, select Mask and type the subnet mask or select Prefix and type a prefix length.
d. Click OK.
3. Click OK on the Card Configuration dialog box. The change is downloaded to the Card.

ETM® Platform Administration • 155
Telnet clients are authorized per Card, but each Span has its own Telnet Server port. When you log in via Telnet, you can specify the Span you want to access. If you login to a Card via Telnet without specifying a Span port, you access Span 1 by default (port 23).
To Telnet to a specific Span
• After the IP address, type a space and then type the port number allocated to the Span that you want to access as follows:
Span 2—port 24
Span 3—port 25
Span 4—port 26
For example, to Telnet to Span 3 of a Card at IP address 199.199.9.9, type: telnet 199.199.9.9 25
When an attempt to log in to a Span via Telnet fails, the current time is recorded, a timer is started, and a notification is sent to the Diagnostic Log. If three Telnet login attempts fail within 10 minutes, the port is shut down (Telnet exits). If six Telnet login attempts fail within 10 minutes, the Span shuts down its Telnet Server for 60 real-time minutes, preventing Telnet access. Each failed login and the shutdown of the Telnet Server appears as SECURITY System Event in the Diagnostic Log.
Telnet Login to Spans
Failed Telnet Logins Shut Down Telnet Server
156 • ETM® Platform Administration
To see when the Telnet Server will be reactivated
1. In the Performance Manager tree pane, right-click the Span, and then click ASCII Management. The ASCII Management Interface appears.
2. In the Enter Command for Span box, type:
SHOW TELNET
Press ENTER. The Telnet Server restart time is displayed in the following format: Telnet Server Resume Time: Fri Jul 28: 11:55 2001
Note that the time displayed is Greenwich Mean Time (GMT), not local time. To determine the offset between GMT and local time, see "Viewing Time Offset" below.
To view the offset between GMT and local time
1. In the Performance Manager tree pane, right-click the Span, and then click ASCII Management. The ASCII Management Interface appears.
2. In the Enter Command box, type:
SHOW TIME
The local time, Greenwich Mean Time (GMT), GMT offset, and time zone appear, similar to the example below:
Local: Mon Sep 8 16:05:40 2003
GMT: Mon Sep 8 21:05:40 2003
GMT Offset: -5:00:00 (hh:mm:ss)
Time Zone: America/Chicago
To restart the Telnet Server before the time has expired, restart the Span.
CAUTION If you restart the Span, you will lose all active Policy processing and call monitoring information. Call traffic proceeds unaffected.
To restart the Span
1. In the Performance Manager tree pane, right-click the Span, and then click ASCII Management. The ASCII Management Interface appears.
2. In the Enter Command box, type: RESTART
3. Press ENTER.
Viewing Telnet Server Status
Viewing Time Offset
Restarting the Telnet Server
ETM® Platform Administration • 157
Using Last Resort Card Recovery When an Appliance Card is installed for the first time or when an Appliance Card loses connectivity because of a partially implemented or malformed download of a Policy, file, or software package, errors may occur that prevent the Appliance Card from booting into normal operating mode. The "Last Resort" Appliance Card recovery boot image was developed to recover an Appliance Card that cannot boot into normal operating mode.
Each Card in the Appliance uses a boot image, programmable devices (FPGAs and CPLDs), and a compact flash disk during normal booting. During upgrades, it is possible for the boot image, programmable devices, and compact flash disk to become corrupted. In some cases, the corruption can cause the Appliance Card to become unresponsive.
The Appliance Cards have 2 pages of boot flash: Page 0 is used during normal operation; Page 1, or the backup page, contains the Last Resort boot image and Failsafe mode boot. Unlike Fail-Safe mode, the Last Resort boot image is self-contained and does not require any support files on the compact flash to operate. The Last Resort boot image is designed to either recover a corrupted compact flash or completely rebuild a blank compact flash. The Last Resort boot image can still operate when some of the programmable devices are either completely blank or programmed incorrectly. The Last Resort also allows the rebuilding of the page 0 boot image.
IMPORTANT Last resort is factory-installed on all Appliances shipped with v5.0.l or later. If you are upgrading from a previous version, see the SecureLogix Knowledge Base or contact Customer Support for instructions for installing Last Resort before beginning the Appliance upgrade.
Last Resort communicates with the Management Server on a TCP network. When Last Resort is running on the Card, the script requests the network connection parameters. If the Card has connected to the Management Server at least once prior to entering Last Resort, the TCP network values presented are those last used to communicate with the Management Server. If the Card has not connected, the Last Resort script presents the TCP network default values. These values may not be the correct route to the Management Server; you will type the correct values at the script prompts. Each time the Card's Span 1 application executes, it updates the Card with the TCP parameters to ensure the current route to the Management Server is stored and available to Last Resort.
About Last Resort
Note: Fail-Safe mode is a restricted mode of operation that provides some ability to recover from ETM® Application errors, but Fail-Safe mode requires that a significant portion of the compact flash and firmware be operational.
Using Last Resort

158 • ETM® Platform Administration
Before running Last Resort, gather the following information:
• Script name (e.g., LastResort-SLC8241-0.0.1-bootstrap)
• Card IP address (e.g., 10.1.2.55)
• Card Gateway IP (e.g., 10.1.2.1)
• Card Netmask (e.g., 255.255.255.0)
• Management Server IP address (e.g., 10.1.1.173)
• Management Server port (e.g., 4313)
IMPORTANT Contact SecureLogix Customer Support before attempting to recover a Card with Last Resort!
To recover a Card using Last Resort
1. Attach an RS-232 serial cable from the Console port to the appropriate serial port on your terminal.
2. Start the terminal emulation application (such as HyperTerminal) on your terminal. Configure your terminal using the following serial port settings:
• 115,200 bps
• no parity
• 8 data bits
• no flow control
• 1 stop bit
3. Press any key on your keyboard to activate the screen.
4. Press and hold the Service Switch, and then power on the Appliance or press the Reset switch.
5. Continue to hold the Service Switch until the Error LED turns red. The Error LED stays red for 5 seconds.
6. Release the Service Switch while the Error LED is red.
7. A script similar to the following appears on your terminal:
********************************************************Downloading the Last Resort bootstrap file: LastResort-SLC8241-0.0.1-bootstrap
********************************************************Last Resort - Version 1.01 - 06 January 2005
Recovering a Card Using Last Resort

ETM® Platform Administration • 159
Please specify the script filename and the IP parameters needed to connect to the Last Resort Server or MS. Enter 'q' at any prompt to restart at the script prompt. Hit 'Enter' to accept the default. The default values and default script will be used if a script name is not specified within 60 seconds.
Enter script name [LastResort-SLC8241-0.0.1-bootstrap]:
Enter appliance IP [10.1.2.55]:
Enter gateway IP [10.1.2.1]:
Enter netmask [255.255.255.0]:
Enter MS IP [10.1.1.173]: 10.1.2.46
Enter MS port [4313]:
eth0: driver changed get_stats after register
e100: eth0: e100_watchdog: link up, 100Mbps, full-duplex
-LR- Retrieving LastResort-SLC8241-0.0.1-bootstrap from MS...
********************************************************Running the bootstrap file: /opt/slc/lr/LastResort-SLC8241-0.0.1-bootstrap
********************************************************
*** Downloading the Last Resort toolkit....
Last Resort - Version 1.01 - 06 January 2005
-LR- Parms file defined and read
-LR- Retrieving LastResort-toolkit-SLC824X-0.0.1.tgz from MS...
*** Downloading the version list....
Last Resort - Version 1.01 - 06 January 2005
-LR- Parms file defined and read
-LR- Retrieving SLC8241/versions from MS...
These versions are available:
5.0
4.1
4.0
Enter the version you wish to install:
8. Type the version of Card software that you want to install from the offered versions, and then press ENTER.
The Management Server accepts the connection from the Card, and then transmits the files required to rebuild the compact flash and

160 • ETM® Platform Administration
firmware. When the process is complete, you are prompted to reboot the Card.
9. After the Card has rebooted, perform the "out-of-the-box" setup procedures as described in "Initial Card Configuration" in the ETM® System Installation Guide.
The Service switch is used for both Fail-Safe boot and Last Resort boot. When you are connected to the serial port of the Card, if the Service switch is depressed when the Card initially comes out of reset, a prompt is presented instructing you to release the Service switch to run Last Resort or continue pressing it to enter Fail-Safe mode.
To enter Fail-Safe boot when Last Resort is installed
1. Press and hold the Service Switch, and then power on the Appliance or press the Reset switch. The Error LED will turn red and will remain in this state for 5 seconds.
2. Continue to hold the Service Switch until the Error LED turns off and the Status LED turns yellow.
3. After the Error LED has turned off and the Status LED has turned yellow, release the Service Switch.
Using Fail Safe when Last Resort is Installed
Uninstalling, Modifying, or Repairing the ETM® Applications • 161
Uninstalling, Modifying, or Repairing the ETM® Applications
How to Uninstall, Modify, or Repair the ETM® Applications The sections below provide instructions specific to your operating system for uninstalling, modifying, or repairing the ETM® Applications.
On Windows 98/NT/2000/XP operating systems, you can modify, repair, or remove the ETM System software suite using the Program Maintenance feature of the InstallShield Wizard.
To modify, remove, or repair applications on Windows
1. Insert the installation CD into the CD-ROM drive.
2. Open My Computer, double-click the CD drive letter, and then double-click Software\Installers\Complete\setup.exe. The InstallShield Wizard dialog box appears.
3. Click Next. The Program Maintenance dialog box appears.
4. Select one of the following options:
• Modify—Select this option if you want to add or remove one or more applications from the ETM System software installation. (If you want to remove the entire ETM System software suite, select Remove.)
a. Select Modify, and then click Next. The Custom Setup dialog box appears.
b. In the Custom Setup dialog box, select the components you want to remove/add, and then click Next.
c. Continue clicking Next until the Ready to Modify dialog box appears, and then click Install. The components you selected are added/removed.
Administering the Applications on Windows
On Windows XP or 98, you can only install the Client applications.

162 • Uninstalling, Modifying, or Repairing the ETM® Applications
• Repair—Select this option if you have inadvertently deleted a necessary ETM System file. The Repair option overwrites installation files; user-created files are not overwritten.
a. Select Repair, and then click Next until the Ready to Repair the Program dialog box appears.
b. Click Install. The InstallShield Wizard reinstalls the necessary files.
• Remove—When you uninstall the ETM System applications from your computer, no user-created files are changed or removed and the ETM system file structure is not deleted.
a. Select Remove, and then click Next.
b. The Remove the Program dialog box appears.
c. Click Remove. The ETM System applications, desktop icons, Start menu items, and services are removed from your computer. The ETM System directory structure, which contains all user-modified files, are saved to a backup directory. The backup directory is:
<INSTALL_DIR>\Backup
5. When the Installation Complete dialog box appears, click Finish.
On Solaris, you have the options of viewing which packages are currently installed on the machine and removing the applications from the machine.
To view the ETM packages that are installed on your computer
1. Log in to the operating system.
2. Open an XTerm window or another command-line shell.
3. Execute the pkginfo command. (It is not necessary to logon as root to use this command.)
pkginfo | grep <string>
where <string> contains the characters in the package name(s) in which you are interested. For example, display all packages containing the string SLC, type
pkginfo | grep SLC
Administering the Applications on Solaris
Viewing the Installation Packages
Uninstalling, Modifying, or Repairing the ETM® Applications • 163
When you uninstall the ETM Applications from your computer, no user-created files are changed or removed and the ETM System file structure is not deleted. When you uninstall the ETM Management Server or Report Server, a backup script is run that backs up the following files to the locations listed below:
Report Server
/opt/SecureLogix/ETM/backup/SLCRS_MM-DD-YYYY_HH-mm-ss (e.g. SLCRS_02-18-2003_16-05-33)
• ETMReportServer.cfg
• twms.properties
Management Server
/opt/SecureLogix/ETM/backup/SLCMS_MM-DD-YYYY_HH-mm-ss (e.g. SLMS_02-18-2003_16-05-33)
• ETMManagementServer.cfg
• delivery.properties
• npconfig.properties
• ps/software_repository/smdr/*
• smdr.properties
• twms.properties
To uninstall the ETM software on Solaris
1. Logon as root.
2. Stop the ETM Management Server and ETM Report Server.
3. Open an XTerm window or another command-line shell.
4. Execute the uninstall script Uninstall.sh from the ETM System installation directory or from any directory using the full path. For example, type:
/opt/SecureLogix/ETM/Uninstall.sh
5. The script detects each installed package and then automatically starts the uninstall process. When prompted to remove a package, type: y or n.
6. If you are uninstalling the Management Server or Report Server, you are prompted to allow the backup script to run. Type: Y
Removing the Applications
On Solaris, depending on your OS configuration, you may be prompted for the base directory. The base directory is the top-level directory where the ETM® Software is installed.

164 • Uninstalling, Modifying, or Repairing the ETM® Applications

Appendix: System Event Descriptions • 165
Appendix: System Event Descriptions
About System Events This section lists the categories of system events that the ETM® System generates, describes the purpose of each category, and lists specific events defined in each category. You can assign tracking actions to each of these system events so that appropriate personnel are notified when a particular type of system event occurs. Tracks can be defined for an entire category (i.e., Security) or for specific events within a category (i.e., when someone logs in via Telnet). For the procedure for assigning a Track to a system event, see "Setting Track Actions for System Events" on page 26.
Note that other general types of system events can occur within the top-level categories. This is simply a list of defined events for which you can specify individual tracking actions. To be notified of all events of a certain type, add a track to the top-level category.
Error events indicate elevated cabinet temperature or call traffic errors. Many call traffic errors can occur in this category, but cannot have tracks individually assigned to them. If you want to be notified for all call traffic errors, assign a track to the top-level Error Event category. Error events include:
• AAA Service Modem Failure—One or more modems in a AAA Appliance is inoperative.
• Auto Directory Import Failure—An LDAP Directory Import process failed.
• Cooling Fan Failure—The cooling fan in the Appliance is inoperative.
• Hot Cabinet—The Appliance chassis temperature is above 70C.
• Index Maintenance Failure—Attempted database index maintenance failed.
• Partition Split Failure—Database partitioning failed.
• Power Supply Failure—One of the power supplies in the Appliance is inoperative.
Types of System Events
Error Events

166 • Appendix: System Event Descriptions
• Sequential Migrate Failures—Multiple sequential data migrations failed.
• Sequential Purge Failures—Sequential attempts to purge data from the database failed.
• Span Missed Heartbeat—A Span’s heartbeat interval expired without the Span communicating with the Management Server.
• Statistics Computation Failure—The scheduled statistics computation for the database failed.
• Warm Cabinet—Appliance chassis temperature is between 60 and 70C.
Panic events represent potentially severe events, such as a hardware failure or a software exception. Panic is indicated by spontaneous restarting of the Span or Card, or reboot of the Card. Call Customer Support for assistance. Panic events include:
• Application Panic—The ETM application software on the Card detects an internal error and restarts the application.
• Kernel Panic—The Linux operating system on the Card detects an internal error and reboots the Card.
Policy events are associated with Policy enforcement. Policy events include:
• Dial Plan Read Fail—Error in reading the dialing plan on the specified Span, which prevents or affects Policy processing.
• Dirty Policies Found After Automatic Directory Import—One or more dirty Policies were detected following an LDAP Directory import.
• New Policy—A new Policy was installed on the specified Span.
• Policy Read Fail—Error reading a newly installed Policy due to file corruption.
Security events include authorized and unauthorized access, connection, and configuration events. Security events include:
• AAA User Account Locked—A user has exceeded the authorized number of attempts to authenticate to the AAA Service and the user’s account has been locked.
• Bad RS232 Password—An invalid password was provided during an attempted login at the Card Console port.
Panic Events
Policy Events
Security Events

Appendix: System Event Descriptions • 167
• Bad Telnet Password—A user attempted a Telnet login with an invalid password.
• Cloned User—A user created a new user account by copying an existing user account.
• Config Item—A user changed a Card or Span configuration setting and downloaded it to the Card or Span.
• Console Max Failed Login—Three consecutive failed Console port login attempts occurred.
• Created New User—A new user account was defined for the ETM Server.
• Dialtone After Answer—On inbound calls, reports when a second dial tone is detected after the call is answered, which can indicate "through-dialing" of the PBX (dialing into voicemail, a DISA line, or the like, getting dial tone, and then dialing out to a long distance or international number).
• ETM Server Login—A user logged in to the Management Server.
• ETM Server Logout—A user logged out of the Management Server.
• ETM Server Temporary User Lockout—Excessive failed login attempts caused a user account to be temporarily locked.
• File Download—A file, such as a Dialing Plan or SMDR definition, was downloaded to an Appliance component.
• Missing Announcement Alert—A Span is configured for announcement but no announcement file is available.
• New Card Software—A user downloaded new software to a Card.
• New Dial Plan—A user downloaded a dialing plan to a Span.
• New ETM Server Configuration—A user modified Management Server configuration.
• NFAS Address—An NFAS Member w/Primary or Backup D Channel received a connection request from an invalid IP address (one not listed in its NFAS Group members list).
• NFAS DES Communication Error—A received NFAS message was not formatted correctly. This usually indicates a DES key mismatch.
• No DES Key—The specified Card's configuration has no DES key. The Card's DES key must be in sync with that of the Management Server, because the initial handshake between ETM System components is always encrypted to authenticate the connection.

168 • Appendix: System Event Descriptions
• No NFAS Key—An NFAS Group member Span has no NFAS DES key specified. This DES key secures communication between Spans that are members of an NFAS Group.
• Removed User—A user account was deleted.
• RS232 Login—A user logged in via the Card Console port.
• Server Call Termination—A user terminated a call in the Call Monitor.
• Span Call Termination—A Voice Firewall Policy Rule fired that specified Terminate, or a user terminated a call using an ETM Command at a command line.
• Successful Telnet Login—A user connected via Telnet from an authorized IP address.
• Telnet Max Failed Login—Six Telnet login attempts have failed within 10 minutes and the Card has shut down its Telnet Server for 60 minutes as a security measure. See "Failed Telnet Logins Shut Down Telnet Server" on page 155 for more information.
• Unauthorized Telnet Connection Attempted—A user attempted to connect to a Card via Telnet from an invalid IP address.
• Updated Card Configuration—Card configuration was changed via the Performance Manager.
• Updated Span Configuration—Span configuration was changed via the Performance Manager.
• Updated Switch Configuration—Switch configuration was changed via the Performance Manager.
• Updated User—A user account was modified via the Performance Manager.
• Weak DES Key—A weak DES key is in use for encrypting ETM Server communication with the specified Card.
Start/Stop events occur when a Card or the Management Server is shut down or initialized. Start/stop events include:
• Card Halt—The specified Card was shut down in preparation for a power off.
• Card Reboot—The specified Card was rebooted.
• ETM Server Reinitialized—The Management Server has fully reinitialized from standby mode to a normal operational state.
• ETM Server Shutdown—The Management Server was shut down.
• ETM Server Standby—The Management Server entered standby mode.
Start/Stop Events

Appendix: System Event Descriptions • 169
• Span Restart—The Restart command was executed on the specified Span.
• Span Startup—The specified Span has started.
Telco events provide information about telephony events and errors. Telco events include:
• Alarm Change—Associated with Delayed Alarm; indicates the Alarm has changed and remained in the new state during the period set for telco delay.
• Bipolar Violation—The error threshold was exceeded for bipolar violations. (Data sent was corrupt/not translated properly.)
• Bit/CRC Error—The error threshold was exceeded for Cyclic Redundancy Check. (Data sent was corrupt/not translated properly.)
• D Channel Down—The D channel is currently inoperative on the specified PRI Span.
• D Channel Up—A D channel that was previously inoperative is now functioning.
• Delayed Alarm—T1/E1 delayed alarm timeout has expired and alarm will be reported.
• Delayed Alarm Cleared—Previous T1/E1 delayed alarm is cleared.
• Frame Bit Error—Frame bit error threshold exceeded.
• Frame Slip RX+—Positive frame slip threshold was exceeded during receive.
• Frame Slip RX- —Negative frame slip error was exceeded during receive.
• Frame Slip TX+—Positive frame slip threshold was exceeded during transmit.
• Frame Slip TX- —Negative frame slip error was exceeded during transmit.
• Immediate Alarm—T1/E1 alarm has occurred on the specified Span.
• Immediate Alarm Cleared—T1/E1 alarm has been cleared on the specified Span.
• Jitter Over RX—Jitter overrun threshold was exceeded during receive.
• Jitter Over TX—Jitter overrun threshold was exceeded during transmit.
• Jitter Under RX—Jitter underrun threshold was exceeded during receive.
Telco Events
Frame, Bipolar, Bit/CRC, and Jitter errors are timing issues; if the problem persists, check the PBX or trunk for errors.
170 • Appendix: System Event Descriptions
• Jitter Under TX—Jitter underrun threshold was exceeded during transmit.
• Loopback Passthrough Mode Active—The Span is currently in loopback passthrough mode.
• Loopback Passthrough Mode Inactive—The Span was in loopback passthrough mode but no longer is.
• Out of Frame—Out-of-frame threshold was exceeded.
• SS7 Signaling Link Down—The SS7 Signaling Link is down.
• SS7 Signaling Link Up—The previously inoperative SS7 Signaling Link is up.
• Span Set Inline—The specified Span was set inline via an ETM Command. The Span was previously set offline. The Span does not immediately go inline; requires restart.
• Span Set Offline—The specified Span was set offline via an ETM Command and is no longer monitoring calls or enforcing Voice Firewall Policy; it is acting as a passive pass-through device for call traffic.
• Statistics Counters Reset—A user reset the cumulative statistics counters on the Health and Status dialog box.
VoIP events occur in response to such events as signaling anomalies and exceeded call thresholds. VoIP events include:
• Secondary Proxy in Use—The secondary proxy is in use.
• QoS Violation—Codec limits for jitter or packet loss were exceeded.
• Interface Down—An Ethernet interface is down.
• Interface Up—An Ethernet interface is up after having been down.
• Span Call Threshold Exceeded—Maximum concurrent VoIP calls exceeded for the Span.
• VoIP Signaling Anomaly—VoIP signaling anomaly occurred.
• VoIP Signaling Rate Exceeded—VoIP signaling rate exceeded.
Warning events occur in response to such events as unavailable expected files, lost Card/Management Server communication, or fail-safe mode. Warning events include:
• Card Connected to Server in Fail-Safe Mode—The specified Card is in fail-safe mode.
• Cooling Fan OK—The fan in the Appliance had previously failed but is now working.
See "ETM® Commands" in the ETM® System Technical Reference for a complete list and explanation of the ETM Commands.
VoIP Events
Warning Events

Appendix: System Event Descriptions • 171
• Extended ETM Application Disconnect Detected—A Card or Span has been disconnected from the Management Server in excess of a set threshold. This threshold is set in the twms.properties file. See "Variables in the twms.properties File" in the ETM® System Technical Reference for instructions for changing this threshold.
• IPS Poller Failed due to Oracle Resource Busy—IPS Poller Failed multiple times consecutively due to the Oracle resource being busy. See "IPS Detection Engine Polling Interval" on page 42.
• Low Battery—The specified Card has a low battery. Contact SecureLogix Customer Support. Note that Cards have very long life batteries that should last a minimum of 10 years.
• MS-Requested Time Change Prompted Card Reboot—The time on the Management Server differs from the time on a Span by more than 60 seconds, causing all Spans on the Card to reboot. This value is not configurable. At each Span heartbeat, if the Span’s time differs from that of the Management Server by more than 3 seconds, the Management Server requests a Span time change. If the amount of change requested exceeds 60 seconds, the Spans reboot and a diagnostic message is generated.
• MS-Requested Time Zone Change Prompted Card Reboot—The time zone on the Management Server differs from the time zone on a Span, causing the Card to reboot.
• Power Supply OK—A power supply in the Appliance had previously failed but is now functioning.
• Sequential Failed SMDR Resolutions—More than 100 sequentially parsed SMDR records have failed to match a call. Sequential failed SMDR resolutions may indicate a problem with the SMDR parse file installed on the Span, or with the SMDR serial port. You can change this threshold in the ETM Server Properties Tool. The property is named smdr.FailedResolvesWarningCount.
• Sequential Unresolved Inbound SMDR Requests—The threshold for sequential inbound SMDR requests for which no match is found has been exceeded. You can change this threshold in the ETM Server Properties Tool. The property is named smdr.UnresolvedInbountRequestsWarningCount.
See “ETM® Server Properties Tool” on page 32 for instructions for changing these thresholds.

172 • Appendix: System Event Descriptions
Index • 173
Index
Access Codes distribution throttling ............................................................................................. 43 permission ............................................................................................................. 14
Ambiguous Call ...................................................................................................... 101 Appliance ....................................................................................................... 131, 132
configuration ......................................................................................................... 81 debug ..................................................................................................................... 98 deleting ................................................................................................................ 133 health and status .................................................................................................... 82 Last Resort recovery............................................................................................ 157 renaming.............................................................................................................. 132
billing rate decimal precision ................................................................................... 40 blue alarm ................................................................................................................. 84 Call Monitor ............................................................................................. 15, 111, 168 call type ................................................................................................ 58, 86, 90, 103
STU ..................................................................................................................... 101 timeout ................................................................................................................ 103
Card ...................................................................................................... 131, 132, 145 authorize ................................................................................................................ 55 configuration ....................................................................................................... 144 deleting ................................................................................................................ 152 health and status .................................................................................................... 82 moving to different Server .................................................................................. 149 security ................................................................................................................ 151 upgrade ................................................................................................................ 148
CCMI data ................................................................................................................ 51 city/state data
importing ............................................................................................................... 51 client host ........................................................................................................... 24, 53
authorizing ............................................................................................................ 53 remote ................................................................................................................... 53
codec 86 creating .................................................................................................................. 89 definitions.............................................................................................................. 86 deleting .................................................................................................................. 91
command-line interface .......................................................................................... 129 configuration ............................................................................................................ 56
Switch ................................................................................................................. 134 CPN .............................................................................................................. 111, 117 Data Management Tool ............................................................................................ 51 data transfer settings ................................................................................................. 41 database ........................................................................................................ 75, 76, 78
data transfer ........................................................................................................... 41 disconnect .............................................................................................................. 76

174 • Index
login ...................................................................................................................... 76 maintenance .......................................................................................................... 75 Scheduled Tasks ........................................................................................ 77, 79, 80
decimal precision ...................................................................................................... 40 Diagnostic Log ............................................................. 26, 62, 65, 106, 110, 121, 155
data transfer and .................................................................................................... 41 Dialing Plan ........................................................................................................ 81, 92
phone number labels.............................................................................................. 49 dialtone ................................................................................................................... 167 Directory Listings
custom labels ......................................................................................................... 39 importing ................................................................................................... 40, 51, 52
Directory Manager ................................................................................................... 14 email server .............................................................................................................. 56 encryption ................................................................................................................. 62 ETM Database
importing ............................................................................................................... 35 ETM Server Properties Tool..................................................................................... 32 failed login properties ............................................................................................... 44 Fail-Safe mode ....................................................................................................... 170 Import Set reconciliation .......................................................................................... 43 importing
city/state data ......................................................................................................... 51 Directory Listings .................................................................................................. 51
IPS ........................................................................................................................ 15 logs ........................................................................................................................ 25
data transfer and ................................................................................................. 41 Policies .................................................................................................................. 15 polling engine
interval ............................................................................................................... 42 Rule complete delay .............................................................................................. 42
lockout failed logins and .................................................................................................... 44
login ......................................... 13, 14, 16, 19, 20, 24, 25, 31, 72, 153, 166, 167, 168 banner .............................................................................................................. 25, 31 database ................................................................................................................. 76 Management Server............................................................................................... 72 Telnet .................................................................................................................. 155
loopback passthrough status ................................................................................... 106 Management Server ................................................................................ 13, 14, 22, 71
authority ................................................................................................................ 81 communication .................................................................................................... 147 login ...................................................................................................................... 72 Report Server ........................................................................................................ 61 shutting down ........................................................................................................ 25 standby mode ........................................................................................................ 71
NAT ...................................................................................................................... 120 NFAS ............................................................................... 15, 134, 139, 140, 141, 167
deleting ................................................................................................................ 139 moving NFAS Group .......................................................................................... 140 moving Span to NFAS Group ............................................................................. 141
Oracle ....................................................................................................................... 72 client tools ............................................................................................................. 52 errors ..................................................................................................................... 72
Oracle Client Tools

Index • 175
specifying the location of ...................................................................................... 51 password ................................................................................. 13, 16, 19, 20, 150, 167
changing ................................................................................................................ 20 Enable ................................................................................................................. 150 reset ....................................................................................................................... 20 security ................................................................................................................ 167
PBX See Switch Policy .................................. 14, 56, 58, 62, 89, 99, 101, 105, 109, 156, 166, 168, 170
refire Tracks for ..................................................................................................... 48 VoIP .................................................................................................................... 121
Policy Log data transfer and .................................................................................................... 41
Recording ................................................................................................................. 15 Policies .................................................................................................................. 15
Report Server ............................................................................................................ 61 Reports ............................................................................................... 14, 30, 111, 163
city/state data in ..................................................................................................... 51 data transfer and .................................................................................................... 41 Scheduled Report ............................................................................................ 14, 56
Rules ........................................................................................................................ 40 server .......................................................... See Management Server or Report Server SMDR ...................................................................................... 63, 102, 104, 134, 138
debug logging ............................................................................................ 62, 63, 64 parse file .............................................................................................................. 138 refire Tracks .......................................................................................................... 48 timeout ................................................................................................................ 104
SNMP ........................................................................................................... 25, 57, 60 MIB ....................................................................................................................... 58 network manager ................................................................................................... 60 Traps ............................................................................................................... 57, 58
Span ........................................................................................ 84, 102, 103, 116, 130 configuration ......................................................................................................... 93 country code ........................................................................................................ 102 deleting ................................................................................................................ 128 health and status .............................................................................................. 82, 83 license ................................................................................................................. 145 local area/city code .............................................................................................. 103 loopback pass-through mode ............................................................................... 105 MAC address ......................................................................................................... 95 manual inline ......................................................................................................... 93 masking ............................................................................................................... 116 NAT .................................................................................................................... 120 renaming................................................................................................................ 95 signaling dump tool ............................................................................................. 127 SS7 .............................................................................................................. 142, 143 SS7 Span ............................................................................................................. 134 Telnet port ........................................................................................................... 155 traceroute ............................................................................................................. 125
Span tool tip adding .................................................................................................................... 96 disabling ................................................................................................................ 44
SS7 ...................................................................................................................... 142 deleting a Group .................................................................................................. 143
Switch ..................................................................... 134, 137, 138, 139, 140, 142, 168 deleting ................................................................................................................ 137
176 • Index
NFAS .................................................................................................................. 140 renaming.............................................................................................................. 138 SS7 ...................................................................................................................... 142
system events .............................................................................................. 25, 26, 165 and secondary proxies ......................................................................................... 119 error ..................................................................................................................... 165 filtering tracks ................................................................................................. 28, 29 panic .................................................................................................................... 166 policy ................................................................................................................... 166 removing tracks from ............................................................................................ 31 security ................................................................................................................ 166 start/stop .............................................................................................................. 168 telco ..................................................................................................................... 169 telco delay ........................................................................................................... 110 telnet .................................................................................................................... 155 tracks for ............................................................................................................... 26 types .................................................................................................................... 165 VoIP .................................................................................................................... 170 VoIP call quality alert ........................................................................................... 89 VoIP excessive media rate .................................................................................... 89 warning ............................................................................................................... 170
Telnet ..................................................................................................... 153, 167, 168 authorizing logins ................................................................................................ 153 restarting.............................................................................................................. 156 viewing status ...................................................................................................... 156
terminate ..................................................................... 15, 18, 19, 58, 72, 99, 130, 168 time offset ............................................................................................................... 156 Track
Email ..................................................................................................................... 56 refire after SMDR ................................................................................................. 48
Usage Manager ................................................................................................... 30, 61 authorizing connections from ................................................................................ 53 city/state data in reports ......................................................................................... 51 data transfer and .................................................................................................... 41 permission ............................................................................................................. 14
user ........................................................................................................................ 24 copy ....................................................................................................................... 19 creating .................................................................................................................. 16 delete ..................................................................................................................... 20 disconnecting ........................................................................................................ 24 login ................................................................................................................ 18, 24 management .......................................................................................................... 13 monitoring ............................................................................................................. 24 password ......................................................................................................... 13, 22
changing ............................................................................................................. 20 resetting .............................................................................................................. 20
permission changing ............................................................................................................. 21
permissions available ............................................................................................................. 14
security .................................................................................................................. 19 VoIP ................................................................................ 93, 117, 118, 119, 120, 121
call quality alert limit ............................................................................................ 89 codec ..................................................................................................................... 89 excessive media rate .............................................................................................. 89

Index • 177
packet policy ....................................................................................................... 121 proxy/gateway ..................................................................................................... 117
defining ............................................................................................................ 118 deleting ............................................................................................................. 119 limiting ............................................................................................................. 120 reordering ......................................................................................................... 120
signaling rate ....................................................................................................... 120