Embed Size (px)
Citation preview

Global Development Policy Center
www.bu.edu/gdpHCI@GDPCenterPardee School of Global Studies/Boston University
H U M A N C A P I T A L I N I T I A T I V E
MAHESH KARRA, ERIN PEARSON, DAVID CANNING, IQBAL SHAH, RANJITH DE SILVA, ARNJALI SAMARASEKERA
ABSTRACT
This study examines the extent to which ethnolinguistic concordance between women and their lo-cal Primary Health Midwives (PHMs) is associated with women’s receipt of immediate postpartum IUD (PPIUD) counseling services in Sri Lanka. We use observational data from a cluster-randomized stepped-wedge trial in which women who delivered in any one of six hospitals during the trial period were offered antenatal counseling and postnatal health services. Participating hospitals received an intervention that aimed to increase access to postpartum family planning through the provision of enhanced counseling on postpartum contraceptive methods, with an emphasis on the PPIUD, and newly offered immediate PPIUD insertion services. We merge baseline data on women from the main trial with data collected on local PHMs, and we generate indicators of linguistic concordance (whether or not the woman’s spoken language(s) match with the spoken language(s) of her local PHM), ethnic concordance (whether or not the woman’s ethnicity matches with the ethnicity of her local PHM) and their joint interaction (concordance across both ethnic and linguistic dimensions). We focus on receipt of PPIUD counseling, which was a newly offered service integrated into exist-ing postpartum contraception services through this intervention. We assess how these measures of concordance are related to women’s receipt of PPIUD counseling services, controlling for other con-founding variables. We find that women from ethnolinguistic minority groups in Sri Lanka face larger disparities in their receipt of PPIUD counseling. Moreover, we identify ethnic discordance between women and their PHM to be the primary driver of this disparity rather than linguistic discordance. Our findings suggest that matching women and their primary health care providers based on ethnic background is likely to reduce disparities in health service provision, and additional training of PHMs would serve to overcome key ethnically-driven cultural and linguistic barriers that are driving these disparities.
Mahesh Karra is an Assistant Professor of Global Development Policy at the Frederick S. Pardee School of Global Studies at Boston University and Associate Director of the Human Capital Initiative at the Global Development Policy Center.
Erin Pearson is a Senior Researcher at IPAS.
David Canning is a Professor at Harvard T.H. Chan School of Public Health.
Iqbal Shah is a Senior Research Scientist at the Harvard T.H. Chan School of Public Health.
Ranjith de Silva is a Professor at the Sri Lanka College of Obstetricians and Gynaecologists (SLCOG).
Arnjali Samarasekera is from the Sri Lanka College of Obstetricians and Gynaecologists (SLCOG).
Ethnolinguistic Concordance and the Provision of
Postpartum IUD (PPIUD) Counseling Services in Sri Lanka
H C I WO R K I N G PA P E R 0 0 2 • N OV 2 0 1 8

2 www.bu.edu/gdpHCI@GDPCenterPardee School of Global Studies/Boston University
Introduction Poor communication and a lack of mutual trust have long been cited as key determinants of a weak patient-physician relationship, which is fundamental to the lack of provision of effective medical care (1). In particular, interpersonal barriers that result from linguistic, racial, ethnic, or cultural differences between patients and providers may, in fact, exacerbate disparities in utilization, care seeking behavior, and health among minority groups (2–4). Studies have also shown that differential provider treatment towards minorities may explain differences in quality of care and outcomes such as patient satisfaction, adherence to treatment, and disease persistence, among others (5–7). Ethnolinguistic concordance between patients and their providers has become an important dimension of the patient-physician relationship and has been thought to be linked to health care disparities. Most studies that have assessed the role of ethnolinguistic or cultural discordance between patients and providers have emerged from the debate over whether increasing the numbers of minority health professionals would ameliorate health care disparities for minority individuals. Over the last two decades, this debate has largely been informed by a large body of literature that examined the role of minority providers in caring for underserved minority populations (8–10). Several studies have found that patients’ trust, satisfaction, utilization of services, and involvement in decision-making about their health are higher when they share the same race, ethnicity, or language as their provider (2,6,11–13). On the other hand, other studies have found no significant associations between health care quality and physician-patient ethnic concordance (14,15), and the evidence on the benefits of other types of patient-physician concordance, such as gender is even more mixed (16,17). In this study, we examine the relationships between ethnolinguistic concordance and the provision of postpartum contraception counseling services in Sri Lanka. We use data from a cluster-randomized stepped-wedge trial in which women who delivered in any one of six hospitals in the trial were offered antenatal counseling and postnatal health services with the newly added option to receive an immediate postpartum intrauterine device (PPIUD) following their delivery. We merge baseline data on postpartum women from the trial with background data collected on local Primary Health Midwives (PHMs), who are usually the entry point into antenatal care for pregnant women in remote and rural areas. We then generate indicators of linguistic concordance (whether or not the woman’s spoken language(s) match with the spoken language(s) of her local PHM), ethnic concordance (whether or not the woman’s ethnicity matches with the ethnicity of her local PHM) and their joint interaction (woman-PHM concordance across both ethnic and linguistic dimensions). We assess how these measures of concordance are related to women’s receipt of PPIUD counseling services. Our findings address the existing research gaps in two key ways. First, we provide insight into how language and ethnicity play a role in shaping interpersonal care-related outcomes in a low- and middle-income setting where evidence on patient-provider relationships is scarce. Second, we examine how patient-provider relationships across ethnicity and language are independently but also jointly related to differences in the receipt of interpersonal health care, and we are able to disentangle the associations by which both of these sociocultural determinants affect processes of care.

www.bu.edu/gdp 3HCI@GDPCenterPardee School of Global Studies/Boston University
Background Since the end of its 26-year old civil conflict in 2009, Sri Lanka has made great economic progress and has transitioned towards achieving middle-income status (18). Sri Lanka has a highly developed health system, particularly in the areas of obstetric and maternal health care and family planning. Antenatal care in Sri Lanka is free and comprehensive, and 99 percent of Sri Lankan women receive antenatal care at least once during pregnancy (19). Antenatal counselling may be provided at field clinics, at hospitals and hospital clinics, and most often through home visits by PHMs, especially in rural and remote regions. The PHM is referred to as the “front line” health worker for providing domiciliary maternal and child health and family planning services in the community. Each PHM is assigned to oversee a catchment area of 2000 to 4000 people (20). Through systematic home visits, PHMs provide routine care to pregnant women and children as well as family planning services, including counselling and the distribution of contraceptive pills and condoms, to women and couples. PHMs also support local maternal and child health clinics and serve as a link between the community and the institutional health system. Low risk women who begin antenatal counselling at 6 to 8 weeks are typically visited by their local PHM over the course of their pregnancy, and topics related to postpartum health and family planning are routinely discussed as part of these visits (21). Family planning services in Sri Lanka are overseen by the Family Health Bureau (FHB) of the Government of Sri Lanka and by the Sri Lanka Family Planning Association (FPA), and PHMs are trained on the provision of family planning counseling and services by the FHB in collaboration with the FPA. In recognizing the ethnic and linguistic roots of the conflict between the majority Sinhalese, who make up roughly 75 percent of the country’s 21 million people, and the minority Tamil-speaking groups, who make up 24 percent of the population1, the Government of Sri Lanka bestowed national language status to both Sinhala and Tamil, with English as a link language, in the country’s Constitution (22,23). While this provision allows citizens to interact with institutions in any of the three languages, there has been increasing concern by service providers to meet public demand across multiple languages, particularly for Tamil populations. A key reason for this concern in the health sector is the shortage of qualified and multilingual health personnel in both public and private sectors in Tamil-majority areas. In a recent study of health services in Sri Lanka’s Northern Province, a predominantly Tamil region, a majority of interviewed providers and inhabitants identified the shortage of health personnel to be the most pressing obstacle to improving health outcomes (24). Moreover, Sinhalese healthcare providers in the region reported the existence of a linguistic discordance between providers and patients and mentioned the difficulty of working in Tamil communities due to language barriers. In the provision of family planning counseling services in Sri Lanka, counseling materials (brochures, etc.) are typically available and are distributed in all three languages. However, a shortage of multilingual health care providers may act as a barrier to effective counseling and communication of essential reproductive health information, regardless of the availability of counseling materials and family planning supplies. This barrier to effective service provision may be exacerbated if there also exists a mismatch in the distribution of providers relative to the distribution of the population being served by language, particularly for Tamil minorities. If there are too few counselors who speak Tamil
1 According to the 2012 Sri Lanka Census, Sri Lankan Tamils make up 11 percent of the country’s population, while Indian Tamils make up 4 percent of the population. Sri Lankan Moors, who predominantly speak Tamil as their primary language, are estimated to make up 9 percent of the population.

4 www.bu.edu/gdpHCI@GDPCenterPardee School of Global Studies/Boston University
and who work in Tamil-majority regions to serve Tamil clients, then we may find Tamil populations are less likely to receive counseling for family planning. The Postpartum IUD Study The International Federation of Gynaecology and Obstetrics (FIGO), in collaboration with its nationally affiliated Associations of Obstetricians and Gynaecologists, launched an initiative in 2014 to institutionalize postpartum contraceptive services, with a special focus on skill-building for PPIUD service provision, as a routine part of antenatal counselling and delivery room services in six low- and middle-income countries: Sri Lanka, India, Kenya, Tanzania, Nepal and Bangladesh. The FIGO initiative in Sri Lanka was developed and launched in collaboration with the Sri Lanka College of Obstetricians and Gynaecologists (SLCOG) to address the postpartum contraceptive needs of women. The key components of the FIGO-SLCOG initiative in Sri Lanka consisted of: 1) training PHMs, nurses, midwives, and hospital staff (doctors and delivery unit staff) in the provision of counselling and postpartum contraceptive services; 2) institutionalizing the provision of counselling and postpartum contraceptive services, especially the PPIUD, as part of routine delivery services; and 3) ensuring continuity of PPIUD service provision, in which health providers who are trained in provision of PPIUD services are followed to determine whether they continue to provide these services even if they move to other facilities and ensuring the regular supply of IUDs. To assess the impact and performance of the FIGO-SLCOG initiative in Sri Lanka, an independent evaluation was undertaken in six hospitals, four in Sinhala-majority regions and two in Tamil-majority regions, by means of a cluster-randomized stepped-wedge trial (25). As part of the evaluation, detailed baseline data on family planning and PPIUD counseling services received during antenatal care were collected from approximately 42,000 women who delivered in these six study hospitals between September 2015 and March 2017. In particular, women were asked about their receipt of postpartum family planning and PPIUD counseling during pregnancy as well as about their experiences and satisfaction with the counseling that they received. For our analysis, we restrict our sample to women for whom more detailed sociodemographic data were collected. To assess women’s language proficiency, field interviewers recorded the languages in which the interview with the respondent was conducted and also probed the respondent on all languages that she could speak at a native or bilingual level. Independently of this data collection with women, we gather data on the spoken language(s) and ethnicities of PHMs within each hospital’s catchment area. We merge baseline data collected on postpartum women from the trial with the language and ethnicity data collected on local PHMs from a sample of Medical Office of Health (MOH) catchment areas, and we generate indicators of ethnolinguistic concordance by identifying whether or not the woman’s primary language(s) and ethnicity matched with the language(s) and ethnicity of her local PHM. We use these measures to determine how ethnolinguistic similarity is related to receipt of PPIUD counseling. Data and Methods Analytic Sample Data were collected for women who delivered in six hospitals in Sri Lanka between September 2015 and March 2017: Nuwara Eliya District General Hospital, Nawalapitiya District General Hospital, Polonnaruwa District General Hospital, Chilaw District General Hospital, Moneragala District

www.bu.edu/gdp 5HCI@GDPCenterPardee School of Global Studies/Boston University
General Hospital, and Kalutara District General Hospital. Four of the six hospitals (Polonnaruwa, Moneragala, Kalutara, and Chilaw) are located in Sinhala-majority regions of the country, while the other two hospitals (Nuwara Eliya and Nawalapitiya) are located in Tamil-majority regions of the country. Five data collection officers were assigned to each hospital to administer a questionnaire that collected information on each consenting woman’s sociodemographic background characteristics, the location and quality of antenatal counselling, and whether the respondent received postpartum family planning and PPIUD counselling. The goal was to interview all women who delivered in these six hospitals and who consented to be interviewed. A total of 7,191 women for whom more detailed sociodemographic information on ethnicity and language was available were matched to 258 PHMs from 13 MOH areas. In a few PHM catchment areas, more than one PHM was assigned. In the case where all PHMs assigned to the same catchment area had the same ethnolinguistic composition (e.g. all PHMs were ethnic Sinhalese who spoke Sinhala), then they were collapsed into one observation for the entire PHM area. In the case where all PHMs assigned to the same catchment area had the same ethnic composition (either ethnic Sinhalese or non-Sinhalese) but differing linguistic composition, the observation was collapsed by ethnicity and combined to include the most flexible language capacity possible for the area. For example, if a PHM area had an ethnic non-Sinhalese PHM who spoke only Sinhala as well as an ethnic non-Sinhalese PHM who spoke only Tamil, then the PHM would be assigned as having a PHM who was ethnic non-Sinhalese who spoke both Sinhala and Tamil. Observations (both women and PHMs) for whom there was more than one PHM assigned to the PHM area and for whom a clear PHM ethnolinguistic composition could not be ascertained were dropped from the analysis to ensure cleaner identification of concordance between PHMs and women. After dropping observations where information on language and ethnicity for PHMs and women were not clearly coded or missing and observations where women were enrolled prior to the rollout of the FIGO intervention (and were therefore not potentially exposed to PPIUD counseling), we are left with an analytic sample of 4,497 women who delivered in six district general hospitals between September 2015 and March 2017 and who are matched to 245 PHMs from 13 MOH areas. Outcome – PPIUD Counseling Our key outcome variable is whether or not a woman 𝑖𝑖 living in PHM area 𝑗𝑗 (and who is therefore matched to PHM 𝑗𝑗) received PPIUD counseling prior to being admitted to one of our six study hospitals for her delivery. Our selection of this outcome relies on the fact that a pregnant woman’s first interactions with the health system would typically involve her local PHM, especially before she is admitted for delivery, during which time she is likely to interact with a wider range of health personnel. Given that PHMs are often a pregnant woman’s first and most frequent point of contact, as well as her entry point into the cascade of care, we would need to identify an outcome, such as family planning counseling, that reflects a health service that a PHM is likely to provide to a woman before she is escalated through the health system over the course of her pregnancy. Empirical Analysis Our first set of analyses focuses on the role of ethnicity and consists of several specifications that estimate the associations between women’s ethnicity, ethnic concordance between women and their

6 www.bu.edu/gdpHCI@GDPCenterPardee School of Global Studies/Boston University
PHMs, and women’s receipt of PPIUD counseling. We first estimate the association between women’s ethnicity and counseling as follows:
𝑦𝑦𝑖𝑖𝑖𝑖 = 𝛼𝛼 + 𝛽𝛽𝐸𝐸𝑖𝑖 + 𝑿𝑿𝑖𝑖𝛾𝛾 + 𝛿𝛿𝑚𝑚 + 𝜀𝜀𝑖𝑖𝑖𝑖 Here, 𝑦𝑦𝑖𝑖𝑖𝑖 is the PPIUD counseling outcome of interest for woman 𝑖𝑖 living in PHM area 𝑗𝑗, 𝐸𝐸𝑖𝑖 is a categorical variable that indicates woman 𝑖𝑖’s ethnicity: Sinhala, Sri Lankan Tamil, Indian Tamil, Sri Lankan Moor, or Other, with ethnic Sinhala women assigned as the reference group. The vector 𝑋𝑋𝑖𝑖 includes woman-level controls such as educational attainment, age, the number of live births, and whether the woman has ever used a family planning method. In addition, we include a term 𝛿𝛿𝑚𝑚 that denotes MOH fixed effects, and standard errors are clustered at the PHM level. We then examine the relationship between PHM ethnicity and receipt of counseling as follows:
𝑦𝑦𝑖𝑖𝑖𝑖 = 𝛼𝛼 + 𝛽𝛽𝐸𝐸𝑖𝑖 + 𝑿𝑿𝑖𝑖𝛾𝛾 + 𝛿𝛿𝑚𝑚 + 𝜀𝜀𝑖𝑖𝑖𝑖 Here, 𝐸𝐸𝑖𝑖 is a categorical variable that indicates PHM 𝑗𝑗’s ethnicity: Sinhala, Sri Lankan Tamil, Indian Tamil, Sri Lankan Moor, or Other, with ethnic Sinhala PHMs assigned as the reference group.. We then examine the binary relationship between ethnic concordance between women and their PHMs as follows:
𝑦𝑦𝑖𝑖𝑖𝑖 = 𝛼𝛼 + 𝛽𝛽1𝑊𝑊𝐸𝐸𝑖𝑖 + 𝛽𝛽2𝑃𝑃𝐸𝐸𝑖𝑖 + 𝛽𝛽3𝑊𝑊𝐸𝐸𝑖𝑖 ⋅ 𝑃𝑃𝐸𝐸𝑖𝑖 + 𝑿𝑿𝑖𝑖𝛾𝛾 + 𝛿𝛿𝑚𝑚 + 𝜀𝜀𝑖𝑖𝑖𝑖 Here, 𝑊𝑊𝐸𝐸𝑖𝑖 is a binary indicator that signals whether woman 𝑖𝑖 is of Sinhala ethnicity or not, and 𝑃𝑃𝐸𝐸𝑖𝑖 is a binary variable that indicates whether PHM 𝑗𝑗 is of Sinhala ethnicity or not. In following from the previous two specifications, we present a more decomposed interactive specification of the associations between PHM ethnicity, women’s ethnicity, and counseling as follows:
𝑦𝑦𝑖𝑖𝑖𝑖 = 𝛼𝛼 + ∑ ∑ [𝛽𝛽𝑘𝑘𝑘𝑘𝕀𝕀{𝑊𝑊𝐸𝐸𝑖𝑖 = 𝑘𝑘} ⋅ 𝕀𝕀{𝑃𝑃𝐸𝐸𝑖𝑖 = 𝑙𝑙}]𝑘𝑘∈{𝑆𝑆,𝑁𝑁𝑆𝑆}𝑘𝑘∈{𝑆𝑆,𝑁𝑁𝑆𝑆}
+ 𝑿𝑿𝑖𝑖𝛾𝛾 + 𝛿𝛿𝑚𝑚 + 𝜀𝜀𝑖𝑖𝑖𝑖
Here, 𝕀𝕀{𝑊𝑊𝐸𝐸𝑖𝑖 = 𝑘𝑘} is an indicator function that identifies whether woman 𝑖𝑖 is of Sinhalese or non-Sinhalese ethnicity (with women of Sinhalese ethnicity as the reference group), and 𝕀𝕀{𝑃𝑃𝐸𝐸𝑖𝑖 = 𝑙𝑙} is an indicator function that identifies whether PHM 𝑗𝑗 is of Sinhalese or non-Sinhalese ethnicity (with PHMs of Sinhalese ethnicity as the reference group). We can then test the following restrictions:
1. Whether concordance in ethnicity matters, and if so, if concordance matters more for one group than the other (i.e. when Sinhalese women are matched to Sinhalese PHMs, and when non-Sinhalese women are matched to non-Sinhalese PHMs).
2. Whether discordance in ethnicity matters, and if so, if discordance matters more for one group than the other (when Sinhalese women are matched to non-Sinhalese PHMs, when non-Sinhalese women are matched to Sinhalese PHMs).
Our second set of analyses focuses on the role of language and linguistic concordance with their PHM on counseling. We first run a specification to examine the association of being a Tamil-speaking woman on counseling:

www.bu.edu/gdp 7HCI@GDPCenterPardee School of Global Studies/Boston University
𝑦𝑦𝑖𝑖𝑖𝑖 = 𝛼𝛼 + 𝛽𝛽𝐿𝐿𝑖𝑖 + 𝑿𝑿𝑖𝑖𝛾𝛾 + 𝛿𝛿𝑚𝑚 + 𝜀𝜀𝑖𝑖𝑖𝑖 Here, 𝐿𝐿𝑖𝑖 is a binary indicator of whether woman 𝑖𝑖 speaks Tamil or not. We then run a specification to examine the association of being a Tamil-speaking PHM on counseling:
𝑦𝑦𝑖𝑖𝑖𝑖 = 𝛼𝛼 + 𝛽𝛽𝐿𝐿𝑖𝑖 + 𝑿𝑿𝑖𝑖𝛾𝛾 + 𝛿𝛿𝑚𝑚 + 𝜀𝜀𝑖𝑖𝑖𝑖 Here, 𝐿𝐿𝑖𝑖 is a binary indicator of whether PHM 𝑗𝑗 speaks Tamil or not. In following from the previous two specifications, we present a more decomposed interactive specification of the associations between PHM language, women’s language, and counseling as follows:
𝑦𝑦𝑖𝑖𝑖𝑖 = 𝛼𝛼 + ∑ ∑ [𝛽𝛽𝑘𝑘𝑘𝑘𝕀𝕀{𝑊𝑊𝐿𝐿𝑖𝑖 = 𝑘𝑘} ⋅ 𝕀𝕀{𝑃𝑃𝐿𝐿𝑖𝑖 = 𝑙𝑙}]𝑘𝑘∈{𝑆𝑆,𝑇𝑇,𝐵𝐵}𝑘𝑘∈{𝑆𝑆,𝑇𝑇,𝐵𝐵}
+ 𝑿𝑿𝑖𝑖𝛾𝛾 + 𝛿𝛿𝑚𝑚 + 𝜀𝜀𝑖𝑖𝑖𝑖
Here, 𝕀𝕀{𝑊𝑊𝐿𝐿𝑖𝑖 = 𝑘𝑘} is an indicator function that identifies whether woman 𝑖𝑖 speaks only Sinhala, only Tamil, or both languages (with women speaking only Sinhala as the reference group), and 𝕀𝕀{𝑃𝑃𝐿𝐿𝑖𝑖 = 𝑙𝑙} is an indicator function that identifies whether PHM 𝑗𝑗 speaks only Sinhala, only Tamil, or both languages (with PHMs speaking only Sinhala as the reference group). Our final set of analyses deconstructs the role of ethnolinguistic concordance by identifying each combination of ethnicity and language(s) spoken by women and their PHMs as follows:
𝑦𝑦𝑖𝑖𝑖𝑖 = 𝛼𝛼 + ∑ ∑ ∑ ∑ [𝛽𝛽𝑘𝑘𝑘𝑘𝑘𝑘𝑘𝑘𝕀𝕀{𝑊𝑊𝑊𝑊𝑖𝑖 = 𝑘𝑘} ⋅ 𝕀𝕀{𝑃𝑃𝑊𝑊𝑖𝑖 = 𝑙𝑙}𝕀𝕀{𝑊𝑊𝐿𝐿𝑖𝑖 = 𝑛𝑛}𝑘𝑘∈{𝑆𝑆,𝑇𝑇,𝐵𝐵}𝑘𝑘∈{𝑆𝑆,𝑇𝑇,𝐵𝐵}𝑘𝑘∈{𝑆𝑆,𝑁𝑁𝑆𝑆}𝑘𝑘∈{𝑆𝑆,𝑁𝑁𝑆𝑆}
⋅ 𝕀𝕀{𝑃𝑃𝐿𝐿𝑖𝑖 = 𝑝𝑝}] + 𝑿𝑿𝑖𝑖𝛾𝛾 + 𝛿𝛿𝑚𝑚 + 𝜀𝜀𝑖𝑖𝑖𝑖 Given that we have two ethnicities (Sinhalese and non-Sinhalese) and three languages (only Sinhala, only Tamil, or both) across two agents (women and PHMs), we have a total of 2 × 2 × 3 × 3 = 36 possible ethnolinguistic combinations. In our dataset, we observe that several of these ethnolinguistic combinations do not exist in our sample, while several ethnolinguistic combinations pertain to only 10 or fewer observations – these combinations and observations are dropped from the analysis. For this analysis, we assign women who are of Sinhalese ethnicity, who speak only Sinhala, and who are matched to PHMs who are of Sinhalese ethnicity and who speak only Sinhala to be the reference group. Ethical Considerations Approval to conduct the full PPIUD study in Sri Lanka was granted to SLCOG by the Ethics Review Committee at the Faculty of Medicine, University of Colombo (protocol number EC-15-059). An informed consent to participate in the study was obtained and only women who consented (98.5 percent of the full sample) were interviewed.

8 www.bu.edu/gdpHCI@GDPCenterPardee School of Global Studies/Boston University
Results Descriptive Results Table 1 presents descriptive statistics of the sample. Of the 4,497 women in the analytic sample, 55.4 percent of women reported being counselled on PPIUD before admission. The average age of women in our sample was 28.2 years, and nearly all women had some level of education, with 81 percent of women in the sample reporting to have completed a secondary level of education or higher (see Table 2). In addition, 5.7 percent of women reported that they ever worked in the last 12 months. We find that 35.1 percent of women in our sample reported that their primary language was Tamil, while 25.6 percent of women in the sample were interviewed in Tamil. By comparison, 32 PHMs (13.1 percent) in our sample reported their primary language to be Tamil. Moreover, 307 women (6.8 percent) and 70 PHMs (28.6 percent) respectively reported that they are bilingual in Sinhala and Tamil. As shown in Table 3, 63.2 percent of women in our sample reported to be ethnic Sinhalese, while 29 percent of women reported to be ethnic Tamil (either Sri Lankan Tamil or Indian Tamil) and 7.6 percent of women reported to be Sri Lankan Moors. When comparing our analytic sample to the Sri Lankan population at large, we find that a larger proportion of women in our sample are from minority ethnic groups (Sri Lankan Tamil, Indian Tamil, and Sri Lankan Moor) compared to census estimates of the ethnic distribution for these groups (23). Table 4 presents the distribution of ethnicity across PHMs and shows that a total of 213 (86.9 percent) PHMs in our sample reported to be ethnic Sinhalese. For 86.1 percent of women in our sample, we find there to be linguistic concordance between at least one of their reported spoken languages and at least one of their PHM’s reported spoken languages; we coded cases in which a woman reported that she is bilingual in Tamil and Sinhala and her PHM reported speaking only one of those languages (or vice versa) as a linguistic match. Table 5 shows that while every Sinhala speaking woman was matched to a PHM that spoke Sinhala, only 60.5 percent of Tamil speaking women matched to a PHM that spoke Tamil. As Table 6 indicates, we find there to be ethnic concordance (either ethnic Sinhalese or non-Sinhalese) for 71.4 percent of women and PHMs in our sample; however, a further decomposition of this concordance shows that while 98 percent of ethnic Sinhalese women are matched to PHMs who are also ethnic Sinhalese, only 25.4 percent of non-Sinhalese women are matched to non-Sinhalese PHMs. Table 7 presents the complete ethnolinguistic decomposition by woman and PHM. When using the most flexible definition of ethnolinguistic concordance, which interacts the definitions of linguistic concordance and ethnic concordance above, we find that 71.4 percent of women match with their PHMs on both ethnicity (Sinhalese or non-Sinhalese) and language (Sinhala, Tamil, or both). On the other hand, Table 8 shows that 13.9 percent of women match neither on ethnicity nor on language with their PHM, while 14.8 percent of women match with their PHM on ethnicity but not on language; no woman in our sample is matched on language without also being matched on ethnicity. When decomposing the sample on all ethnolinguistic combinations (Table 7), we find that the largest ethnolinguistic category (52.7 percent of our sample) consists of ethnic Sinhalese women who speak only Sinhala and who are matched to ethnic Sinhalese PHMs who speak only Sinhala.

www.bu.edu/gdp 9HCI@GDPCenterPardee School of Global Studies/Boston University
Counseling Tabulations and Logistic Regression Results A raw tabulation of PPIUD counselling status by women’s language, shown in Table 9, shows that 43.9 percent of Sinhala speaking women were not counselled before admission, while 46.1 percent of Tamil speaking women were not counselled before admission. When we run a similar tabulation of PPIUD counseling status by women’s ethnicity, as shown in Table 10, we find that women of Indian Tamil ethnicity are much less likely to be counselled on PPIUD than any other ethnic group, either before admission or at any time – 57.5 percent of Indian Tamil women in our sample were not counselled before admission, compared to 43.8 percent of ethnic Sinhalese women who did not receive counselling. Tables 11-A presents results for the direct associations between language on women’s receipt of PPIUD counseling, controlling for a range of woman-level covariates and MOH-level fixed effects. Compared to Sinhala speaking women (the reference group), women who speak Tamil have a 41.1 percent lower odds of receiving PPIUD counseling prior to admission; in contrast, women who have a Tamil speaking PHM are no less likely to receive counseling compared to women who have a Sinhala speaking PHM. When examining the direct associations between ethnicity on women’s receipt of PPIUD counseling (Table 11-B), we observe that women of Sri Lankan Tamil, Indian Tamil, and Sri Lankan Moor ethnicities are all significantly less likely to receive PPIUD counseling compared to ethnic Sinhalese women, with Indian Tamil women having at much as a 63.4 percent lower odds of receiving counseling. Similarly to our language results, however, we find that women who have a non-Sinhalese PHM are no less likely to receive counseling compared to women who are matched to an ethnic Sinhalese PHM. Table 12-A assesses the relationship between women’s language and PHM language on counseling using an interaction term approach. While these results confirm Tamil speaking women’s lower likelihood to receive counseling when they are matched with a Sinhala speaking PHM, we also find that Tamil speaking women who are matched to Tamil speaking PHMs have a significant and higher odds of receiving counseling on PPIUD relative to Sinhala speaking women who are matched to Sinhala speaking PHMs. These findings are reinforced when we conduct a more complete decomposition analysis of linguistic concordance as shown in Table 13-A. While the results confirm that women who only speak Tamil are less likely to receive counseling when paired with PHMs who only speak Sinhala (𝑂𝑂𝑂𝑂 = 0.548, 95%𝐶𝐶𝐶𝐶: 0.406 − 0.738), we also observe that women who speak both Tamil and Sinhala are equally less likely to receive counseling when matched with PHMs who speak only Sinhala (𝑂𝑂𝑂𝑂 = 0.663, 95%𝐶𝐶𝐶𝐶: 0.483 − 0.911). This significantly lower likelihood of counseling is not observed when we examine associations of linguistic discordance in which the PHM speaks Tamil. We also observe differential likelihoods of receiving counseling in cases where the PHM speaks both Tamil and Sinhala – women who speak only Tamil and who are matched to bilingual PHMs are no less likely to receive counseling, while women who speak Sinhala and who are matched to bilingual PHMs are significantly more likely to receive counseling. By a similar token, Table 12-B shows that relative to ethnic Sinhalese women who are matched with Sinhalese PHMs, non-ethnic Sinhalese women are significantly less likely to receive PPIUD counseling when matched with ethnic Sinhalese PHMs (𝑂𝑂𝑂𝑂 = 0.561, 95%𝐶𝐶𝐶𝐶: 0.446 − 0.707). In contrast, Sinhalese women who are matched with non-Sinhalese PHMs are no less likely to receive counseling,

10 www.bu.edu/gdpHCI@GDPCenterPardee School of Global Studies/Boston University
while non-Sinhalese women who are matched with non-Sinhalese PHMs have a higher and significant odds of receiving counseling when compared to ethnically concordant Sinhalese women and Sinhalese PHMs. These findings are again confirmed in Table 13-B. The key strength of this study lies in its ability to disentangle the joint associations between ethnic and linguistic concordance and women’s receipt of counseling through a complete deconstructive analysis across these two dimensions, as shown in Table 14. In this result, the ethnolinguistically concordant majority group are ethnic Sinhalese women who speak only Sinhala and who are matched to ethnic Sinhalese PHMs who also speak only Sinhala. Relative to this group, we find that ethnic non-Sinhalese women who are matched to Sinhalese PHMs who speak only Sinhala are less likely to receive PPIUD counseling, irrespective of these women’s language capacities. More specifically, we find that non-Sinhalese women who speak both Tamil and Sinhala have an equally and significantly lower likelihood of receiving PPIUD counseling (𝑂𝑂𝑂𝑂 = 0.628, 95%𝐶𝐶𝐶𝐶: 0.446 − 0.884) relative to the ethnolinguistic majority as non-Sinhalese women who speak only Tamil (𝑂𝑂𝑂𝑂 = 0.539, 95%𝐶𝐶𝐶𝐶: 0.398 − 0.730). This finding suggests that ethnic discordance between women and their PHMs is likely to be driving differences in the likelihood of receipt of counseling, even in cases where women and their PHMs are linguistically concordant. As part of this same analysis, we can also observe that women who are matched to non-Sinhalese PHMs do not face a significantly lower odds (and, in some cases, may even face marginally higher but insignificant odds) of being counselled on PPIUD before admission, irrespective of their ethnic or linguistic background. By the same token, women who are ethnically Sinhalese do not face a significantly lower odds of being counselled on PPIUD before admission, regardless of the ethnolinguistic composition of their PHMs. Columns 2 to 4 of Table 14 present the association between ethnolinguistic concordance and other related secondary outcomes of interest, including whether or not a woman received postpartum family planning (PPFP) counseling more generally, whether a woman received at least four antenatal care visits over the course of her pregnancy, and the total number of antenatal care visits that a woman received. While there is some variation in the significance of these results, the findings generally confirm our previous results in that women who belong to ethnolinguistic minority groups (non-Sinhalese and non-Sinhala speaking) and who are matched to ethnolinguistically discordant PHMs are generally found to have lower likelihoods of receiving counseling relative to women who belong to the ethnolinguistic majority group (Sinhalese and Sinhala-speaking) and also to women who are ethnolinguistically concordant with their PHMs. Several robustness checks (e.g. adding women’s work status as a covariate, altering the definitions of ethnolinguistic concordance, using alternative measures of language proficiency, etc.) and alternative specifications were run to confirm the observed results that we have presented. Results from these additional analyses are presented in the appendix.

www.bu.edu/gdp 11HCI@GDPCenterPardee School of Global Studies/Boston University
Discussion There is a large and growing body of literature that emphasizes the impact of cultural proximity and group diversity on social and economic welfare (26). In the context of transactions, there is evidence to suggest that the level of cultural homophily between transacting parties is likely to affect the outcome of the transaction, both on the extensive margin (i.e. whether the outcome takes place) and on the intensive margin (i.e. the type of payoffs received by each party). However, the predicted effect of cultural proximity on efficiency is ambiguous. On the one hand, cultural homophily may contribute to favoritism or ethnic sorting, which in turn may lead to misallocation of resources and lowers efficiency. On the other hand, cultural homophily also may contribute to reductions in the transaction costs or contract enforcement costs, which improves efficiency. In the context of service provision, however, the contracting mechanism is often less clear, and the question of interest from a social planner’s perspective is more oriented towards optimal provision and distribution of resources with little to no reciprocity between agents who participate in the transaction. There is evidence to suggest that ethnic heterogeneity is inversely related with efficient distribution of services and usually leads to under-provision and free-riding from the minority population (27,28). In contrast, the targeted provision of services by cultural determinants such as ethnicity, geography, or language may create more efficient, but potentially less equitable, outcomes across groups. In this study, we examine the relationship between correlates of cultural homophily, namely shared language and ethnicity between women and their PHMs, and the receipt of PPIUD counseling in Sri Lanka. We use data from a cluster-randomized stepped-wedge trial in which women who delivered in one of six hospitals in the trial were offered antenatal counseling and postnatal health services to be offered a PPIUD immediately following their delivery. We find that women from minority groups, including Tamil-speaking women and women from a non-Sinhalese ethnicity are less likely to receive PPIUD counseling. However, linguistic and ethnic concordance between women and PHMs were associated with higher likelihoods of receipt of counseling, regardless of whether the concordance is between minority or majority groups. By simultaneously decomposing the ethnic and linguistic concordance channels, we find that ethnic discordance between women and PHMs, specifically in the case when women of an ethnic non-Sinhalese minority are matched with a PHM of the ethnic Sinhalese majority, are less likely to receive counseling even when they are linguistically concordant with their PHMs. In contrast, we do not observe differential likelihoods in the receipt of counseling for women who are ethnically concordant but linguistically discordant with their matched PHMs, nor do we observe differential receipt of counseling for ethnic majority women who are matched to ethnic minority PHMs. Our findings suggest that the disparity in PPIUD counseling for women from minority groups is driven by an ethnic discordance between women and their service providers rather than by linguistic discordance – we find that ethnic Sinhalese PHMs are less likely to counsel ethnic non-Sinhalese women within their catchment areas independent of whether or not these women speak Sinhala. There are several possible reasons that could explain why we observe this difference in receipt of care. Firstly, and perhaps most obviously, it is possible that the differential provision of PPIUD counseling services

12 www.bu.edu/gdpHCI@GDPCenterPardee School of Global Studies/Boston University
by ethnic Sinhalese providers is being driven by unobservable biases against ethnic minorities. In addition, Sinhalese providers may be more hesitant to offer family planning counseling and services to non-Sinhalese patients, especially for long-acting methods like the PPIUD, for fear of reprisal from the non-Sinhalese population. To this end, such reluctance by providers to offer services may be the result of an ongoing and often polarized coverage around contraception and other sensitive population issues in the Sri Lankan media along with underlying ethnic tensions that continue to be fueled by reports of contraceptive coercion and the forced sterilization of ethnic minorities in the wake of the Sri Lankan Civil War (29). By the same token, it may also be that non-Sinhalese women are more reluctant to receive services from Sinhalese PHMs, which would reflect a mutual sense of mistrust between patients and providers. Regardless of the reasons, our findings imply that this differential gap in service provision cannot be eliminated simply by matching providers and patients based on language alone. Though matching on language is an important start to improving access to care, matching on ethnicity may also be required to further reduce disparities in service provision until such underlying ethnic tensions are addressed. Conclusions This study examines the role of cultural homophily in health service provision by assessing the effect of linguistic and ethnic concordance between women and their PHMs on provision of PPIUD counseling. We find that women from minority, non-Sinhalese groups in Sri Lanka face disparities in the receipt of PPIUD counseling. Furthermore, we identify ethnic discordance between women and their providers to be the primary driver of these disparities rather than linguistic discordance. Our findings suggest that until underlying ethnic tensions are resolved, matching women and PHMs on ethnicity is likely to improve postpartum family planning service provision in Sri Lanka. Acknowledgements Competing Interests All authors declare that no competing interests exist. Author Contributions All authors participated in the conception, analysis, design, and writing of the article. All authors have read and approved the final manuscript and are aware that the manuscript is being submitted to the journal. References 1. Nelson A. Unequal treatment: confronting racial and ethnic disparities in health care. J Natl Med
Assoc. 2002 Aug;94(8):666–8. 2. Cooper-Patrick L, Gallo JJ, Gonzales JJ, Vu HT, Powe NR, Nelson C, et al. Race, Gender, and
Partnership in the Patient-Physician Relationship. JAMA. 1999 Aug 11;282(6):583–9. 3. Traylor AH, Subramanian U, Uratsu CS, Mangione CM, Selby JV, Schmittdiel JA. Patient
Race/Ethnicity and Patient-Physician Race/Ethnicity Concordance in the Management of Cardiovascular Disease Risk Factors for Patients With Diabetes. Diabetes Care. 2010 Mar 1;33(3):520–5.

www.bu.edu/gdp 13HCI@GDPCenterPardee School of Global Studies/Boston University
4. Stevens GD, Shi L, Cooper LA. Patient-Provider Racial and Ethnic Concordance and Parent Reports of the Primary Care Experiences of Children. Ann Fam Med. 2003 Jul 1;1(2):105–12.
5. David RA, Rhee M. The impact of language as a barrier to effective health care in an underserved urban Hispanic community. Mt Sinai J Med. 1998;65:393–397.
6. Ferguson WJ, Candib LM. Culture, language, and the doctor-patient relationship. FMCH Publ Present. 2002;61.
7. Cooper LA, Beach MC, Johnson RL, Inui TS. Delving Below the Surface: Understanding How Race and Ethnicity Influence Relationships in Health Care. J Gen Intern Med. 2006 Jan 1;21(S1):S21–7.
8. Komaromy M, Grumbach K, Drake M, Vranizan K, Lurie N, Keane D, et al. The Role of Black and Hispanic Physicians in Providing Health Care for Underserved Populations. N Engl J Med. 1996 May 16;334(20):1305–10.
9. Xu G, Fields SK, Laine C, Veloski JJ, Barzansky B, Martini CJ. The relationship between the race/ethnicity of generalist physicians and their care for underserved populations. Am J Public Health. 1997 May 1;87(5):817–22.
10. Moy E, Bartman BA. Physician Race and Care of Minority and Medically Indigent Patients. JAMA. 1995 May 17;273(19):1515–20.
11. Saha S, Komaromy M, Koepsell TD, Bindman AB. Patient-Physician Racial Concordance and the Perceived Quality and Use of Health Care. Arch Intern Med. 1999 May 10;159(9):997–1004.
12. LaVeist TA, Nuru-Jeter A. Is doctor-patient race concordance associated with greater satisfaction with care? J Health Soc Behav. 2002;43(3):296–306.
13. Enguidanos ER, Rosen P. Language as a factor affecting follow-up compliance from the emergency department. J Emerg Med. 1997 Jan 1;15(1):9–12.
14. Stevens GD, Mistry R, Zuckerman B, Halfon N. The parent-provider relationship: Does race/ethnicity concordance or discordance influence parent reports of the receipt of high quality basic pediatric preventive services? J Urban Health Bull N Y Acad Med. 2005 Dec;82(4):560–74.
15. Weisse CS, Foster KK, Fisher EA. The Influence of Experimenter Gender and Race on Pain Reporting: Does Racial or Gender Concordance Matter? Pain Med. 2005 Jan 1;6(1):80–7.
16. Flocke SA, Gilchrist V. Physician and patient gender concordance and the delivery of comprehensive clinical preventive services. Med Care. 2005;43(5):486–492.
17. Schmittdiel J, Grumbach K, Selby JV, Quesenberry CP. Effect of Physician and Patient Gender Concordance on Patient Satisfaction and Preventive Care Practices. J Gen Intern Med. 2000 Nov 1;15(11):761–9.
18. World Bank. Sri Lanka - Country Partnership Strategy for the Period FY2013-16. Washington, D.C.: The World Bank; 2012 Apr, p. 1–132. Report No.: 66286.
19. Department of Census and Statistics (DCS), Ministry of Healthcare and Nutrition (MOH). Sri Lanka Demographic and Health Survey 2016. Colombo, Sri Lanka: DCS and MOH; 2016.
20. Malini de Silva JK, Wickramasuriya K. Maternal and Child and Family Planning Services in Sri Lanka. Columbo, Sri Lanka: Sri Lanka Health Education Bureau; 2017.
21. Family Health Bureau (FHB), Sri Lanka Ministry of Health (MOH). Maternal Care Package: A Guide to Field Healthcare Workers. Colombo, Sri Lanka: FHB and MOH; 2011.
22. Government of Sri Lanka. The Constitution of the Democratic Socialist Republic of Sri Lanka. 1978.
23. Department of Census and Statistics (DCS). Census of Population and Housing, 2012. Colombo, Sri Lanka: Ministry of Finance and Planning; 2012.
24. Nagai M, Abraham S, Okamoto M, Kita E, Aoyama A. Reconstruction of health service systems in the post-conflict Northern Province in Sri Lanka. Health Policy. 2007 Sep 1;83(1):84–93.

14 www.bu.edu/gdpHCI@GDPCenterPardee School of Global Studies/Boston University
25. Canning D, Shah IH, Pearson E, Pradhan E, Karra M, Senderowicz L, et al. Institutionalizing postpartum intrauterine device (IUD) services in Sri Lanka, Tanzania, and Nepal: study protocol for a cluster-randomized stepped-wedge trial. BMC Pregnancy Childbirth. 2016;16:362–73.
26. Fisman R, Paravisini D, Vig V. Cultural proximity and loan outcomes. Am Econ Rev. 2017;107(2):457–92.
27. Alesina A, Baqir R, Easterly W. Public Goods and Ethnic Divisions. Q J Econ. 1999 Nov 1;114(4):1243–84.
28. Kimenyi MS. Ethnicity, Governance and the Provision of Public Goods. J Afr Econ. 2006 Jan 1;15(suppl 1):62–99.
29. Sexual and Reproductive Rights violations of Tamil Women in the Island of Sri Lanka. New York, NY: United Nations; 2015. Report No.: A/HRC/28/NGO/94.

www.bu.edu/gdp 15HCI@GDPCenterPardee School of Global Studies/Boston University
Figures and Tables Figure 1: Left: Ethnic Distribution in Sri Lanka by Divisional Secretariats, 2012 Sri Lanka Census
Right: Locations of Six PPIUD Study Hospitals

16 www.bu.edu/gdpHCI@GDPCenterPardee School of Global Studies/Boston University
Table 1: Descriptive Statistics of Women and Primary Health Midwives (PHMs)
Mean SD No. Cases Outcomes Counselled on PPIUD before admission (1 = Yes) 0.554 2487 Woman and PHM Language Indicators Woman’s primary language (1 = Tamil) 0.351 1577 Woman’s interviewed language (1 = Tamil) 0.256 1150 Woman is bilingual (1 = Yes) 0.068 307 PHM’s primary language (1 = Tamil) 0.131 32 PHM is bilingual (1 = Yes) 0.286 70 Woman and PHM Ethnicity Indicators Woman’s ethnicity (1 = Non-Sinhalese) 0.367 1651 PHM’s ethnicity (1 = Non-Sinhalese) 0.131 32 Linguistic Concordance Indicators Woman’s and PHM’s language matches? (1 = Yes) 0.861 3874 Woman speaks T and PHM speaks T (1 = Yes)* 0.032 144 Woman speaks T and PHM speaks S (1 = Yes) 0.139 623 Woman speaks S and PHM speaks S (1 = Yes)* 0.542 2436 Woman speaks T and S and PHM speaks S (1 = Yes)* 0.049 222 Woman speaks T and PHM speaks T and S (1 = Yes)* 0.112 503 Woman speaks S and PHM speaks T and S (1 = Yes)* 0.108 484 Woman speaks T and S and PHM speaks T and S (1 = Yes)* 0.019 85 Ethnic Concordance Indicators Woman’s and PHM’s ethnicity matches? (1 = Yes) 0.714 3209 Woman is S and PHM is S (1 = Yes)* 0.620 2788 Woman is not S and PHM is S (1 = Yes) 0.274 1230 Woman is S and PHM is not S (1 = Yes) 0.013 58 Woman is not S and PHM is not S (1 = Yes)* 0.094 421 Covariates Number of live births 1.908 0.907 Ever used family planning (1 = Yes) 0.595 2677 Woman’s age (years) 28.247 5.421 Woman worked in last 7 days or 12 months? (1 = Yes) 0.057 257 N 4497 Notes: T indicates Tamil (language), S indicates Sinhala (for language) and Sinhalese (for ethnicity). * indicates a concordant match between women and their PHMs on that characteristic (either ethnicity, language, or both).

www.bu.edu/gdp 17HCI@GDPCenterPardee School of Global Studies/Boston University
Table 2: Distribution of Mother’s Education
Freq. Pct. None 38 0.85 Some primary 104 2.31 Completed primary 81 1.80 Some secondary 637 14.18 Completed secondary 1315 29.27 More than secondary 2318 51.59 Total 4493 100.00
Table 3: Distribution of Woman’s Ethnicity
Freq. Pct. Sinhalese 2846 63.29 Sri Lankan Tamil 744 16.54 Indian Tamil 560 12.45 Sri Lanka Moor 347 7.72 Total 4497 100.00
Table 4: Distribution of PHM’s Ethnicity
Freq. Pct. Indian Tamil 28 11.43 Sri Lanka Moor 4 1.63 Sinhalese 213 86.94 Total 245 100.00

18 www.bu.edu/gdpHCI@GDPCenterPardee School of Global Studies/Boston University
Table 5: Tabulation of Linguistic Concordance by Woman’s Language
Sinhala Tamil Total Freq. Col. Pct. Freq. Col. Pct. Freq. Col. Pct. No Match 0 0.00 623 39.51 623 13.85 Match 2920 100.00 954 60.49 3874 86.15 Total 2940 100.00 1602 100.00 4497 100.00
Table 6: Tabulation of Ethnic Concordance by Woman’s Ethnicity
Sinhalese Sri Lankan Tamil Indian Tamil Sri Lankan Moor Total Freq. Col. Pct. Freq. Col. Pct. Freq. Col. Pct. Freq. Col. Pct. Freq. Col. Pct. No Match 58 2.04 531 71.37 362 64.64 337 97.12 1288 28.64 Match 2788 97.96 213 28.63 198 35.36 10 2.88 3209 71.36 Total 2846 100.00 744 100.00 560 100.00 347 100.00 4497 100.00
Table 7: Complete Ethnolinguistic Concordance Distribution
Mean No. Cases Woman’s and PHM’s ethnicity and language(s) match? (1 = Yes) 0.714 3209 Woman is E-NS, L-T, PHM is E-NS, L-T 0.032 144 Woman is E-NS, L-T, PHM is E-NS, L-B 0.053 237 Woman is E-NS, L-B, PHM is E-NS, L-B 0.009 40 Woman is E-NS, L-T, PHM is E-S, L-S 0.139 623 Woman is E-NS, L-S, PHM is E-S, L-S 0.015 67 Woman is E-NS, L-B, PHM is E-S, L-S 0.047 210 Woman is E-NS, L-T, PHM is E-S, L-B 0.059 266 Woman is E-NS, L-S, PHM is E-S, L-B 0.004 19 Woman is E-NS, L-B, PHM is E-S, L-B 0.010 45 Woman is E-S, L-S, PHM is E-NS, L-B 0.013 58 Woman is E-S, L-S, PHM is E-S, L-S 0.527 2369 Woman is E-S, L-B, PHM is E-S, L-S 0.003 12 Woman is E-S, L-S, PHM is E-S, L-B 0.091 407 N 4497
Notes: The interpretation for each variable “Woman is E-𝑊𝑊, L-𝑋𝑋, PHM is E-𝑌𝑌, L-𝑍𝑍” is read as “Woman of ethnicity 𝑊𝑊 (either Sinhalese 𝑆𝑆 or non-Sinhalese 𝑁𝑁𝑆𝑆) who speaks language 𝑋𝑋 (either Tamil 𝑇𝑇 or Sinhala 𝑆𝑆 or both Tamil and Sinhala 𝐵𝐵) is matched to PHM of ethnicity 𝑌𝑌 (either Sinhalese 𝑆𝑆 or non-Sinhalese 𝑁𝑁𝑆𝑆) who speaks language 𝑍𝑍 (either Tamil 𝑇𝑇 or Sinhala 𝑆𝑆 or both Tamil and Sinhala 𝐵𝐵). Some combinations of ethnicity and language by woman and PHM did not contain any observations and are therefore dropped from the table.

www.bu.edu/gdp 19HCI@GDPCenterPardee School of Global Studies/Boston University
Table 8: Tabulation of Ethnic Concordance by Linguistic Concordance
Linguistic Concordance No Match Match Total Freq. Cell Pct. Freq. Cell Pct. Freq. Col. Pct.
Ethnic Concordance
No Match 623 13.85 665 14.79 1288 28.64 Match 0 0.00 3209 71.36 3209 71.36
Total 623 3874 4497 100.00
Table 9: Tabulation of Counselling Status before Admission and Woman’s Language
Sinhala Tamil Total Freq. Col. Pct. Freq. Col. Pct. Freq. Col. Pct. Not Counselled 1279 43.85 726 46.10 2005 44.63 Counselled 1638 56.15 849 53.90 2487 55.37 Total 2917 1575 4492 100.00
Table 10: Tabulation of Counselling Status before Admission and Woman’s Ethnicity
Sinhalese Sri Lankan Tamil Indian Tamil Sri Lankan Moor Total Freq. Col. Pct. Freq. Col. Pct. Freq. Col. Pct. Freq. Col. Pct. Freq. Col. Pct. Not Counselled 1245 43.79 314 42.26 322 57.50 124 35.84 2005 44.63 Counselled 1598 56.21 429 57.74 238 42.50 222 64.16 2487 55.37 Total 2843 743 560 346 4492 100.00
Table 11-A: The Association between Language and Counseling
VARIABLES Counselled
Before Admission
Woman’s Language Woman’s Language (1 = Tamil) 0.589*** 0.479 - 0.724 Observations 4,486 PHM’s Language
PHM Language (1 = Tamil) 1.154 0.752 - 1.771 Observations 4,486
*** 𝑝𝑝 < 0.01, ** 𝑝𝑝 < 0.05, * 𝑝𝑝 < 0.1 Notes: For both regressions, the unit of observation is a woman who gave birth at one of the six study hospitals. Odds ratios are presented with 95% confidence intervals in the parentheses below. The reference group in the top regression is Sinhala speaking women, while the reference group in the bottom regression are women who are matched to Sinhala speaking PHMs. Both regressions present results for whether the woman was counselled before admission. Results are from logistic regressions that include woman- level controls such as educational attainment of the woman (no education, primary, secondary, higher), age of the woman (in 5-year age groups), number of births, and whether the woman has ever used family planning. MOH fixed effects are included, and standard errors are clustered at the PHM level.

20 www.bu.edu/gdpHCI@GDPCenterPardee School of Global Studies/Boston University
Table 11-B: The Association between Ethnicity and Counseling
VARIABLES Counselled Before
Admission Woman’s Ethnicity Sri Lanka Tamil 0.687*** 0.531 - 0.887 Indian Tamil 0.366*** 0.269 - 0.500 Sri Lanka Moor 0.709** 0.524 - 0.958 Observations 4,486 PHM’s Ethnicity
Indian Tamil 0.946 0.526 - 1.704 Sri Lanka Moor 0.863 0.557 - 1.337 Observations 4,486
*** 𝑝𝑝 < 0.01, ** 𝑝𝑝 < 0.05, * 𝑝𝑝 < 0.1 Notes: For both regressions, the unit of observation is a woman who gave birth at one of the six study hospitals. Odds ratios are presented with 95% confidence intervals in the parentheses below. The reference group in the top regression is ethnic Sinhala women, while the reference group in the bottom regression are women who are matched to ethnic Sinhala PHMs. Both regressions present results for whether the woman was counselled before admission. Results are from logistic regressions that include woman- level controls such as educational attainment of the woman (no education, primary, secondary, higher), age of the woman (in 5-year age groups), number of births, and whether the woman has ever used family planning. MOH fixed effects are included, and standard errors are clustered at the PHM level.

www.bu.edu/gdp 21HCI@GDPCenterPardee School of Global Studies/Boston University
Table 12-A: The Association between Woman’s and PHM’s Language and Counseling
VARIABLES Counselled Before
Admission Woman’s Language (1 = Tamil) 0.558*** 0.449 - 0.694 PHM’s Language (1 = Tamil) 0.721* 0.490 - 1.061 Woman x PHM Language (1 = Tamil) 1.959*** 1.177 - 3.261 Observations 4,486
*** 𝑝𝑝 < 0.01, ** 𝑝𝑝 < 0.05, * 𝑝𝑝 < 0.1 Notes: The unit of observation is a woman who gave birth at one of the six study hospitals. Odds ratios are presented with 95% confidence intervals in the parentheses below. The reference group is Sinhala speaking women who are matched to Sinhala speaking PHMs. The regression presents results for whether the woman was counselled before admission. Results are from logistic regressions that include woman- level controls such as educational attainment of the woman (no education, primary, secondary, higher), age of the woman (in 5-year age groups), number of births, and whether the woman has ever used family planning. MOH fixed effects are included, and standard errors are clustered at the PHM level.
Table 12-B: The Association between Woman’s and PHM’s Ethnicity and Counseling
VARIABLES Counselled Before
Admission Woman’s Ethnicity (1 = Non-Sinhalese) 0.561*** 0.446 - 0.707 PHM’s Ethnicity (1 = Non-Sinhalese) 0.717* 0.484 - 1.062 Woman’s x PHM’s Ethnicity (1 = Non-Sinhalese) 1.945** 1.166 - 3.245 Observations 4,486
*** 𝑝𝑝 < 0.01, ** 𝑝𝑝 < 0.05, * 𝑝𝑝 < 0.1 Notes: The unit of observation is a woman who gave birth at one of the six study hospitals. Odds ratios are presented with 95% confidence intervals in the parentheses below. The reference group is ethnic Sinhalese women who are matched to ethnic Sinhalese PHMs. The regression presents results for whether the woman was counselled before admission. Results are from logistic regressions that include woman- level controls such as educational attainment of the woman (no education, primary, secondary, higher), age of the woman (in 5-year age groups), number of births, and whether the woman has ever used family planning. MOH fixed effects are included, and standard errors are clustered at the PHM level.

22 www.bu.edu/gdpHCI@GDPCenterPardee School of Global Studies/Boston University
Table 13-A: The Association between Linguistic Concordance and Counseling
VARIABLES Counselled Before
Admission? Woman speaks T, PHM speaks T 0.909 0.472 - 1.750 Woman speaks T, PHM speaks S 0.548*** 0.406 - 0.738 Woman speaks T and S, PHM speaks S 0.663** 0.483 - 0.911 Woman speaks T, PHM speaks T and S 0.753 0.529 - 1.070 Woman speaks S, PHM speaks T and S 1.487** 1.040 - 2.126 Woman speaks T and S, PHM speaks T and S 0.858 0.432 - 1.705 Observations 4,486
*** 𝑝𝑝 < 0.01, ** 𝑝𝑝 < 0.05, * 𝑝𝑝 < 0.1 Notes: The unit of observation is a woman who gave birth at one of the six study hospitals. Odds ratios are presented with 95% confidence intervals in the parentheses below. The reference group is Sinhala speaking women who are matched to Sinhala speaking PHMs. The regression presents results for whether the woman was counselled before admission. Results are from logistic regressions that include woman- level controls such as educational attainment of the woman (no education, primary, secondary, higher), age of the woman (in 5-year age groups), number of births, and whether the woman has ever used family planning. MOH fixed effects are included, and standard errors are clustered at the PHM level.
Table 13-B: The Association between Ethnic Concordance and Counseling
VARIABLES Counselled Before
Admission? Woman is ethnic non-S, PHM is ethnic S 0.561*** 0.446 - 0.707 Woman is ethnic S, PHM is ethnic non-S 0.717* 0.484 - 1.062 Woman is ethnic non-S, PHM is ethnic non-S 0.783 0.496 - 1.235 Observations 4,486
*** 𝑝𝑝 < 0.01, ** 𝑝𝑝 < 0.05, * 𝑝𝑝 < 0.1 Notes: The unit of observation is a woman who gave birth at one of the six study hospitals. Odds ratios are presented with 95% confidence intervals in the parentheses below. The reference group is ethnic Sinhalese women who are matched to ethnic Sinhalese PHMs. The regression presents results for whether the woman was counselled before admission. Results are from logistic regressions that include woman- level controls such as educational attainment of the woman (no education, primary, secondary, higher), age of the woman (in 5-year age groups), number of births, and whether the woman has ever used family planning. MOH fixed effects are included, and standard errors are clustered at the PHM level.

www.bu.edu/gdp 23HCI@GDPCenterPardee School of Global Studies/Boston University
Table 14: The Association between Ethnolinguistic Concordance and Counseling
(1) (2) (3) (4) VARIABLES Counselled
Before Admission?
Received PPFP
Counseling?
Received at least 4 ANC
Visits?
Number of ANC Visits
Woman is E-NS, L-T, PHM is E-NS, L-T 0.851 0.873 0.347 0.762* 0.433 - 1.676 0.353 - 2.156 0.091 - 1.322 -0.113 - 1.637 Woman is E-NS, L-T, PHM is E-NS, L-B 0.780 1.292 0.289** 0.091 0.506 - 1.202 0.544 - 3.068 0.104 - 0.803 -0.412 - 0.595 Woman is E-NS, L-B, PHM is E-NS, L-B 1.210 1.477 3.439*** 0.188 0.371 - 3.947 0.329 - 6.643 2.251 - 5.255 -0.458 - 0.833 Woman is E-NS, L-T, PHM is E-S, L-S 0.539*** 0.459*** 0.271*** -0.204 0.398 - 0.730 0.310 - 0.679 0.132 - 0.556 -0.579 - 0.170 Woman is E-NS, L-S, PHM is E-S, L-S 0.757 2.093 1.565 -0.533* 0.401 - 1.429 0.456 - 9.607 0.504 - 4.856 -1.096 - 0.030 Woman is E-NS, L-B, PHM is E-S, L-S 0.628*** 0.633* 1.317 -0.382 0.446 - 0.884 0.381 - 1.052 0.713 - 2.431 -1.011 - 0.248 Woman is E-NS, L-T, PHM is E-S, L-B 0.693 0.477*** 0.165*** 0.091 0.441 - 1.090 0.278 - 0.820 0.054 - 0.504 -0.544 - 0.726 Woman is E-NS, L-S, PHM is E-S, L-B 0.926 -0.222 0.385 - 2.227 -1.515 - 1.071 Woman is E-NS, L-B, PHM is E-S, L-B 0.584 0.598 4.306*** 0.359 0.275 - 1.240 0.148 - 2.418 2.315 - 8.009 -0.151 - 0.870 Woman is E-S, L-S, PHM is E-NS, L-B 0.753 0.663 0.311*** -0.217 0.506 - 1.122 0.351 - 1.251 0.179 - 0.541 -1.350 - 0.916 Woman is E-S, L-B, PHM is E-S, L-S 1.085 1.017 1.856*** 0.288 - 4.087 0.115 - 9.016 0.507 - 3.206 Woman is E-S, L-S, PHM is E-S, L-B 1.680** 1.648 0.688 0.127 1.120 - 2.520 0.862 - 3.153 0.226 - 2.096 -0.388 - 0.642 Observations 4,486 4,472 4,291 4,491 R-squared 0.406
*** 𝑝𝑝 < 0.01, ** 𝑝𝑝 < 0.05, * 𝑝𝑝 < 0.1 Notes: The unit of observation is a woman who gave birth at one of the six study hospitals. For columns 1-3, odds ratios are presented with 95% confidence intervals in the parentheses below. For column 4, point estimates are presented with 95% confidence intervals in the parentheses below The interpretation for each variable “Woman is E-𝑊𝑊, L-𝑋𝑋, PHM is E-𝑌𝑌, L-𝑍𝑍” is read as “Woman of ethnicity 𝑊𝑊 (either Sinhalese 𝑆𝑆 or non-Sinhalese 𝑁𝑁𝑆𝑆) who speaks language 𝑋𝑋 (either Tamil 𝑇𝑇 or Sinhala 𝑆𝑆 or both Tamil and Sinhala 𝐵𝐵) is matched to PHM of ethnicity 𝑌𝑌 (either Sinhalese 𝑆𝑆 or non-Sinhalese 𝑁𝑁𝑆𝑆) who speaks language 𝑍𝑍 (either Tamil 𝑇𝑇 or Sinhala 𝑆𝑆 or both Tamil and Sinhala 𝐵𝐵). Some combinatorial categories did not contain enough observations for the analysis and are therefore dropped. The reference group is ethnic Sinhalese women who speak only Sinhala and who are matched to ethnic Sinhalese PHMs who speak only Sinhala. The regression presents results for whether the woman was counselled before admission. Results are from logistic regressions (columns 1-3) and ordinary least squares regressions (column 4) that include woman- level controls such as educational attainment of the woman (no education, primary, secondary, higher), age of the woman (in 5-year age groups), number of births, and whether the woman has ever used family planning. MOH fixed effects are included, and standard errors are clustered at the PHM level.

24 www.bu.edu/gdpHCI@GDPCenterPardee School of Global Studies/Boston University
Appendix Figures and Tables Appendix Table 1: The Association between Ethnolinguistic Concordance and Counseling, Controlling for Women’s Work (1) (2) (3) VARIABLES Counselled
Before Admission?
Counselled Before
Admission?
Counselled Before
Admission? Respondent and PHM Language Match? (1 = Yes) 1.679*** 1.286 - 2.193 Respondent and PHM Ethnicity Match? (1 = Yes) 1.654*** 1.337 - 2.046 Woman is E-NS, L-T, PHM is E-NS, L-T 0.854 0.434 - 1.681 Woman is E-NS, L-T, PHM is E-NS, L-B 0.780 0.507 - 1.201 Woman is E-NS, L-B, PHM is E-NS, L-B 1.205 0.369 - 3.942 Woman is E-NS, L-T, PHM is E-S, L-S 0.541*** 0.399 - 0.732 Woman is E-NS, L-S, PHM is E-S, L-S 0.757 0.399 - 1.435 Woman is E-NS, L-B, PHM is E-S, L-S 0.628*** 0.446 - 0.885 Woman is E-NS, L-T, PHM is E-S, L-B 0.694 0.441 - 1.093 Woman is E-NS, L-S, PHM is E-S, L-B 0.933 0.387 - 2.250 Woman is E-NS, L-B, PHM is E-S, L-B 0.583 0.274 - 1.240 Woman is E-S, L-S, PHM is E-NS, L-B 0.753 0.505 - 1.123 Woman is E-S, L-B, PHM is E-S, L-S 1.092 0.291 - 4.098 Woman is E-S, L-S, PHM is E-S, L-B 1.682** 1.119 - 2.529 Observations 4,486 4,486 4,486 *** 𝑝𝑝 < 0.01, ** 𝑝𝑝 < 0.05, * 𝑝𝑝 < 0.1 Notes: The unit of observation is a woman who gave birth at one of the six study hospitals. Odds ratios are presented with 95% confidence intervals in the parentheses below. For Column 3, the interpretation for each variable “Woman is E-𝑊𝑊, L-𝑋𝑋, PHM is E-𝑌𝑌, L-𝑍𝑍” is read as “Woman of ethnicity 𝑊𝑊 (either Sinhalese 𝑆𝑆 or non-Sinhalese 𝑁𝑁𝑆𝑆) who speaks language 𝑋𝑋 (either Tamil 𝑇𝑇 or Sinhala 𝑆𝑆 or both Tamil and Sinhala 𝐵𝐵) is matched to PHM of ethnicity 𝑌𝑌 (either Sinhalese 𝑆𝑆 or non-Sinhalese 𝑁𝑁𝑆𝑆) who speaks language 𝑍𝑍 (either Tamil 𝑇𝑇 or Sinhala 𝑆𝑆 or both Tamil and Sinhala 𝐵𝐵). Some combinatorial categories in Column 3 did not contain enough observations for analysis and are therefore dropped. The reference group in Column 3 is ethnic Sinhalese women who speak only Sinhala and who are matched to ethnic Sinhalese PHMs who speak only Sinhala. The regressions present results for whether the woman was counselled before admission. Results are from logistic regressions that include woman-level controls such as educational attainment of the woman (no education, primary, secondary, higher), age of the woman (in 5-year age groups), number of births, and whether the woman has ever used family planning. MOH fixed effects are included, and standard errors are clustered at the PHM level.
www.bu.edu/gdp 25HCI@GDPCenterPardee School of Global Studies/Boston University
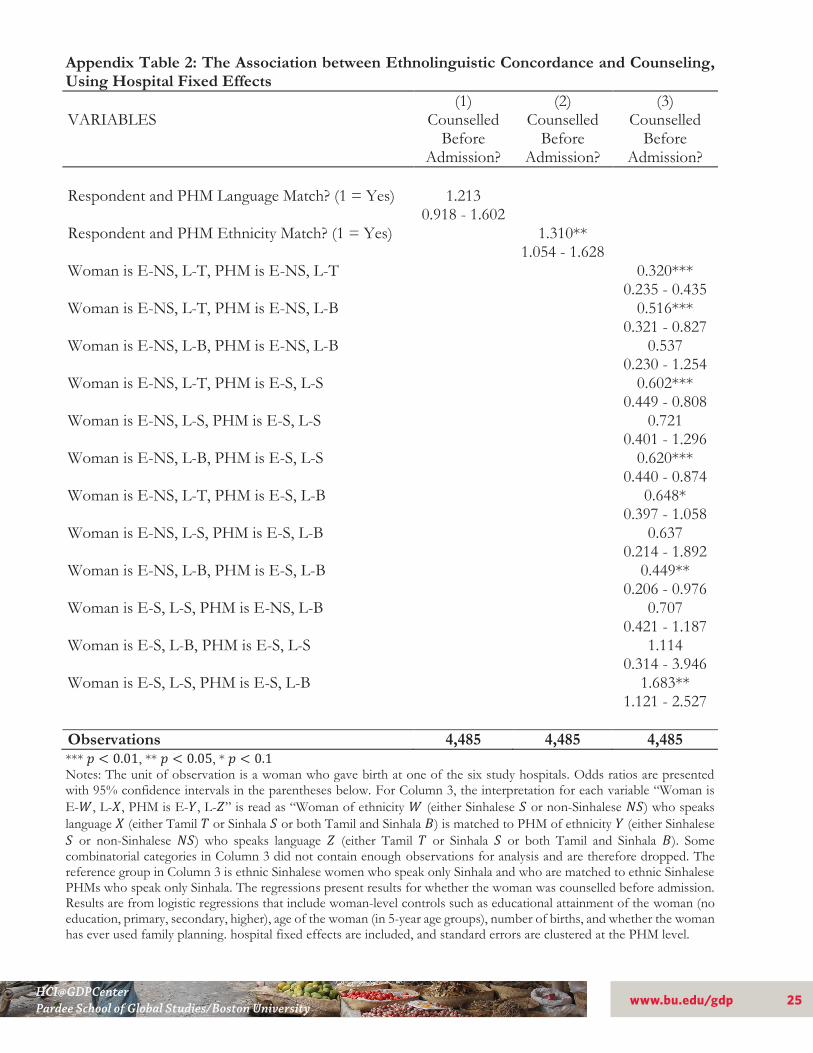
Appendix Table 2: The Association between Ethnolinguistic Concordance and Counseling, Using Hospital Fixed Effects (1) (2) (3) VARIABLES Counselled
Before Admission?
Counselled Before
Admission?
Counselled Before
Admission? Respondent and PHM Language Match? (1 = Yes) 1.213 0.918 - 1.602 Respondent and PHM Ethnicity Match? (1 = Yes) 1.310** 1.054 - 1.628 Woman is E-NS, L-T, PHM is E-NS, L-T 0.320*** 0.235 - 0.435 Woman is E-NS, L-T, PHM is E-NS, L-B 0.516*** 0.321 - 0.827 Woman is E-NS, L-B, PHM is E-NS, L-B 0.537 0.230 - 1.254 Woman is E-NS, L-T, PHM is E-S, L-S 0.602*** 0.449 - 0.808 Woman is E-NS, L-S, PHM is E-S, L-S 0.721 0.401 - 1.296 Woman is E-NS, L-B, PHM is E-S, L-S 0.620*** 0.440 - 0.874 Woman is E-NS, L-T, PHM is E-S, L-B 0.648* 0.397 - 1.058 Woman is E-NS, L-S, PHM is E-S, L-B 0.637 0.214 - 1.892 Woman is E-NS, L-B, PHM is E-S, L-B 0.449** 0.206 - 0.976 Woman is E-S, L-S, PHM is E-NS, L-B 0.707 0.421 - 1.187 Woman is E-S, L-B, PHM is E-S, L-S 1.114 0.314 - 3.946 Woman is E-S, L-S, PHM is E-S, L-B 1.683** 1.121 - 2.527 Observations 4,485 4,485 4,485 *** 𝑝𝑝 < 0.01, ** 𝑝𝑝 < 0.05, * 𝑝𝑝 < 0.1 Notes: The unit of observation is a woman who gave birth at one of the six study hospitals. Odds ratios are presented with 95% confidence intervals in the parentheses below. For Column 3, the interpretation for each variable “Woman is E-𝑊𝑊, L-𝑋𝑋, PHM is E-𝑌𝑌, L-𝑍𝑍” is read as “Woman of ethnicity 𝑊𝑊 (either Sinhalese 𝑆𝑆 or non-Sinhalese 𝑁𝑁𝑆𝑆) who speaks language 𝑋𝑋 (either Tamil 𝑇𝑇 or Sinhala 𝑆𝑆 or both Tamil and Sinhala 𝐵𝐵) is matched to PHM of ethnicity 𝑌𝑌 (either Sinhalese 𝑆𝑆 or non-Sinhalese 𝑁𝑁𝑆𝑆) who speaks language 𝑍𝑍 (either Tamil 𝑇𝑇 or Sinhala 𝑆𝑆 or both Tamil and Sinhala 𝐵𝐵). Some combinatorial categories in Column 3 did not contain enough observations for analysis and are therefore dropped. The reference group in Column 3 is ethnic Sinhalese women who speak only Sinhala and who are matched to ethnic Sinhalese PHMs who speak only Sinhala. The regressions present results for whether the woman was counselled before admission. Results are from logistic regressions that include woman-level controls such as educational attainment of the woman (no education, primary, secondary, higher), age of the woman (in 5-year age groups), number of births, and whether the woman has ever used family planning. hospital fixed effects are included, and standard errors are clustered at the PHM level.

26 www.bu.edu/gdpHCI@GDPCenterPardee School of Global Studies/Boston University
Appendix Table 3: The Association between Ethnolinguistic Concordance and Counseling, Nawalapitiya and Nuwara Eliya Hospitals Only (1) (2) (3) VARIABLES Counselled
Before Admission?
Counselled Before
Admission?
Counselled Before
Admission? Respondent and PHM Language Match? (1 = Yes) 1.655*** 1.237 - 2.215 Respondent and PHM Ethnicity Match? (1 = Yes) 1.710*** 1.323 - 2.210 Woman is E-NS, L-T, PHM is E-NS, L-T 0.954 0.468 - 1.945 Woman is E-NS, L-T, PHM is E-NS, L-B 0.867 0.545 - 1.379 Woman is E-NS, L-B, PHM is E-NS, L-B 3.100 0.662 - 14.518 Woman is E-NS, L-T, PHM is E-S, L-S 0.557*** 0.393 - 0.792 Woman is E-NS, L-S, PHM is E-S, L-S 0.714 0.211 - 2.414 Woman is E-NS, L-B, PHM is E-S, L-S 0.568** 0.348 - 0.929 Woman is E-NS, L-T, PHM is E-S, L-B 0.730 0.444 - 1.200 Woman is E-NS, L-S, PHM is E-S, L-B 1.698 0.296 - 9.744 Woman is E-NS, L-B, PHM is E-S, L-B 0.482* 0.207 - 1.124 Woman is E-S, L-S, PHM is E-NS, L-B 0.760 0.400 - 1.444 Woman is E-S, L-B, PHM is E-S, L-S 0.160* 0.021 - 1.242 Woman is E-S, L-S, PHM is E-S, L-B 1.628** 1.098 - 2.416 Observations 2,436 2,436 2,436 *** 𝑝𝑝 < 0.01, ** 𝑝𝑝 < 0.05, * 𝑝𝑝 < 0.1 Notes: The unit of observation is a woman who gave birth at one of the six study hospitals. Odds ratios are presented with 95% confidence intervals in the parentheses below. For Column 3, the interpretation for each variable “Woman is E-𝑊𝑊, L-𝑋𝑋, PHM is E-𝑌𝑌, L-𝑍𝑍” is read as “Woman of ethnicity 𝑊𝑊 (either Sinhalese 𝑆𝑆 or non-Sinhalese 𝑁𝑁𝑆𝑆) who speaks language 𝑋𝑋 (either Tamil 𝑇𝑇 or Sinhala 𝑆𝑆 or both Tamil and Sinhala 𝐵𝐵) is matched to PHM of ethnicity 𝑌𝑌 (either Sinhalese 𝑆𝑆 or non-Sinhalese 𝑁𝑁𝑆𝑆) who speaks language 𝑍𝑍 (either Tamil 𝑇𝑇 or Sinhala 𝑆𝑆 or both Tamil and Sinhala 𝐵𝐵). Some combinatorial categories in Column 3 did not contain enough observations for analysis and are therefore dropped. The reference group in Column 3 is ethnic Sinhalese women who speak only Sinhala and who are matched to ethnic Sinhalese PHMs who speak only Sinhala. The regressions present results for whether the woman was counselled before admission. Results are from logistic regressions that include woman-level controls such as educational attainment of the woman (no education, primary, secondary, higher), age of the woman (in 5-year age groups), number of births, and whether the woman has ever used family planning. hospital fixed effects are included, and standard errors are clustered at the PHM level.

Global Development Policy CenterBoston University53 Bay State RoadBoston, MA 02215
[email protected]/gdpc_buwww.bu.edu/gdp
The Human Capital Initiative (HCI) is a research inititiative at Boston University’s Global Development Policy Center. The GDP Center is a University wide center in partnership with the Frederick S. Pardee Schoolfor Global Studies. The Center’s mission is to advance policy-oriented research for financial stability, human wellbeing, and environmental sustainability.
www.bu.edu/gdp
The views expressed in this Working Paper are strictly those of the author(s) and do not represent the position of Boston University, or the Global Development Policy Center.
HCI@GDPCenterPardee School of Global Studies/Boston University
H U M A N C A P I T A L I N I T I A T I V E