Embed Size (px)
Citation preview

1
ETHNIC POPULATION PROJECTIONS: A REVIEW OF MODELS AND FINDINGS Philip Rees with Pia Wohland, Paul Norman and Peter Boden School of Geography, University of Leeds, Leeds LS2 9JT, UK Email: [email protected], Tel +44 (0)113 343 3341 Paper presented at the Seminar on Multi-attribute analysis and projections of ethnic populations Quantitative Methods in the Social Sciences, Seminar Series 2 (European Science Foundation) Thorbjørnrud Hotel, Jevnaker, Norway, 3-5 June 2009
Acknowledgments: This paper is part of a research project funded by ESRC Research Award RES-165-25-0032 (1/10/07 to 30/9/09) What Happens When International Migrants Settle? Ethnic Group Population Trends and Projections for UK Local Areas. Web pages: http://www.geog.leeds.ac.uk/research/projects/migrants.html.
ABSTRACT
Developed world populations are being changed by three interacting trends: below replacement fertility for three to four decades, steadily improving life expectancies, particularly at older ages and significant inflows of migrants to the richest countries. These trends mean fewer children than in the baby boom years and a greater number of older people, with population ageing about to accelerate as baby boomers born 1946 to 1975 cross various old age thresholds. Population ageing is mitigated in part and over the medium term by international immigration to developed countries from developing countries. Because the ethnic make-up of the immigrant stream is different from that of the already settled population, the ethnic composition of developed country populations has been moving away from dominance by white Europeans towards both greater diversity of groups and a larger population of mixed parentage. These changes have been labelled the third demographic transition. To build a picture of how these changes will work over our life-times and those of our children and grandchildren, we need to construct projections of the populations of the different ethnic groups. This paper reviews alternative approaches to projection of ethnic minority populations. The models are generally adaptations of the standard cohort-component projection model. The adaptations are designed to handle the different conceptualizations of ethnicity. Ethnicity may be based on use of distinctions between native and foreign (country of birth groups), between citizen and non-citizen (nationality groups), between white and non-white (racial groups) and between combinations of race and national origin (ethnic groups). Models can vary from ones in which the groups are strictly separate and change in parallel (e.g. United States), to ones in which after one or two generations transfer into the host population, to ones in which new mixed groups arise through inter-marriage and mixed ethnicity parentage (e.g. UK) and in which people can have multiple group membership (e.g. New Zealand). In implementing any ethnic projection model, it is necessary to develop estimates of the relevant group components (fertility, mortality, internal and international migration). Often there is inadequate information available and indirect estimation of the necessary input variables is needed. The paper illustrates for a UK set of local areas the way in which ethnic group components have been estimated.

2
1. INTRODUCTION
1.1 Context Developed world populations are being changed by three interacting trends: below replacement
fertility for three to four decades, steadily improving life expectancies, particularly at older ages and
significant inflows of migrants to the richest countries. These trends mean fewer children than in the
baby boom years (circa 1946 to 1975) and a greater number of older people, with population ageing
about to accelerate as baby boomers born in the years 1946 to 1975 cross various old age thresholds.
Population ageing is mitigated in part and over the medium term by international immigration to
developed countries from developing countries. Because the ethnic make-up of the immigrant stream
is different from that of the already settled population, the ethnic composition of developed country
populations has been moving away from dominance by white Europeans towards both greater
diversity of groups and a larger population of mixed parentage. The main demographic consequence
of sustained flows of international migrants into a country and its regions is the growth of the
populations of immigrants and their descendants and, if the settled or native population has low rates
of growth, the subsequent changes in ethnic composition of the population. This, in turn, leads to
changes in national identity and culture. Coleman (2006a, 2006b) has labelled this sequence of events
the Third Demographic Transition.
Countries need to have a view of their future, under different scenarios. One aspect of that future will
be the size, age structure and ethnic composition of the national population, given various
assumptions. These demographic features are likely to change substantially for developed countries
such as the United Kingdom over the next 50 years. What demographers normally do to explore the
future is to carry out projections of the population. So far, these projections have taken into account
the age and sex structure of the population and its spatial distribution at country, region and local
levels (ONS and GAD 2006, ONS 2008a), but ethnic composition has not so far been included
routinely in projections.
1.2 An example of changing ethnic composition: the case of the UK population
The population of the United Kingdom is continuing to grow at a moderate pace, 0.64% in 2006-7.
There are several factors promoting continued growth: the remaining demographic momentum of high
fertility in the 1960s and early 1970s, the recent rise (catch-up) in fertility levels, the continuing
improvement of survival of people to and within the older ages and the ongoing high level of net
immigration (ONS 2008b). Births have risen from 663 thousand in 2001-2 to 758 thousand in 2006-
7, while deaths have decreased from 601 thousand to 571 thousand. Natural increase has risen since
2001 to contribute 48% to population change in 2006-7 from only 30% in 2001-2. Immigration has

3
grown in the same period from 484 thousand in 2001-2 to 683 thousand in 2006-7. Emigration has
also increased from 334 thousand to 406 thousand. Net migration was 148 thousand in 2001-2 and
198 thousand in 2007-8 but had been 262 thousand in 2004-5 in the period of highest immigration
from the new EU member states.
This population growth varies considerably from place to place (Dunnell 2007). Growth is highest in
the East Midlands, East, South West and Northern Ireland regions in the year 2001-2006 but each
region has a few local authorities that have experienced decline.
Against this back cloth of demographic change, the ethnic composition of the population is changing
quite fast. ONS estimates for England for the 2001-6 period show a 2.7% increase in the total
population, a 0.4% decrease in the White British group and a 23.0% increase in not-White British
group (ONS 2007, Large and Ghosh 2006a, 2006b). In 2001 the White British made up 87% of the
England population and ethnic minorities 13%. By 2006 this had shifted to 84% White British and
16% ethnic minorities. Both immigration and natural increase of the not-White British contribute to
substantial population change, which varies considerably across the local authorities of the UK.
Profound change in the size and composition of the UK’s local populations is in prospect.
1.3 Aim of the paper
The aim of this paper is to review the field of ethnic population projection, building on an earlier
review by Coleman (2006b) but looking at the alternative methods rather than outcomes. Why might
we want to project the population of the ethnic groups of a developed country? The first reason is that
if demographic intensities (either rates or probabilities) vary substantially across sub-groups of the
population, then that heterogeneity needs to be taken into account in constructing projections. There is
plenty of evidence of such heterogeneity (ONS 2004). The second reason is so that we can plan for
the future more intelligently, to reach social goals (greater equality of opportunity across ethnic
groups), economic goals (to assess the future labour supply in terms of size and skills and determine
what policy is needed to improve skills of the resident population) and community goals (the
provision of the right schooling, the right mix of goods and services). You might object that the future
is likely to be uncertain, so that projections will always turn out to be wrong. But the range of
uncertainty can be estimated either by running many projections under different variants or scenarios
or by sampling from error distributions of summary indicators of the main component drivers,
fertility, mortality and migration.

4
There are, however, a number of challenges involved in carrying out ethnic population projections.
How should ethnic groups be defined? How should they interact demographically? How do we
estimate the key ingredients - fertility, mortality, internal and international migration by ethnic group -
in the face of inadequate data? What kind of projection model should be employed? What
assumptions should we adopt for future fertility, mortality or migration differences? How do we
validate our projections?
1.4 Outline
The plan of the paper is as follows. In the second section we describe the ingredients (the state space)
necessary for carrying out a projection of ethnic group populations. We discuss the alternative
classifications of ethnicity which are available, their advantages and disadvantages and the
consequences of the definitions for population change. We clarify how age and time should be
handled in the projection. If more than one spatial unit is employed in the projections, then there are a
number of choices to be made in how the projections are carried that also apply to ethnic groups. In
section three we discuss a variety of models and associated software that have been used to project
spatial populations including ethnic group populations. In section four of the paper we review, with
particular reference to the UK, how estimates of the inputs to ethnic projections can be made when
directly measured data are not available. In section five we reflect on what has been learnt from the
review.
2. INGREDIENTS FOR PROJECTING OF ETHNIC GROUP POPULATIONS
To carry out a population projection we need to define the state space within which the projection is
made operational, that is the classifications of the population into groups. Then we need to adopt a
model form that represents the processes of population change that occur. To drive the model we need
a set of benchmark component data sets and in the case of ethnic populations this may involve a
considerable effort of estimation. Finally, we need a set of assumptions about how those components
will develop in the future. In this section we discuss the first of these ingredients, the state space.
2.1 Ethnic groups: what are they and how do people change ethnicity?
In this section of the paper we discuss the various meanings of the term ethnic group and whether and
how people change their ethnicity. In terms of its etymology, “ethnic” means belonging to a nation, an
“ethnos” (Greek). Belonging to a nation may be defined using one or more variables that can be
measured in surveys or censuses or recorded on registers. In general, persons are born into an ethnic
group and tend to remain in that group for the rest of their lives. This contrasts with age and
family/household status which change as a person’s life course proceeds. It also differs from social
class, largely linked to occupation, which can change through the working part of the life course

5
through upward or downward social mobility. The variables used to define ethnicity include: country
of birth, country of citizenship/nationality, country of family origin, racial group (defined mainly in
terms of skin colour or facial features), language, religion or through self-identification.
However, many of these statuses used to define ethnicity do change over time and lead to problems in
identifying groups. For example, use of a country of birth different from that of current residence
applies most usefully to groups that have immigrated recently. Their children and grandchildren born
in the country to which they migrated no longer share this characteristic. Nationality changes through
the acquisition of citizenship through application. The criteria for eligibility include, depending on
country, residence for a period of time in the host country, testimonials from citizens about the
standing of applicants, the absence of a criminal record, a language test, a knowledge test and family
connections to citizens. People whose ethnicity is defined by religion may change through conversion
of religious belief. Where a person’s ethnicity is defined by self-identification, they may change their
identification over time. Rees (2002) made suggestions about how these might be incorporated into a
projection when adolescents become adults. However, robust empirical evidence on the extent of
changes in ethnic self identification is lacking.
2.2 An example of the complexity of ethnic classification: the case of the UK
Ethnic classifications in the United Kingdom are based on self-reporting through census or social
survey questionnaires. A full guide to ethnic classifications used in UK official statistics is provided
in Ethnic Group Statistics (ONS 2003a). Considerable consultation and debate goes into the
formulation of the question. The resulting categories are a compromise between the demands of
pressure groups interested in counting and promoting their own group and a need to make the
question one that the whole population can understand. Ethnic classifications change over time
recognising the evolution of groups as a result of migration from the outside world and as a result of
marriage/partnership of people from different groups resulting in children of mixed ethnicity.
Table 1 shows the ethnic group classifications adopted in the 2001 Census of the UK, which differ
from those in the 1991 Census in recognizing several mixed groups. There are different
classifications, specific to each home country within the UK. In England and Wales 16 groups are
used; in Scotland, 5 groups are used; in Northern Ireland 12 groups are used. The classifications are
based on two concepts: race and country of origin (either directly through migration or through
ancestry). Many studies (e.g. Rees and Parsons 2006, Parsons and Rees 2009) used a collapsed
version of the classification (e.g. White, Mixed, Asian, Black, Chinese & Other) but these

6
amalgamated classes hide huge differences in terms of timing of migration to the UK, age-sex
structures, population dynamics and socio-economic and cultural characteristics.
[Table 1 about here]
Most studies (e.g. Coleman and Scherbov 2005, Coleman 2006b, Rees and Butt 2004) drop the Mixed
group. Since the 2001 Census revealed this to be the fastest growing group such an omission is
regrettable. The omission occurs particularly when comparing 1991 and 2001 Census results. For
example, Rees and Butt (2004) adopted the 1991 Census classification as the common classification
for their analysis of ethnic population change in England and reallocated the mixed groups
proportionally back to their parent groups (Table 2). Most authors allocate each of the mixed groups
back to their non-White parent group.
[Table 2 about here]
The proposals for the 2011 Census questions on ethnicity and a new question on national identity are
set out in Figure 1 (White and McLaren 2009). The broad (and race-based) groups from 2001 are
retained but some details will change. The first category under White recognizes the complexity of
national identity for this group. The Chinese group has been relocated under the Asian/Asian British
grouping. Arab ethnicity is recognized for the first time.
[Figure 1 about here]
2.3 Sexes/genders in ethnic population projection models
Most variables in projection models are classified by sex/gender. The sexes only interact in the
fertility process, where a female dominant fertility model is normally adopted. The one special
ingredient that is needed in an ethnic projection model is a fertility module for generating mixed
births. Mothers of one ethnic group may have husbands or partners of another and their children will
be of mixed ethnicity. If there is information on the birth registration record about the ethnicity of
mother and father, then it is straightforward to compute the probabilities that mothers of one ethnic
group will give birth to children of mixed ethnicity. Such classifications are not used on UK birth
registration records although country of birth is recorded. However, in a substantial fraction of birth
records the details of the father are missing (this is why fertility models are female-dominant). In that
situation, researchers resort to using proxy variables from large household surveys or household

7
microdata samples from censuses. Within each family household it is possible to identify children
under one year of age or under five years of age together with their mothers and fathers (if present).
Children will have been assigned an ethnicity by the household representative completing the census
form. It is therefore possible to tabulate the ethnicity of the child against his/her mother’s ethnicity.
2.4 Ages: dealing with age-time space properly
Period-cohorts are the key age-time concept used in cohort-component projection models. A period-
cohort is the space occupied by a birth cohort in a time period and shows how persons aged x at the
start of year t, born in year t-x, age forward over one year to be aged x+1 at the start of year t+1. We
recognise two different classifications: period-age and period-cohort. Many vital statistics are
classified using the period-age scheme, but for projection models it is essential to use the period-
cohort age-time-plan. In many projection models the ageing process is implemented after the
component population processes (survival, migration and fertility) have been implemented.
It is advantageous to use single years of age in a projection model wherever the data allow so that
projections for each year can be produced and so that aggregate age groups can be flexibly
constructed. There is a strong argument that the age range of the population should be extended to 100
and over, recognising the higher rates of survival into the older old ages that are now present in the
population and recognising the important demands for care generated by the older old population.
Many national statistics offices are now extending their statistical tables to include populations at
greater ages than 100. But such an extension is probably too ambitious currently for ethnic groups or
for sub-national populations and certainly for the combination.
Handling the last period-cohort in a projection model usually requires some assumption. In order to
project the population aged 100+, the researcher needs to estimate survivorship probabilities for an
additional period cohort (100+ to 101+), in the absence of good data on events for the 100+
population. To overcome this absence, one solution is to assume that the survivorship probabilities in
the 99 to 100 and 100+ to 101+ period-cohorts are equal to the survivorship probability for the 99+ to
100+ cohort which can be estimated. This assumption is not unreasonable as in very old populations
we observe a slowing down of the increase of mortality with age.
The age-time classification used to compute fertility rates is often a period-age plan. Most researchers
convert these period-age fertility rates into period-cohort rates by averaging successive period-age
rates within the fertility model of the projection model. However, this is not necessary if the fertility
computations are placed after the computations for the existing populations at the start of the period.
If this is done, then the start of year and end of year populations by age will be known and so period-

8
age fertility rates can be multiplied by the average female population in an age group to produce the
projected births for that year.
2.5 Regions and migration
Most ethnic population projections produced to date are for national populations (Coleman 2006),
though the US Bureau of the Census (Campbell 1996) produces state projections for five
race/ethnicity populations. Where sub-national units are used, then consideration must be given to
how migration between them is handled. There are two general approaches: (1) to treat each sub-
national unit as a single unit with streams of in- and out-migration and (2) to handle all sub-national
units together and to represent migration as flows or rates between them. The former single region
approach is easier to compute. The latter multiregional approach is more elegant theoretically but
more difficult to compute if there are a large number of sub-national units.
[Table 3 about here]
For single region models, it is customary to introduce migration as a total net migration addition or
subtraction to the population. This is unsatisfactory as this gives no insight into which of the many
migration streams are producing the net result. It is better to clearly recognize four separate migration
streams, even though it may be difficult to estimate these for ethnic groups. The four streams are: (1)
immigration to the sub-national unit from outside the country, (2) emigration from the sub-national
unit to the outside world, (3) in-migration from the rest of the country to the sub-national unit and (4)
out-migration from the sub-national unit to the rest of the country. There is then a choice about
whether to handle the migration streams using a migration rate and population at risk or using an
estimated migration flow. In a projection of the ethnic group populations for 13 regions in the UK,
Rees and Parsons (2006), emigration and internal out-migration were modelled using rate and
populations at risk for the origin region, while immigration and internal in-migration were represented
in the model as flows.
The multi-regional model form recognizes that in-migrants to a sub-national unit are, in fact, out-
migrants from other sub-national units (Rogers 1990) and that the set of flows are best modelled
simultaneously. Immigration and emigration are handled as flows and rates respectively. The form of
the multiregional model depends on the way in which the migration data used are measured. There are
two types of measure: transition and movement. Transition migration results from comparison of a
person’s location at two points in time. If they are different, a transition has occurred. Movement

9
migration results from a recording of sub-national unit to sub-national unit migrations that occur in an
interval. The count of moves/migrations is equal to or greater than the count of transition/migrants.
2.6 Dealing with uncertainty
Ethnic population projections also need to provide the user with some idea of the uncertainty
associated with the projections.
Traditionally, this has been done through high and low variant projections around a principal
projection (see ONS and GAD 2006, ONS 2008a for national examples). The number of variant
projections can become large if all combinations of high, middle and low assumptions for each
component were selected. There are also decisions to be made about the ways in which the high,
middle and low variants work themselves out across the sub-national units and the ethnic groups. We
need to worry about whether mortality and fertility are converging to or diverging from a national
mean trend or whether sub-national and ethnic group distributions of immigration and emigration, for
example, are changing.
One solution is to design scenario projections which combine particular variants to produce a
coherent picture of the alternative future. Such a set of scenarios are being developed for NUTS2
regions across Europe in the DEMIFER project (ESPON 2009). Another solution to uncertainty is the
development of stochastic/probabilistic projections (see Wilson and Rees 2005 and Booth 2006 for
reviews). An example of stochastic projection applied to ethnic group projections is given in Coleman
and Scherbov (2005) for the UK population.
3. POPULATION PROJECTION MODELS ADAPTED FOR ETHNIC GROUPS
Do we need to develop new models for handling ethnic population projections? Could not existing
models and associated software be used to produce the projections? We consider the advantages and
disadvantages of current models and software. Table 4 provides a summary of work over several
decades in the UK that has produced either population estimates by ethnicity or population projections
by ethnicity. The methodologies used in the reports are listed in the final column of the table and these
are discussed in this section of the paper.
[Table 4 about here]

10
3.1 Single-region models: POPGROUP, JRF Model
Simpson, Andelin Associates and colleagues (CCSR 2009) have developed a suite of spreadsheet
macros called POPGROUP that implement a single-region cohort-component model with net
migration, which is widely used by Local Governments and has been applied to ethnic forecasts for
Birmingham, Oldham, Rochdale and Leicester (Simpson 2007a, 2007b, 2007c; Simpson and Gavalas
2005a, 2005b, 2005c; Danielis 2007). Rees and Parsons (Rees and Parsons 2006, Parsons and Rees
2009) in work for the Joseph Rowntree Foundation (JRF) used a single-region cohort-component
model for UK regions which used four migration streams: internal out-migration and emigration as
intensities (probabilities) and immigration and internal in-migration as flows.
These models have the key advantage of being relatively easy to implement and use for a large
number of sub-national units and ethnic groups. They suffer from an important disadvantage of
neglecting the important nexus in multistate population dynamics: that the out-migrants from one
region become the in-migrants to other regions (Rogers 1990). If we wish to introduce a model of
migration rather than just the migration rates, then this is best accomplished through the framework of
a multi-regional projection.
3.2 Multi-region models: LIPRO, UKPOP
Since the 1970s various programs have been developed to implement the multi-regional cohort-
component model. In the early 1990s a general version was developed at NIDI by van Imhoff and
Keilman (1991) for use with household projections but in a form in which other state definitions could
easily be introduced. The software is made available (NIDI 2008) though no longer supported as a
licensed package. There is some uncertainty about the capacity of this software for handling
“transition data” (e.g. census migration), having been designed for inputs of “movement data” (e.g.
register events). It is still intensively used at NIDI and by Eurostat for various projections and by
some researchers in the UK.
In the UKPOP model (Wilson 2001, Wilson and Rees 2003) the accounts based model developed by
Rees (1981) is developed for a full set of UK local authorities. The accounts based model relies on
iteration to make consistent the relationship between observed deaths in a region (the variable
generally available) and the deaths to the population in the region at the start of the interval (who die
in that region and elsewhere). Efforts by Parsons and Rees to re-apply this model met with difficulties
in achieving convergence in the iterative procedure. The model could generate for older ages negative
probabilities of survival within a region, for example. The reason for this was that populations, deaths
and migration come from different data sources (e.g. census and vital register) which may be

11
inconsistent and in error at the oldest ages. Wilson and Bell (2004a) and Wilson et al. (2004) have
used simpler versions of the multi-regional model in important work in Australia with either much
smaller numbers of spatial units or using a sequence of bi-regional models. This work builds on
experiments by Rogers (1976). Wilson and Bell (2004b) establish that a set of bi-regional models
gives results close to a full multiregional model. Wilson (2008) has also developed a model for the
indigenous and non-indigenous population of the Northern Territory, Australia, which has a number
of very useful features.
3.3 Multiregional models: ONS Sub-national model for England, GLA model for London Boroughs
Both these models have a long pedigree and are in continued use. The ONS Sub-national model for
Local Authorities in England is implemented by the Office for National Statistics in collaboration
with outside contractors. A broad outline of the methodology is in the public domain (ONS 2008c).
The results of GLA model are frequently published but again only some of the details of the
underlying model are in the public domain (London Research Centre 1999, Storkey 2002a, Hollis and
Bains 2002, Bains and Klodawski 2006, Bains and Klodawski 2007).
3.4 Nested multi-region models (MULTIPOLES)
Kupiszewski and colleagues at CEFMR (Kupiszewska and Kupiszewski 2005, Bijak et al. 2005,
Bijak et al. 2007) have developed a model from an idea by Rees et al. (1992) that uses several layers.
For example, in a projection study of 27 EU states (Bijak et al. 2005) three layers are recognised:
inter-region migration within states, inter-state migration within the EU and extra-EU migration. This
approach enables different models to be used in the different layers within a consistent accounting
framework.
3.6 A UK example of the design of a projection model for ethnic groups
This section of the paper introduces a design of a projection model for ethnic groups currently being
worked on. The model uses a transition framework because the vital internal migration information
derives from the decennial census. The model can be adapted where similar migration data sets are
available.
Every projection model has an explicit or implicit accounting framework, which must be consistent.
Table 5 provides a picture of the population accounting framework used in the model. The accounting
framework consists of a matrix of population flows to which are added a column of row totals and a
row of column totals to constitute an accounts table. The row totals contain births (in the case of the
first, infant period-cohort) or start populations (for other period-cohorts) and totals of (surviving)

12
immigrants. The column totals contain deaths (non-survivors) and final populations in an interval.
Table 4 sets out the accounting framework for zones (local areas/authorities) within England and
Wales with Scotland and Northern Ireland being handled as single zones. The table variables are for a
typical period-cohort, gender and ethnic group combination.
[Table 5 about here]
What are the key features of this framework?
The first feature is that the table holds transition data rather than events data. Transition data derive
from censuses in which a question is asked about a person’s usual residence at a fixed point in the past
(one year before the 2001 Census, in the current analysis). Events data derive from registration of the
demographic events such as birth or death or migration from one place to another. The variable MSi,j
represents the number of migrant survivors resident in zone i on 29 April 2000 who live in zone j on
29 April 2001. Note that, in principle, migration data for the years from 2001-2 onwards are also
transition data based on comparison of NHS patient register downloads one year apart. The variables
in the principal diagonal, Si,i, are persons present in zone i at both the start of the year and the end of
the year (stayer survivors). These counts include migrants who moved within the zone.
From the start population are subtracted the deaths (non-survivors) to the zone i start population, the
emigrant survivors from the zone i population, the sum of out-migrant survivors to other zones in the
country. Then we add the sum of in-migrant survivors from other zones within country c and
surviving immigrants from the rest of the world. The stayer survivor terms, SSi,i, do not appear in this
accounting equation. However, we do need to estimate these SSi,i variables. This is because in the
projection model we will use probabilities of migration conditional on survival within the country.
These are the sum of elements in the rows of the matrix from City and Westminster to Northern
Ireland, including the stayer survivor terms. We estimate these terms by subtracting from the 2001
Census population aged 1+ the total number of in-migrant survivors and the total immigrant
survivors.
Given the number of zones, ages and ethnic groups represented in our projection model, we should
not expect to find reliable data to count directly the flows and transition probabilities needed for the
projection model. Instead we will need to estimate these flows using a variety of sub-models which
use more aggregate and reliable data together with a set of assumptions, some testable, some merely
plausible in the absence of statistical evidence.

13
4. INPUTS TO ETHNIC POPULATION PROJECTION MODELS
To carry out projections we need reliable estimates of the base population and components of change.
The base population is provided through a census or register, providing the right question has been
asked on the census or registration form. In many cases the right classification is missing, particularly
in the deaths, births and migration registers. In this section of the paper we describe some methods of
indirect estimation that have been used in the UK, which may be useful in other countries where the
appropriate classifications are missing.
4.1 Base populations
The model described in section 3.6 is envisaged to project the UK’s future population for 374 Local
Authorities in England and Wales plus Scotland and Northern Ireland as single zones. For each Local
Authority, each ethnic group’s population (measured in the Census 2001 and adjusted to 2001 MYE
populations) will be projected for single years of age and up to age of 100+, for men and women. This
means we will use 16 ethnic groups in England and Wales and convert the 12 ethnic groups for
Northern Ireland and the 5 for Scotland into 16 (Rees and Parsons 2006). We use data from the 2001
Census to estimate initial base populations and then use estimates produced by National Statistics for
subsequent years (Large and Ghosh 2006a, 2006b).
The 2001 Census provides populations for all UK Local Authorities by single year of age for all
groups and by five years for ethnic group. However, the Census was on the 29 April 2001 whereas we
want to base our input data on midyear population estimates. To obtain those, we use a few simple
assumptions. To get mid-year estimates for the total population, we used mid-year estimates for all
persons and divided the 90+ population for England, Wales and Scotland and the 85+ population of
Northern Ireland assuming the same population age structure as observed in the Census 2001 for these
age groups. To extend the English mid-year estimates for the 16 ethnic groups to age 100+, we use the
same assumptions. To finally derive mid-year population estimates for the remaining home countries
and their ethnic groups, we computed the factor for each age and Local Authority by which the all
persons population changed from the Census 2001 to the midyear estimates of 2001 and multiply the
Census 2001 ethnic population data with this factor.

14
4.2 The estimation of mortality and survivorship for ethnic groups in the UK
A literature review brought to light that to date, none of the UK projections or roll-forward, year by
year estimates of ethnic groups (e.g. UK regions: Rees and Parsons 2006; GLA, Boroughs: Bains and
Klodawski 2006, 2007; England, Local Authorities: Large and Ghosh 2006a, 2006b; UK: Coleman
and Scherbov 2005; Leicester: Danielis 2007) use ethnic-specific mortality. Some work uses mortality
rates based on country of birth (Harding and Balarajan 2002), but this method only identifies first
generation immigrants.
On the other hand, work conducted in other countries highlights the relevance of using ethnic specific
mortality rates in projection models. The United States Census Bureau routinely computes projections
by race and Hispanic origin (Campbell 1996) and publishes life expectancies by race (NCHS 2007).
In 2003, for example, White men were estimated to have life expectancies in 2003 of 75.3, while for
Black men life expectancies were only 68.9. The corresponding figures for women were 80.4 for
Whites and 75.9 for Blacks. More examples of ethnic specific mortality are discussed in Rees and
Wohland (2008).
If there are reasonable suggestions that ethnicity affects the intensity of mortality, why have UK
projections models not already considered that? The answer is because mortality data in the UK are
only available as vital statistics for the total population but not for ethnic groups. To our knowledge
Rees and Wohland (2008) produced the first detailed estimates for mortality by ethnic groups and
local areas conducted for the UK.
So, what can be done to fill this gap in UK demographic statistics? Is there a data source for the UK
that can deliver reliable information for all of the ethnic groups at local level and represent some kind
of proxy to estimate mortality? Yes there is: the 2001 Census asked questions on reporting on health
as either “limiting long-term illness” and “general health”. There have been a large number of studies
carried out using American, Danish, Dutch, Finnish and Swedish data on individuals which indicate
that self-reported health is a remarkably good predictor of subsequent mortality (for example,
Burström and Friedlund 2001, McGee et al. (1999) Heistaro et al. (2001) Helwig-Larson et al. (2003)
Franks et al. (2003), Singh and Siahpush (2001)). In summary, these studies suggest that:
• Self-reported health status is a strong predictor of subsequent death.
• The relationship for men is different from that for women (i.e. men experience higher
mortality than women at each health status, implying they assess their health as better than it
actually is).

15
• Socioeconomic factors are important in explaining mortality variation across groups but self-
reported health status still has a significant influence after controlling for them.
• There is variation between racial/ethnic groups in the self-reported health-mortality link but it
is not huge.
• There is an important influence of immigrant generation with the first generation having
better self-reported health and mortality than subsequent generations.
Figure 2 outlines how the self reported illness data from the UK 2001 Census are used to calculate
ethnic mortally on a local area level. In a first step Standardized Illness Ratios (SIRs) are computed
for all local authorities in the UK for the whole population (aggregated over ethnicity) and separately
for each ethnic group. At the same time Standardised Mortality Ratios for the whole population
(SMRs) are calculated from data available from National Statistics for the calendar year 2001. In a
next step local authority SIRs for all people are regressed against local authority SMRs for all people.
Then this regression relationship is used with the ethnic group SIRs as independent variables to
generate ethnic-specific SMRs for each local area. From here, ethnic group mortality rates are
estimated by multiplying the all group rates by the ratio of ethnic-specific SMRs to the all group
SMR. In addition these ethnic specific mortality rates for local areas are adjusted so that they produce
the observed all group number of deaths in 2001. In a final step, the resulting mortality rates are then
input to life table routines to generate life tables for all ethnic groups in each local authority, from
which survivorship probabilities can be extracted for use in population projection.
[Figure 2 about here]
In the next paragraphs the relationship between SMR and SIR and their application to the SIRs for
ethnic groups are described and analysed in more detail.
Figure 3 graphs SMR against SIR for two local authority data sets for both sexes. Table 6 provides the
coefficients for the regression lines depicted in the graphs. From Figures 3(a) and 3(b) we can see that
the regression slopes do vary between the UK home countries sets of local authorities. The England
slope is close to the UK slope; Scotland has considerably steeper slopes than England, while Wales
and Northern Ireland have gentler slopes, indicating stronger regression to the mean. In all cases, the
male slope is steeper than the female with mortality and illness ranges greater for males. The
goodness of fit (r2) varies from a low of 0.16 for females in Northern Ireland to a high of 0.78 for
females in Wales; on average it is around 0.5 but higher for males than females. This means about
half the variation in SMRs across local authorities is associated with variation in self-reported limiting

16
long-term illness. Slope coefficients are all below one, indicating that there is regression towards the
mean: areas with higher than average SIRs also experience higher than average SMRs but these are
closer to the mean; areas with lower than average SIRs also exhibit lower than average SMRs.
[Figure 3 about here]
[Table 6 about here]
Figures 3(c) and 3(d) show what happens for England when we divide LAs into those with above
average ethnic minority shares in their population and those with below average shares. Might there
be different relationships because of ethnic compositions of the population (equivalent to those
between home nations)? The results suggest not: the two sets give almost identical coefficients.
In conclusion, we chose to use different relationships between SIR and SMR for each home nation,
under the assumption that the whole population relationship could be applied to each ethnic group.
The next step was to estimate SIR for ethnic groups in local areas using 2001 Census data.
Figure 4 provides histograms of the distribution of SIRs for males and females for each of the 16
ethnic groups. White British SIRs cluster around the UK mean of 100 with a slightly lower average
and comparable distributions for men and women. The White Irish SIRs are similar but slightly
higher. The White Other group has a distribution with a majority of LAs below the UK average. The
Mixed White and Black Caribbean and Mixed, White and Black African groups both exhibit worse
illness distributions than White groups with higher than UK averages. The Mixed, White and Asian
and Mixed, Other Mixed have slightly than average SIRs. The Asian or Asian British SIRs have the
feature that female SIRs are higher than male SIRs. This suggests that Asian men are more reluctant
to report limiting long term illness than Asian women. There is evidence from surveys in South East
Asia (Lutz et al. 2007; Karcharnubarn 2008) that women are significantly more likely to report poor
health. The Indian men have about average SIRs while Indian women’s average is 23 points higher.
Pakistani and Bangladeshi men and women both report significantly high SIRs. Other Asians are
marginally above average (females). Black or Black British groups have contrasting experiences:
Caribbeans report more illness than average as does the Other group, while Africans report lower
illness. The Chinese have the lowest SIR of any ethnic group, while the SIRs of Other Ethnic group
are also below average.
[Figure 4 about here]

17
The mean life expectancies in England at birth are listed in rank order for men and women in Table 7.
The all group mean is placed in the table for reference. The White British group has life expectancies
slightly above (women) and below (men) the all group mean. The Chinese group life expectancies are
highest for both men and women. Also above the all group mean for men and women are the Other
White and Other Ethnic. Black African similar to the White British groups are slightly above (men)
and below (women) the all group mean. The largest discrepancies between men and women are
observed in the Indian (men rank 6/women rank 11) and the White Irish (men rank 9/women rank 6)
groups. We already noted that Indian women report higher rates of limiting long-term illness, relative
to the all group average than men. The lowest life expectancies are experienced by Bangladeshis,
Pakistanis, the Other Black group and the Mixed White and Black Caribbean group.
[Table 7 about here]
Figures 5 captures the essence of the spatial variation in life expectancy at birth across England for
women of each of the 16 ethnic groups. The maps have a simple tricolour code which relates to the
overall distribution of life expectancy across all local authorities in the UK. A red shade denotes that
the area belongs to the 25% highest life expectancies observed in the UK (81.2 years to 85.9 years for
women and 77.2 years to 84.6 years for men); a blue shade inidcates the 25% lowest (73.8 years to
78.9 years for women and 68.7years to 74.5 years for men); the 50% in the middle are shaded grey.
Following features stand out:
• The gradient from higher life expectancies in South and East England to lower expectancies
in Northern England.
• This gradient is modified by urban/rural status of local authorities. Life expectancies in rural
areas are higher than expectancies in urban areas. So, in Northern England there is a band of
rural local authorities running from North Yorkshire to Cumbria which have favoured life
expectancies (Brown and Rees 2006). In South and East England there are local authorities
within urban areas which have lower life expectancies, particularly in Inner London and in the
eastern LAs of the capital region, the Thames Gateway.
• Four ethnic groups stand out as having most areas in the top quartile of the distribution:
Chinese, Black African, Other Ethnic and White Other groups, although in Northern England
and in South and East England cities, there are local authorities in the middle band.
• Four ethnic groups stand out as having a large number of local areas in the bottom quartile:
Mixed – White and Black Caribbean, Pakistani, Bangladeshi and Black Other groups.

18
• The remaining groups – White British, White Irish, Mixed – White and Black African, Mixed –
White and Asian, Mixed – Other Mixed, Indian, Other Asian and Black Caribbean – have a
mixture of high, middle and low life expectancies.
The spatial patterns of life expectancy of women presented here are very similar to those we found
for men. However, the levels of female life expectancies are, of course, are higher than male life
expectancies: the gaps range from 3.3 years (Indians) to 4.9 years (Irish). The lowest differences are
for the Asian groups; the highest differences are for the Irish and Mixed groups. These estimates
support the importance of considering mortality for ethnic groups on a local area level, as we find
both significant variations in life expectancies between different ethnic groups as well as for different
regions. It is important to note the low life expectation of the Pakistani and Bangladeshi communities,
which together make up a large proportion of the non White ethnic group in England. If health
inequalities in England are to be reduced, the health issues experienced by these two Asian groups
need to be addressed.
These estimates of mortality experiences of ethnic groups in England have the status of provisional
statistics. The next steps will be to build explanations of the variations across ethnic groups and local
areas. These explanations will include socioeconomic and environmental factors (Brown and Rees
2006). Preliminary analysis indicates that the level of educational qualification explains much of the
differences between ethnic groups.
These estimates of ethnic group mortality apply to the year 2001. Before using the survivorship
probabilities for the 16 ethnic groups for local authorities in a projection exercise, it will be necessary
to update the mortality estimates to 2007 or 2008 and then to make assumptions about future
developments in UK ethnic mortality and in the likely convergence/divergence of local authority
experience. The life expectancies for UK local authorities from 1991 to 2007 were re-estimated from
annual mortality data and mid-year populations supplied by National Statistics for men and women
(no ethnic information was available). Some preliminary analysis is shown in Figure 6. The local
authorities have been grouped into quintiles on the basis of their deprivation scores at the start of the
time series, in 1991. The life expectancies rise steadily through the period and men’s life
expectancies catch up with those of women. There are clear, systematic and persistent differences
between the deprivation quintiles. The poorer the area the lower will be the life expectancy. The
relationship with deprivation is stronger for men than women. The differences between quintiles
remain largely the same (the estimates for women’s life expectancies in 2007 are probably need
revision), with perhaps a very small widening between the top and bottom quintiles for men. These

19
graphs suggest it will be reasonable to apply the same national improvement rates to all local
authorities.
[Figure 6 about here]
However, we should exercise some caution because another classification does show that groups of
local authorities can experience different rates of change from those of other groups. Figure 7 plots
life expectancies for Groups of local authorities as defined in the general classification produced by
Vickers et al. (2003). Figure 10 shows the Classes in this classification for England and Wales.
Groups are the tier above Classes. Again the Groups all show parallel increases between 1991 and
2007, with one significant exception, the Mercantile Inner London Group, which climbs from second
bottom out of twelve Groups to third for men and from fifth to first for women. The local authorities
in this Group, which are concentrated in Inner West and South West London, have experienced a
wave of gentrification in which middle and upper class residents have replaced working and lower
class residents. This wave of gentrification has been driven by the expansion of London’s financial
sector based in the City of London and neighbouring parts of Inner London. It will be interesting to
learn whether the deep recession of 2007-2009 (ongoing) will see a reversal of this upward
movement.
[Figure 8 about here]
4.3 The estimation of immigration
One important part of our project has been to prepare new estimates on immigration to the UK. We
have gathered together into one spreadsheet database called a New Migrant Databank the statistics on
migration available from census, survey and administrative sources (Boden and Rees 2008a, 2008b,
2009). The Databank is already revealing interesting differences between the accounts of migration
derived from different sources and is generating a re-evaluation of the sub-national distribution of
immigration provided by the UK’s National Statistics Office. A screen shot of the Databank is shown
in Figure 8. On the left hand side, a graph compares for one of England’s regions, Yorkshire and the
Humber, the time series of immigration estimates based on four sources: the official Total
International Migration (TIM) series produced by ONS, the General Practitioner new registrations
(GP Regs) of patients recently arrived from outside the UK, the new National Insurance Number
(NINo) applications by persons originating in all countries outside the UK and the NINo applications
by migrants from the Accession 8 countries, which joined the EU in May 2004. The flat line across
the graph provides a comparison with immigrants recorded in the 2001 Census. There are clearly

20
large discrepancies between these series, in part to do with definition (long-term, short-term migrants;
worker vs non-worker; registered worker vs self-employed worker). In this case we think it is likely
that the official estimate (TIM statistics) is an overestimate of inflows from abroad to the region
(elsewhere there are underestimates). We have produced a synthetic estimate of estimated
immigration using these data and local intelligence on which series is likely to be closer to the true
picture (Boden and Rees 2009). Further research steps include the classification of sub-national
immigration estimates by ethnicity using information from the National Insurance new numbers
database and application of local census and national TIM age schedules to estimate the age-sex
distribution of immigrant flows.
[Figure 8 about here]
4.4 Estimating ethnic group internal migration
Recent work on the structure of internal migration by ethnicity in the UK will help greatly n
constructing a model to estimate inter-local authority flows in England and Wales by ethnicity. Using
the local authority classes from the Vickers et al. (2003) classification (Figure 9) and a commissioned
table from the 2001 Census, Hussain and Stillwell (2008) extract the net migration flows for 2000-1
for seven ethnic groups. Systematic similarities and differences in migration patterns between the
ethnic groups are revealed in Table 8. All ethnic groups are losing internal migrants from Urban
London (they are being replaced by immigrants). Remarkably Prosperous Britain sees gains from all
groups other than the White group. This group shows heavy gains to many of the Rural UK classes
while flows are small into these areas by other ethnic groups and there are many losses. Urban UK
sees losses by the White and Indian groups but gains among the other ethnic groups. The estimation
challenge will be to extend this picture to all 16 ethnicities using information about ethnic group
populations at origin and destination ends of the inter-local authority flows.
[Figure 9 about here]
[Table 8 about here]
Information about the age structure of the migration of ethnic groups has been analysed by Stillwell et
al. (2008). Figure 10 shows that there are clear differences in the level of migration between the
groups though the age structures are similar. Raymer et al. (2008) and Raymer and Giullietii (2008)
have shown how time series of migration flow matrices between 1991 and 2007 by ethnicity can be
estimated by combining information from the censuses of 1991 and 2001 with data on migration by

21
ethnicity available in the yearly Labour Force Survey. The estimation challenge will be to extend this
knowledge of internal migration by ethnicity to all 16 ethnicities using information about ethnic group
populations at origin and destination ends of the inter-local authority flows.
We are currently working on the estimation of fertility rates for ethnic groups for local areas, having
developed and tested a method based on the Child-Woman Ratio combined with local area fertility
rates for the whole population for Government Office Regions.
The final variable needed as input to the projection will be emigration rates. Here we need to rely on
the UK’s International Passenger Survey, enhanced by knowledge of the number of Britons living
abroad and using some information on total intra-country out-migration from local areas. These
estimates will be quite crude.
5. CONCLUDING REMARKS
This paper has reviewed some recent work on ethnic population projection. We have reviewed the
requirements of robust ethnic projections, which include proper understanding of the ethnic
classifications available for use and the need to specify ages at single year resolution for projections
with the greatest value. In choosing a suitable projection model for implementing the projection, it is
necessary to understand fully the nature of the migration information available. A trade-off between
the ease of computation of single region models and the complexity but greater theoretical rigour of
multi-regional models must be arrived at. But the biggest challenge in many countries, including the
UK in particular, is the lack of good data on the components of change. This requires innovative
thinking about how proxy data and good statistical methods can be used to supply input variables to
the projection. We have described a number of ways in which this can be accomplished in the UK,
though much remains to be done.

22
REFERENCES
Bains, B. and Klodawski, E. (2006) GLA 2005 Round: Interim Ethnic Group Population Projections. DMAG Briefing 2006/22, November 2006. Data Management and Analysis Group, Greater London Authority, London. Available at: http://www.london.gov.uk/gla/publications/factsandfigures/dmag-briefing-2006-22.pdf.
Bains, B. and Klodawski, E. (2007) GLA 2006 Round: Ethnic Group Population Projections. DMAG Briefing 2007/14, July 2007. Data Management and Analysis Group, Greater London Authority, London. Available at: http://www.london.gov.uk/gla/publications/factsandfigures/DMAG-Briefing-2007-14-2006.pdf.
Bijak J., Kupiszewska D., Kupiszewski M., Saczuk K. (2005) Impact of international migration on population dynamics and labour force resources in Europe. CEFMR Working Paper 1/2005. Central European Forum for Migration Research, Warsaw. Online at: http://www.cefmr.pan.pl/docs/cefmr_wp_2005-01.pdf.
Bijak J., Kupiszewska D., Kupiszewski M., Saczuk K. and Kicinger A. (2007) Population and labour force projections for 27 European countries, 2002–2052: impact of international migration on population ageing. European Journal of Population 23 (1), 1-31.
Boden P. and Rees P. (2008a) New Migrant Databank: concept and development. Chapter 5 in Stillwell J., Duke-Williams O. and DennettA. (eds.) Technologies for Migration and Commuting Analysis. IGI Global, Hersey, PA.
Boden P. and Rees P. (2008b) New Migrant Databank: Concept, development and preliminary analysis. Paper presented at the QMSS2seminar on Estimation and Projection of International Migration, University of Southampton, 17-19 September 2008. Online at: http://www.ccsr.ac.uk/qmss/seminars/2008-09-17/documents/QMSSPaper-PBPHR-Sept2008.pdf
Boden, P. and Rees, P. (2009) International migration: the estimation of immigration to local areas in England using administrative data sources. Journal of the Royal Statistical Society, Series A (Statistics in Society). In review. Online at: http://arxiv.org/abs/0903.0507
Booth, H. (2006) Demographic forecasting: 1980 to 2005 in review. International Journal of Forecasting 22(3): 547-581.
Bradford Council (1999) Population forecasts for Rochdale 1999-2021: age, sex and ethnic group, City of Bradford Metropolitan District Council, Policy and Research Unit: Bradford.
Bradford Council (2000) Population forecasts for Bradford 1999-2021: age, sex and ethnic group, City of Bradford Metropolitan District Council, Policy and Research Unit: Bradford.
Brown, D. and Rees, P. (2006) Trends in local and small area mortality in Yorkshire and the Humber: monitoring health inequalities. Regional Studies, 40(5): 437-458.
Burström, B. and Fredlund, P. (2001) Self-rated health: Is it as good a predictor of subsequent mortality among adults in lower as well as in higher social classes. Journal of Epidemiology and Community Health, 55, 836-840.
Campbell, P. R. (1996) Population Projections for States by Age, Sex, Race, and Hispanic Origin: 1995 to 2025, U.S. Bureau of the Census, Population Division, PPL-47. Retrieved 31 May 2009 from: http://www.census.gov/population/www/projections/ppl47.html
CCSR (2009) Welcome to the POPGROUP Website. Demographic forecasting with Popgroup. Online at: http://www.ccsr.ac.uk/popgroup/
Coleman D. (2006a) The European demographic future: Determinants, dimensions and challenges. In The political economy of global population change, 1950–2050, Demeny P and McNicoll G, eds. New York: Population Council; Population and Development Review 32(PDR Supplement):52-95.
Coleman, D. (2006b) Immigration and ethnic change in low-fertility countries: A third demographic transition. Population and Development Review 32(3):401–446.
Coleman, D and Scherbov, S. (2005) Immigration and ethnic change in low-fertility countries – towards a new demographic transition? Presented at the Population Association of America Annual Meeting, Philadelphia. Available at http://www.apsoc.ox.ac.uk/Oxpop/publications%20files/WP29.pdf

23
Danielis, J. (2007) Ethnic Population Forecasts for Leicester using POPGROUP. CCSR Research Report, Cathie Marsh Centre for Census and Survey Research, The University of Manchester, Manchester. Online at: http://www.ccsr.ac.uk/research/documents/EthnicPopulationForecastsforLeicester.pdf.
Dunnell, K. (2007) The changing demographic picture of the UK: National Statistician’s annual article on the population. Population Trends 130, 9-21. Available online at: http://www.statistics.gov.uk/downloads/theme_population/Population_Trends_130_web.pdf.
ESPON (2009) DEMIFER: Demographic and migratory flows affecting European regions and cities. Applied Research Project 2013/1/3. Interim Report. The ESPON 2013 Programme. http://www.espon.eu/mmp/online/website/content/programme/1455/2235/1749_EN.html
Franks, P., Gold, M.R. and Fiscella, K. (2003) Sociodemographics, self-rated health, and mortality in the US. Social Science and Medicine, 56(12): 2505-2514.
Harding, S., Balarajan, R. (2002) Mortality data on migrant groups living in England and Wales: issues of adequacy and of interpretation of death rates. Pp.115-127 in: Haskey, J., ed. Population Projections by Ethnic Group: A Feasibility Study. London: The Stationery Office
Heistaro, S., Jousilahti, P., Lahelma, E., Vartiainen, E. and Puska, P. (2001) Self-rated health and mortality: a long term prospective study in eastern Finland. Journal of Epidemiology and Community Health, 55(4) 227-232.
Helweg-Larson, M., Kjøller, M. and Thoning, H. (2003) Do age and social relations moderate the relationship between self-rated health and mortality among adult Danes? Social Science and Medicine, 57(7): 1237-1247.
Hollis, J. and Bains, B. (2002) GLA 2001 Round Ethnic Group Population Projections. DMAG Briefing 2002/4. Data Management and Analysis Group, Greater London Authority, London.
Hussain, S. and Stillwell, J. (2008) Internal migration of ethnic groups in England and Wales by age and district type. Working Paper 08/3, School of Geography, University of Leeds, Leeds, UK. Online at: http://www.geog.leeds.ac.uk/wpapers/08-03.pdf.
Karcharnubarn, R. (2008) Healthy life expectancies in Thailand. Chapter 6, Draft PhD thesis, School of Geography, University of Leeds.
Kupiszewska, D. and Kupiszewski, M. (2005), A revision of the traditional multiregional model to better capture international migration: The MULTIPOLES model and its applications, CEFMR Working Paper 10/2005.
Large, P. and Ghosh, K. (2006a) A methodology for estimating the population by ethnic group for areas within England. Population Trends 123:21-31.
Large, P. and Ghosh, K. (2006b) Estimates of the population by ethnic group for areas within England. Population Trends 124:8-17.
London Research Centre (1999) 1999 Round of ethnic group projections. LRC, London. Lutz, W., Samir, K.C., Khan, H.T.A., Scherbov, S. and Leeson, G.W. (2007) Future ageing in
Southeast Asia: demographic trends, human capital and health status. Interim Report IR-07-026, International Institute for Applied Systems Analysis, Laxenburg, Austria.
McGee, D.L., Liao, Y., Cao, G. and Copper, R.S. (1999) Self-reported health status and mortality in a multiethnic US cohort. American Journal of Epidemiology, 149(1), 41-46.
NCHS (2007) United States Life Tables, 2003. National Vital Statistics Reports, 54, 14: 1-40. National Center for Health Statistics, Centers for Disease Control and Prevention, U.S. Department of Health and Human Services, MD 20782, USA. Retrieved 10 September 2008 from: http://www.cdc.gov/nchs/data/nvsr54/nvsr54_14.pdf
NIDI (2008) LIPRO 4 for Windows. Online at: http://www.nidi.knaw.nl/en/projects/270101/. Norman, P., Stillwell, J. and Hussein, S. (2007) Propensity to migrate by ethnic group: 1991 and
2001. Presentation at the Sample of Anonymised Records, User Meeting, ONS (2003) Ethnic group statistics: a guide for the collection and classification of ethnicity data.
National Statistics Publication. Retrieved 30 May 2009 from: http://www.statistics.gov.uk/about/ethnic_group_statistics/downloads/ethnic_group_statistics.pdf

24
ONS (2003) A Beginner’s Guide to UK Geography: UK Map Collection. Office for National Statistics, London. Online at: http://www.statistics.gov.uk/geography/maps.asp.
ONS (2004) Focus on Ethnicity and Identity. Office for National Statistics, London. Available at: http://www.statistics.gov.uk/focuson/ethnicity/.
ONS (2007) Ethnic population estimates. National Statistics Statbase data repository ONS (2008a) National Population Projections: 2006-based. Series PP2, No.26. Office for National
Statistics, London. Published for ONS by Palgrave-Macmillan, Basingstoke. Online at: http://www.statistics.gov.uk/downloads/theme_population/pp2no26.pdf
ONS (2008b) Population change: UK population creases by 388,000. Online at: http://www.statistics.gov.uk/cci/nugget.asp?ID=950
ONS (2008c) 2006-based Subnational Population Projections for England Methodology Guide. Online at: http://www.statistics.gov.uk/downloads/theme_population/SNPP-2006/2006_Methodology_Guide.pdf
ONS and GAD (2006) National Population Projections: 2004-based. Series PP2, No25. Office for National Statistics, London. Published for ONS by Palgrave-Macmillan, Basingstoke. Online at: http://www.statistics.gov.uk/downloads/theme_population/PP2_No25.pdf
OPCS (1975) Country of birth and colour 1971-4. Population Trends 2, 2-8. OPCS (1977a) Social Trends 8, Central Statistical Office, HMSO, London, pp.68-69. OPCS (1977b) New Commonwealth and Pakistani population estimates. Population Trends 9, 4-7. OPCS (1979) Population of New Commonwealth and Pakistani ethnic origin: new projections.
Population Trends 16, 22-27. OPCS (1986a) Estimating the size of the ethnic minority populations in the 1980s. Population Trends
44, 23-27. OPCS (1986b) Ethnic minority populations in Great Britain. Population Trends 46, 18-21. Parsons, J. and Rees, P. (2009) Child poverty in the UK: Socio-demographic scenarios to 2020 for
children (2008 update). Report on datasets, models and results to the Joseph Rowntree Foundation as part of their project on Child Poverty in the UK: 2008 Update. School of Geography, University of Leeds, Leeds, UK
Raymer J., Smith, P. and Giulietti, C. (2008) Combining census and registration data to analyse ethnic migration patterns in England from 1991 to 2007. Paper presented at the 2008 European Population Conference, Barcelona, Spain.
Raymer, J. and Giulietti, C. (2008) Analysing structures of interregional migration in England. Paper presented at the ESRC Research Methods Festival, Oxford, 2 July 2008, Session 40: Handling Migration and Commuting Flow Data.
Rees, P. (1981) Accounts based models for multiregional population analysis: methods, program and users' manual. Working Paper 295, School of Geography, University of Leeds, Leeds, UK.
Rees P., Stillwell J. and Convey A. (1992) Intra-Community migration and its impact on the development of the demographic structure at regional level. Working Paper 92/1, School of Geography, University of Leeds, Leeds, UK.
Rees, P. (2002) New models for projecting UK ethnic group populations at national and subnational scales. Chapter 3 in Haskey, J. (ed.) Population Projections by Ethnic Group: A Feasibility Study. ONS Studies in Medical and Population Topics, SMPS No.67. The Stationery Office, London. Pp.27-51.
Rees P. and Butt F. (2004) Ethnic change and diversity in England, 1981-2001. Area, 36(2): 174-186. Rees, P. and Parsons, J. (2006) Socio-demographic scenarios for children to 2020. York: Joseph
Rowntree Foundation. Available at http://www.jrf.org.uk/bookshop/details.asp?pubID=809. Rees, P. and Wilson, A. (1977) Spatial Population Analysis. Edward Arnold, London. Rees, P. and Wohland, P. (2008). Estimates of ethnic mortality in the UK. Working Paper 08/04,
School of Geography, University of Leeds, Leeds, UK. Online at: http://www.geog.leeds.ac.uk/wpapers/08-4.pdf.
Rogers A. (1976) Shrinking large-scale population projection models by aggregation and decomposition. Environment and Planning A 8: 515–541.

25
Rogers, A. (1990) Requiem for the net migrant. Geographical Analysis 22, 283–300. Schuman, J. (1999) The ethnic minority populations of Great Britain – latest estimates. Population
Trends 96, 33-43. Simpson, L. (2007a) Population forecasts for Birmingham. CCSR Working Paper 2007-12, Cathie
Marsh Centre for Census and Survey Research, The University of Manchester, Manchester. Online at: http://www.ccsr.ac.uk/publications/working/2007-12.pdf.
Simpson, L. (2007b) Population forecasts for Birmingham, with an ethnic group dimension. CCSR Research Report, Cathie Marsh Centre for Census and Survey Research, The University of Manchester, Manchester. Online at: http://www.ccsr.ac.uk/research/documents/PopulationForecastsforBirminghamCCSRReport.pdf.
Simpson, L. (2007c) Population forecasts for Birmingham, with an ethnic group dimension. CCSR Technical Report, Cathie Marsh Centre for Census and Survey Research, The University of Manchester, Manchester. Online at: http://www.ccsr.ac.uk/research/documents/PopulationforecastsforBirminghamCCSRTech.pdf.
Simpson, L. and Gavalas, V. (2005a) Population forecasts for Oldham Borough, with an ethnic group dimension. CCSR Research Report, Cathie Marsh Centre for Census and Survey Research, The University of Manchester, Manchester. Retrieved 8 January 2008 from: http://www.ccsr.ac.uk/research/documents/PopulationForecastsforOldhamCCSRReportMay05.pdf
Simpson, L. and Gavalas, V. (2005b) Population forecasts for Rochdale Borough, with an ethnic group dimension. CCSR Research Report, Cathie Marsh Centre for Census and Survey Research, The University of Manchester, Manchester. Online at: http://www.ccsr.ac.uk/research/documents/PopulationForecastsforRochdaleCCSRReportMay05.pdf.
Simpson, L. and Gavalas, V. (2005c) Population forecasts for Oldham and Rochdale Boroughs, with an ethnic group dimension. CCSR Technical Report, Cathie Marsh Centre for Census and Survey Research, The University of Manchester, Manchester. Online at: http://www.ccsr.ac.uk/research/documents/PopulationforecastsforOldhamandRochdaleCCSRTechMay05.pdf.
Singh, G.K. and Siahpush, M. (2001) All-cause and cause-specific mortality of immigrants and native born in the United States. American Journal of Public Health, 91(3): 392-399.
Stillwell, J. and Hussain, S. (2008) Ethnic group migration within Britain during 2000-01: a district level analysis. Working Paper 08/2, School of Geography, University of Leeds, Leeds UK. Online at: http://www.geog.leeds.ac.uk/wpapers/08-02.pdf
Stillwell, J., Hussain, S. and Norman, P. (2008) The internal migration propensities and net migration patterns of ethnic groups in Britain. Migration Letters, 5(2) 135-150.
Storkey, M. (2002) Population Projections of Different Ethnic Groups in London, 1991 to 2011. PhD Thesis, University of Southampton. 261p.
Van Imhoff, E. & N. Keilman (1991) LIPRO 2.0: an application of a dynamic demographic projection model to household structure in the Netherlands. NIDI/CBGS Publications nr. 23, Amsterdam/Lisse: Swets & Zeitlinger. 245 p. Online at: http://www.nidi.knaw.nl/en/output/nidicbgs/nidicbgs-publ-23.pdf/nidicbgs-publ-23.pdf
Van Imhoff, E., van der Gaag, N., van Wissen, L. and Rees, P.H. (1997) The selection of internal migration models for European regions. International Journal of Population Geography, 3, 137-159.
Vickers, D., Rees, P. and Birkin, M. (2003) A new classification of UK local authorities using 2001 census key statistics. Working Paper 03/03, School of Geography, University of Leeds, Leeds, UK. Online at: http://www.geog.leeds.ac.uk/wpapers/03-3.pdf
White, I. and McLaren, E. (2009) The 2011 Census taking shape: the selection of topics and questions. Population Trends 135, 8-19. Retrieved 31 May 2009 from: http://www.statistics.gov.uk/downloads/theme_population/Population_trends_135.pdf
Wilson, T. (2001) A new subnational population projection model for the United Kingdom. PhD Thesis, University of Leeds.

26
Wilson T (2008) A multistate model for projecting regional populations by Indigenous status: an application to the Northern Territory, Australia. Forthcoming in Environment and Planning A.
Wilson, T. and Bell, M. (2004a) Australia's Uncertain Demographic Future. Demographic Research, 11 8: 195-234.
Wilson, T. and Bell, M. (2004b) Comparative empirical evaluations of internal migration models in subnational population projections. Journal of Population Research, 21 2: 127-160.
Wilson, T., Bell, M., Heyen, G. and Taylor, A. (2004) New Population Projections for Queensland and Statistical Divisions. People and Place, 12 1: 1-14.
Wilson, T. and Rees, P. (2003) Why Scotland needs more than just a new migration policy. Scottish Geographical Journal 119.3: 191-208.
Wilson, T. and Rees, P. (2005) Recent developments in population projection methodology: a review. Population, Space and Place, 11, 337-360.
Wohland, P. and Rees, P. (2009) Trends in local life expectancy in the UK: how have inequalities changed and what can we expect for the future? Paper in preparation, School of Geography, University of Leeds, Leeds, UK.

27
Table 1: Example of the variation in ethnic group classification by home country: ethnic groups in the 2001 Census of the UK
ENGLAND AND WALES SCOTLAND NORTHERN IRELAND
All Ethnic Groups All Ethnic Groups All Ethnic Groups White: British White White White: Irish Indian Irish Travellers
White: Other White Pakistani and other South Asians Mixed
Mixed: White and Black Caribbean Chinese Indian Mixed: White and Black African Others Pakistani Mixed: White and Asian Bangladeshi Mixed: Other Mixed Other Asians Asian or Asian British: Indian Black Caribbean Asian or Asian British: Pakistani Black African Asian or Asian British: Bangladeshi Other Black Asian or Asian British: Other Asian Chinese Black or Black British: Black Caribbean Others Black or Black British: Black African Black or Black British: Other Black Chinese or other ethnic group: Chinese Chinese or other ethnic group: Other Ethnic Group
Table 2: Example of harmonization of 1991 Census and 2001 Census ethnic groups for England 1991 census ethnic category
Component 2001 census ethnic categories
White White: British White: Irish White: Other 0.5*Mixed: White and Black Caribbean 0.5*Mixed: White and Black African 0.5*Mixed: White and Asian
Black Caribbean Black or Black British: Caribbean 0.5*Mixed: White and Black Caribbean
Black African Black or Black British: African 0.5*Mixed: White and Black African
Black Other Black or Black British: Other Indian Asian or Asian British: Indian
0.5*Mixed: White and Asian*Proportion Indian Pakistani Asian or Asian British: Pakistani
0.5*Mixed: White and Asian*Proportion Pakistani Bangladeshi Asian or Asian British: Bangladeshi
0.5*Mixed: White and Asian*Proportion Bangladeshi Chinese Chinese or Other: Chinese Other Asian Asian or Asian British: Other Other Groups Chinese or Other: Other
Mixed: Other Source: Rees and Butt (2004)

28
Table 3: Population Change of Regions by Race and Hispanic Origin: 1995 to 2025 (in millions) Region Total Non-Hispanic origin
Hispanic origin
White Black American Indian
Asian
U.S. 72.3 15.6 11.9 0.8 12.0 32.0 Northeast 5.9 2.1 1.5 0.03 2.3 4.2 Midwest 7.3 1.8 1.9 0.2 1.1 2.3 South 29.6 10.4 7.6 0.2 1.8 9.5 West 29.5 5.4 0.9 0.4 6.7 16.0 Source: U.S. Bureau of the Census, Population Division, PPL-47, Preferred Series, PPL-47, table 3. Source: Campbell (1996), Table F

29
Table 4: Summary of UK work on ethnic population estimates and projections
Source (Author, Year) Coverage Spatial unit(s) Ethnic groups (source) Time horizon Output Model
OPCS (1975) Great Britain Great Britain NCWP (1971 Census) 1966-1974 Estimates CCM
OPCS (1977a) Great Britain Great Britain NCWP (1971 Census) 1976-1986 Projections CCM
OPCS (1977b) Great Britain Great Britain NCWP (1971 Census) 1971-1986 Projections CCM
OPCS (1979) Great Britain Great Britain NCWP (1971 Census) 1976-1991-2001 Projections CCM
OPCS (1986a, 1986b) England and Wales England and Wales 5 groups (1981 Census) 1981, 1983, 1984 Estimates LFS
Schumann (1999) Great Britain Great Britain 11 groups (LFS) 1992-1997 Estimates LFS
Bradford (1999) Rochdale Rochdale Groups (1991 Census) 1999-2021 Projections POPGROUP
Bradford (2000) Bradford Bradford Groups (1991 Census) 1999-2021 Projections POPGROUP
London Research Centre (1999) Greater London London Boroughs 10 groups (1991 Census) 1991- Projections MRM-GL
Storkey (2002a) Greater London London Boroughs 10 groups (1991 Census) 1991- Projections MRM-GL
Hollis and Bains (2002) Greater London London Boroughs 10 groups (1991 Census) 1991- Projections MRM-GL
Coleman and Scherbov (2005), Coleman (2006b) United Kingdom United Kingdom 4 groups (2001 Census) 2001-2100 Projections CCM
Simpson and Gavalas (2005a), Simpson and Gavalas (2005c) Oldham Oldham 6 groups (2001 Census) 2001-2021 Projections POPGROUP
Simpson and Gavalas (2005b), Simpson and Gavalas (2005c) Rochdale Rochdale 6 groups (2001 Census) 2001-2021 Projections POPGROUP
Simpson and Gavalas (2005d), Simpson and Gavalas (2005e) Stoke Stoke 5 groups (2001 Census) 2001-2021 Projections POPGROUP
Bains and Klodawski (2006) Greater London London Boroughs 10 groups (2001 Census) 2001-2026 Projections MRM-GL
Large and Ghosh (2006a), Large and Ghosh (2006b) England Local authorities 16 groups (2001 Census) 2002-2005 Estimates CCM Rees and Parsons (2006), Rees (2006), Rees (2008), Parsons and Rees 2009 United Kingdom GORs, Wa, Sc and NI 5 groups (2001 Census) 2001, 2010, 2020 Projections SRM-R&F
Stillwell, Rees and Boden (2006) Yorkshire & The Humber Local authorities 5 groups (2001 Census) 2005-2030 Projections SRM-R&F
Simpson (2007a), Simpson (2007b) , Simpson (2007c) Birmingham Birmingham 8 groups (2001 Census) 2001-2026 Projections POPGROUP
Bains and Klodawski (2007) Greater London London Boroughs 10 groups (2001 Census) 2006-2026 Projections MRM-GLA
Danielis (2007) Leicester Leicester 8 groups (2001 Census) 2001-2026 Projections POPGROUP
Notes: GOR = Government Office Region, Wa = Wales, Sc = Scotland, NI = Northern Ireland, CCM = Cohort Component Model, POPGROUP= Single region projection software, licensed to users, MRM-GL = Multiregional Model-Greater London for projection SRM-R&F = Single Region Model, Rates & Flows (rates for out-migration and emigration, flows for in-migration and immigration)

30
Table 5: A population accounting framework for subnational populations using migration data from the UK census (transition data)
Survival in
DESTINATIONS England and Wales ScotlandNorthern Ireland
Rest of world Deaths Totals
Existence in:
City of London and
Westminster … CardiffStart
PopulationsORIGINS Zone names Zones 1 … 374 375 376 R DEngland and Wales
City of London and Westminster 1 SS 1,1 … MS 1,374 MS 1,375 MS 1,376 ES 1 D 1 SP 1
: : : … : : : : : :
Cardiff 374 MS 374,1 … SS 374,374 MS 374,375 MS 374,376 ES N374 D 374 SP 374
Scotland 375 MS 375,1 … MS 375,374 SS 375,375 MS 375,376 ES 375 D 1(3) SP 375
Northern Ireland 376 MS 376,1 … MS 376,374 MS 376,375 SS 376,376 ES 376 D 375 SP 376
Rest of world Immigrants R IS 1 … IS 374 IS 375 IS 376 0 0 IS *
Totals Populations * FP 1 FP 374 FP 375 FP 376 ES * D * T **

31
Table 6: The parameters for the linear regressions of SMR as a function of SIR
Females Males
Local area group n r2 A b r2 a b
Scatter plots in Figures 3(a) and 3(b)
England 352 0.51 52.1 0.48 0.63 47.3 0.52
Wales 22 0.78 60.5 0.37 0.56 54.9 0.39 Scotland 32 0.69 43.9 0.64 0.75 28.3 0.82 Northern Ireland 26 0.16 71.2 0.26 0.40 59.9 0.36
Scatter plots in Figures 3(c) and 3(d)
UK high ethnic minority 108 0.49 56.9 0.44 0.69 48.4 0.54
UK low ethnic minority 324 0.48 56.9 0.43 0.58 48.9 0.50
Source: Rees and Wohland (2008) Notes: 1. n = number of local areas, r2 = squared correlation, a = intercept, b = slope. 2. The equation was fitted to two different partitions of local authorities: (a) the regression coefficients were calculated for local authorities (LAs) for each home nation England, Wales, Scotland and Northern Ireland and by gender, females and males; (b) the regression coefficients were calculated for LAs and by gender with high ethnic minority/low ethnic minority LAs UK, where high ethnic minority means non white population is more than 8.2 % of the population, 107 of the 108 LAs are in England.

32
Rank Ethnic group Mean e0 Women Rank Ethnic group Mean e0
Men
1 Chinese 82.1 1 Chinese 78.12 Other Ethnic 81.5 2 Other White 76.93 Other White 81.3 3 Other Ethnic 76.24 White British 80.5 4 Black African 76.1
All groups 80.5 All group 76.0 5 Black African 80.4 5 White British 75.96 White Irish 80.3 6 Indian 75.57 White-Asian 80.0 7 Other Asian 75.28 Other Mixed 79.9 8 White-Asian 75.19 Other Asian 79.5 9 White-Irish 74.910 White-Black African 79.5 10 Other Mixed 74.611 Indian 79.3 11 Black Caribbean 74.412 Black Caribbean 79.1 12 White-Black African 74.213 White Black Caribbean 78.7 13 Other Black 73.414 Other Black 78.5 14 White-Black Caribbean 73.415 Bangladeshi 77.7 15 Pakistani 73.116 Pakistani 77.3 16 Bangladeshi 72.7
Source: Rees and Wohland (2008)
Table 7: The ranking of mean life expectancy for ethnic groups, men and women, England, 2001

33
Table 8: Total internal net migration for local authorities in England and Wales classified by a two tier typology, 2000-1
Source: Hussain and Stillwell (2008) from 2001 Census Commissioned Table CO711

34
Figure 1: The proposed 2011 Census questions on ethnicity and national identity

35
Figure 2: The SIR method for estimating ethnic mortality Source: Rees and Wohland (2008)
MORTALITY RATES
STANDARDISED MORTALITY RATIOS
POPULATION DATA
REGRESSION ANALYSIS
DEATHS DATA
2001 Vital statistics
Countries & Local Authorities
2001 Mid year Estimates
Countries & Local Authorities
SMR = f(SIR)
•All LAs in UK•LAs in E,W,S,N•‘Ethnic’ vs ‘Non‐Ethnic’
2001 , UK Standard
Countries & Local Authorities
2001, UK Standard
Countries & Local Authorities
STANDARDISED MORTALITY RATIOS BY ETHNICITY
2001, UK Standard
Countries & Local Authorities
LIFE TABLES & SURVIVORSHIP PROBABILITIES BY ETHNICITY
2001 (Calendar Year)
Countries & Local Authorities
RESIDENTS DATA
2001 Census Tables S16,S65
Countries & Local Authorities
LIMITING LONG TERM ILLNESS DATA
2001 Census Tables S16,S65
Countries & Local Authorities
STANDARDISED ILLNESS RATIOS
2001 , UK Standard
Countries & Local Authorities
STANDARDISED ILLNESS RATIOS BY ETHNICITY
2001, UK Standard
Countries & Local Authorities
RESIDENTS DATA BY ETHNICITY
2001 Census Tables ST 101, 107, 207, 318
Countries & Local Authorities
LIMITING LONG TERM ILLNESS BY ETHNICITY
2001 Census Tables ST 101, 107, 207, 318
Countries & Local Authorities
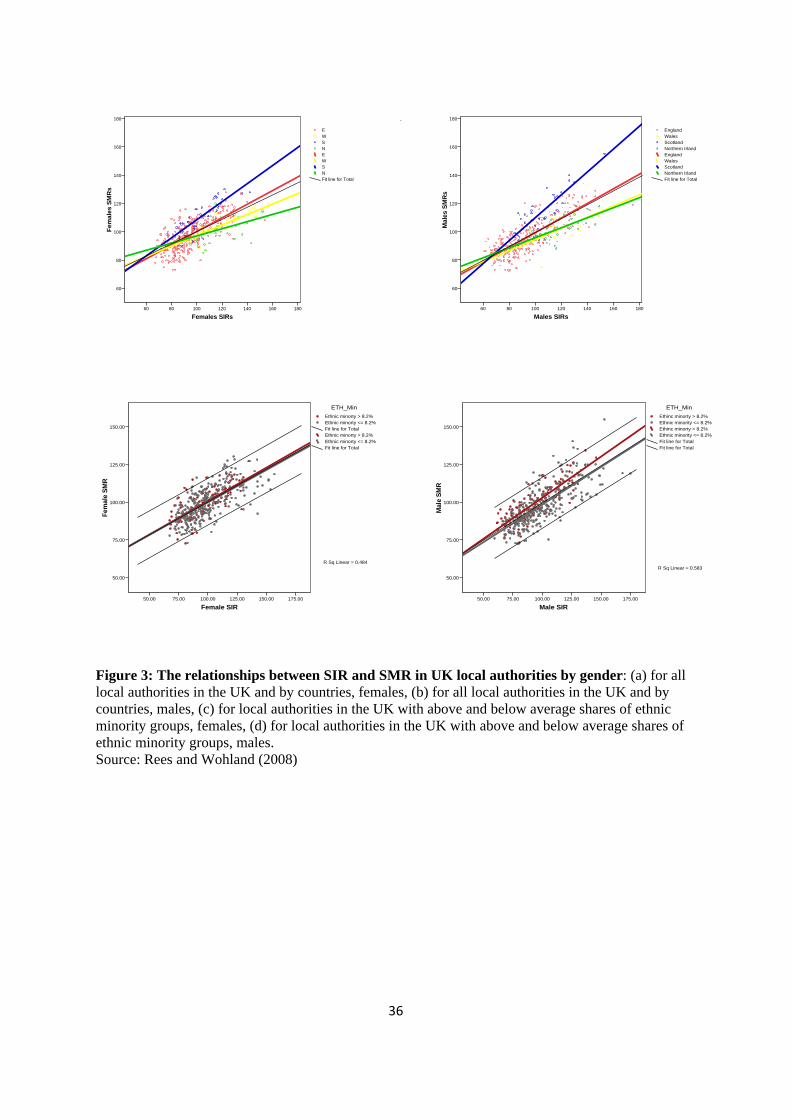
36
Figure 3: The relationships between SIR and SMR in UK local authorities by gender: (a) for all local authorities in the UK and by countries, females, (b) for all local authorities in the UK and by countries, males, (c) for local authorities in the UK with above and below average shares of ethnic minority groups, females, (d) for local authorities in the UK with above and below average shares of ethnic minority groups, males. Source: Rees and Wohland (2008)
Females SIRs1801601401201008060
Fem
ales
SM
Rs
180
160
140
120
100
80
60
Fit line for TotalNSWENSWE
Males SIRs1801601401201008060
Mal
es S
MR
s
180
160
140
120
100
80
60
Fit line for TotalNorthern IrlandScotlandWalesEnglandNorthern IrlandScotlandWalesEngland
Female SIR175.00150.00125.00100.0075.0050.00
Fem
ale
SMR
150.00
125.00
100.00
75.00
50.00
Fit line for TotalEthnic minorty <= 8.2%Ethnic minorty > 8.2%Fit line for TotalEthnic minorty <= 8.2%Ethnic minorty > 8.2%
ETH_Min
R Sq Linear = 0.484
Male SIR175.00150.00125.00100.0075.0050.00
Mal
e SM
R150.00
125.00
100.00
75.00
50.00
Fit line for TotalFit line for TotalEthnic minority <= 8.2%Ethinc minorty > 8.2%Ethnic minority <= 8.2%Ethinc minorty > 8.2%
ETH_Min
R Sq Linear = 0.583
d
b

37
Figure 4: The distribution of SIRs for local areas for ethnic groups, England, 2001 Notes: Grey bars = males, solid bars= females; horizontal axis = SIR (100=UK mean), vertical axis = number of local authorities. Source: Rees and Wohland (2008)
0 50 150 250
050
100
150 White British
Num
ber o
f LAs
0 50 150 250
050
100
150
97 (m)96 (f)
0 50 150 250
050
100
150 White Irish
0 50 150 250
050
100
150
109 (m)100 (f)
0 50 150 250
050
100
150 Other White
0 50 150 250
050
100
150
79 (m)83 (f)
0 50 150 250
050
100
150 White & Black Caribbe
0 50 150 250
050
100
150
135 (m)133 (f)
0 50 150 250
050
100
150 White & Black African
Num
ber o
f LAs
0 50 150 250
050
100
150
121 (m)117 (f)
0 50 150 250
050
100
150 White & Asian
0 50 150 250
050
100
150
108 (m)107 (f)
0 50 150 250
050
100
150 Other Mixed
0 50 150 250
050
100
150
115 (m)110 (f)
0 50 150 250
050
100
150 Indian
0 50 150 250
050
100
150
99 (m)122 (f)
0 50 150 250
050
100
150 Pakistani
Num
ber o
f LAs
0 50 150 250
050
100
150
133 (m)159 (f)
0 50 150 250
050
100
150 Bangladeshi
0 50 150 250
050
100
150
138 (m)152 (f)
0 50 150 250
050
100
150 Other Asian
0 50 150 250
050
100
150
105 (m)119 (f)
0 50 150 250
050
100
150 Black Caribbean
0 50 150 250
050
100
150
110 (m)122 (f)
0 50 150 250
050
100
150 Black African
SIR
Num
ber o
f LAs
0 50 150 250
050
100
150
83 (m)98 (f)
0 50 150 250
050
100
150 Other Black
SIR
0 50 150 250
050
100
150
129 (m)135 (f)
0 50 150 250
050
100
150 Chinese
SIR
0 50 150 250
050
100
150
60 (m)67 (f)
0 50 150 250
050
100
150 Other Ethnic Group
SIR
0 50 150 250
050
100
150
87 (m)80 (f)

38
White British White Irish White Other Mixed, White and Black
Caribbean
Mixed, White and Black African Mixed, White and Asian Mixed, Other Mixed Asian or Asian British: Indian
Asian or Asian British: Pakistani
Asian or Asian British: Bangladeshi
Asian or Asian British: Other Asian
Black or Black British: Caribbean
Black or Black British: African Black or Black British: Other Chinese Other Ethnic Group
Figure 5: Maps of life expectancy at birth, for 16 ethnic groups, England, females,2001
Source: Rees and Wohland (2008)
>= 81.17 to <85.86 >= 78.91 to <81.17 >= 73.77 to <78.91

39
Figure 6: Trends in life expectancy for UK local authorities by deprivation quintile, 1991-2007 Source: Computed from National Statistics mortality and population data for 1991-2007 by Wohland and Rees (2009). Deprivation scores were provided by Norman and are computed using four 1991 Census variables and index formula proposed by Townsend Source: Rees and Wohland (2009)
1995 2000 2005
7580
85Townsend deprivation quintiles
Life
exp
ecta
ncy
at b
irth,
UK
T 1 (least deprived)T 2T 3T 4T 5 (most deprived)

40
Figure 7: Life expectancy trends for UK local authorities classified by group Source: Computed from National Statistics mortality and population data for 1991-2007 by Wohland and Rees (2009). The local authority classification was developed by Vickers et al. (2003).
1995 2000 2005
7274
7678
8082
Life
exp
ecta
ncy
at b
irth,
men
, UK
Industrial Legacy Established Urban Centres Young & Vibrant CitiesRural Britain Coastal Britain Averageville
Prosperous Urbanites Commuter Belt Multicultural Outer London Mercantile Inner London Cosmopolitan Inner London Northern Irish Heartlands
1995 2000 2005
7880
8284
8688
Life
exp
ecta
ncy
at b
irth,
wom
en, U
K
Industrial Legacy Established Urban Centres Young & Vibrant CitiesRural Britain Coastal Britain Averageville
Prosperous Urbanites Commuter Belt Multicultural Outer London Mercantile Inner London Cosmopolitan Inner London Northern Irish Heartlands
Male life expectancies Female life expectancies

41
Figure 8: Illustration of the New Migrant Databank for estimating immigration to UK local areas

42

43
Figure 9: The classes of local authority districts in England and Wales Source: Map from Hussein and Stillwell (2008), Classes from Vickers et al. 2003

44
Figure 10: Age-specific migration rates by ethnic group, England and Wales, 2000-01 Source: Stillwell et al. (2008), Figure 2 from 2001 Census, Commissioned Table CO7011.