Embed Size (px)
Citation preview

Ethiopia
Bellmon Analysis 2015/16
And
Reassessment Of
Crop Production and Marketing For
2014/15 October 2015 Final Report

Ethiopia: Bellmon Analysis - 2014/15 i
Table of Contents Acknowledgements ................................................................................................................................................ iii Table of Acronyms ................................................................................................................................................. iii Executive Summary ............................................................................................................................................... iv Introduction ................................................................................................................................................................ 9
Methodology .................................................................................................................................................. 10 Economic Background ......................................................................................................................................... 11
Poverty ............................................................................................................................................................. 14 Wage Labor ..................................................................................................................................................... 15
Agriculture Sector Overview ............................................................................................................................. 16 Agricultural inputs ...................................................................................................................................... 16 Livestock .......................................................................................................................................................... 19 Crop Marketing ............................................................................................................................................. 20
Government Policies affecting The Agricultural sector ......................................................................... 22 Intensification ................................................................................................................................................ 22 Price Controls ................................................................................................................................................ 22 Strategic Food Reserve .............................................................................................................................. 23
Food Supply in 2014/15 ..................................................................................................................................... 25 Carryover stocks........................................................................................................................................... 25 Meher Production 2014/15 ..................................................................................................................... 25 Belg Production 2015 ................................................................................................................................. 30
Market Trends......................................................................................................................................................... 33 Cereals .............................................................................................................................................................. 33 Pulses ................................................................................................................................................................ 39 Oilseeds/Edible Oils .................................................................................................................................... 40 Factors affecting Grain Supply ................................................................................................................ 43 Deficit Market Conditions ......................................................................................................................... 44
Food Security ........................................................................................................................................................... 53 Wage Labor ..................................................................................................................................................... 54 Consumption .................................................................................................................................................. 56
Impact of PSNP Interventions .......................................................................................................................... 60

Ethiopia: Bellmon Analysis - 2014/15 ii
Self-Monetization ......................................................................................................................................... 62 Food/Cash Preferences ............................................................................................................................. 66
Logistics of Food Aid Distribution .................................................................................................................. 68 Port Capacity .................................................................................................................................................. 68 Transport ......................................................................................................................................................... 69 Storage .............................................................................................................................................................. 71
Bellmon Considerations ...................................................................................................................................... 72 Annex A: Study Areas ........................................................................................................................................... 75 Annex B: Questionnaires .................................................................................................................................... 84

Ethiopia: Bellmon Analysis - 2014/15 iii
Acknowledgements The author would like to acknowledge the kind assistance of the Disaster Risk Management and Food Security Sector in facilitating this exercise. The staff of Save The Children, Relief Society of Tigray, Food for the Hungry, and the Catholic Relief Services also provided essential information and the benefit of their experience. This report would not have been possible without the considerable efforts made by the Agridev Consult survey team to collect the Rapid Rural Appraisal data from remote woredas. The results themselves reflect the patience of farmers and traders as well as other interviewees who kindly accepted to provide their time and to share the experiences that this report attempts to reflect.
Table of Acronyms AGP Agricultural Growth Programme AISCO Agricultural Input Supply Company CPI Consumer Price Index CSA Central Statistical Agency DA Development Agent DRMFSS Disaster Risk Management and Food Security Sector ECX Ethiopian Commodity Exchange EFSR Emergency Food Security Reserve EGTE Ethiopian Grain Trade Enterprise ETB Ethiopian Birr FGD Focus Group Discussion FY Financial Year FSCD Food Security Coordination Directorate GoE Government of Ethiopia HICE Household Income Consumption and Expenditure Km Kilometer MEWIT Merchandise Wholesale and Import Trading Enterprise MOARD Ministry of Agriculture and Rural Development MT Metric Tonne NMA National Meteorological Agency PSNP Productive Safety Net Programme Qt Quintal RRA Rapid Rural Appraisal SFR Strategic Food Reserve SNNPR Southern Nations Nationalities and Peoples Region USAID United States Agency for International Development WFP World Food Programme

Ethiopia: Bellmon Analysis - 2014/15 iv
Executive Summary Objective. This study provides the information necessary for USAID to make an accurate Bellmon determination for an anticipated volume of 100,000 MT of Title II grains (wheat and pulses) for distribution through the Productive Safety Net Programme (PSNP). In order to do so, it describes relevant developments in the Ethiopian economy and provides an overview of the agricultural sector, including both production and marketing. It provides an overview of government policies affecting food security before assessing current levels of food availability as determined by the last Meher season (2014/15), the recent Belg season together with carryover stocks and food imports. It also considers the state of Ethiopian grain markets and recent price trends, with particular reference to price movements and market capacity in deficit areas. Current and anticipated levels of food security are assessed as well as the impacts of PSNP transfers of food and/or cash. Beneficiary preferences as to cash or food are discussed and recommendations made to mitigate the price risk associated with cash transfers. The port, transport and storage capacity available for the importation of the anticipated volumes of Title II commodities is assessed against requirements. In the light of all of the above, recommendations are made to facilitate the final Bellmon determination for FY 2015/16. Methodology. The methodology adopted for this analysis has been a combination of both primary and secondary data collection. Primary data has been collected from smallholders and traders in both PSNP and non-PSNP woredas using the Rapid Rural Appraisal (RRA) methodology. Non–PSNP woredas were selected on the basis of their per capita productivity. Altogether 80 woredas were visited, of which 50 were PSNP and 30 were non-PSNP. Focus group discussions of between 7 and 10 smallholders were held and traders were interviewed in each woreda. Both focus group discussions and trader and cooperative interviews were guided by questionnaires covering the key aspects required by the Bellmon analysis. The assessment included –interviews with key stakeholders including oil processors, pulse and grain merchants, the management of the Ethiopian Grain Trade Enterprise, Merchandise Wholesale and Import Trading Enterprise, Disaster Risk Management and Food Security Sector, Addis Ababa Chamber of Commerce, and the four FFP partners implementing development food assistance programs (DFAPs) that parallel the PSNP: Relief Society of Tigray, Save the Children, Food for the Hungry, and Catholic Relief Services. Secondary data has been gathered from a number of sources including the market information system of the Ethiopian Grain Trade Enterprise, National Customs statistics on imports and exports, WFP bulk shipping data, National Meteorological Agency rainfall data and reports as well as bulletins of the Central Statistical Agency. Findings. The Ethiopian economy continues to demonstrate rapid growth, based mainly upon an agricultural sector that is currently contributing an increasing proportion (48.6%) of GDP. National Bank of Ethiopia statistics indicate that industry and manufacturing have not increased their shares of GDP as planned under the Growth and Transformation Plan. The assessment of GDP growth is thus strongly dependent upon the accurate estimation of agricultural productivity. Annual inflation, which reached levels of 40% in 2008 and resurfaced again in 2011, has now been reduced to 10% or less. Most of the residual inflation over the last 12 months has been non-food related, but recent increases in cereal prices may alter this balance. The value of imports continues to exceed that of exports leading to a substantial balance of payments deficit

Ethiopia: Bellmon Analysis - 2014/15 v
that is largely mitigated by secondary income receipts. The rate of exchange for the Ethiopian Birr is controlled by the National Bank and has not kept pace with the growing deficit so that demand for forex exceeds supply, causing distortions in export markets and limiting the private sector’s capacity to import. Economic growth has nevertheless contributed to a reduction of poverty levels between 2004/05 and 2010/11 to 29.6%, although despite the increase in food production, rural food poverty fell by only three percentage points to 34.7%. This figure is substantially larger than the proportion of the rural population receiving assistance under the PSNP, which at approximately 5.2 million people is less than 6% of the population, i.e. two thirds of the rural poor are without programmed assistance. Given the limited capacity of as many as 60% of households to achieve food security from their own production, wage labor is critically important to the food security of many households. Labor rates are determined not by the cost of living but by demand and supply. The latter can be inversely related to levels of food production, so that in a good year, there is less pressure to undertake wage work, the supply of labor falls and wage rates increase accordingly. Key government policies affecting national food security include a strong drive to intensify production through increased technical assistance and use of improved inputs. This has been at least partially successful. Other policies include price controls imposed upon bread and edible oil in order that they might be accessible to the most vulnerable households. To stabilize prices, the government is in process of importing 400,000 MT of wheat and 435,000 MT of palm oil for distribution and sale at fixed prices. The government has also set up a new food security reserve that is intended to replace the old Ethiopian strategic food reserve, and is possibly to be as large as three million MT. Such a reserve would almost certainly affect the market if only through the rotation of its stocks, although as yet, there is no firm decision regarding its size or modus operandi. Cereal production in 2014/15 was estimated to have been marginally higher than in the previous year, especially for maize and sorghum. Wheat and teff production was similar to that of 2013/14. The difference was most pronounced in productive woredas. Carryover stocks from 2013/14 were also high. As a result, food has been more available in 2014/15 than in previous years. This study estimated that 16.1 million MT of cereals would be available from all sources for domestic consumption. The total would have been higher but early failure of rains in the recent Belg season resulted in a decline of approximately one third in cereal production, with maize hardest hit. Pulse and oilseed production were both substantially reduced, almost entirely as a result of reduced areas planted to these crops. Levels of cereal availability, especially maize and sorghum, have been high through the early part of 2014/15 in both surplus and deficit areas, but declined gradually in the deficit areas and appear to have declined markedly in all areas by May or June. Availability of pulses and edible oil seeds has been low throughout the season. These levels have had an impact on price movements. Market conditions for cereals have varied considerably and the main cereal crops exhibit different market trends. Sorghum has declined in price suggesting that production has increased relative to demand. By contrast, wheat prices have increased, suggesting the converse. Teff prices have remained approximately stable, although individual markets show different price

Ethiopia: Bellmon Analysis - 2014/15 vi
trends. Maize prices have generally declined through the first part of the season, but have increased sharply over the course of the last two months. It is the sharp increase in the price of maize that will most affect cereal supplies to the most vulnerable areas. Teff and wheat are not much consumed by the poorer households. Maize and sorghum are the cheaper and dominant staples. It would appear that last year’s harvest has now been effectively exhausted and/or that households are increasingly holding on to their own stocks so that the supply of local grain to deficit markets has dropped sharply. Prices in deficit areas have immediately increased enough to impact the prices in surplus markets. Significantly however, the price of maize in surplus markets has also risen rapidly, suggesting that there too, the rate of inflow has now decreased. As a result of these increases, cereal prices reached the same levels by June 2015 as they had been 12 months previously. The outlook in the near term is that maize prices will likely increase further until the first green maize comes onto the market in September. At that point, the behaviour of the market will depend upon the Meher production. It is possible that the increased maize price will create upward pressure on the prices of all other cereals, but the extent of this effect cannot be predicted. Assessment of conditions in deficit markets (where for some part of the year food has to be purchased from retail markets supplied via a chain of traders from surplus areas) confirmed that staple cereals could be obtained in almost all markets. Traders indicated that some markets did not justify commercial sales, often because they were too small, or because neighbouring markets could be serviced more profitably. Overall, there were no strong reasons to suppose that cereals could not be accessed from any area in the country. The accessibility of pulses was higher than that of maize, due to the fact that pulse production was not concentrated in specific areas to the same extent as cereal production. The availability of edible oil was more variable with some areas being unable to access this commodity. This appeared to be due to the uneven distribution of this (controlled) commodity. Price fluctuations in deficit markets were quantified. Differences in price between conditions of local surplus, (where food could generally be purchased from neighboring farmers) to those of deficit were found to be substantial and in particular much greater than the differences observed in wholesale prices alone. Transaction costs under deficit conditions (without factoring in traders’ profits) include the costs of assessing, weighing, bagging and loading at small markets, transport costs to the trader’s store, offloading, cleaning and rebagging, loading and transport to the point of sale to a retail outlet, offloading and broker’s fee, and in some cases, transport to the retail outlet itself. Under surplus conditions, where deficit households are able purchase their grain directly from neighboring farmers, transaction costs can be reduced to those associated with assessing, weighing and bagging only. Food security levels were reported to have increased across most parts of the country, although decreases were reported in a limited number of deficit areas. The increase was due, as might be expected to both increased production and increased carryover stocks. In some instances, increased food security was also reported to be due to higher wage rates. Wage rates have increased by between 16% and 40%, and 25% on average over the last 12 months. It is possible that the increase, which exceeds the rate of inflation, may be due to the reduced availability of manpower caused by increased crop production and consequent reduced pressure on vulnerable households to earn additional income. This requires further investigation.

Ethiopia: Bellmon Analysis - 2014/15 vii
Impacts of PSNP cash and food transfers were assessed and found to be of the order of 10% increases/decreases in price as a result of cash and food transfers, respectively. Such impacts generally lasted for two-four weeks. Traders reported that overall the PSNP was beneficial to business and that food transfers enhanced the stability of the market. There were no strong disincentive impacts of food aid. Traders also reported a reluctance to preposition stocks to increase sales in the event of cash transfers1. In many cases, the additional demand that would be created by a shift from food to cash transfers was not enough to justify such a proactive response. In other cases, traders reported that they considered stocking up socially unacceptable as it was seen as taking advantage of the situation. Levels of self-monetization were assessed and although the practice was found to be widespread, the amounts sold by smallholders were small. Wheat was the commodity most frequently sold. Recognising that under PSNPIV, there will be a possibility to include food insecure households in productive woredas as PSNP beneficiaries; preferences amongst vulnerable households for cash or food transfers were assessed in both PSNP and non-PSNP woredas. A general preference was expressed for food; this was mainly in PSNP woredas. In non-PSNP woredas, cash was generally considered acceptable. The primary reason given in PSNP woredas for the preference for food was that the cash that was provided was not enough to meet the food needs. A risk premium of 25% is recommended to cover unexpected increases in price. Limitations in the targeting process and the “broad-brush” nature of the transfer process (which provides a similar package of benefits to households of varying degrees of food insecurity) prevented the precise matching of transfers to beneficiary needs and that as a consequence, the precise matching of the cash transfer to allow for the impacts of price fluctuation would never be achieved. Logistical capacity, including Djibouti port, domestic transport and storage capacity was assessed from secondary data and found to be adequate to allow for the importation of 100,000 MT of Title II commodities without loss. This assessment was independent of additional requirements that might occur during an emergency. Nevertheless in the event of an emergency, it is probable that more FFP implementing partners would be involved than the four current development partners , so that storage capacity would be much greater. As a result of the assessment it was observed that since domestic wheat prices are effectively twice those of the international market and significantly above import parity, there would be little disincentive to production or marketing from the importation of Title II wheat for distribution. A similar situation exists, given the substantial increases in the prices of pulses, for Title II pulses (split peas). Reported impacts of cash transfers, suggest only limited and temporary impacts that were not sufficient to change traders’ buying or stocking habits. This study was specifically requested to assess market conditions in food deficit woredas in the most remote areas; even there, it was found that market conditions were generally acceptable to allow for the replacement of food by cash in all woredas assessed. This would suggest that the substitution of food by cash of an equivalent value is feasible (provided that value can be properly maintained). Nevertheless, given the anticipated availability of food and cash2, that
1 This finding is consistent with the BEST study conducted in 2013. 2 A budget of approximately 100,000 MT of grain is anticipated, of which up to 35% might be provided as cash.
Ethiopia: Bellmon Analysis - 2014/15 viii
would limit the amount of cash available, the transfer of two months of cash followed by four months of food is a practicable alternative that can be recommended. It was observed that overall, in the light of current market conditions, reported market impacts and the clear responses of traders, there is no evidence that either Title II commodity transfers or cash transfers would have a substantial deleterious effect upon production or marketing. Additionally, there appears to be adequate capacity for importation, domestic transport and storage, to prevent the loss or spoilage of Title II commodities. Therefore, this assessment concluded there appear to be no major Bellmon concerns which should preclude USAID/Ethiopia from being able to make a positive Bellmon determination for FY 2015/16.

9
Introduction USAID Ethiopia has provided Title II assistance to beneficiaries through a number of different programs over the last thirty years, but most recently, Title II food has been used to support a USAID initiative that parallels the Government of Ethiopia’s (GoE) Productive Safety Net Programme (PSNP), that has been implemented since 2005. USAID Ethiopia has supplied cereals (wheat), pulses (lentils and split peas), and edible oil (vitamin A-fortified soybean oil), to targeted vulnerable households in selected woredas on a predictable basis of six transfers annually. Transfers have either been made directly (to elderly, disabled or orphaned households), or on a conditional basis, most commonly food for work. These predictable transfers have been effective in enhancing food security (by approximately 1.5 months per household each year), and especially in preventing the sale of assets that might otherwise be disposed of to secure food. Such asset protection is intended to interrupt the spiral of chronic impoverishment, allowing those who have become food insecure as a result of shock to take advantage of improved circumstances as soon as these become available, rather than being obliged to rebuild their productive capacity. In making these transfers, USAID programs, have closely paralleled the activities of the GoE PSNP, which follows the same six-transfer protocol also using both direct and conditional mechanisms. Indeed, USAID programs are implemented by FFP implementing partners in conjunction with woreda and Kabele authorities who ensure that GoE procedures are followed and that PSNP objectives are met. Nevertheless, there have been some differences between the GoE PSNP and USAID parallel activities. The standard monthly ration provided by USAID has in the past consisted of 15kg of cereals, 1.5 kg of pulses and 0.5 litre of edible oil. The GoE PSNP has generally omitted edible oil pulses, supplying only 15 kg of cereals per beneficiary per month (over six months). The second major difference has been in the much greater use of cash transfers by the GoE, who as early as 2004 indicated their wish to move to a cash based safety net, a desire that as initially frustrated by intermittent high levels of food inflation, but which has increasingly been realised over the last three years. By contrast, USAID Ethiopia has focused almost exclusively on food throughout the first ten years of the safety net. Recently however, the possibility of introducing a cash component to the USAID transfer package is under consideration for cash transfers of approximately one third of the value of the total annual package. For 2015, both GoE and USAID rations have been modified to increase the pulse component on the one hand and (in the case of USAID-funded woredas) to drop the inclusion of edible oil. Both programs will now share a single standard ration of 15kg cereals and 4 kg pulses. The volume of Title II commodities for distribution in FY 2016 is expected to be similar to that approved for the previous year, i.e., 95,500 MT. It is against this background that the 2015/16 Bellmon analysis has been undertaken. A Bellmon analysis is required to consider: 1. The adequacy of storage facilities available in the recipient country at the time of the arrival of the commodity. 2. The extent to which the distribution of the commodity in the recipient country might create disincentive to or interference with domestic production or marketing in that country. 3. The extent to which the use of local currencies for development purposes might have a disruptive impact on the farmers or the local economy of the recipient country. This study addresses the three criteria listed above by considering the following:

10
1. Economic background, including Ethiopia’s current economic performance, including recent growth rates, income levels and poverty trends.
2. An overview of the agricultural sector, its main characteristics and international linkages. 3. A description of government policy vis a vis the agricultural sector and food security, including
the input of the donor community. 4. An assessment of current levels of production of the staple Ethiopian foodstuffs (cereals, pulses,
oilseeds, and vegetables/root crops). 5. A review of recent market developments and operations for the same commodities, with
particular reference to markets in deficit areas. 6. The nature and extent of households’ food security now and the potential near term impacts of
the withdrawal of food-based assistance from Title II-supported PNSP woredas 7. The potential extent of inflation in local markets should Title II programs shift to 100 percent
cash in current Title II-supported highland regions/woredas 8. The availability of the port, inland transport, and storage capacity necessary to support the
effective importation and distribution of Title II food-based assistance in Ethiopia. A discussion of the results presented in each of the areas described above generates conclusions and recommendations for the Bellmon Determination for FY2015/16.
Methodology The methodology adopted for this analysis has been a combination of both primary and secondary data collection. Primary data has been collected from smallholders and traders in both PSNP and non-PSNP woredas using the Rapid Rural Appraisal (RRA) methodology. Non–PSNP woredas were selected on the basis of their per capita productivity (as calculated from CSA production and woreda population data), with preference being given to the most productive areas. Altogether 80 woredas were visited, of which 50 were PSNP and 30 were non-PSNP. Two focus group discussions of between 7 and 10 smallholders were held and three traders were interviewed in each woreda. In addition 20 cooperatives were also visited to determine their perspective of the market. The kabeles, woredas and cooperative visited are listed in Annex A together with the PSNP status of the woredas. Both focus group discussions and trader and cooperative interviews were guided by a questionnaire covering the key aspects required by the Bellmon analysis. Questionnaires are provided in Annex B. In addition to the RRA, this Bellmon analysis interviewed key stakeholders including oil processors, pulse and grain merchants, the management of the Ethiopian Grain Trade Enterprise (EGTE), Merchandise Wholesale and Import Trading Enterprise (MEWIT), Disaster Risk Management and Food Security Sector, Addis Ababa Chamber of Commerce, and the four FFP implemenating partners implementing DFAPs that parallel the PSNP: Relief Society of Tigray (REST), Save the Children, Food for the Hungry, and Catholic Relief Services (CRS). Secondary data has been gathered from a number of sources including the market information system of the Ethiopian Grain Trade Enterprise (EGTE), National Customs statistics on imports and exports, WFP bulk shipping data, National Meteorological Agency (NMA) rainfall data and reports as well as the Central Statistical Agency (CSA) bulletins. In addition, this work builds upon data collected from an earlier market assessment conducted in October 2014, which undertook a preliminary review of production and food security prospects, modifying it as necessary in the light of experience.

11
Economic Background Ethiopia is the tenth largest country in Africa and supports a population of approximately 97 million (i.e., the second largest on the continent), which increases by 2.5% annually. Only 16% of the population is urbanised and the remainder derive their living either directly or indirectly from agriculture. Since 2005, Ethiopia has reported rapid economic growth averaging close to 10% (Table 1) Table 1: Growth in Ethiopian GDP
2005 2006 2007 2008 2009 2010 2011 2012 2013 2014
GDP (US$ Billion) 12.4 15.3 19.7 27.1 32.4 29.9 32.0 43.3 47.5 51.3 Growth 11.8 10.8 11.5 10.8 8.8 12.6 11.2 8.6 10.5 8 Population (million) 76.2 78.3 80.4 82.6 84.9 87.1 89.4 91.7 94.1 96.6 GDP per Capita (US$) 162.8 195.2 245 327.6 382.3 343.7 357.4 472.2 505 531 GDP per Capita PPP (US$) 657 730 813 894 955 1060 1171 1262 1380 1453
Source: World Bank Development Indicators. Reported per capita income by 2014 had risen to US$ 531 at official rates and US$ 1453 at PPP rates. The GINI coefficient has remained low at 29.8, although there is some evidence that it is now increasing especially in rural areas. Figure 1: Components of Ethiopia’s GDP
Source: National Bank of Ethiopia Annual reports Despite an optimistic development plan (The Growth and Transformation Plan), which envisaged rapid growth between 2009/10 and 2014/15 in the industrial and manufacturing sectors of 20% and 11% respectively, Ethiopia has remained heavily dependent upon agriculture, which currently contributes 48.6% of GDP (Figure 1) and underpins the livelihoods of 84% of the population. Estimates of GDP and GDP growth are therefore closely related to agricultural production and depend upon the crop production estimates prepared annually by the Central Statistical Agency. Initial growth from 2005 was stimulated by government spending and the expansion of the money supply. An excess of broad money from 2006 contributed to high levels of inflation in 2008 and 2010/11, (Figure 2) but this has been effectively managed downward through different instruments to achieve a relatively soft landing so that inflation in 2015 has been running at approximately 10%. This was dominated by non-food inflation until the beginning of 2015, at which point non-cereal food inflation
0
10
20
30
40
50
Perc
ent
Agriculture
Industry
Services

12
began to increase. EGTE prices indicate that significant cereal price inflation has also occurred in the last two months will almost certainly impact the general CPI significantly. Figure 2: Components of Inflation
Source: Calculated from CSA monthly national CPI data. The financial sector includes both public and private banks and more than 20 microfinance institutions, but is dominated by government controlled institutions which effectively determine the current deposit and lending rates at 5% and 11 % respectively. These rates are quite constant and effectively independent of supply and demand. Similarly, the exchange rate (currently ETB20.6: US$1.0 in June 2015) is fixed by the National Bank of Ethiopia and has been subject to a steady decline at a constant rate of ETB0.07: US$1.00 per month for the last 50 months. The controlled nature of the banking and foreign exchange systems creates markets for domestic and foreign currency that are based not upon supply and demand, but upon the controlled allocation of resources. This has resulted in the market distortions that generally result from such situations including a parallel market for foreign exchange and the allocation of finance to projects independent of their financial viability. In this case, the main borrower of domestic finance has been the GoE itself, which continues to be engaged in a substantial construction program including roads, railways, dry ports, dams, and electrical reticulation. The private sector frequently complains that it is starved of credit and that the allocation of whatever credit is available is an opaque process. The country runs a substantial trade deficit. Exports have increased significantly, but continue to be dwarfed by accelerating imports (Figure 3). Figure 3: Trends in the value of imports and exports3
3 GoE imports in 2013 and 2014 include aircraft/parts from the US to the value of $52 million and $298 million respectively.
-12.5-6.25
06.2512.5
18.7525
31.2537.5
43.7550
56.2562.5
68.75
Jun-05 Aug-06 Oct-07 Dec-08 Feb-10 Apr-11 Jun-12 Aug-13 Oct-14
Per
cent
age
Cha
nge
in A
nnua
l Inf
latio
n NonFoodOther FoodCereals

13
Source: Ethiopian Revenues and Customs Authority4 Overseas borrowings and foreign direct investment remain comparatively small, (although the rapid uptake of recently floated GoE bonds suggests that the country risk associated with Ethiopia may be declining) and the substantial imbalance in the balance of payments deficit is made up by secondary income receipts, mainly donor funds5, (Figure 4). Figure 4: Recent trends in Balance of Payments
Source: World Bank Development Indicators Nevertheless, the controlled depreciation of the Birr has still lagged behind its real value so that foreign exchange commands a premium on the parallel market. Limitations on the volume of foreign exchange that is available generally oblige importers to wait for two to three months to obtain the necessary funds to conduct their transactions. This has hindered the growth of exports to some extent but has more clearly distorted export prices, which are frequently bid to unprofitable levels on the Ethiopian Commodity Exchange by traders seeking to profit from franco-valuta imports6. 4 Available at: http://www.erca.gov.et/index.php/import-export-information 5 Secondary income receipts are transfers recorded in the balance of payments whenever an economy provides or receives goods, services, income, or financial items without a quid pro quo. 6 Franco valuta imports are those made using foreign exchange not sourced from the domestic banking system (therefore commonly earned from exports)
-16000
-14000
-12000
-10000
-8000
-6000
-4000
-2000
0
2000
4000
2005 2006 2007 2008 2009 2010 2011 2012 2013 2014
Curr
ent U
S$ m
illio
ns
Exports
Imports
GoE
-10
-8
-6
-4
-2
0
2
4
6
2005 2006 2007 2008 2009 2010 2011 2012
Curr
ent U
S$ B
illio
ns
Current accountbalance
Net trade in goodsand services
Secondary incomereceipts
14
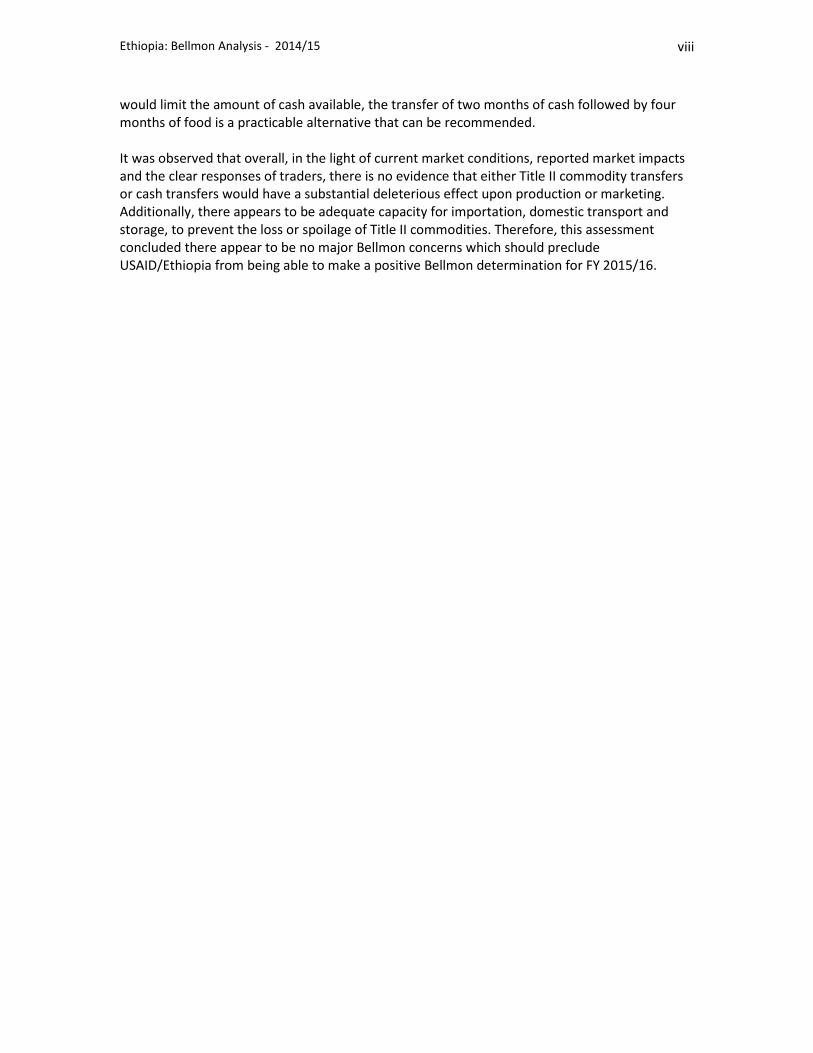
While rapid economic growth was reported until 2010, estimates of GDP growth since that time have tended to decline. This has been despite apparent further increases in agricultural production and exports. Recent constraints to growth included the restricted volume of foreign direct investment (FDI), which has not been well encouraged by policies in the past, although the last two years have witnessed considerable growth in this area (Figure 5). Nevertheless, as a percentage of GDP, FDI remains close to 2% as compared with 4% for the rest of Sub-Saharan Africa. Figure 5: Recent trends in Foreign Direct Investment
Source: World Bank Development Indicators The economy has also suffered from slow growth in domestic revenue collection, targeted under the GTP to reach 15% of GDP, although in practice it remains at 12.5%, the fifth lowest in Africa. This may reflect an optimistic assessment of GDP, a limited infrastructure for revenue collection, or an entrenched reluctance on the part of the private sector to pay tax.
Poverty There have been no poverty analyses undertaken in the last three years. A poverty analysis based upon the 2010/11 Household Income, Consumption and Expenditure (HICE) Survey reported a reduction in the national proportion of people below the poverty line from 38.7% in 2004/05 to 29.6% in 2010/11, and a reduction in the poverty gap from .083 to .078, although the same survey reported an increase in the severity of poverty indices from .027 to .031. These indices varied between urban and rural areas, with urban areas reporting lower rates of poverty across all indices, but the overall trend of reduced poverty headcount and increased poverty severity was consistent in all cases. The same survey assessed the GINI coefficient in 2005/05 and 2010/11 and reported that while in rural areas, the coefficient had increased marginally from .26 to. 274; it had declined in urban areas from .44 to .371. Nationally, it had decreased marginally from .30 to .298. In practice, despite the reduction in poverty, levels of inequality had not changed significantly. In terms of food poverty (i.e. the capacity to purchase a food to supply 2.200 kcalories per day), the HICE data reports a decline from 38% in 2004/05 to 33.6% in 2010/11. Disaggregated between rural and urban areas, the data shows that rural food poverty fell from 38.5% to 34.7% (higher than the total rural poverty headcount of 30.4%) while urban food poverty fell from 35.3% to 27.9% (also higher than the total urban poverty headcount of 25.7%). The food poverty gap fell from .12 in 2004/05 to .105 in 2010/11 and food poverty severity from .049 to .046. In all cases, the results are higher than the total poverty indices suggesting somewhat anomalously that more households are unable to meet their basic food needs than are able to meet their total needs.
00.20.40.60.8
11.21.4
Curr
ent U
S$ B
illio
ns

15
Moreover, despite the 77% increase in the production of cereals between 2004/05 and 2010/11 reported by CSA, the level of rural food poverty has fallen by only 3.8 percentage points, or 10% overall. A more recent survey undertaken by IFPRI as the baseline for FTF impact assessment in 2012 reported a 40.6% poverty headcount overall (34.9% in FTF woredas and 48.8% in non-FTF woredas). The difference between this result and that of the CSA can be partly explained by the use of a slightly higher poverty threshold, but it would appear that there can be considerable variation between different areas that has yet to be fully explained. Although the food poverty head count index would suggest that as many as 34.7% of rural households were able to meet their food needs in 2010/11, the national Productive Safety Net Programme (PSNP) included only 7.8 million beneficiaries at that time, i.e. out of an estimated 23.3 million people, only 35% were provided with assistance to improve food security. In 2014, this proportion was estimated to be 45%, but still 55% of households experiencing some degree of food insecurity were not provided with any assistance. The main reason for this limited assistance has been the geographical approach to the targeting of beneficiaries which has excluded households in the more productive woredas, despite that fact that these areas still contain significant number of poor, food insecure households. The latest iteration of the PSNP (PSNP4) has been designed to address this deficiency by gradually increasing the program’s scope to include food insecure households in all woredas.
Wage Labor While it is frequently stated 7that the majority of the rural populations of sub-Saharan Africa are self-employed in the management of their smallholdings, this is not the case in Ethiopia. Wage labor has been identified as a key contributor to the income of the most vulnerable households that lack the land or other productive capacity necessary to support themselves. While there are no official statistics, HEA data suggests that approximately 60% of rural households undertake some element of wage labor and the rate of pay of unskilled labor can significantly affect household food security. Wage rates are only loosely associated with the cost of living, depend mainly upon supply and demand. The supply of labor is most influenced by the food security needs, especially the need to obtain the cash necessary to augment own production with food from the market. Thus when production is low, although demand for labor amongst the larger farms might be reduced, the pressure to find work and earn the necessary cash is increased. Similarly, when production is increased, the pressure upon vulnerable households to seek wage labor is reduced. As a consequence, wages may tend to increase more in those periods when production is increased and may even fall in those times when or areas where production has fallen. Recent years of increased productivity have generally resulted in increasing wage rates over and above any increase in the CPI so that on average, the minimum wage is close to ETB 50/day. This issue is considered more fully in Section 6.
7 See the following for a general discussion of under reported wage labor: Oya, C., and Pontara, N. (2015), “Introduction: Rural Wage Employment in Developing Countries,” in: Rural Wage Employment in Developing Countries: Theory, Evidence and Policy.

16
Agriculture Sector Overview The agricultural sector of Ethiopia is characterised by a very large number (approximately 14.2 million) of fragmented smallholdings averaging 0.95 ha in size, together with a much smaller number (approximately 1,300) of larger commercial farms that make up 2.5% of the land area. Altogether approximately 12.5 million ha are cultivated to temporary crops each year. The country enjoys two main seasons of agricultural production, the main one being the Meher season which is primarily dependent upon the Kiremt rains that fall across most of the country from late June to the end of September8. The second season depends upon the Belg rains, which generally begin in February and last until April/May. The Belg season is only important in a limited number of areas, generally to the East and South of the country and contributes only about 5% of annual production overall. Nevertheless, although the area sown to Belg crops is normally approximately one million ha (i.e. about 8% of the area sown to Meher crops), the number of smallholders who are active in the Belg season is about 4.5 million, i.e. about 33% of the number of Meher smallholders). This indicates the relative importance of Belg crops from a food security perspective. Although the actual area sown is small and the yields are lower than those obtained in the Meher season, the Belg season is considered important enough to justify the sowing of a crop by one third of the smallholders in the country and its success or failure can have a widespread impact upon grain flows. All of the crops grown in the Meher season are also cultivated in the Belg, but 76% of the Belg cereal area is maize and barley and 92% of the land sown to pulses is haricot beans. Only small areas of the other crops are grown. Other rains, especially the Gu and Dheyr rains are important in pastoral areas but of limited significance to crop production. Agricultural inputs Ethiopian agriculture uses a relatively high rate of artificial fertilizer (as opposed to animal manure, which is also widely used). All fertilizer is imported by the GoE. The majority is distributed to smallholders through cooperatives on a credit basis, with a small balance being sold to commercial and state farms. Annual sales have increased consistently over the last five years and are shown by Region in Table 2. Table 2: Fertilizer imports and sales by Region (MT)
Year 2010 2011 2012 2013 2014
DAP Urea Total DAP Urea Total DAP Urea Total DAP Urea Total DAP Urea Total
Imports 324792 200485 337826 230846 563187 328083 350000 127000 348123 322560
Availability 500485 305611 485246 332308 705554 467151 644000 333000 519627 463289
Fertilizer Sales
Oromia 146523 59351 205874 129503 59163 188666 172231 82905 255136 188565 90735 279300 160354 91164 251518
Amhara 118320 80215 198535 116316 85254 201570 130677 97550 228227 140553 103628 244181 144894 125566 270460
SNNP 63734 17642 81376 71292 24785 96077 52241 13824 66065 76809 38092 114901 109597 56623 166220
Tigray 17169 12101 29270 21083 14143 35226 30593 21027 51620 34804 23211 58015 30401 24852 55253
Others 6563 32267 38830 12040 17000 29040 16075 18221 34296 15889 16959 32848 18044 16004 34048
Total Sales 352309 201576 553885 350234 200345 550579 401817 233527 635344 456620 272625 729245 463290 314209 777499
8 In practice the growth of long season crops such as 120-day maize or sorghum also depends upon the end of the Belg rains in April/May for effective seedbed preparation and germination

17
Source: Ministry of Agriculture The amount sold in 2014/15 (777,499 MT) is equivalent to an average application rate of 76kg/ha if applied solely to cereal crops. This is in fact the case; CSA data shows that the three crops that receive the most fertiliser are teff, wheat and maize. This rate is almost certainly the highest applied by smallholders in sub-Saharan Africa. It dramatically exceeds the estimated average of 14kg/ha9 as well as the target set by the Abuja Declaration of 2006, which called for African countries to reach rates of 50kg/ha by 2015. In the last year, two domestic blending plants have been set up to allow cooperative unions to blend and sell specific compounds adapted to local growing conditions. Another three are due to be established. Improved seeds of most cereals and pulses are available to smallholders through public enterprises at both Federal and Regional levels as well as a small number of private seed supplies (including Pioneer a DuPont subsidiary). Nevertheless, as a genetic center of diversity for the Gramineae, it is not surprising that the country also contains a wide variety of landraces of different crops, including teff, wheat, barley, emmer and maize, which still predominate over improved seeds for almost all crops except maize (Figure 6). Figure 6 Areas sown to improved seeds
Source: CSA Farm Management Practice Reports 2008 and 2013. The uptake of improved seeds may have been constrained by their limited availability. The increasing impact of new seed companies in both the public and private sectors may reduce this constraint in the future. Although the use of improved inputs has increased, there is however no obvious link between the increase in fertilizer applied or seeds distributed and the increase in yield. In fact yields have increased substantially faster than is physiologically plausible given the relative nitrogen contents of inputs and outputs, while the relative increases in yield of different commodities bears no relationship to the sale and distribution of improved seeds. Thus, over the period 2004/05 to 2014/15, CSA reports that the yield of grass pea or vetch, (an unimproved nitrogen fixing legume that can cause lathyrism and is consequently not promoted) increased by 65%, almost exactly the same as the increase in yield reported
9 See http://www.fertilizer.org March 2015
18
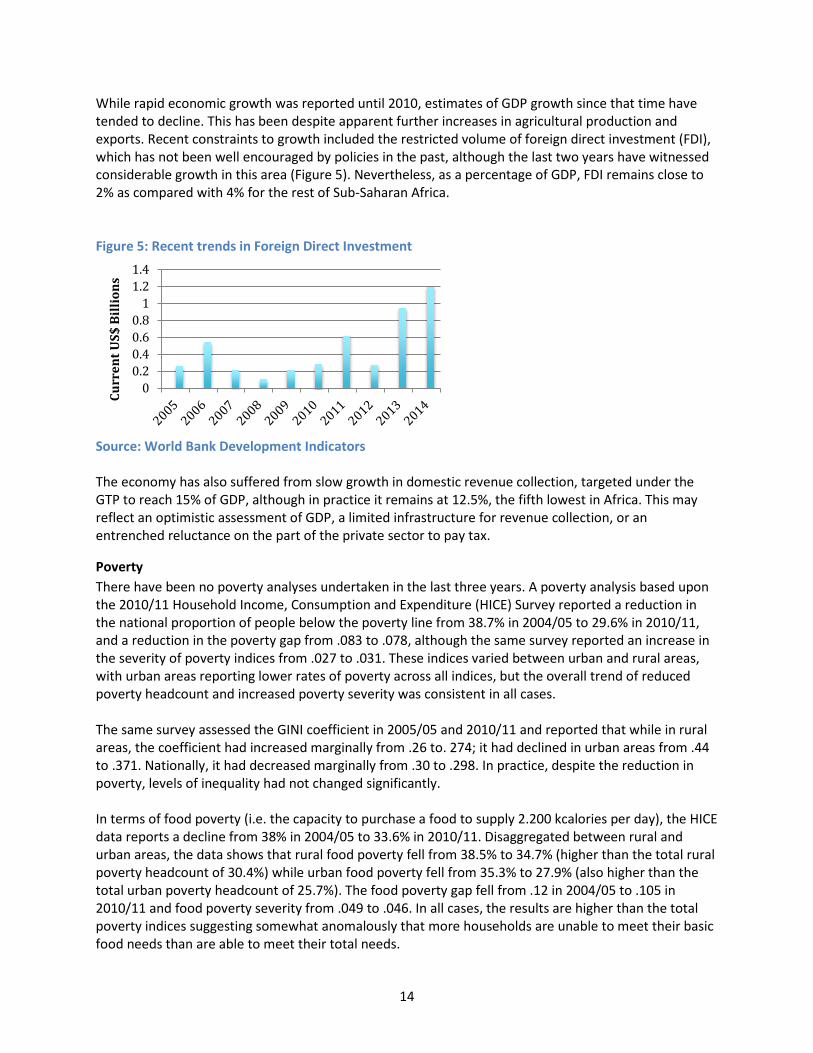
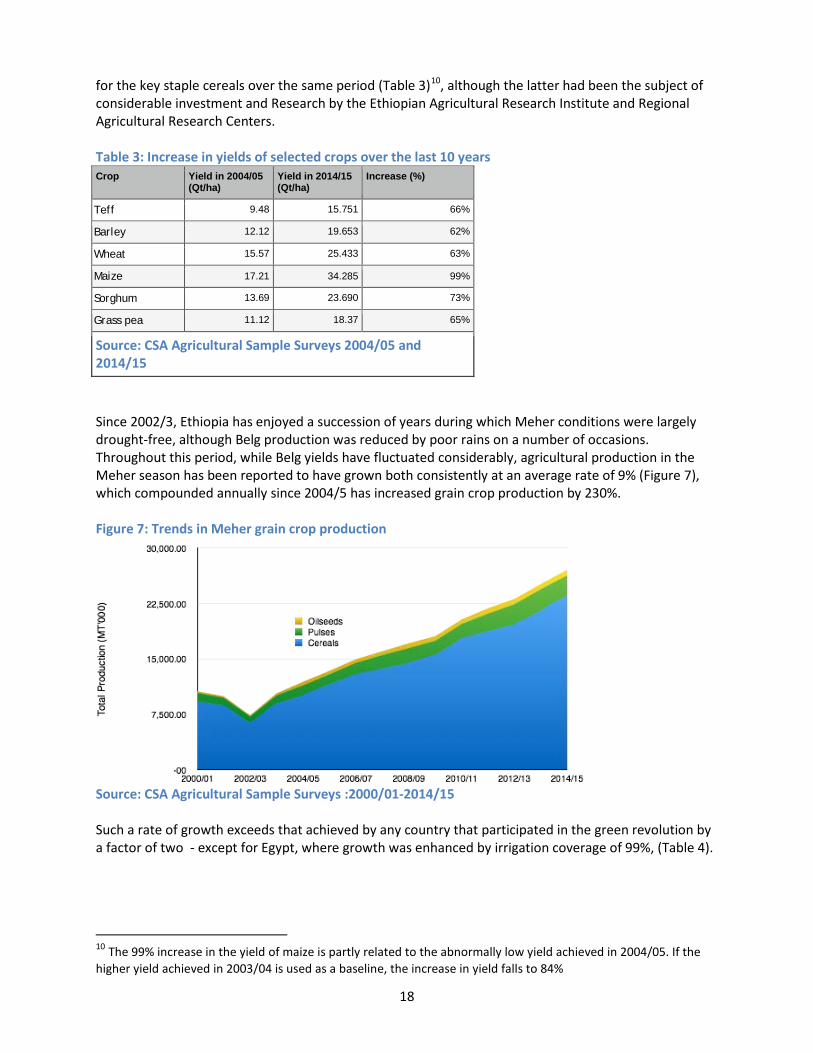
for the key staple cereals over the same period (Table 3)10, although the latter had been the subject of considerable investment and Research by the Ethiopian Agricultural Research Institute and Regional Agricultural Research Centers. Table 3: Increase in yields of selected crops over the last 10 years Crop Yield in 2004/05
(Qt/ha) Yield in 2014/15 (Qt/ha)
Increase (%)
Teff 9.48 15.751 66%
Barley 12.12 19.653 62%
Wheat 15.57 25.433 63%
Maize 17.21 34.285 99%
Sorghum 13.69 23.690 73%
Grass pea 11.12 18.37 65%
Source: CSA Agricultural Sample Surveys 2004/05 and 2014/15
Since 2002/3, Ethiopia has enjoyed a succession of years during which Meher conditions were largely drought-free, although Belg production was reduced by poor rains on a number of occasions. Throughout this period, while Belg yields have fluctuated considerably, agricultural production in the Meher season has been reported to have grown both consistently at an average rate of 9% (Figure 7), which compounded annually since 2004/5 has increased grain crop production by 230%. Figure 7: Trends in Meher grain crop production
Source: CSA Agricultural Sample Surveys :2000/01-2014/15 Such a rate of growth exceeds that achieved by any country that participated in the green revolution by a factor of two - except for Egypt, where growth was enhanced by irrigation coverage of 99%, (Table 4).
10 The 99% increase in the yield of maize is partly related to the abnormally low yield achieved in 2004/05. If the higher yield achieved in 2003/04 is used as a baseline, the increase in yield falls to 84%

19
Table 4: National agricultural growth rates of the Green Revolution Country Crop Production ('000 MT) Growth Rate (%) Irrigated
Area
Beginning End Simple Compound India Wheat 20000 72000 8.7 4.4 74% 1970-2000 Rice 40000 90000 4.2 2.8 55%
Maize 5500 12000 3.9 2.6 23%
Total 65500 174000 5.5 3.3
Pakistan Wheat 7000 19000 5.7 3.5 95% 1970-2000 Rice 2200 4800 3.9 2.6 >99%
Maize 700 1700 4.8 3 65%
Total 9900 25500 5.3 3.2
China Wheat 29000 114000 9.7 4.7 70% 1970-2000 Rice 77000 140000 2.7 2.1 89%
Maize 30000 120000 10 4.8 52%
Total 136000 374000 5.8 3.4
Egypt Wheat 2400 8300 12.3 6.5 >99% 1987-2007 Maize 4000 6400 3 2.4 >99%
Rice 1500 4650 10.5 5.7 >99%
Total 7900 19350 7.2 4.6
Source: Index Mundi The fact that it has been achieved with irrigation coverage of less than 5%, limited infrastructure, exhausted soils and limited uptake of improved varieties makes the achievement all the more remarkable. Other surveys (most notably those conducted by IFPRI using CSA enumerators for the AGP and FTF baseline surveys) suggest that conventionally accepted yields reported by CSA are substantially overestimated. This issue of disparity in estimates is considered at greater length in the section on production. Here, we note that use of the more modest yield estimates reported by other data sources such as IFPRI has significant implications for the estimated rates of GDP growth.
Livestock The country has the largest livestock sector in Africa, including approximately 54 million cattle as well as 25.4 million sheep and a similar number of goats. While sheep and goats are almost always reared for their meat, cattle serve different functions according to the area. In the highlands, cattle are kept mainly as a source of draft power and may be moved out of the agricultural areas to grazing elsewhere during cropping seasons once the land has been prepared. In lowland areas, cattle are kept as a financial reserve as well as for sale, either to highland smallholders or for live animal export. A small volume is sold directly to domestic abattoirs. There is a small and growing dairy sector, but per capita consumption of milk is limited by religious constraints, by chilling capacity and especially by the limited purchasing power of much of the population. As such, milk and dairy products appear to be more widely consumed in urban areas where these constraints are less severe.

20
CSA statistics appear to indicate a decline in livestock sales and slaughter over the last three years (Figure 8). The cause of this decline has not yet been determined, but may be related to the increasing scarcity of fodder due in part to the pressure to increase grain production that has resulted in the ploughing up of communal grazing areas and other lands used to produce forage. Figure 8: Annual Volumes of Slaughtered Meat
Source: CSA Livestock Sample Surveys 2004/05 – 2013/14 A key sub-sector missing from Ethiopia’s livestock sector is that of poultry, which are limited in number and significance. Commercial flocks of poultry have experienced problems with avian flu and in sourcing high protein feedstuffs. The GoE plans to develop this subsector over the next five years, but as yet, poultry and poultry products are not widely consumed.
Crop Marketing Agricultural crop marketing is fully liberalised and dominated by the private sector. A federation of cooperatives does exist under which primary cooperatives are organised under cooperative unions, which are themselves encompassed within the Federal Cooperative Agency. The GoE considers cooperatives to be part of the private sector, although they enjoy a number of advantages including tax exemption as well as access to regional government guarantees for credit that are not available to other private sector institutions. As might be expected, cooperatives tend to have a larger membership in the more productive areas. Successive RRAs have reported that while approximately 12% of farmers are members, the actual volume of grain sold to cooperatives is consistently less than 6% of the total volume marketed. Grain and other crops are marketed through a network of assemblers, traders, brokers and retail outlets that has been considered cumbersome, but is a necessary response to the small scale nature of production on the one hand and the geographically and ethnically disparate nature of the country that prevents ready trading between distant parties (who often may not speak the same language). The difference between producer and retail prices is certainly increased by the length of the value chain, but

21
recent value chain studies11 have shown that little profit accrues to any particular participant, i.e. margins after costs are small. Overall, parallel price movements in different areas have demonstrated that the market for agricultural produce is well integrated. Market information is readily disseminated by mobile phone and the number of opportunities for substantial spatial arbitrage is limited. Other institutions involved in agricultural marketing include the Ethiopian Commodity Exchange which trades almost exclusively in coffee, sesame and white haricot beans, and the Ethiopian Grain Trading Enterprise (EGTE). EGTE was originally intended to be an intervention agency for price stabilisation. A limited budget and high prices over the last five years restricted its grain buying activities, and it has focused increasingly upon the export of coffee, oilseeds and pulses. In the last year however, EGTE has been much more active in providing a floor price to the maize market. EGTE has also been used as the conduit agency for the importation and distribution of wheat by the government (see next section). The market is quite well supplied with credit from banks, Microfinance institutions and informal sources. The RRA found that between 25% and 16% of traders are unable to access credit while approximately 60% -66% do and 14-18% do not use credit at all (Table 5). These statistics are similar to those reported in 2012/13. Table 5: Traders’ Access to Credit Woreda Status Access No Access Don’t Use Credit PSNP (n=167) 60.5% 25.1% 14.4% Non-PSNP (n=85) 65.9% 16.5% 17.6% Source: RRA 2015
11 Minten, B., Tamru, S., Engida, E., and Kuma, T. (2013T). Ethiopia’s Value Chains on the Move: The Case of Teff. ESSP Working Paper 52. Addis Ababa

22
Government Policies affecting The Agricultural sector There are five government policies that directly affect the agricultural sector. Two are related to increased productivity (intensification of extension and inputs) and two to price control (of bread and edible oil), while the last may relate more to food security (the newly established Strategic Food Reserve – SFR).
Intensification There has been a pronounced investment in the training and dissemination of Development Agents (DAs)- 60,000 of whom are now active at a concentration of three per Kabele. These agents work with model farmers to encourage other households to increase their production. Despite their presence on the ground, the impact of the DAs is, according to smallholders, compromised by the time they are obliged to spend on activities not directly related to agricultural production In addition, the GoE has promoted the distribution of improved inputs (seeds and fertilizer) through the controlled importation and distribution of fertilizer through the cooperative network and through legislation allowing the opening up of the seed multiplication and distribution subsector. Although there was an effort in 2012 to restrict input supplies to a cash only basis, this resulted in reduced rate of uptake and in 2014, for the majority of the 20 cooperatives surveyed, inputs were made available on credit. Repayment rates averaged 85% amongst the cooperatives surveyed, indicating that although they are notionally distributed at cost, there is an effective subsidy on input supplies.
Price Controls The GoE has employed significant resources to constrain increases in the price of both bread and edible oil. (Sugar is also a controlled commodity but is of limited relevance to smallholder agriculture). The price of bread was fixed in January 2010 at ETB1.2 per 100gm loaf. In 2014 this was increased to ETB1.3. This price cannot be achieved by bakers using flour milled from locally produced wheat, which has consistently sold at prices of ETB900/Qt or above over the last 12 months, corresponding to a price of flour of ETB 1350/Qt and a loaf costing at least ETB 1.5/100 gm. To allow for the production of cheap bread, the Government has been obliged to use EGTE to import wheat and sell it to millers at a lower price of ETB 575/Qt), corresponding to a flour price of ETB 760/Qt, which could be turned into bread at below the fixed price. Initial imports of wheat were sold at a subsidised price, but the recent decline in the price of imported wheat may allow current sales by EGTE to millers to be made at close to cost prices. Sales volumes have varied over the last seven years (Figure 9), but have averaged around 420,000 MT/year over the last five years, peaking at 685,000 MT in 2013/14.

23
Figure 9: EGTE intervention sales of wheat and real wholesale prices
Sources: EGTE and CSA CPI data The intervention exercise has undoubtedly had some impact, but it is remarkable that even the peak volume distributed in 2013/14 was not enough to prevent an increase in real price. For 2015, EGTE has arranged the importation of 400,000 MT, the bulk of which will arrive after June, and EGTE will then determine how much might be needed from the condition of the market later in the year. For edible oil, the Government has been, since 2010, the sole importer of edible palm oil, which it has sold to the general public through the parastatal institution Merchandise Wholesales and Import Trade Enterprise (MEWIT), which has imported the oil and sold it to cooperatives and consumer associations for onward sale to the general public at a fixed price. While prices may initially have been subsidised, reductions in the international price of palm oil may now allow sales to be more or less at cost (although the fixed retail price of ETB 23/litre has remained constant. MEWIT initially imported 325,000 MT of oil each year, but as of April 2015 the annual volume has increased to 425,000 MT. This represents a substantial increase over previous commercial imports (which averaged less than 150,000 MT per year) and is more than six times greater than domestic edible oil production (which has never averaged more than 70,000 MT per year). In both cases, the GoE has used foreign exchange to import or produce staple foods for sale at affordable prices. Commercial imports of wheat have not occurred since millers who have wanted to purchase wheat have not been able to obtain foreign exchange, while some commercial traders have been able to import edible oil (albeit not palm oil, which is exclusive to MEWIT), but are obliged to pay 30% duty and 15% VAT so that the high retail cost restricts sales and import volumes.
Strategic Food Reserve The Strategic Food Reserve (SFR) was established by proclamation in 2014 and supersedes the Emergency Food Security Reserve (EFSR). That former body was an effective partnership between the donor community and the GoE that oversaw the delivery and replenishment of a 410,000 MT grain reserve, specifically designed to provide rapid response capacity in the event of immediate need. The

24
new institution is designed to meet that same need, as well as to provide for a more strategic response in the event of generally high prices. It is thus both an emergency food reserve and a market intervention mechanism; in that latter capacity it duplicates the function of EGTE. The capacity of the SFR was initially expected to be three million MT, although no figure has been formally announced and discussions with SFR staff suggest that an amount half that size or less would be more appropriate both to purchasing capacity and to meet national needs. Similarly, a larger grain reserve will require the rotation of stocks and a consequent significant presence in the market, but as yet the board of directors of the SFR have not determined how the rotation process might be implemented. One key aspect of the EFSR upon which the SFR proclamation is silent is the interaction of the new institution with the donor community, which previously had a seat on the EFSR steering committee and provided the guarantees of replenishment, which enabled various agencies to withdraw grain for emergency purposes. Donor commitments used to provide a significant proportion of the grain that entered the EFSR, but since 2008 when significant volumes were withdrawn by EGTE for price stabilisation purposes, these volumes have declined. The EFSR could not be said to enjoy the same degree of donor confidence at its closure as it had in previous years and the role of the donor community in the SFR has not as yet been determined Figure 10: Bulk Food Imports
Source: WFP Shipping Data (Data for 2015 is projected). Bulk food shipments into Ethiopia are shown in Figure 10. Customs data for the last four years indicate very few food imports other than a commercial shipment of barley (17,599 MT in 2014 for the brewing subsector), and regular imports of food aid by USAID, WFP, and a small number of other donors. The volumes of donor food aid have declined since 2008, but have been replaced by GoE imports so that overall food imports remained approximately stable. Although projections for 2015 indicate a reduced food import volume, the level of grain importation still exceeds that required over the period 2004-07, despite the fact that grain production has reportedly increased by 81% since that period. . The sharp rise in imports in 2008 was precipitated not so much by food shortage as by high prices in the market, but ever since that year, imports have declined only slowly. It is also important to note that Figure 10 does not include the GoE importation of 435,000 MT of palm oil12.
12 Palm oil is not imported as a bulk commodity, but in cartons of jerry cans.

25
Food Supply in 2014/15 From the perspective of national food security, current levels of supply are based upon carryover stocks from 2013/14, Meher production in 2014/15, Belg production in 2015, and imports. From the perspective of a food deficit area, all of the above are important factors, but to these must be added smallholders’ willingness to dispose of household grain stocks and the capacity of the market to deliver food from surplus areas at affordable prices, itself dependent upon the availability of finance, transport and market efficiencies. Each of these aspects is considered in turn below.
Carryover stocks Carryover stocks were assessed by the RRA carried out in October 2014. Smallholder focus group discussions reported that as a result of the increased production experienced in 2013/14, the volume of carryover stocks from the previous season was higher in 2014 than ever recorded previously, (Table 6). These stocks, if extrapolated nationwide would amount to 2.9 million MT of cereals, i.e. more than 10% of national production. Significantly, even PSNP households reported holding substantial carryover stocks, indicating the importance attached to physical food within the household as opposed to purchasing capacity in the form of cash. Table 6: Smallholders’ estimates of carryover stocks by crop and woreda status
Crop Grain stock (kg/hh) in store at the beginning of the 2014/15 marketing season
PSNP Non-PSNP
Maize 57.50 354.98
Wheat 99.06 241.03
Teff 65.78 241.48
Sorghum 90.68 143.00
Average 78.26 245.12
Source: RRA 2014 Most smallholders reported that they held predominantly one type of cereal, so the results are not cumulative over crop type. Nevertheless, the increase in stock holding is equivalent to 800,000 MT, an amount that has significant implications for the national food balance, since the additional stocks may be drawn upon in 2014/15. By contrast carryover stocks of traders and millers were reportedly small, amounting to no more than 250,000 – 300,000 MT in total, i.e. no more than 10% of the amount carried over by smallholders.
Meher Production 2014/15 Meher production was assessed by RRA in October 2014 and again in March 2015. RRA results are not representative of the country as a whole since they are targeted towards two distinct and different areas, PSNP woredas on the one hand and high production areas on the other. A large proportion of national production that lies between these two extremes is not assessed. Nevertheless, the RRA results can be used to indicate general trends in production in these two types of area and a judgement can be made as to whether or not the RRA trends are typical of national trends.

26
The RRA does not estimate areas planted but does ascertain if total area sown to temporary crops has increased or decreased. Despite the fact that there would appear to be very little free land available, and although many kabeles have lists of young families who wish to access land but cannot do so, successive CSA crop estimates have shown that the area cultivated to temporary crops has continually increased since 2005. This rather surprising result has been borne out by successive RRAs, which have recorded similar results. The additional area has been drawn from communal grazing areas, woodlands, marshy areas, reduced fallowing and the reduced production of fodder crops. In some cases, smallholders have reported coming under pressure from DAs to convert fodder crops to grain production, a practice that may be contributing to the increasing scarcity of livestock feed. Nevertheless, an annual increase in land cultivated to temporary crops of 2% (in line with the rate of rural population growth) appears realistic, and this has been the experience of both previous and the latest RRAs. Yield estimates produced by the CSA for 2014/15 are substantially higher than other substantive yield estimates such as that made by WFP in its assessment of the impact of the Purchase for Progress program. That assessment found that P4P households (who as suppliers to Cooperative Unions, were all situated in productive areas) achieved maize yields of 1.88 MT/ha in 2009, 2.01 MT/ha in 2012 and 2.37 MT/ha in 2013. Corresponding CSA national yield estimates were 2.22, 2.95 and 3.06 respectively. The IFPRI baseline assessment of yield undertaken across more than 8,000 households in high potential Agricultural Growth Programme (AGP) woredas and non-AGP woredas (Table 7) undertaken in July 2011 also reported results that were considerably lower than CSA national yields, despite the fact that they were focused primarily upon high potential AGP woredas. Table 7: Assessment of Yield (in Qt/ha) achieved by households in 2010 according to AGP woreda status by IFPRI as compared with CSA national data. Category Teff Barley Wheat Maize Sorghum AGP Woredas 9.8 14.0 15.1 16.0 13.0 Non-AGP Woredas 9.2 14.9 14.4 17.6 10.9 CSA (National Yields) 2010/11 12.6 16.3 18.4 25.4 20.9 Sources: IFPRI AGP Baseline Survey 2011 and CSA Crop Production Estimate 2010/11 For these reasons, this Bellmon assessment has not used the CSA yield statistics when considering production. CSA area statistics have been used since these appear to be in line with reported trends13, but yields have been based upon an empirical assessment derived from the production achieved in 2006 (an ideal crop production year) adjusted for area planted and for the observed increase in improved input usage. This model was applied in the initial 2014/15 crop assessment undertaken in October 2014, to suggest a potential increase of 1.07 million MT of cereals over that of 2013/14 and can now be adjusted in the light of farmers’ responses to the latest RRA. Farmers’ expectations and observations of yield 14 are shown relative to the previous year in italicised normal and bold type respectively on a Regional basis in Table 8.
13 Although there is no other dataset that could be used as a means of verification. 14 Expected yield estimates were given by farmers in response to a survey conducted in October 2014, (i.e. before the harvest had been completed). Observed yield estimates are farmers’ estimates given in response to a survey conducted in April 2015, (i.e. three months after the harvest had been completed).

27
Table 8: Expected (2014) and Observed (2015) Crop Yields (as a percentage of 2013 yields) by Region
Crop Tigray Amhara Oromiya SNNPR Average
Maize 115% 114% 125% 112% 103% 108% 60% 88% 101% 108%
Wheat 109% 114% 109% 102% 110% 98% 101% 109% 107% 102%
Teff 165% 123% 115% 100% 108% 109% 109% 88% 124% 104%
Sorghum 113% 116% 125% 107% 119% 118% 56% 91% 103% 114%
Barley 104% 111% 104% 110% 110% 103% 91% 112% 102% 108%
Horse bean 107% 115% 103% 103% 107% 108% 73% 75% 97% 100%
Field peas 115% 132% 103% 100% 114% 100% 88% 106% 105% 103%
Source: Focus Group Discussions 2014 and 2015
In general, in Tigray estimates of yield have been revised upwards, with the exception of teff, which yielded less than expected. By contrast, in Amhara, yields were revised downwards. In Oromiya, there was no clear trend and in SNNPR, again with the exception of teff, yield estimates were revised upwards. Overall, it appears that maize and sorghum crops performed better than farmers expected while wheat and especially teff were below expectations. When assessed according to PSNP/non-PSNP status, some differences can be discerned between the two woreda types (Table 9). Yields of maize in the PSNP areas turned out to be better than expected, but the reverse was the case in the high potential areas, although the average yield was still better than that of 2013/14. Wheat yields were below expectations in both cases and marginally better than the previous year overall. Yields of teff were much less than expected in PSNP areas and also less than expected in non-PSNP areas, although the difference was not so great. Yields of sorghum exceeded those achieved in 2013 in both areas, but the high yields expected in the non-PSNP areas did not materialise. Yields of barley marginally exceeded expectations in both PSNP and non-PSNP areas.
Table 9: Expected and Observed Crop Yields (as a percentage of 2013 yields) by PSNP/Non-PSNP Status
Crop PSNP Non-PSNP Average
Maize 93% 104% 118% 111% 106% 108%
Wheat 103% 97% 114% 107% 109% 102%
Teff 119% 100% 116% 109% 118% 104%
Sorghum 106% 114% 140% 112% 123% 114%
Barley 102% 103% 111% 114% 107% 108%
Horse bean 107% 94% 99% 105% 103% 100%
Field peas 106% 99% 109% 106% 108% 103%
Chickpea 111% 89% 111% 107% 111% 98%

28
Table 9: Expected and Observed Crop Yields (as a percentage of 2013 yields) by PSNP/Non-PSNP Status
Vetch 119% 84% 95% 114% 107% 101%
Nueg 105% 77% 114% 107% 110% 92%
Flax 120% 100% 123% 112% 122% 105%
Source: Focus Group Discussions 2014 and 2015
Pulse and oilseed crops all yielded below expectations in all woredas, with the exception of horse beans and vetch, which exceeded expectations in non-PSNP woredas. Overall, compared to their estimates of observed yields in 2015, the RRA found that farmers’ expectations of yields in 2014 were overly optimistic in the case of teff, wheat, and sorghum, but marginally underestimated for maize and barley; for all other crops, harvested yields were lower than had been anticipated when surveyed in 2014. Nevertheless, the harvested yield estimates were almost all the same as or higher than those achieved in 2013/14. Only Chickpea and Nueg were estimated to have yielded less in 2014/15 than the year before. These results are surprising given the anticipated impact of wheat rust and late rains upon production. In interviews with farmers, it was confirmed that the impact of wheat rust in Oromiya had been substantial, and that the yield of maize in western parts of Oromiya, Eastern Highlands and SNNP had also been well below potential. Nevertheless while the initial assessment of production and markets undertaken in October 2014 suggested that if weather allowed, cereal production might increase by 1.07 million MT, farmers’ reports suggest that in fact the overall increase in smallholder production as compared with 2013/14 was 1.40 million MT15. These results are nevertheless corroborated by traders’ assessments of grain flows into markets16. The RRA showed clearly that while traders considered the flow of cereals into all markets to have increased in some areas and decreased in others, overall, the number of markets where cereal inflow increased outweighed the number in which it decreased. An analysis of the percentage increases indicates that the differences were most marked in non-PSNP woredas where inflows increased most often by 5-10%. By contrast, in PSNP woredas, the number of markets reporting increased inflows was little different to the number reporting decreased inflow. When asked to explain why the increased inflow had occurred, the majority of traders ascribed it simply to increased production. When considering the outflow from non-PSNP markets, it was very evident that reductions were much more prevalent than increases in outflow and that the size of the reduction was much greater (often >20%). Traders ascribed this reduction not only to reduced production, but also to reduced demand from deficit areas. In PSNP woredas, a similar reduction in outflows was recorded, but this was ascribed by traders simply to reduced production rather than to reduced demand elsewhere. Overall, traders’ responses to the RRA suggest that in PSNP woredas, cereal production was on average no better in 2014-15 than it had been in 2013-14, but that in non-PSNP areas, a significant number of
15 Allowing for a 2% increase in area planted. 16 Grain flows into a wholesale market from producers and assemblers and out of a market to other wholesalers in remote markets. Sales to local retailers are not considered as part of the outflow. In some cases, especially in deficit areas, such sales absorb all of the inflow and there is no outflow from the market at all.

29
woredas had experienced increased cereal production of 5-10%. This was true for maize and wheat and to a lesser extent teff. These responses were corroborated by farmers’ estimates of their sales. As might be expected, the majority of producers in PSNP woredas expect to sell relatively less of their production than those in non-PSNP woredas. The majority of PSNP producers expect to sell less than 10%, while the majority of non-PSNP producers expect to sell more than 20% of production (Table 10). Nevertheless, the difference between PSNP and non-PSNP producers is less marked than the regional differences reported. (Table 11) Table 10: Smallholders’ sales expectations by woreda status Expected Percentage of farmers' production to be sold Woreda Status Up to 10% 11% - 20% 21% - 50% More than 50% PSNP (101) 51.5% 17.8% 21.8% 8.9%
Non-PSNP (58) 10.3% 25.9% 46.6% 17.2%
Source RRA 2015 Most farmers in Tigray expect to sell only a small proportion (<10%) of their production. The same is broadly true of producers in Amhara, although there are more farmers expecting to sell more than 20% of that which they have produced. By contrast, in Oromiya, the majority of producers (59.1%) expect to sell over 20% of production, while in SNNPR, all producers expect to sell more than 20%. Table 11: Smallholders’ sales expectations by Region Expected Percentage of farmers' production to be sold Region Up to 10% 11% - 20% 21% - 50% More than 50% Tigray (22) 63.6% 27.3% 9.1% 0.0% Amhara (57) 52.6% 24.6% 19.3% 3.5% Oromiya (66) 21.2% 19.7% 39.4% 19.7% SNNPR (14) 0% 0% 71.4% 21.6% Source: RRA 2015 This difference is surprising given the high proportion of PSNP woredas in SNNPR on the one hand and the relatively improved production of Tigray in 2014/15 on the other. There is no immediate explanation for this. At a national level, farmers’ sales to date were most frequently assessed as being less than the year before for maize, but more for sorghum and teff and about the same for wheat. At a regional level, (Figure 11) it was clear that in Tigray, farmers’ sales of all cereals except wheat were more than the year before, while the response in SNNPR, was the exact reverse – wheat sales were higher than the year before, but all others were lower. In Amhara, sales of maize and wheat were not markedly different from the previous year, but sales of teff and sorghum increased, while in Oromiya, sales of all cereals were less than the year before. The data suggest that in 2014/15 farmers sold (and by implication produced) relatively more in the northern part of the country and that this was especially true for teff and sorghum. When disaggregated by woreda status, it is evident that sales in PSNP areas declined in more woredas than increased, but the reverse was the case for non-PSNP woredas, where sales of wheat and teff increased most frequently although sales of maize and sorghum were not markedly different to the previous year.

30
Figure 11: Farmers’ estimates of relative grain sales
Source: RRA 2015 Overall, the RRA presents a picture of considerable variability throughout the country, but one characteristic was consistent: Traders were unequivocal in their assessment that demand from cities and rural deficit areas was much reduced in 2015 as compared to the previous year. They noted that prices in these deficit areas had not reached the levels at which it was economic to send grain. This strongly suggests that stocks in those deficit areas were higher than normal, as a result either of production in the 2014/15 season or of carryover stocks from 2013/14.
Belg Production 2015 The Belg rains for 2015 have been variable. NMA has not yet published dekadal data, but USGS/FEWS rainfall estimates (RFE)17 suggest that in the Belg-dependent areas, the rains have been late and sporadic which will significantly reduce and delay crop production. In the southern areas in particular, significant rains were only recorded in late March, by which time planting had been delayed so that the crops that were sown would be harvested late and would prevent the sowing of Meher season crops into the same land. Unfortunately the rains that did eventually fall were sporadic and yields must be expected to be low. Heavier rains began again in May and in many areas have continued into June, so that cumulative data across all Belg producing areas suggests only a moderate reduction in Belg rainfall, (Figure 12). Figure 12: Historical Belg rainfall amounts (for Belg production areas)
Sources: NMA and USGS Nevertheless the impact of that reduction is likely to be proportionately much greater due to the delayed timing of the rains in many areas (Figure 13).
17 Available at http://earlywarning.usgs.gov/fews/mapviewer/index.php?region=af
0.0%
10.0%
20.0%
30.0%
40.0%
50.0%
60.0%
70.0%
PSN
P
Non
-PSN
P
PSN
P
Non
-PSN
P
PSN
P
Non
-PSN
P
PSN
P
Non
-PSN
P
Maize Wheat Sorghum Teff
% F
arm
ers'
Gro
ups
Repo
rtin
g
Less
Same
More
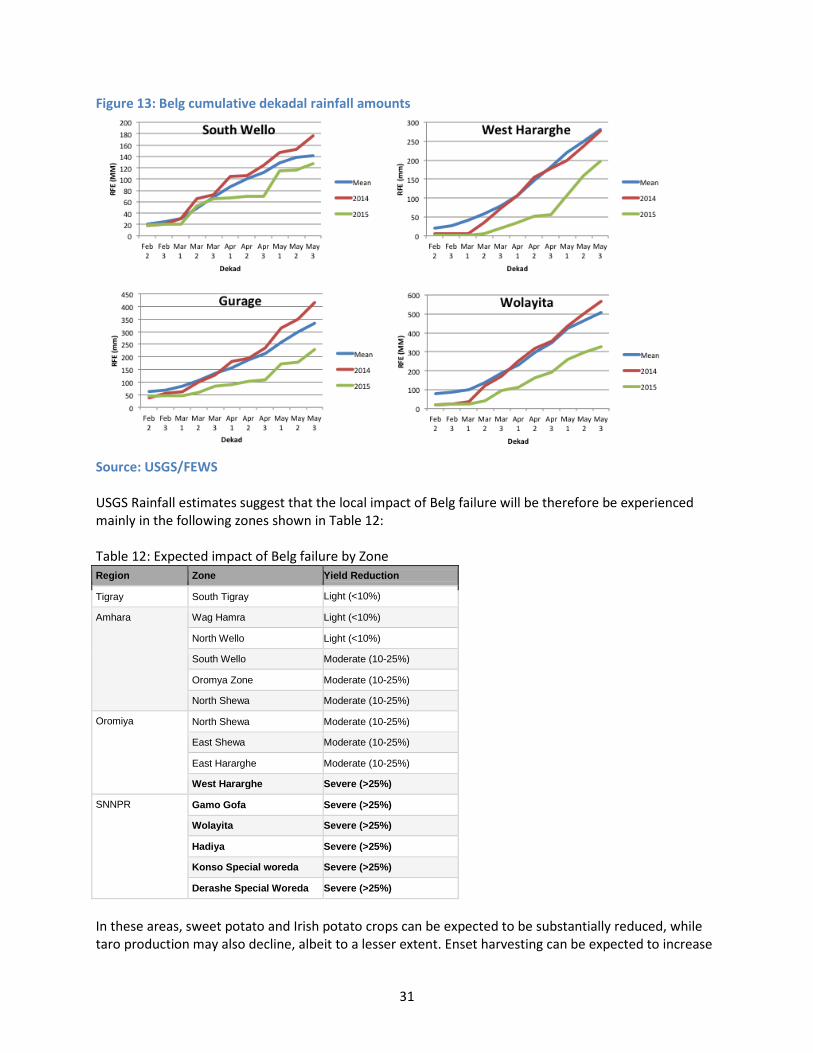
31
Figure 13: Belg cumulative dekadal rainfall amounts
Source: USGS/FEWS USGS Rainfall estimates suggest that the local impact of Belg failure will be therefore be experienced mainly in the following zones shown in Table 12: Table 12: Expected impact of Belg failure by Zone Region Zone Yield Reduction
Tigray South Tigray Light (<10%)
Amhara Wag Hamra Light (<10%)
North Wello Light (<10%)
South Wello Moderate (10-25%)
Oromya Zone Moderate (10-25%)
North Shewa Moderate (10-25%)
Oromiya North Shewa Moderate (10-25%)
East Shewa Moderate (10-25%)
East Hararghe Moderate (10-25%)
West Hararghe Severe (>25%)
SNNPR Gamo Gofa Severe (>25%)
Wolayita Severe (>25%)
Hadiya Severe (>25%)
Konso Special woreda Severe (>25%)
Derashe Special Woreda Severe (>25%)
In these areas, sweet potato and Irish potato crops can be expected to be substantially reduced, while taro production may also decline, albeit to a lesser extent. Enset harvesting can be expected to increase

32
in compensation, but it will be the delayed and reduced production of maize that will have the greatest impact. As indicated in Figure 12, the extent of the Belg rains in 2015 is roughly comparable to that experienced in 2008, when cereal production declined to 668,000 MT, i.e. 30% less than the 2014 Belg cereal output of 958,000 MT. A similar reduction might be experienced this year. From an annual perspective, the impact is small, (i.e. 290,000 MT or approximately 2% of cereal production), but past experience would suggest that this will nevertheless reduce local food security significantly, affecting as many as one third of all smallholders. Summary After allowing for a reduction of 0.29 million MT in the 2015 Belg harvest, the updated assessment still suggests that an additional 1.1 million MT of cereals would be produced by smallholders in 2014/15 as compared with the previous year. To this amount must be added commercial production (mainly maize and wheat), which if assumed to be subject to the same yield increase as smallholder production (i.e. 6%), would be increased to 932,000 MT. The total volume of cereals available for use and consumption on this basis would be 16.10 million MT. This is 1.28 million MT more than the estimate of 14.82 million MT for 2013/14, i.e. an increase of 9% (Table 13) Table 13: Estimated supply of cereals updated on the basis of RRA 2015 Factor Impact Outcome Meher Smallholder production in 2013/14
15.18 million MT
Increase in area of 2% pa Increase by x 1.02 15.48 million MT Farmers’ Post Harvest Estimates
Additional 1.40 million MT 16.88 million MT
Belg production Additional 670,000 MT 17.55 million MT Large Scale production Additional 932,000 MT 18.48 million MT Post Harvest losses Reduce by x 0.87118 16.10 million MT Total Cereal Production from all sources in 2014/15 available for use and consumption:
16.10 million MT
Source: RRA 2015 This is considered to be a somewhat optimistic result. It is unlikely to be biased by the selection of woredas, which if anything favoured the less productive areas overall. It may have been biased by the selection of farmers to attend focus group discussions, a process that was in some cases influenced by DAs. Although this methodology has worked adequately in the past it is possible that the discussions this year were more strongly influenced by socio-political considerations than normal. This estimate is further complicated by the increase in carryover stocks reported in the October 2014 RRA , which found that stocks at the end of the season had increased from an estimated 2.1 million MT to 2.9 million MT. Some of the additional 800,000 MT stored grain will very probably be consumed or sold in 2015, contributing further to the flow of grain to markets.
18 Calculated from APHLIS data for each crop for Ethiopia and estimated usage/selling rates

33
Market Trends Cereals There are five main cereals consumed in Ethiopia: teff, maize, wheat, barley and sorghum. Traditionally teff has been the Ethiopian staple, but its price has escalated to the point where it is consumed mainly in urban areas and by higher income households. Poor rural households grow teff as a cash crop, but consume relatively small amounts. Instead, the staple for the poor has become maize, whose high yields and lower price make it more available and accessible. Wheat and barley have also been traditional Ethiopian crops and of the two, barley was originally more highly prized, being known in Tigray as the “king of cereals” that could be used in many different ways. With increasing urbanisation however, wheat has become more important as a source of flour for the convenience food – bread. As a result, wheat prices have also escalated and like teff, the crop is consumed more by urban and higher income households, while barley prices have remained lower and consumption has remained more amongst poorer rural households. Finally, sorghum continues to be grown in the drier areas where maize yields are less certain, especially in the Eastern Highlands and in parts of Tigray. It is used for traditional foods and commands a significantly higher price than maize. As a result of this market specialisation, the prices of different cereals can trend in different ways. Teff, sorghum and wheat prices tend to vary independently of maize and barley prices. Nevertheless, the floor to the cereal market is almost always set by the maize price. Cereal prices tend to fluctuate seasonally, falling from September/October through to January as the new crop becomes available for own-consumption (thus reducing demand) and onto the market (thus increasing supply). From February onwards, prices tend to increase, sometimes stabilising around April when Belg production may also reduce demand. From May onwards, prices tend to increase through the hungry season, when deficit areas have exhausted their own production and must rely upon grain brought in from surplus areas. Prices generally reach a peak in late August, early September before beginning the next seasonal decline. Although somewhat unexpected, farmers’ estimates of cereal yield have to a large extent been borne out by subsequent market developments. These saw high, but stable wheat and teff prices throughout the early part of the season, while sorghum and maize prices in particular declined in both real and nominal terms to as low as ETB370/Qt in Jimma – one of the centres of production (Figure 14) remaining at around ETB400 or marginally above in most production areas. The presence of EGTE in the maize market . . . buying at a constant threshold price of ETB400 in main markets . . . contributed to price stability, but some farmers sold to traders at significantly less than this (around ETB320, or even below) and reported that they had lost money on their commercial maize crops. The last two months have however seen substantial increases in most cereal crop prices except sorghum. Individual cereal crops are considered below. Maize In a national market where supply and demand have been, at least initially, approximately equal, substantial variation in price nevertheless can be expected, both spatially and over time as some market sheds move from surplus to deficit and others remain in a surplus or deficit state. Such variation has been very evident in maize markets. Prices for different markets are shown in Figure 14, together with the national average wholesale price.

34
Figure 14. Recent wholesale maize prices (ETB/Qt)
Source: EGTE MIS When these price series are sorted according to the nature of the market, clearer trends emerge. In typical deficit areas, prices fell through September to December 2014 to about ETB450/Qt and then remained stable until April/May, when they began to rise, with an increase in the rate of price rise from May to June. The exception to this was Dire Dawa, where prices where higher, but continued to fall until May, but increased thereafter. These trends reflect markets where supplies initially increased and then remained in balance with demand until they had been exhausted. By contrast, in surplus areas, maize prices fell rapidly to a lower level. While the seasonal price decline from October to January/February is normal in surplus areas, the continued decline in prices until May has not been observed for more than ten years. The depressed prices were reported by traders to be due to the fact that there was no flow out of the markets (i.e. to urban centers and deficit areas). Normally, some traders buy with the expectation of finding a wholesale buyer elsewhere in the country. In previous years, such buyers would have been active in deficit market by the end of February; however, this was not the case in 2015. It was only when the accumulated stocks in deficit areas were depleted that local prices began to increase to the point where grain movement from surplus areas could be justified. At this point, (which was reached in May), grain prices in surplus markets increased, in some cases quite dramatically19. In transit markets, including Addis Ababa and Nazreth, prices behaved as might be expected in an intermediate manner (Figure 15).
19 Maize prices have increased most in Jimma Zone – normally a pronounced surplus area for maize. It is possible that the price increase in this zone has been exaggerated by its proximity to Belg-production zones where an anticipated shortfall in maize production has been caused by the failure of the 2015 Belg rains.

35
Figure 15: Maize price series for different market types
Source: EGTE MIS It is possible that the increase in maize prices observed in late May has also been due to the clear failure of the Belg season (in which maize is a dominant crop). At this stage, it is uncertain as to which factor might be more important. Nevertheless, the rise in maize prices has been substantial. Although in real terms, the average wholesale price of maize remains 18% below the price 12 months before. It can be expected that maize prices will now continue to rise until August at which point the impact of the Belg rains and of the Meher harvest potential will be more clearly indicated and prices will either remain high (if the failure of the Belg has had a significant impact on Meher production) or decline in the normal seasonal manner. Wheat Average wholesale wheat prices have remained high throughout the last 12 months, peaking in October 2014, before declining marginally (8%) to a seasonal low in January. Thereafter, two different price behaviours can be seen. In end markets, prices gradually rose, accelerating upwards in April/May, while in surplus markets, prices continued a slow decline, or remained flat, rising sharply in May/June as a result of the increasing prices in end markets. Despite these movements, in real terms prices in June are only 1% above wholesale prices 12 months before. The market has been influenced by EGTE wheat sales to millers, but despite those sales, domestic prices have continued to remain high, and now show signs of further upward pressure. It is probable therefore that EGTE will continue its price stabilisation exercise. While 400,000 MT of wheat has already been programmed for importation, EGTE has made contingencies for the importation of additional volumes over the remainder of calendar year 2015.

36
Figure 16: Wholesale wheat price series for different market types
Source: EGTE MIS Despite the regular sale of imported wheat, the current domestic price of domestic wheat in US dollars has exceeded import parity for the last two years (Figure 17) and remains approximately double that on the international market. Figure 17: Wholesale domestic and import parity prices for wheat
Source: Index Mundi and EGTE MIS Nevertheless, though there is a clear shortfall in local production capacity relative to domestic demand for wheat, it is possible that the price of wheat will be effectively capped by the price of mixed teff, which appears to be roughly stable at approximately ETB1250/Qt. At this price, teff is an economically feasible alternative to wheat at ETB1100/Qt. Indeed most households canvassed indicated a preference for teff and njeera as opposed to wheat and wheat bread if the prices of the finished products were equivalent. It is therefore possible that wheat prices will not rise very far beyond the levels observed last, unless there is a concurrent rise in the price of teff.

37
Teff Nominal national average wholesale teff prices remained broadly stable throughout much of the season and increased by approximately 7% towards June (Figure 18). Nevertheless, in real terms, white teff prices in June 2015 are only 2% above prices 12 months earlier, while real mixed teff prices have fallen by 3% over the same period. Figure 18: National average nominal wholesale price trends for white and mixed teff
Source: EGTE MIS The stability suggested by the national average price data is not at all reflected in local market prices, which have fluctuated considerably, (Figure 19). Figure 19: Wholesale price trends for mixed teff in different markets
Source: EGTE MIS In the case of teff is difficult to determine what market forces have been dominant in different areas. It is possible that the market is more segmented by quality differences that are not discerned using the blanket category “mixed teff”. Traders also indicated that the market for teff more than that for any other crop is strongly influenced by purchaser taste and buying capacity, so that not only different varieties, but also different local preferences may influence the market. Nevertheless, one aspect of the

38
market is consistent in most zones, namely that in May and June, prices have shifted sharply upward, effectively negating any reduction in real prices and setting the scene for elevated real prices until the next crop comes onto the market. Sorghum Sorghum wholesale prices contrast quite strongly with those of other cereals. Prices rose in 2014 to a peak in August and declined thereafter until November/December, after which time they remained largely flat. There has been a mild uptick in nominal sorghum prices in June, but only in some markets (Figure 20). Overall, real prices have declined by 9% over the last 12 months. Figure 20: National average and selected market wholesale prices for sorghum.
Source: EGTE MIS The flat market for sorghum was to be expected given the significant increase in area sown to this crop as well as its relatively strong performance under drought stress, especially in the Eastern Highlands, where it was evident that sorghum had yielded adequately although adjacent maize crops had failed. Future trends in sorghum price will depend strongly upon the nature of the early Meher rains. If these allow sorghum crops to be planted on time then the price will likely remain stable. The small increase in sorghum prices in June may reflect that fact that overall supplies of sorghum are largely unaffected by Belg failure since sorghum is not a Belg crop. Summary The main cereal crops exhibit different market trends. Sorghum has declined in price suggesting that production has increased relative to demand. By contrast, wheat prices have increased, suggesting the converse. Teff prices have remained approximately stable, although individual markets show different price trends. Maize prices have generally declined through the first part of the season, but have increased sharply over the course of the last two months. It is the sharp increase in the price of maize that will most affect cereal supplies to the most vulnerable areas. Teff and wheat are not much consumed by the poorer households. Maize and sorghum are the cheaper and dominant staples. It would appear that last year’s harvest has now been effectively exhausted and/or that households are increasingly holding on to their own stocks so that the supply of local grain to deficit markets has ceased. Prices in deficit areas have immediately increased enough to impact the prices in surplus markets. Significantly however, the price of maize in surplus markets has also risen rapidly, suggesting that there too, the rate of inflow has now decreased. The outlook in the near term is that maize prices will likely increase further until the first green maize comes onto the market in September. At that point, the behaviour of the market will depend upon the Meher production. It is possible that the increased maize price will create upward pressure on the prices of all other cereals, but the extent of this effect cannot be predicted.

39
Pulses The main pulses produced in Ethiopia are horse beans (Faba beans), field peas, vetch, chickpeas, red and white haricot beans (phaseolus beans) and lentils. Of these, the haricot beans are grown almost exclusively for export, while horse beans and chickpeas are both exported and consumed locally, and field peas, vetch and lentils are all consumed locally. In late March 2015, traders were complaining that there was no export market for pulses, due to the fact that local pulse prices were high and international demand was weak. As of June, this situation has not changed significantly. Chinese demand for all pulses has remained lower than expected, while North American supply of dried haricot beans and chickpeas has been high so that international prices of these two pulses have continued to decline. By contrast, the international market for lentils and dried peas have both continued to strengthen, but Ethiopia does not export these pulses. International demand for horse beans comes mainly from Sudan/South Sudan and has been reduced due to conflict there. Despite the weak international markets, domestic nominal pulse prices have increased substantially over the last 12 months (Figure 21). In the same time period, real price increases for chickpea, horse beans, field peas, and lentils have been 52%, 41%, 39%, and 91% respectively. Figure 21: Short-term trends in nominal domestic pulse wholesale prices
Source: EGTE MIS When compared with historical prices (Figure 22), chickpea, horse bean and field pea prices have now reached roughly the same real levels that they were in 2006/07, i.e. prior to the inflationary events of 2008 and 2011. Lentil prices, on the other hand, have now reached unprecedented real levels.
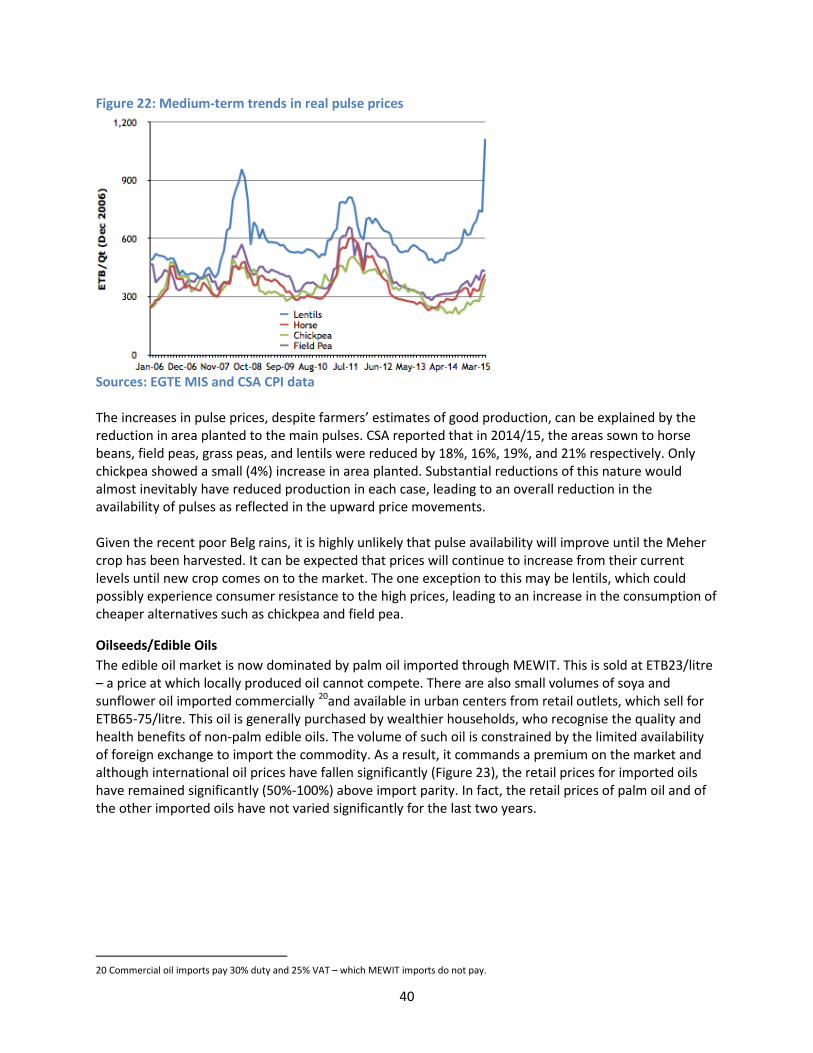
40
Figure 22: Medium-term trends in real pulse prices
Sources: EGTE MIS and CSA CPI data The increases in pulse prices, despite farmers’ estimates of good production, can be explained by the reduction in area planted to the main pulses. CSA reported that in 2014/15, the areas sown to horse beans, field peas, grass peas, and lentils were reduced by 18%, 16%, 19%, and 21% respectively. Only chickpea showed a small (4%) increase in area planted. Substantial reductions of this nature would almost inevitably have reduced production in each case, leading to an overall reduction in the availability of pulses as reflected in the upward price movements. Given the recent poor Belg rains, it is highly unlikely that pulse availability will improve until the Meher crop has been harvested. It can be expected that prices will continue to increase from their current levels until new crop comes on to the market. The one exception to this may be lentils, which could possibly experience consumer resistance to the high prices, leading to an increase in the consumption of cheaper alternatives such as chickpea and field pea.
Oilseeds/Edible Oils The edible oil market is now dominated by palm oil imported through MEWIT. This is sold at ETB23/litre – a price at which locally produced oil cannot compete. There are also small volumes of soya and sunflower oil imported commercially 20and available in urban centers from retail outlets, which sell for ETB65-75/litre. This oil is generally purchased by wealthier households, who recognise the quality and health benefits of non-palm edible oils. The volume of such oil is constrained by the limited availability of foreign exchange to import the commodity. As a result, it commands a premium on the market and although international oil prices have fallen significantly (Figure 23), the retail prices for imported oils have remained significantly (50%-100%) above import parity. In fact, the retail prices of palm oil and of the other imported oils have not varied significantly for the last two years.
20 Commercial oil imports pay 30% duty and 25% VAT – which MEWIT imports do not pay.

41
Figure 23: International wholesale prices of edible oils
Source: Index Mundi This commercial market structure has created an opening for locally produced oil derived from rapeseed, cotton seed or linseed, with the addition of niger seed in some cases to add a preferred traditional flavour21. Local processors are able to produce blended oils that are perceived to be superior in taste and health benefits to palm oil and can be sold at prices ranging from ETB49 – ETB55 per litre. This price undercuts the commercially imported oil and allows processors access to a market of consumers who do not want to use palm oil, but cannot afford the price of imported oil. This market appears to be considerable22 and processors report that they are now achieving higher capacity utilisation than they have been able to do for the last ten years. Demand for the locally produced blended oil remains greater than supply, which is currently limited by the supply of oilseeds. Despite the consistent market for oilseeds, but possibly because the market is based around a limited number of commercial processors who can sell into the urban markets, the areas sown to oilseeds declined in 2014/15. CSA reported the areas of niger seed, linseed, and rapeseed to have declined by 11%, 14%, and 32% respectively. Given this combination of consistent demand and diminishing supply, it is unsurprising that oilseed prices have risen significantly over the last 12 months (Figure 24).
21 Pure niger seed oil is not widely produced. It is not only expensive, but processors report that the niger seed is most profitable when used as a flavouring with other oils. 22 It is important to note however that the market for domestically produced oil only exists because of the limited availability and premium price of imported quality oil. If foreign exchange were to be freely available the import parity price would be reduced to approximately ETB40/litre. It is unlikely that locally processed oil would be competitive at this price.

42
Figure 24: Recent wholesale price trends for oilseeds (Addis Ababa)
Source: EGTE MIS In real terms, the wholesale prices of niger seed, linseed, and rapeseed have increased by 71%, 59%, and 73% over the 12 months to June 2015 (Figure 25). These are the highest prices achieved by any of the oilseeds since 2009. Figure 25: Real wholesale oilseed price trends (Addis Ababa)
Source: EGTE MIS Oilseeds are produced almost exclusively in the Meher season. Hence, it is unlikely that oilseed prices will decline until the new crop comes onto the market in November/December. Until then, prices will remain high, although further increases are unlikely given that the price of commercially imported oils 23can impose a ceiling upon the price of domestically produced oil and in turn upon the price of oilseeds. At generic prices of ETB2300/Qt and extraction percentages of around 30%, this ceiling has already been reached and it is possible that processors are paying at or above the ceiling price in order to maintain throughput. The domestic oilseed market notwithstanding, prices of edible oil have remained broadly constant throughout the last year. As indicated above, the market consists of three tiers. The lowest tier being palm oil imported by MEWIT and distributed through its 33 outlets to consumer associations and retail
23 Local oilseed prices are already theoretically well above import parity if palm oil is used as the comparator.

43
outlets for sale at ETB 23/litre. The volume imported by MEWIT is substantial (435,000 MT) and distribution is intended to reach the entire population, although the RRA did receive reports that this was not always the case. The second tier consists of domestically produced oil that is sold at a price just under that of commercially imported oil, i.e. ETB 45-55/litre. It is of limited availability (estimates by processors themselves suggest the total volume to be no more than 25,000 MT) and distributed almost exclusively through urban outlets. The third tier is that of commercial imports of soya and sunflower oil. Customs data suggests that this is no more than 7,500 MT in total. It is possible that some contraband oil of the same quality enters the market from the east, but it is unlikely that the total imported volume exceeds 10,000 MT. This oil is sold for prices of ETB 65-75/litre. There are two other sources of edible oil consumed in Ethiopia. The first is locally processed oil from village or household presses. This volume is unknown, and may be considerable. In fact, most of the oilseed produced in Ethiopia is coarsely crushed and used within the household for the seasoning of food. The volume that is actually traded as oil is however considered to be negligible. The second source is oil supplied as food aid (almost exclusively by the United States). This is generally the highest quality oil on the market. As a refined and fortified soya oil, it is much prized by local restaurants and commands a premium price of ETB80/litre or above. Volumes are limited however; in 2014, only 8,000 MT of such oil was imported.
Factors Affecting Grain Supply Traders were asked to note the two most important factors affecting the supply of different grains to the market (Table 14). The results show that the level of local production is the dominant factor in PSNP woredas, but price tends to be as important and in some cases more important in non-PSNP woredas. Table 14: Factors affecting the supply of grains to the market Crop Teff Wheat Maize Sorghum Pulses Woreda type (number of respondents)
PSNP (272)
Non-PSNP (147)
PSNP (212)
Non-PSNP (111)
PSNP (255)
Non-PSNP (115)
PSNP (212)
Non-PSNP (64)
PSNP (266)
Non-PSNP (113)
Local production
35% 26% 34% 32% 34% 21% 37% 25% 37% 35%
Current prices 26% 33% 23% 32% 24% 34% 23% 22% 27% 33% Farmers’ cash needs
12% 8% 11% 11% 9% 8% 5% 8% 14% 9%
Farmers’ storage capacity
1% 0% 2% 2% 4% 3% 6% 19% 1% 1%
Farmers price expectation
17% 22% 14% 14% 9% 22% 9% 20% 14% 11%
Farmers’ food security concerns
6% 10% 14% 7% 17% 9% 20% 5% 6% 9%
Other 4% 2% 3% 3% 3% 4% 0% 2% 3% 4% Source: RRA 2015 Overall responses were quite similar between PSNP and non-PSNP woredas. Significantly, farmers’ cash needs (once considered a key driver of supply) rank below considerations of production or price. Nevertheless, one noticeable difference can be seen in the relative importance of price expectations and food security concerns for maize and sorghum. In PSNP woredas, food security concerns are twice as important as price expectations, while in non-PSNP woredas the reverse is the case. This may highlight

44
the importance of these two cereals to the food security of vulnerable households rather than as cash crops.
Deficit Market Conditions For a Bellmon determination that might allow for the use of cash transfers, it is important to understand the characteristics of deficit markets. To this end, a more detailed analysis was undertaken of the market structure in ten deficit woredas, viz: Gulomekeda Kilte Awlalo Raya Azebo Delanta Gidan Goro Gutu Grawa Siraro Simada Tach Gayint Melkabelo The RRA followed the same procedures in these woredas as elsewhere, but additional questions were asked of traders and smallholders. To determine the extent of market development in these woredas, traders were asked to estimate the number of major grain markets, assemblers and Isuzu traders active in the woreda. The number of licensed traders was obtained from woreda authorities, with the following results: Table 15: Number of market participants per woreda
Woreda Number of Important Grain Markets
Number of Assemblers
Number of Isuzu Traders
Number of Licensed Traders24
Gulomekeda 4 0 0 12 Kilte Awlalo 4 90 0 30 Raya Azebo 3 200 0 35 Delanta 5 120 8 30 Gidan 6 0 0 84025 Goro Gutu 3 0 0 3 Grawa 3 0 0 6 Siraro 10 0 10 52 Simada 8 0 15 311 Tach Gayint 6 250 5 320 Melkabelo 2 0 0 15
Source: RRA data and Woreda Offices of Trade and Industry All the woredas assessed had enough active markets and market participants26 to suggest that even though these were (with the exception of Raya Azebo) remote woredas, active trade was being conducted in all areas and that if PSNP beneficiaries were provided with cash, they would be able to purchase food.
24 All traders operating with a fixed place of business are licensed. Some Isuzu traders are not licensed, but the proportion has not been estimated. 25 The high number of traders in Gidan and Tach Gayint may be due to the fact that many have been licensed but are inactive. In Simada, which exports oilseeds, any trader handling oilseeds must be licensed and the figure quoted by the authorities there may be more accurate. 26 The number of retail outlets was not collected since this was much harder to assess, but the presence of traders in such deficit areas implies that they would be supplying retail outlets. Moreover, it is important to note that not only assemblers, but also traders and indeed producers themselves will sell to consumers.

45
The presence of market participants appears to be strengthening. Eighty-five percent of traders in these more remote woredas noted an increase in the number of assemblers, Isuzu traders, and licensed traders over the last three years, by more than 10%, 5%, and 10%, respectively. Significantly, food aid distribution occurred in all of these woredas throughout the period of increase. Farmer’s sales outlets varied considerably between PSNP and non-PSNP woredas, (Figure 26) Figure 26: Farmers sales outlets
Source: RRA 2015 Farmers in PSNP woredas sold most (58%) of their produce directly within the locality, with almost 40% being sold to consumers and almost 20% to retailers. By contrast, growers in non-PSNP areas sold only 38% for direct consumption or retail. As might be expected, growers in non-PSNP woredas sold a higher proportion of their produce to wholesalers. The proportion sold to cooperatives in PSNP woredas was much less at 4.9% than 12.7% in non-PSNP woredas. The proportion of grain sold to millers was small (1.1% in PSNP woredas and less than 1% in non-PSNP woredas) as was the proportion sold to EGTE, despite the fact that traders considered both outlets to be important in the market. Clearly growers do not commonly deal with these outlets directly. The proportion sold to ECX was less than 0.1% in both areas. To triangulate the above responses, consumers were asked to indicate the sources of their cereal intake. Respondents indicated that when locally produced grain is available in the area, they typically purchase directly from farmers, but also to a lesser extent from other local sources including assemblers27, cooperatives, and local grain retailers. When producer supplies become exhausted, consumers then rely increasingly upon local retail outlets, which are supplied primarily (49%) by local traders with warehouse storage, although some retailers also access supplies from traders in surplus areas (20%) and from larger traders in towns nearby (13.3%). Local traders in turn rely initially upon local cereal production, but when that becomes insufficient, they turn to three main sources, viz. larger traders in nearby towns (19%), traders in Addis Ababa (14%) and traders in surplus areas (56%). Significantly, the local traders do not source cereals from either assemblers or Isuzu traders in surplus areas. For the remote sourcing of cereals (i.e. from Addis Ababa or surplus areas) retailers and local traders generally use the services of
27 Purchases from assemblers could be considered as retail purchases, except that grain obtained from this source would be unsorted and would probably be sold only in larger volumes than those sold by traditional retail outlets.
46
a broker who can identify potential sources of grain, coordinate supply and facilitate payment (but without taking ownership of the commodity). The main route by which cereals from surplus areas reach the consumer during periods of deficit is from a trader in the surplus area, via the services of a broker to a local trader with a warehouse, and thence to a retail outlet for domestic purchase. For pulses, consumers purchase from producers, assemblers, local wholesalers and retail outlets. Once local production has been absorbed, retailers rely upon large traders in nearby towns (53%), as well as local traders with warehouses (31% ) and in some cases, producers in surplus areas (16%). Local traders in turn source pulses from large traders in surplus areas (55%), larger traders in nearby towns (20%), traders in Addis Ababa (13%) and producers in surplus areas (12%). It was evident however, that deficit conditions were markedly less frequent and such outsourcing was less common for pulses than for cereals. Traders in deficit areas were asked to indicate their sources of supply when local production had been exhausted noting the distance and cost involved. Of the ten woredas canvassed, Raya Azebo, Simada and Tach Gayint actually contained both surplus and deficit areas so that overall there was no inflow, but for seven woredas it was clear that cereals were frequently sourced first from larger traders in local markets and ultimately from large traders in surplus production areas or central markets such as Dessie or Addis Ababa. The distances and additional costs involved are noteworthy – up to 960 km (from Bichena to Gulomekeda) and up to ETB200/Qt (from Nekempt to Grawa). Grain would not move to these deficit markets unless the price there could accommodate the transport cost and hence the data indicate both a wide spread and a substantial increase in cost that must occur during the season as a deficit woreda shifts from reliance upon own production to imported grain. It also indicates that the capacity to pay the higher prices exists in those more remote areas. The seasonality of grain movement to deficit markets was also assessed. Traders reported grain movement during all months of the year, but the greatest volumes were moved during January and February.28 By contrast, when considering pulses, it was seen that only five of the ten woredas canvassed were actually regularly deficit in pulses and that in these woredas, when local supplies were exhausted, additional pulses could be sourced from much closer markets and at a lower price differential. These data suggest that the production and marketing of pulses is more widely dispersed throughout the country than that of cereals so that the impact of local deficit upon price is significantly less than that of a local cereal deficit. Given the increased emphasis within the PSNP upon the consumption of pulses, this conclusion is potentially highly significant. Its more widespread validation would significantly enhance our understanding of the impacts of local grain deficits. Distance to markets Focus groups of smallholders in PSNP woredas were asked how far they must travel to reach the nearest market for different commodities. Maximum distances varied from 55 km for wheat and oil to 75km for pulses. (Table 16)
28 This last year has been an exception to this observation with movement occurring later in the year.

47
Table 16: Distances to markets
Average distance from the community to the nearest market selling wheat (km)
Average distance from the community to the nearest
market selling pulses (km)
Average distance from the community to the nearest market
selling oil (km)
Mean Minimum Maximum Mean Minimum Maximum Mean Minimum Maximum Tigray 10.25 5.00 18.00 10.18 5.00 18.00 10.18 5.00 18.00 Amhara 11.15 1.00 55.00 11.24 1.00 55.00 10.36 1.00 55.00 Oromiya 9.58 1.00 28.00 12.06 0.00 75.00 10.08 0.00 36.00 SNNPR 4.20 0.00 12.00 4.20 0.00 12.00 4.20 0.00 12.00 Dire Dawa 21.00 7.00 35.00 21.00 7.00 35.00 21.00 7.00 35.00
Source: RRA 2015 These figures suggest that the provision of cash instead of food might significantly inconvenience some beneficiaries if they are obliged to travel such distances in order to buy the necessary food (although data regarding the significance of cash transfers would suggest that they must be doing this already). Nevertheless, traders’ responses (shown in Figure 29) suggest that although they will move grain a considerable distance in order to reach lucrative markets, they will not do so unless the demand is large enough to justify the cost of sending a full truck of grain. The grain sourcing experience of a deficit production household in a PSNP area varies through the season as follows:
1. For the first months the household can rely upon their own production, holding some back for unforeseen emergencies29.
2. Next, when their own supplies have been depleted, they can often source grain directly from neighbours who have produced more. This may be by barter or purchase, but the cost of transport to market and of aggregation can be discounted from the market cost. This is the cheapest grain that a household can actually buy and a major component of the total grain marketed, although it is completely informal.
3. Once local sources have been depleted. The smallholder can source grain from local retail outlets. These may have been supplied by local farmers or by traders aggregating from local farmers. There is an additional cost of transport to market as well as of bagging, aggregation and sorting, plus the retail (and if relevant, trader) margins to be covered. The local market is substantially more expensive than in-village purchases. (The RRA found in March that retail outlets in Nekempt sold maize at ETB5/kg while some farmers in surrounding areas where selling at as low as ETB280/Qt).
4. Once local markets have exhausted local production and there is no more grain flow from nearby farmers, local traders will purchase grain from surplus areas for sale to retail outlets. Some of the largest traders will place agents in the surplus areas and buy directly, but in the majority of cases, traders will operate through a local broker who has contacts (other wholesale traders) in the surplus areas. The deficit smallholder must then buy from a retail outlet supplied by a local trader in turn supplied via a broker by a wholesale trader in a surplus area. The cost must now include the margins of the retailer, traders and brokers’ commission, as well as the much more substantial transport costs from surplus to deficit area.
29 The length of this period will vary according to the extent of own production, with the most vulnerable households having nothing and being immediately market dependent. This study was unable to find any additional data to determine the average length of this period.

48
In sum, the supply chain to a consumer can vary from being direct from the producer (no links) to one which most commonly has four links excluding producer and consumer, (i.e. trader, broker, trader, retailer), and may have five if the trader sources from an assembler or Isuzu trader. This variation in grain supply costs is important. It means that for a household in a deficit area, annual price variation is not dependent simply the seasonal average wholesale price variations recorded by EGTE or other institutions at key markets. Instead that household experiences much greater price fluctuation as the household’s source of supply becomes increasingly distant through the season. There is also a degree of unpredictability in the system since it is difficult to determine when local supplies will become exhausted and prices will move up as local markets begin to source from remote areas. The chain of supply has often been criticised30 as being too lengthy and adding too much cost to the detriment of producer and consumer alike. It is difficult to see how this situation might be remedied given two major structural constraints to the market. The first is the small size of many producer holdings that necessitates the intervention of an assembler or Isuzu trader to aggregate producer volumes. Traders indicated that the cost of purchasing small lots of grain from small local markets amounted to ETB50-60/Qt (Table 17). Table 17: Costs to Nekemt trader of purchasing small lots of maize from farmers in Gutin Item Cost (ETB/Qt) Producer price at the market in Gutin 280 Sorting and weighing 5 Bagging 5 Loading 6 FOB Gutin 296 2% withholding tax 6 Transport to Nekemt (35km) 25 Offloading 5 FOB Nekemt 332 Operating Cost 52 Source: RRA Trader interviews Taken together with the trader’s own profit margin (of at least 2.5%, or ETB 8/Qt), the cost of cleaned grain available in wholesale volumes of 20 MT or more (the wholesale price) must be at least ETB60/Qt higher than the price received by the smallholder. If a farmer has produced a volume that is large enough for the trader to purchase directly, this margin could be substantially reduced, but in fact the going price is set by the larger numbers of small parcels and larger smallholders do not sell more cheaply. Instead they benefit from the savings, although they must themselves bear the burden of cleaning, weighing and bagging grain. The second aspect of the market that introduces additional cost is its lack of social integration and trust. Specifically the Regional nature of Ethiopia, wherein language barriers may prevent traders from different Regions from communicating directly with one another, brokers provide an essential function in facilitating trade between parties who would otherwise be unable to do business directly. Certainly,
30 See for example: Shahidur Rashid, S., Meron Assefa , M., and Ayele, G. (2008) : Distortions to Agricultural Incentives in Ethiopia International Food Policy Research Institute (IFPRI) and Ethiopian Development Research Institute.

49
traders in surplus areas would be wary of sending a truck of grain to a deficit area without payment in advance, but the presence in that area of a broker who they trust allows them to sell to a range of buyers – provided those buyers are also trusted by the broker. The barriers of distance, communication and trust that would otherwise stifle the market, are thus overcome by brokers, but at a cost. The broker does not take ownership of grain, but relays price information to the seller and buyer, and facilitates payment to the seller upon delivery. The broker is thus in a position to manipulate the price information and payment amounts to his own advantage, albeit at the risk of destroying the one essential characteristic of his occupation - trust. Brokers charge a commission for their services which, if they themselves are to be believed is of the order of 2%, i.e. not excessive. Both sellers and buyers indicate that the brokers that they use take more than the stated percentage, i.e. their trust is qualified, but they continue to use them. This is not unreasonable, mobile phones allow sellers and buyers to check on historical market prices to confirm their brokers’ offers, while competition between brokers will tend to minimise excessive profiteering, but the fact remains that brokers constitute an additional burden to the market chain, made necessary by the difficulties of communication and lack of trust within the market. Ultimately the consumer in deficit areas is obliged to absorb at least part of that additional cost. Food Availability Focus groups were asked if the main four cereals were available to them. The overwhelming response was that maize, wheat, teff and sorghum could be found in most markets (Figure 27). Figure 27: Focus groups assessment of cereal availability.
Source: RRA 2015 Focus group responses showed that because of price, wheat and teff were less easily accessed in PSNP woredas, while maize and sorghum were generally more accessible. There was no PSNP woreda for which focus groups reported that maize was completely unavailable. All four cereals were available in all non-PSNP woredas. In nine PSNP woredas, some cereals were typically not available (Table 18).

50
Table 18: List of woredas in which focus groups reported the complete absence of one or more cereals. Region Zone Woreda Kebele Crop Oromiya East Hararghe Deder Meda Jalela Teff Oromiya East Hararghe Meiso Adakeneni Teff Oromiya East Hararghe Meiso Deneba hundemisma Teff Oromiya East Hararghe Meta Biki Wheat Oromiya East Hararghe Meta Biki Sorghum Amhara Oromiya Zone Dewa Chefa Serte Wheat Amhara Oromiya Zone Dewa Chefa Haro Bakelo Wheat Dire Dawa Dire Dawa Dire Dawa Boren Teff Dire Dawa Dire Dawa Dire Dawa Awale Teff Source: RRA 2015 In all cases except one31, the cereals that were unavailable were wheat or teff, neither of which is regarded as absolute necessities by PSNP beneficiaries. Based on RRA responses, there is no reason to believe that PSNP households in the surveyed woredas would be unable to buy sufficient maize and/or sorghum if given cash transfers rather than food. In order to triangulate the focus group responses described above, traders in PSNP woredas were asked if cereals, pulses and edible oil were available in all parts of their woredas all the year round. Strong positive responses were recorded for cereals in Tigray and SNNPR32, but in other Regions and for the other commodities, the responses were weaker (Figure 28). Edible oil in particular was reported to be consistently present in only a very small number of PSNP markets in Tigray. Even in Oromiya, it was only consistently reported in 50% of markets. Consistent supplies of pulses were reported more commonly, but even so, the coverage was only 50% in Tigray and Oromiya. Figure 28: Consistency of Availability of Commodities - Proportion of Traders answering “no” to the question “Are there areas in this woreda where cereals/pulses/edible oil are not found all the year round?”
Source: RRA 2015
31 The enumerators did not believe this was the correct response given that at the time, sorghum was widely available throughout East Hararghe. Rather it appeared that it was too expensive for the respondents. 32 The responses in this case would have been 100% were it not for a small number of traders who did not know.
0.0%
20.0%
40.0%
60.0%
80.0%
100.0%
120.0%
Tigray(33)
Amhara(50)
Oromiya(58)
SNNPR(16)
% T
rade
rs R
espo
ndin
g
Cereals
Pulses
Edible Oil

51
When asked why some markets might be devoid of commodities, traders provided a range of replies (Figure 29). For grains, many of these related to the cost effectiveness of supplying small markets of limited purchasing power, indicating that an adequate cash transfer might resolve some but not all of the constraints. For edible oil, it was clear that the key constraints to supply related more to the GoE supply mechanism for palm oil and the fact that it was not market driven, but relied instead upon 33 key outlets supplied by MEWIT who would then sell to consumer associations at a fixed price, for retail at a fixed margin. Margins are small and the cost of distributing small volumes of oil considerable distances without the possibility of adequate remuneration has markedly restricted the distribution of edible oil to the sparsely populated and more remote areas. Figure 29: Reasons given by traders why an area may not be supplied with grains or oil
Source: RRA 2015 The responses of traders shown in Figure 29 are significant in that they show the relative importance of four factors upon traders’ decisions to supply a market with cereals33. Although they are inter-related, poverty (14 respondents) and the cost of transport (11 respondents) are two important factors, but both are less important that the overall size of demand as affected by the size of the market, (17 respondents to questions 1 and 4). This suggests that even if the PSNP transfer is enough to meet the costs of grain, (including the costs of transport), unless the population is large enough to justify the purchase of haulage, grain will not move into an area. Instead, the people will be obliged to move out of the area to find it. By contrast to the above three factors, the impact of food aid transfers (3 respondents) is quite small. Clearly there are some areas where from a trader’s perspective, cereals and pulses are not commercially available. This does not necessarily mean that they could not be obtained at all, and this assessment would put more weight upon the responses of the focus group respondents. Nevertheless it cannot yet be said with 100% confidence that cash would be able to meet the needs of all beneficiaries in all areas. Access to Credit Limited access to credit can be a constraint to traders’ activities. Bellmon analyses conducted ten years ago, found that less than 35% of traders were able to access commercial credit. That situation has now changed considerably. In 2015, 62% of traders were able to access credit, 16% did not need it and only 22% were unable to access credit. Importantly, the RRA assessed access to commercial credit only; there
33 The distortion of the oil market by GoE imports prevents reliable conclusion being drawn from the responses for oil.
52
are other channels through which traders may access credit, including supplier credit or via other informal sources such as from family or friends. According to 63% of traders, this generally favorable situation has changed little since 2014, while 3% reported that credit had become more available in the last 12 months, but 34% felt that credit had become harder to obtain. Of this last group, 25% indicated that reduced access to credit had no effect on their business, but 53% reported that their business volumes were reduced as a result of decreased credit access, while 22% reported that a reduction in credit obliged them to buy and sell smaller volumes more frequently but their turnover remained unchanged. There are some differences between traders in PSNP and non-PSNP woredas. In general, credit is not accessible by 25% of traders in PSNP woredas as compared with only 16% of traders in non-PSNP woredas. Reasons for not being able to access credit were also different. In PSNP woredas, lack of collateral was quoted by 25% of respondents as opposed to 7% in non-PSNP woredas, while high interest rates were quoted by 26% of traders in PSNP woredas, but 52% of traders in non-PSNP woredas. Traders in both PSNP and non-PSNP woredas blamed high other bank charges (i.e. legal fees, arrangement fees and other administrative charges) to a similar extent, but traders in PSNP woredas also blamed poor communication with banks. Overall, the RRA results suggest that while the credit situation has improved over the last ten years, traders in PSNP woredas are somewhat disadvantaged as compared with their colleagues in non-PSNP woredas. Credit constraints limit the business capacity of approximately 16% of traders in PSNP woredas as compared with only 5% of those trading in non-PSNP woredas.

53
Food Security Household food security is considered from a number of perspectives including not only access to food, but also the availability of employment and wage rates. The majority of focus groups indicated that household food security would increase following the 2014/15 harvest. Nevertheless, responses varied considerably by Region. In Tigray, all focus groups expected to be more food secure, but in SNNPR, only 21.4% o groups expected to be so. (Table 19). When disaggregated by woreda status, the majority of both PSNP and non-PSNP woredas reported the same expectation, although the response (that food security would increase after the 2014/15 harvest) was more frequent amongst non-PSNP woredas. Table 19: Focus group expectations of relative food security level Region Less Food Secure No Change More Food Secure Tigray (n=22) 0.0% 0.0% 100.0% Amhara (n=58) 29.8% 15.8% 54.4% Oromiya (n=71) 38.0% 14.1% 47.9% SNNPR (n=14) 42.9% 35.7% 21.4% Woreda Status PSNP (n=108) 37.0% 19.4% 43.5% Non-PSNP (n=57) 17.5% 7.0% 75.4% Source: RRA 2015 The reasons for improved food security varied between regions Table 20). In Tigray especially, the increased food security was more related to increased purchasing capacity through reduced costs of food and increased wage levels. Table 20: Reasons cited for increased food security by Region Region Tigray Amhara Oromiya SNNPR Number of groups responding 22 31 36 3 Improved Yields this season 0% 67.7% 75% 100% GoE and donor programs 0% 9.7% 11.1% 0% Improved access to markets 0% 12.9% 0% 0% Decline in food prices 18.2% 6.5% 0% 0% More employment opportunities 0% 0% 8.3% 0% Higher wage levels 81.8% 0% 0% 0% Better cash crop prices 0% 0% 2.8% 0% Better livestock prices 0% 3.2% 0% 0% Higher levels of remittance 0% 0% 2.8% 0%
Source: RRA 2015 But in the other regions increased agricultural productivity was the dominant factor. When disaggregated by woreda status, the impact of increased productivity was seen to be far greater in non-PSNP than in PSNP woredas. (Table 21) Table 21: Reasons cited for increased food security by Woreda status
Woreda Status PSNP Non-PSNP Number of groups responding 49 43 Improved Yields this season 30.6% 83.7% GoE and donor programs 8.2% 7%

54
Improved access to markets 0% 9.3% Decline in food prices 12.2% 0% More employment opportunities 6.1% 0% Higher wage levels 36.7% 0% Better cash crop prices 2% 0% Better livestock prices 2% 0% Higher levels of remittance 2% 0%
Source: RRA 2015 In PSNP woredas, improved food security was most frequently related to employment, i.e. increased employment opportunities and higher wage levels, which were reported to be the primary factor by 43.8% of PSNP woredas. Not all woredas anticipated increased household food security in 2015. 30% of all groups canvassed expected that there would be no change in food security and 30% expected food security to be reduced. Although 2014/15 has clearly been at least as productive overall as 2013/14, the fact that as many as 30% of focus groups nevertheless expected their food security to be reduced highlights the heterogeneity of the rural population. When considering reduced food security, the sample size is smaller and the data less conclusive. Nevertheless, on a Regional basis, reduced production in the Belg and Meher seasons was the most common causal factor quoted for reduced food security, with the Meher being more significant than the Belg. Otherwise, the reduced availability of land (itself a factor of production) was most important (Table 22). Table 22: Reasons cited for reduced food security by Region Region Amhara Oromiya SNNPR Number of groups responding 17 28 6 Reduced availability of land 35.3% 14.3% 33.3% Lower yield in Belg season 5.9% 25.0% 33.3% Lower yield in Meher season 52.9% 46.4% 33.3% Higher prices or inaccessible inputs 5.9% 10.7% 0% Higher food prices 0% 3.6% 0%
Source: RRA 2015 When assessed according to woreda status, only one major difference was observed, namely that the impact of lower yield in the Meher season was much greater in PSNP woredas, than in non-PSNP woredas (Table 23). Table 23: Reasons cited for reduced food security by Woreda Status Woreda Status PSNP Non-
PSNP Number of groups responding 40 11 Reduced availability of land 25.0% 18.2% Lower yield in Belg season 20.0% 18.2% Lower yield in Meher season 52.5% 27.3% Higher prices or inaccessible inputs 2.5% 27.3% Higher food prices 0% 9.1%
Source: RRA 2015
Wage Labor

55
Traders indicated that unskilled wage rates had increased across all regions. Overall, the rate of increase was 27%, which significantly exceeds the rate of inflation and in real terms wages appear to have increased by 15%. Table 24: Traders’ estimates of wage rates by Region Region Current Unskilled Peri-
urban Daily Wage Unskilled Peri-urban
Daily Wage Last Year % Increase
Tigray 66.76 55.30 20.7 Amhara 57.78 44.32 30.4 Oromiya 60.16 47.81 25.8 SNNPR 53.57 38.40 39.8 Mean 59.88 47.03 27.3 Source: RRA 2015 Farmers generally reported lower wage rates (except for Tigray where rural rates are skewed by the wages paid to sesame workers) and lower rates of increase overall (of 21%, or 11% in real terms). Table 25: Smallholders’ estimates of wage rates by Region Region Current Unskilled Rural
Daily Wage Unskilled Rural Daily
Wage Last Year % Increase
Tigray 72.5 60 20.8 Amhara 51.5 40 27.2 Oromiya 49.9 43 16.8 SNNPR 45.4 35 41.7 Mean 53.4 44 20.8 Source: RRA 2015 When disaggregated into PSNP and non-PSNP woredas, average wage rates were similar: Table 26: Smallholders’ estimates of wage rates by woreda status Current Unskilled Daily
Wage Unskilled Daily Wage
Last Year % Increase
PSNP (peri-urban) 59.6 48.2 23.6 PSNP (rural) 55.5 46.0 20.1 Non-PSNP (peri-urban) 60.4 44.7 28.4 Non-PSNP (rural) 49.5 39.0 26.2 Source: RRA 2015 The availability of labor varied from region to region. Traders in Tigray universally reported that it had become easier to find labor compared to the same time last year, and farmers concurred (Figure 30).

56
Figure 30: Traders’ assessment of the relative ease of hiring labor
Source: RRA 2015 By contrast, a majority of both traders and farmers in SNNPR found that the labor situation had tightened, while Amhara and Oromiya showed a similar but less pronounced trend. In PSNP woredas there was no discernible difference, but in non-PSNP areas, a majority of traders reported that labor had become harder to find (Table 27) Table 27: Farmers assessment of the availability of labor as compared with the previous year. More Available Less Available No change
PSNP (n-110) 51% 35% 14% Non-PSNP (n=58) 9% 67% 24%
Source: RRA 2015 The labor price and availability trends show levels of increase that suggest the labor market is tightening. This may be a result of increased demand for agricultural labor (for weeding, fertilizer application or harvesting), or of reduced supply as marginal smallholders who have produced more from the last season are less obliged to work to achieve food security, or a combination of both factors. The RRA was not sufficient to determine the cause but it is clear that the observed increases in wage rate exceeding the rate of increase of both the general and the food CPI will have improved food security levels amongst those vulnerable households that have labor capacity.
Consumption The last CSA Household Income, Consumption and Expenditure Survey undertaken in 2010/11 indicated marginally reduced consumption of cereals, reduced consumption of meat and increased consumption of edible oil as compared with 2004/05. Focus groups were asked to indicate if these trends had continued by asking them to compare household consumption of key staples, edible oil and meat over the last two years, with their consumption five years previously. At a national level, the consumption of maize and edible oil has increased in a majority of woredas, as has that of wheat and teff, albeit to a lesser extent, while the largest proportion of woredas noted a reduction in the consumption of meat (Table 28).
33
24 24 3
65 19
0
24 27
0
33
18
0
39 48
14
59 43
0%10%20%30%40%50%60%70%80%
90%100%
% T
rade
rs R
epor
ting
Harder
No change
Easier

57
Table 28: Proportions of focus groups noting changes in the consumption of key commodities. Commodity Number of
groups responding
Increased No Change Decreased Don’t eat
it
Maize 138 73.9% 15.2% 10.1% 0.7% Wheat 135 57.0% 20.0% 19.3% 3.7% Teff 144 51.4% 11.1% 29.2% 8.3% Edible Oil 158 71.5% 4.4% 24.1% 0.0% Meat 156 26.9% 25.0% 42.9% 5.1%
Source: RRA 2015 These trends were broadly consistent at a Regional level, although in Tigray, the majority of woredas reported a reduction in the consumption of teff and 100% reported an increase in edible oil consumption. SNNPR reported the largest proportion (79%) of focus groups in SNNPR reported a decrease in the consumption of meat. When disaggregated by woreda status, it is evident that while a majority of PSNP households have increased their consumption of cereals, the most widespread increase has been in the consumption of maize. The consumption of teff has decreased in as many PSNP households as it has increased (and 11% of PSNP focus groups reported that teff is not consumed at all). Non-PSNP households reported the same trends, but a consistently greater majority of woredas reported increased consumption in each case (Table 29). Table 29: Changes in the consumption of key staples by woreda status
Commodity Woreda status Increased No change
Decreased Don't eat it
Maize PSNP 89 66.3% 19.1% 13.5% 1.1%
Non-PSNP 49 87.8% 8.2% 4.1% 0.0% Wheat PSNP 89 47.2% 24.7% 22.5% 5.6%
Non-PSNP 46 76.1% 10.9% 13.0% 0.0% Teff PSNP 89 38.2% 12.4% 38.2% 11.2%
Non-PSNP 55 72.7% 9.1% 14.5% 3.6% Edible oil PSNP 103 67.0% 5.8% 27.2% 0.0%
Non-PSNP 55 80.0% 1.8% 18.2% 0.0% Meat PSNP 100 17.0% 32.0% 43.0% 8.0%
Non-PSNP 56 44.6% 12.5% 42.9% 0.0% Source: RRA 2015 The consumption of edible oil has increased in majorities of both PSNP and non-PSNP woredas, while the consumption of meat has declined in the majority of PSNP woredas and has decreased in almost as many non-PSNP woredas as it has increased. When asked to provide reasons for these trends, the largest proportion of respondents in PSNP woredas noted the main reason for increased maize consumption was that it was cheaper than other commodities. Only 16% of respondents related the increased consumption to increased own production. This suggests that some of the increase in maize consumption might have occurred as a substitute for other cereals, especially wheat and teff whose prices have risen more. Unfortunately the RRA did not assess any substitution effects.

58
Table 30: Reasons for the increase in consumption of different commodities in PSNP woredas Reason Maize Wheat Teff Edible
Oil Meat
Number of groups responding 55 39 34 64 19 Price is lower than other foods 80% 13% 12% 6% 15% Increased production 16% 55% 56% 2% 4% Increased income 6% 12% 15% 51% Improved lifestyle 4% 3% 5% 15% 10% Improved market availability 20% 15% 50% 10% Available from the PSNP 3% 12% Source: RRA 2015 By contrast, increased production was noted most frequently as the main reason for the increased consumption of wheat and teff, while improved market availability was the reason given most frequently for the increased consumption of edible oil, and increased income was the cause for the increased consumption of meat (where it had occurred. In non-PSNP woredas, while price is still a major factor affecting maize consumption, it was own production that was most frequently reported as the main factor and this was still more pronounced in the cases of wheat and teff (Table 31). Table 31: Reasons for the increase in consumption of different commodities in non-PSNP woredas Reason Maize Wheat Teff Edible
Oil Meat
Number of groups responding 43 35 40 43 23 Price is lower than other foods 37% 6% 5% 0 0 Increased own production 49% 74% 77% 16% 43% Increased income 9% 11% 10% 40% 53% Improved lifestyle 5% 3% 0 9% 0 Improved market availability 3% 3% 35% 4% Staple food 3% 5% 0 Source: RRA 2015 For edible oil, increased income and increased market availability were the main reasons why consumption has increased, while for meat, increased income was the dominant factor. Where consumption had decreased, it was almost always in response to price rather than availability. (Table 32) Table 32: Reasons for the decrease in consumption of commodities in PSNP woredas Reason Maize Wheat Teff Edible
Oil Meat
Number of groups responding 16 35 36 31 40 Other foods are cheaper 19% 6% 3% 0 0 Price is too high 31% 36% 75% 68% 98% Reduced market availability 12% 8% 6% 26% 0 Reduced production 38% 20% 16% 6% 2% Source: RRA 2015 In non-PSNP woredas the number of respondents noting a decrease in consumption of commodities was too small to draw many conclusions (Table 33). While the number reporting a decrease was smallest for maize and greatest for meat, it was also evident that price was the most important factor and that this was most significant for meat.

59
Table 33: Reasons for the decrease in consumption of commodities in non-PSNP woredas Reason Maize Wheat Teff Edible
Oil Meat
Number of groups responding 2 6 11 11 26 Other foods are cheaper 1 1 2 0 2 Price is too high 0 2 5 5 22 Reduced market availability 0 0 1 6 1 Reduced production 1 3 3 0 1 Note: Due to the small number of respondents, absolute numbers are shown not percentages Source: RRA 2015

60
Impact of PSNP Interventions The DFAP’s implemented by USAIDs FFP implementing partners generally mirror the GoE PSNP in their interventions in that they provide beneficiaries with a transfer of food, or cash, or a combination of the two, in which the earlier transfers are cash, while food is provided later in the year (which coincides with the lean season). The cash transfer has been unconditional for 20% of beneficiaries (i.e. the aged, infirm or orphaned) and provided as cash for work for the remaining 80%. Because the PSNP and DFAP transfers have been provided in response to work performed, they are often described as a wage. This has resulted in comparisons with the prevailing unskilled wage rate on the one hand and with the cost of living on the other. In practice, neither comparison is strictly appropriate. Cash for work is a transfer modality that does not reflect actual wage rates, which at ETB40-50/day for unskilled labor are substantially higher than the rates paid under PSNP of ETB 18-24/day in 2013/14 or the recommended average rate for 2014/15 of ETB31/day. Neither does the ash transfer reflect the cost of living since it is reflects only the cost of the standard ration, ignoring all other costs that commonly make up 30% of a vulnerable household’s budget. For these reasons, both cash and food transfers can arguably be considered as two aspects of a consumptive stipend that reduces the tendency of vulnerable households to be drawn down the spiral of chronic impoverishment. The majority (87%) of traders reported noticeable impacts of cash or food distribution upon market prices. As might be expected, food distribution reduced food prices in most (88%)34 woredas, while cash distribution increased prices in all woredas. (Figure 31) Figure 31: Traders’ assessment of impact of PSNP transfers upon commodity prices
Source: RRA 2015 Focus groups of smallholders in PSNP woredas reported similar impacts. 69% of woredas reported a decrease in price following food distribution, while 88% reported an increase following the distribution of cash (Figure 32).
34 Traders in 4 woredas recorded increases in grain prices following food distribution
0.0%5.0%
10.0%15.0%20.0%25.0%30.0%35.0%40.0%45.0%50.0%
Less than5%
5% to10%
11% to20%
21% to40%
Morethan40%
% T
rade
rs R
epor
ting
Change in Price (%)
Cash (n=116)
Food (n=89)
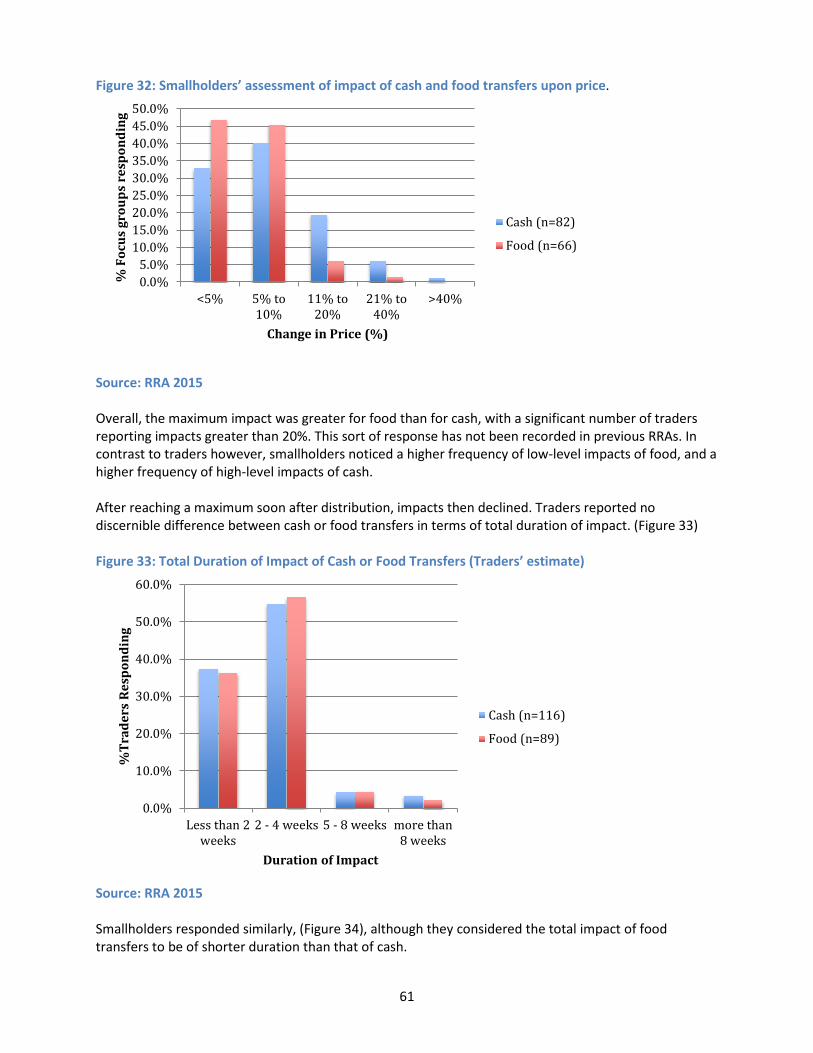
61
Figure 32: Smallholders’ assessment of impact of cash and food transfers upon price.
Source: RRA 2015 Overall, the maximum impact was greater for food than for cash, with a significant number of traders reporting impacts greater than 20%. This sort of response has not been recorded in previous RRAs. In contrast to traders however, smallholders noticed a higher frequency of low-level impacts of food, and a higher frequency of high-level impacts of cash. After reaching a maximum soon after distribution, impacts then declined. Traders reported no discernible difference between cash or food transfers in terms of total duration of impact. (Figure 33) Figure 33: Total Duration of Impact of Cash or Food Transfers (Traders’ estimate)
Source: RRA 2015 Smallholders responded similarly, (Figure 34), although they considered the total impact of food transfers to be of shorter duration than that of cash.
0.0%5.0%
10.0%15.0%20.0%25.0%30.0%35.0%40.0%45.0%50.0%
<5% 5% to10%
11% to20%
21% to40%
>40%
% F
ocus
gro
ups
resp
ondi
ng
Change in Price (%)
Cash (n=82)
Food (n=66)
0.0%
10.0%
20.0%
30.0%
40.0%
50.0%
60.0%
Less than 2weeks
2 - 4 weeks 5 - 8 weeks more than8 weeks
%Tr
ader
s Re
spon
ding
Duration of Impact
Cash (n=116)
Food (n=89)

62
Figure 34: Smallholders’ assessment of total duration of PSNP transfer impact
Source: RRA 2015 Nevertheless, overall responses suggest that the most frequent maximum impacts of both food and cash upon price are of the order of a 10% variation in price, and that the total impact (which may decline in scale over time) is of approximately two to four weeks duration. This result is typical of those obtained by successive RRAs over the last five years. In terms of predictability, more than 70% of beneficiaries, in Tigray (91%), Amhara (88%) and Oromiya (70%) reported that they knew when transfers would be made, but in SNNPR the reverse was the case, with 75% of groups reporting that they did not know. The predictability of transfers was similarly high in Tigray (100%), Amhara (78%) and Oromiya (52%), but low in SNNPR (25%). The general high rate of predictability allows households to plan ahead with confidence, but can also enhance opportunities for self-monetization.
Self-Monetization In Tigray, Amhara and Oromiya, 97%, 72% and 39% of traders respectively, reported that some beneficiaries were willing to monetise food aid. The most frequently monetised commodity was wheat, followed by pulses (Figure 35) Figure 35: Amounts of Commodities sold by beneficiaries to traders
Source: RRA 2015 Edible oil was reportedly scarcely monetized at all. This confirms the data collected in October 2014 and represents a substantial change from previous years. It appears either that edible oil is now prized more
0.0%10.0%20.0%30.0%40.0%50.0%60.0%
<2 weeks 2-4 weeks5-8 weeks >8 weeks
% F
ocus
gro
ups
resp
ondi
ng
Duration of impact
Cash (n=82)
Food (n=64)
0.0%10.0%20.0%30.0%40.0%50.0%60.0%70.0%
% T
rade
rs R
espo
ndin
g
Amount of Commodity Monetized
Wheat
Pulses
Oil

63
highly then before, either for consumption, or possibly for sale within the village at higher prices than traders might be willing to offer. When smallholders were asked if traders ever came to purchase the PSNP transfers, 91% of smallholders in Tigray reported that this occurred often or every time food was distributed, 70% in Amhara reported similarly, but only 40% of focus groups in Oromiya gave these responses. The commodity most frequently purchased in Tigray was wheat, in Amhara, edible oil, and in Oromiya smallholders indicated that traders would buy “anything they could get”. While this conflicts with traders’ responses regarding edible oil, it confirms the predominance of wheat as the main commodity to be monetised at present. The volumes monetised were reported by smallholders to be generally small (Figure 36). In Tigray, wheat was the only commodity sold to traders. Pulses and edible oil were only monetised in Amhara and Oromiya. It must be noted that the RRA only considered monetisation of commodities by sale to traders. It is quite possible that some volume of all commodities will be monetised by sale to neighbouring smallholders. Hence the extent of monetisation noted above is most probably conservative. Figure 36: Amounts of commodities purchased from beneficiaries by traders
Source: RRA 2015 Traders were asked to rate how the PSNP affected their business. The replies were consistent across Regions and in line with previous RRA surveys (Figure 37), 90% of traders reacted positively, while 10% felt that it restricted their business or reduced their profits.
0%
10%
20%
30%
40%
50%
60%
70%
80%
Smallamount(<10%)
Quite a lot(20%-30%)
Almost half More thanhalf
% F
ocus
gro
ups
resp
ondi
ng
wheat (n=34)
Pulses (n=13)
Edible Oil (n=15)
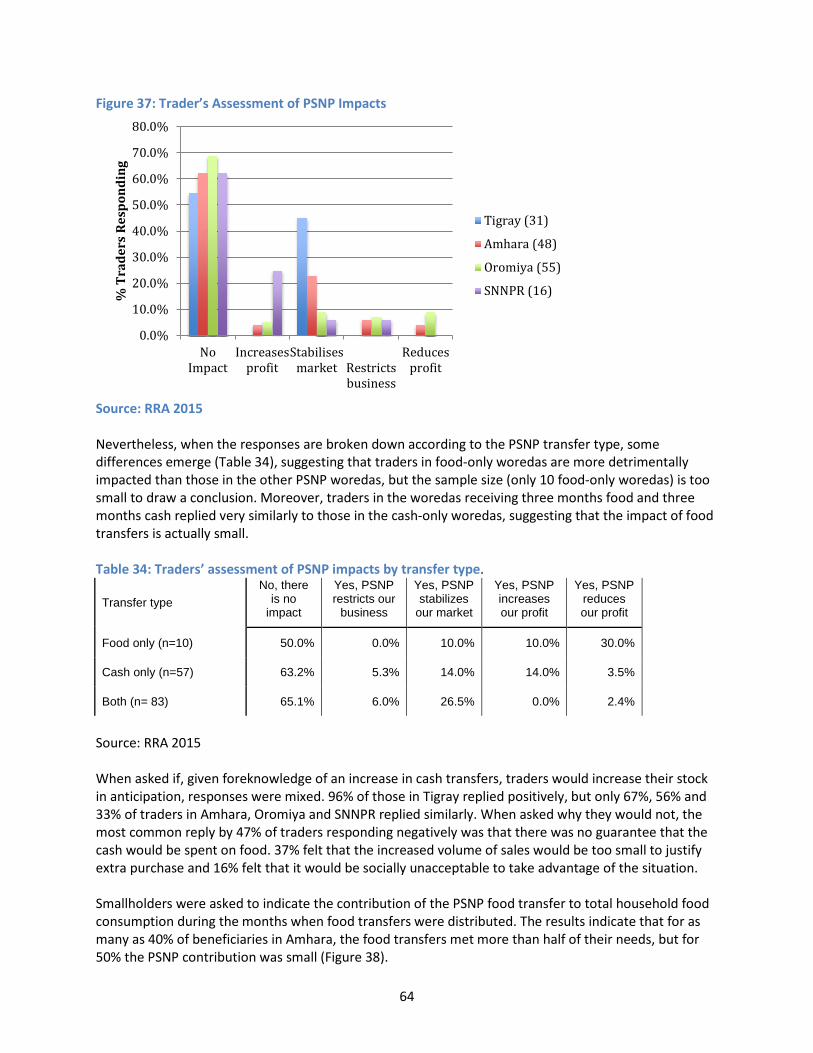
64
Figure 37: Trader’s Assessment of PSNP Impacts
Source: RRA 2015 Nevertheless, when the responses are broken down according to the PSNP transfer type, some differences emerge (Table 34), suggesting that traders in food-only woredas are more detrimentally impacted than those in the other PSNP woredas, but the sample size (only 10 food-only woredas) is too small to draw a conclusion. Moreover, traders in the woredas receiving three months food and three months cash replied very similarly to those in the cash-only woredas, suggesting that the impact of food transfers is actually small. Table 34: Traders’ assessment of PSNP impacts by transfer type.
Transfer type No, there
is no impact
Yes, PSNP restricts our
business
Yes, PSNP stabilizes
our market
Yes, PSNP increases our profit
Yes, PSNP reduces our profit
Food only (n=10) 50.0% 0.0% 10.0% 10.0% 30.0%
Cash only (n=57) 63.2% 5.3% 14.0% 14.0% 3.5%
Both (n= 83) 65.1% 6.0% 26.5% 0.0% 2.4%
Source: RRA 2015 When asked if, given foreknowledge of an increase in cash transfers, traders would increase their stock in anticipation, responses were mixed. 96% of those in Tigray replied positively, but only 67%, 56% and 33% of traders in Amhara, Oromiya and SNNPR replied similarly. When asked why they would not, the most common reply by 47% of traders responding negatively was that there was no guarantee that the cash would be spent on food. 37% felt that the increased volume of sales would be too small to justify extra purchase and 16% felt that it would be socially unacceptable to take advantage of the situation. Smallholders were asked to indicate the contribution of the PSNP food transfer to total household food consumption during the months when food transfers were distributed. The results indicate that for as many as 40% of beneficiaries in Amhara, the food transfers met more than half of their needs, but for 50% the PSNP contribution was small (Figure 38).
0.0%
10.0%
20.0%
30.0%
40.0%
50.0%
60.0%
70.0%
80.0%
NoImpact
Increasesprofit
Stabilisesmarket Restricts
business
Reducesprofit
% T
rade
rs R
espo
ndin
g
Tigray (31)
Amhara (48)
Oromiya (55)
SNNPR (16)

65
Figure 38: Contribution of PSNP food transfers to household consumption
Source: RRA 2015 By contrast, for 60% of households in Oromiya and 45% in Tigray, the PSNP transfers contributed about 25% of consumption. Aggregating all regions, this is indeed the modal value (i.e. 46% of all PSNP food recipients report a contribution of 20-30%) and is similar to results obtained in previous RRA surveys. A similar assessment of the contribution of cash transfers to total cash income (during the months of cash transfers) indicated that more than 50% of the cash transfer was spent on food in most (62%) PSNP woredas, but that the cash transfer was not enough to meet the food needs of 100% of the focus groups canvassed and that the PSNP transfers contributed less than 10% of total cash income for the largest percentage of households (46%). Nevertheless, despite the limited extent of their contributions to household food supply both food and cash transfers had impacted smallholder behaviour. Across all PSNP woredas surveyed, 75% of groups reported that farmers had changed their use of inputs as a result of the PSNP. This result was consistent across regions, although it was not recorded whether the change was an increase or decrease in input usage. Similarly 67% reported that farmers had changed their cropping plans as a result of the PSNP, although in Tigray, only a minority of 34% had done so. These results are significant because previous RRA surveys had reported that the PSNP had little impact on farmers’ cropping plans so that the possibility of a disincentive to production could be reasonably excluded from the analysis. This is no longer the case. Unfortunately, the nature of the changes was not recorded, but might be usefully examined in the future. Overall it is evident that the PSNP transfers of both food and cash do have impacts on market prices, albeit of short duration and limited extent, as well as impacts upon traders and upon beneficiaries (as indeed they are intended to do). On the basis of past RRA results, a disincentive impact of PSNP transfers upon farmers is unlikely. It is more probable that use of improved inputs had increased as a result of the additional food or cash supplied to households, but remains undetermined. The net effect upon traders is broadly positive, although it is also clear that the impact of cash transfers is not enough to generate a proactive response in the form of prepositioned stocks.
0.0%
10.0%
20.0%
30.0%
40.0%
50.0%
60.0%
70.0%
Very smallamount upto (10%)
A significantamount
(20%-30%)
As much ashalf
More thanhalf
% F
ocus
gro
ups
resp
ondi
ng
Tigray n=22
Amhara n=10
Oromiya n=14

66
Other factors influencing markets Traders were canvassed as to the role of stakeholders within the market chain in determining price. In response to the question “who in your opinion has the greatest influence upon the wholesale price of a given commodity, the overwhelming response for most commodities was “traders like me”, but responses regarding the other stakeholders were illuminating and highlighted important differences between commodities. EGTE was deemed to be a significant influence on cereal prices as (to a lesser extent) were donors bringing food aid, but neither played a role in affecting pulse prices. Another key difference was the perceived role of major buyers in Addis, who were much more significant to pulse prices than to cereal prices, as also were small retail outlets. For neither pulses nor cereals were the influences of government (other than EGTE), brokers, local authorities or WFP considered very large. Within the cereals, wheat, teff, and maize also differed (Table 35) For maize, traders clearly considered their own activities to be the main influence on price, but while this was also true for wheat and teff, the response was less pronounced for these commodities. The role of consumers was hardly important to maize prices, more important for wheat and substantial for teff, while Isuzu traders were similarly more important to teff then to the other two cereals. Overall, four stakeholders were considered important to price determination, (i.e. rated at over 9% influence) in each case: Table 35: Stakeholders affecting cereal prices per Traders’ Perceptions (n=530) Commodity Maize Wheat Teff 1st Traders (46%) Traders (29%) Traders (35%) 2nd EGTE (13%) EGTE (18%) Consumers (24%) 3rd Isuzu Traders (11%) Cooperatives (11%) Isuzu Traders (13%) 4th Cooperatives (9%) Donors bringing food
aid (9%) Big traders in Addis (12%)
Source: RRA 2015 Of equal significance was the absence of WFP, local authorities, government, retail outlets or brokers as perceived major determinants of price.
Food/Cash Preferences Given the potential change in USAID-funded DFAP transfers to include a cash element in future, the preferences of beneficiaries in this regard were sought. At a national level35, 47% of the 165 groups canvassed (approximately 1,500 households) indicated a preference for food only (Table 36). This preference was most marked in Tigray36. Table 36: National and Regional preferences of transfer type Region Number of groups
responding Food only
Cash only
Part food and part cash
Food in lean season and cash at other times
Tigray 22 72.7% 18.2% 9.1% 0.0% Amhara 56 37.5% 16.1% 39.3% 7.1% Oromiya 72 45.8% 9.7% 30.6% 13.9% SNNPR 13 38.5% 23.1% 38.5% 0.0% Dire Dawa 2 100.0% 0.0% 0.0% 0.0% Total 165 46.7% 13.9% 30.9% 8.5%
35 The question was asked of both PSNP and non-PSNP woredas, viz: “Which would the poorest HHs in the area prefer to receive as assistance (e.g. PSNP households)?” 36 The 100% result for Dire Dawa was ignored due to the small sample size.

67
Source: RRA 2015 The second most preferred option was for part food and part cash in all transfers. The option that has often been suggested (cash at the beginning of the season when food is more available and then food in the lean season) surprisingly ranked fourth. Amongst the 77 focus groups that expressed a preference for food only, two reasons were given most frequently. The first being the negative reason that when cash was provided it was not enough to buy the food that was required. The second was the more positive reason that food could be sold for cash, which could then be used to buy more and cheaper food. Significantly, only two used the fact that there was no food to buy in the area as their main reason, and only four groups preferred food because it was less easily abused than a cash transfer. Of the 24 groups preferring cash only, the fact that cash could be spent on other things besides food was the major reason for the preference reported by 79% of groups. When disaggregated by PSNP status, the preferences differed between the two groups (Table 37). Table 37: Group preferences of transfer type by Woreda status. Woreda Status Number of
groups reporting Food only
Cash only Part food and part cash
Food in lean season and cash in other times
PSNP 109 63.3% 7.3% 24.8% 4.6% Non-PSNP 56 14.3% 26.8% 42.9% 16.1% Source: RRA 2015 The majority of groups in PSNP areas preferred food only. In non-PSNP areas, the most frequently preferred option was part food and part cash (in all transfers). Non-PSNP woredas showed a much lower preference for food only and a greater preference for all of the options that included cash than PSNP woredas. Although the distribution of preferences varied between the two groups, the reasons for them did not, and were the same as the reasons observed at a national level in both cases. When responses of the woredas that received PSNP transfers are broken out by transfer type, the greatest preference amongst those that received either food only or food and cash wash for food only (Table 38). Amongst those receiving cash only, part food/part cash (in all transfers) was marginally preferred over food only. Cash only was not preferred by any type of PSNP woreda. There was again a clear preference for mixed transfers (cash and food together) as opposed to cash sometimes and food at others. Table 38: Group preferences of transfer mix by transfer type Preference Food only Cash only Part food
and part cash
Food in lean season and cash
in other times
Transfer received by
PSNP woreda
Food-only (n=14) 78.6% 0.0% 14.3% 7.1%
Cash-only (n=40) 40.0% 7.5% 42.5% 10.0%
Both (n=49) 79.6% 8.2% 12.2% 0.0% Source: RRA 2015

68
When asked to indicate what their preference might be in the event of a transfer program that included food transfers on some occasions and cash on others, the following responses were recorded: (Table 39). Table 39: Group preferences of transfer mix by Woreda status. Woreda status
Number of groups
responding
1 food: 5 cash
2 food: 4 cash
3 food: 3 cash
4 food: 2 cash
5 food: 1 cash
PSNP 29 3.4% 17.2% 65.5% 13.8% 0% Non-PSNP 26 15.4% 3.8% 65.4% 15.4% 0% Source: RRA 2015 The observed preference for food notwithstanding, amongst those respondents that favoured a mixed program, the 50:50 mix of three rounds food and three rounds cash was the mix preferred by the majority, in both PSNP and non-PSNP woredas. Higher levels of food were surprisingly less favoured.
Logistics of Food Aid Distribution The Bellmon analysis is asked to consider that adequacy of ports, storage and transport capacities to handle the anticipated volumes of Title II commodities. Each of these aspects is considered in turn below. Given the long history of food aid distribution in Ethiopia, the logistical framework and capacities have been well established in the past. Since the volumes under consideration for Title II distribution are now significantly smaller than they have been in the past, there is little real doubt that capacity is in each instance adequate. The following assessments are therefore brief and rely mainly upon secondary data.
Port Capacity All Title II food aid is now imported to Ethiopia through the Port of Djibouti, although Berbera is also available and has been used in the past when food aid volumes have exceeded the immediate capacity of Djibouti. Recently however, the PSNP has allowed for the scheduling of food aid in such a way as to minimise the impact of such congestion. Djibouti port is 910 km from Addis Ababa by road and 781 km by rail. Although non-functional for at least the last ten years, the rail line has been refurbished and is expected to be operational between Djibouti and the dry port at Mojo (60 km outside Addis) before the end of 2015. The port is managed by Dubai Ports World and has a bulk freight capacity of six to eight million MT per year and a container capacity of three million MT per year. It contains 18 berths with a total quay length of 2,829 meters and depths from seven to 18 meters. The general cargo facility contains eight berths with alongside depth from seven to 12 meters. There are two roll-on/roll-off berths with alongside depth of 11.5 meters. The Bulk Terminal contains three berths with alongside depth of from 10.5 to 12 meters. The Container Terminal has two berths with depth of from 9.5 to 12 meters. Berths 13, 14, and 15 are designated exclusively for bulk cargo. Grain and fertilizer bulk shipments are handled through Berths 14 and 15 which are operated under contract by Société Djiboutienne de Gestion du Terminal Vraquier (SDTV). The company handles all cargo operations from the ship’s arrival until cargo is loaded onto trucks including bulk ship unloading, bagging, and transshipment of grain through:
• 2 Vigan pneumatic ship unloaders for grain - average discharge capacity 300 MT/hour per unit • Conveyor system with flexibility from vessel to silo, vessel to bagging, vessels to silo and bagging,
and silo to bagging; • 1 grab crane with lifting capacity of 69 MT and operating a grab (hinged bucket scoop) of 21 MT

69
per scoop with capacity of 600 MT per hour from vessel to conveyor system through shore-side hopper; and
• Bagging station - 12 bagging lines (12 to 15 bags of 50 kg per minute per line).
Total capacity from unloading to truck dispatch capacity is up to 6,000 MT per day, provided the availability of trucks and administrative procedures allow. In practice, rates of 2,000-3,000 MT per day are more commonly achieved.
Transport Statistics profiling Ethiopian dry cargo haulage capacity are now at least six years old (Table 40). Table 40: Dry Cargo Haulage Capacity as of 2009
Capacity Public Commercial37
Private Commercial
Total Number of Trucks Capacity (MT)
<7 MT 28905 7189 36094 126329 7-12 MT 9699 716 10415 104150 12-18 Mt 12338 659 12997 194955 18-30 MT 2264 23 2287 50314 >30 MT 3480 261 3741 130935 Total 56686 8848 65534 606683
Source: Afro Consult and Trading PLC (2010) When that data was published it was noted that much of the national fleet was old and liable to perform inefficiently. Since then at least 1,000 x 15 MT trucks and 1,000 x 40 MT trucks have been sourced from China and another 165 x 40 MT trucks from Sweden. Nevertheless, the dry cargo sector continues to experience regular capacity deficits. These are not so much a reflection of freight capacity, but of the seasonality of demand, which exceeds capacity during some months, followed by slack periods when hauliers can find little work. As a result, prices are also strongly seasonal. The RRA found that freight rates were lowest in June/July (average rate of ETB15/Qt/km and highest in January and February (average rate of ETB19/Qt/km), (Figure 38).
37 Public commercial capacity represents freight owned by parastatal companies that can be rented out by the private sector.

70
Figure 38: Variation in cost of transport between July 2013 and June 2014
Source: RRA Trader Interviews 2014
Investment in freight capacity to meet peak demand would in fact result in massively underutilized resources for a large part of the year. Consequently, investment occurs at a lower level that is not adequate to meet peak demand but does not incur excessive losses. Unless the seasonality of demand can be reduced, capacity deficits are always probable. This is especially the case in June/July, when GoE “year end” imports can occasionally absorb all large-capacity (20-40MT) transport resulting in unexpected delays in the movement of food out of Djibouti port. It has always been an advantage that preplanned Title II commodities can be programmed for importation when haulage capacity is not extended, i.e. from April to October, but even then it is possible for GoE imports to disrupt the national haulage system, although such occurrences are sporadic and increasingly uncommon. Notwithstanding the above observations, traders reported to the 2014 RRA that all types of haulage had become increasingly available over the last twelve months and that on average haulage costs had been reduced (Figure 39).

71
Figure 39: Traders’ assessments of changes in transport costs
Source: RRA 2014 On the basis of these reports, it is apparent that there is adequate transport capacity in the country to move Title II commodities from Djibouti to their primary warehouses in-country and to redistribute them to secondary distribution points, provided that such transport takes place during the months when national haulage capacity is not extended by other demands.
Storage While Djibouti Port has 16 warehouses with a total storage capacity of 250,000 MT and the SDTV terminal has storage available for 30,000 MT of grain, storage in these facilities will incur demurrage and it is essential that the FFP implementing partners should each have adequate storage capacity to handle the anticipated volumes of Title II commodities. A survey of such capacities was undertaken with the results shown in Table 41. In many cases, storage is rented, although REST in particular owns most of its storage facilities. Rents are taken out on both a long and short-term basis according to the type of storage. Primary distribution points that are unlikely to vary over time may be owned or rented on a long-term basis. Secondary distribution points closer to the beneficiary communities are more likely to be rented, often on a short-term basis. Table 41: Current Storage capacity of FFP implementing partners Cooperating Sponsor
Anticipated PSNP Annual Volume (MT)
Storage Capacity (MT)
Percentage Utilisation
Catholic Relief Services
25,000 73,491 34%
Food for the Hungry 30,000 49,203 61% REST 55,650 65,500 86% Save the Children 15,000 53,500 28% Source: DFAP Partner Interview respondents

72
The figures in Table 42 represent total storage capacity. In practice, some of this capacity will be used to accommodate other food aid, beside Title II distribution commodities, especially that provided under the Joint Emergency Operations Plan (JEOP), which is generally of a comparable volume to the PSNP transfers. This effectively doubles the stored volume, but due to the fact that stocks are rotated within a six-month period, the total volumes can still be accommodated within the available capacity without difficulty. In fact, the partners report that implementing the JEOP in conjunction with the PSNP allows the most efficient use of rented storage capacity, as well as allowing stocks from one program to substitute for those of the other according to need and availability. All of the partners have participated in the PSNP from its inception and as a result are well experienced in the effective storage and distribution of Title II commodities. These interview results together with past experience indicate that the necessary physical and technical capacity exists to ensure that anticipated volumes could be stored without difficulty.
Bellmon Considerations To inform USAID’s Bellmon determination, the following points summarize the analysis and discussion above.
1. Importation - there are no obvious constraints to the importation of proposed volumes of Title II commodities through the port of Djibouti. The port has the necessary capacity to handle the anticipated volumes and past experience shows the exercise to have been repeated with larger volumes of food aid over the last ten years without issue.
2. Storage – the FFP implementing partners have all demonstrated adequate storage capacity to safely store the anticipated volumes of grain.
3. Transport – the national haulage capacity has proved adequate to move larger volumes of grain in the past than those anticipated for FY 2015. Given the general perception that the availability of both small and large-scale transport has increased over the last year, there is no reason to suppose that transport will be a limitation to the effective distribution of the anticipated volumes of Title II commodities.
4. Commodity selection. a. Wheat – the domestic supply of wheat is not adequate to meet demand. Despite the
incentive of a domestic price that has remained high and exceeded import parity for the last two years a clear shortfall in this commodity continues to exist. The GoE has considered it necessary to augment the wheat supply with substantial imports, in comparison to which the volumes to be imported as Title II commodities are small. Wheat is nevertheless a widely consumed cereal in all parts of Ethiopia with the exception of Afar region, where sorghum is preferred. In general however, wheat will be used either to make bread, or pasta or as an ingredient in injeera and is an appropriate component of the food aid ration. There is a risk that beneficiaries receiving wheat will self-monetize it to buy relatively cheaper maize, but the practicalities of storing and distributing maize without risk of loss and/or toxicity either from over-fumigation have always obliged the implementing partners to avoid maize in favour of wheat.
b. Edible oil – the fact that the GoE is now importing and distributing substantial volumes of edible palm oil that effectively exceed the total national consumption estimate for 2010 suggest that it should no longer be necessary to provide edible oil as part of the standard ration, provided that households have the means to purchase this commodity. In practice, this study did find some markets that the GoE oil distribution exercise did not reach. These were few in number, but did exist. It should be remembered however
73
that prior to the GoE oil distribution, edible oil was not a major component of the Ethiopian diet. Oil was commonly regarded more as a condiment than as a staple and much of the oil provided as food aid was sold by beneficiaries. From this perspective, the omission of edible oil from the food aid ration is not critical.
c. Pulses – the recent increases in pulse prices suggest that amongst the most vulnerable households, the accessibility of pulses would be reduced. Given the declining consumption of meat, and the need to maintain adequate protein levels in the diet, the inclusion at an increased proportion of pulses in the food aid ration would clearly be beneficial to recipients. Although a wide variety of pulses are consumed in Ethiopia, it is field peas used to make shiro that are most appropriate to Title II beneficiaries. It has been argued that lentils are more readily prepared and hence more suitable, but given the current high price of lentils the risk of self-monetisation would suggest that field peas or split peas would be a more appropriate commodity.
5. Disincentive impacts of food aid – the RRA demonstrated (in common with previous similar exercises that a price depressing impact of food aid was normal, but was both mild, local38 and transitory. The majority of traders saw no negative impact from the PSNP food transfers, considering it to be beneficial through its market stabilisation effect. A minority (9%) of traders considered food aid to affect wheat prices, but it did not affect their business plans. A minority (8%) of producers considered altering their cropping plans as a result of PSNP transfers, but the survey did not determine if such changes are having a positive or negative effect.
6. Cash/food balance – this Bellmon analysis was asked to consider the feasibility and appropriateness of cash transfers as a mechanism under the PSNP as well as the most appropriate combination of cash and food transfers in the universe of all possible combinations. The circumstances under which the analysis has been carried out this year are particularly pertinent to this decision. The feasibility and appropriateness of cash transfers was assessed from the following perspectives: a). Are markets adequately supplied with commodities for beneficiaries to be able to use the cash to buy food? b). Would cash transfers have an inflationary effect that would impact negatively upon non-beneficiaries? c). Would traders be willing or able to compensate for such an inflationary effect by stocking up ahead of an expected cash transfer? It was found that in all cases39, the markets did contain the necessary staples to allow cash to be used as a medium of transfer (provided the transfer amount was enough). It was also determined that there was a mild and transitory inflationary impact of cash transfers, but that this was not enough to persuade traders to stock up with staple commodities prior to the cash transfers. The feasibility and appropriateness of cash as a transfer mechanism has thus been demonstrated. Key questions remain as to when and most importantly, how much? The beneficiary preference was clearly that if cash were to be provided it should be in conjunction
38 Local in this case implies that, as demonstrated by wholeale market price data, price impacts did not extend beyond the woreda level 39 The RRA did find one exception, but enumerators believed that the focus group members either did not understand the question or wanted to demonstrate their dire need, since there was clear evidence of an active market that effectively contradicted the FGD result.

74
with food at each of the six transfer rounds, but given the administrative complications of such a mixture, that option has been discarded. Instead, focus groups indicated that a 50:50 mix would be most appropriate. This would presumably imply three cash transfers at the beginning of the season and three food transfers at the end. Given the expectation expressed by the Mission that the cash for PSNP transfers will be adequate to cover one third of the seasonal program, it is recommended that the initial first two transfers should be of cash and the subsequent four transfers of food. As regards the size of the transfer, one key reason for preferring food as a transfer was that “cash was never enough to buy the food we need”, implying that a cash transfer should always be large enough to do this if it is to be effective. To achieve this, a cash transfer should compensate for geographical price variation as well as seasonal variation. It should also be able to absorb the unexpected variations in price that may occur (as this year) when grain inflow to the market is abruptly decreased. Such variations are, by definition, hard to predict. One possible way to accommodate unexpected price variations is to add an additional “risk” premium to the cash transfer (over and above any seasonal or geographic premiums that would also need to be included). A variety of different mechanisms, both proactive and reactive, could be used to calculate and apply such a premium. The above comments notwithstanding, , it is important to recognise the limited resolution of PSNP targeting which, based upon community decisions makes a binary determination on program participation, that does not allow for and the wide variation in levels of beneficiary need and/or program impacts. On this basis, fine-tuning to determine the precise cash requirement for each transfer in each woreda. may be of limited relevance. If commodity markets are to be relied upon to supply food to vulnerable households, then it is important that differences due to transport costs and seasonality are reflected as much as possible in the value of a cash transfer. It is not however critical that the value should be exactly accurate. Experience suggest that It will be preferable to err on the upside since cash transfer values seem always to have lagged behind actual food costs. A risk premium of 25% would allow for such discrepancies. Thus, both this year’s RRA and earlier studies have shown that neither food nor cash transfers meet more than a part of PSNP households’ food needs. Similarly, HEA studies have shown that other resources are almost invariably used to achieve food security. Nevertheless, in some cases, neither PSNP food nor cash transfers are enough and households remain food insecure. Much depends upon individual household circumstance. From this perspective, it may be futile to develop a precise cash transfer mechanism based upon price movements if the primary cause of variation in food security levels lies with the households themselves rather than with the market. In the absence of micro-targeting of transfers based upon individual household need, it may be adequately effective to apply a single risk premium to transfers based upon actuarial principles, i.e. calculated on the basis of price hikes in the past that have exceeded the normal seasonal and geographic trends. One assessment40 of such trends suggests that a 25% risk premium would be initially adequate.
40 USAID Ethiopia: Crop Production and Marketing Assessment 2011/12
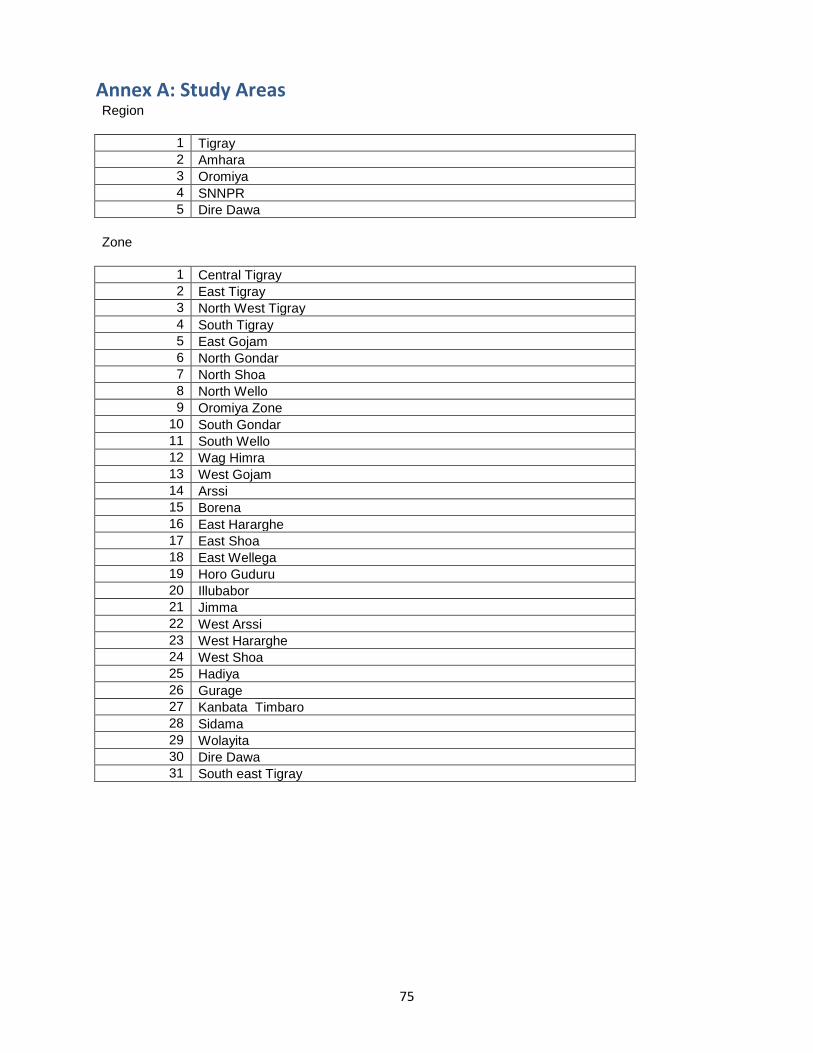
75
Annex A: Study Areas Region
1 Tigray 2 Amhara 3 Oromiya 4 SNNPR 5 Dire Dawa
Zone
1 Central Tigray 2 East Tigray 3 North West Tigray 4 South Tigray 5 East Gojam 6 North Gondar 7 North Shoa 8 North Wello 9 Oromiya Zone
10 South Gondar 11 South Wello 12 Wag Himra 13 West Gojam 14 Arssi 15 Borena 16 East Hararghe 17 East Shoa 18 East Wellega 19 Horo Guduru 20 Illubabor 21 Jimma 22 West Arssi 23 West Hararghe 24 West Shoa 25 Hadiya 26 Gurage 27 Kanbata Timbaro 28 Sidama 29 Wolayita 30 Dire Dawa 31 South east Tigray
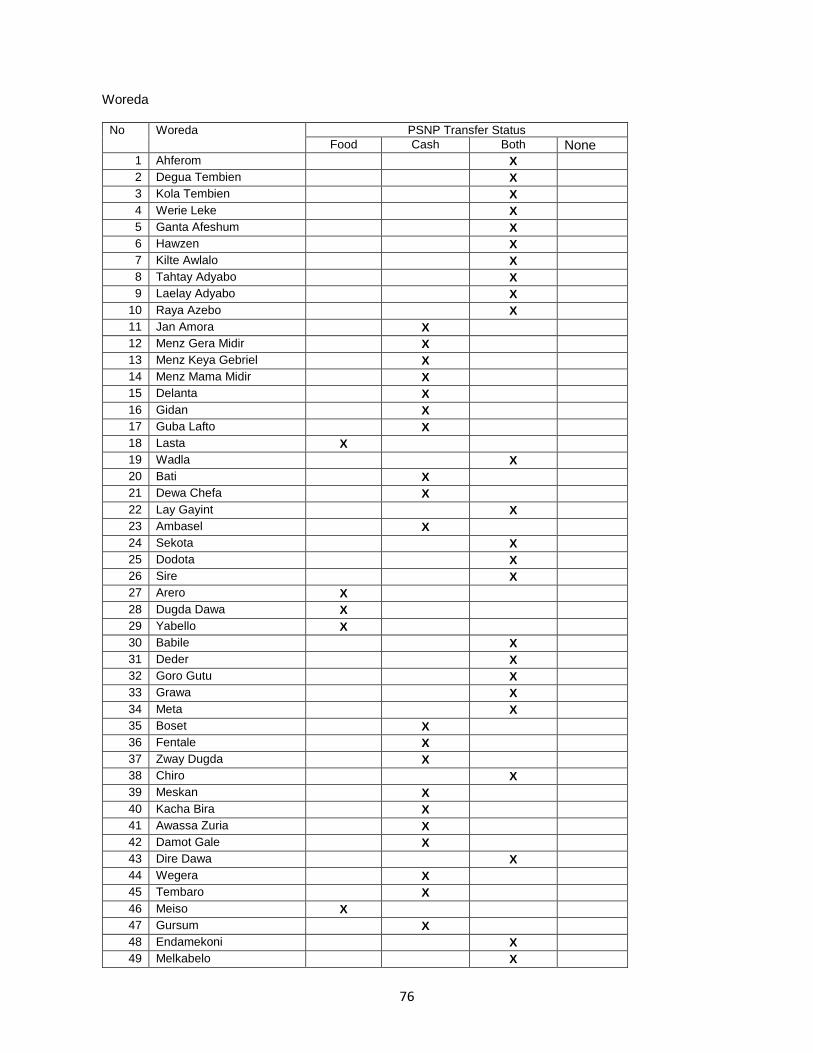
76
Woreda
No Woreda PSNP Transfer Status
Food Cash Both None 1 Ahferom X 2 Degua Tembien X 3 Kola Tembien X 4 Werie Leke X 5 Ganta Afeshum X 6 Hawzen X 7 Kilte Awlalo X 8 Tahtay Adyabo X 9 Laelay Adyabo X
10 Raya Azebo X 11 Jan Amora X 12 Menz Gera Midir X 13 Menz Keya Gebriel X 14 Menz Mama Midir X 15 Delanta X 16 Gidan X 17 Guba Lafto X 18 Lasta X 19 Wadla X 20 Bati X 21 Dewa Chefa X 22 Lay Gayint X 23 Ambasel X 24 Sekota X 25 Dodota X 26 Sire X 27 Arero X 28 Dugda Dawa X 29 Yabello X 30 Babile X 31 Deder X 32 Goro Gutu X 33 Grawa X 34 Meta X 35 Boset X 36 Fentale X 37 Zway Dugda X 38 Chiro X 39 Meskan X 40 Kacha Bira X 41 Awassa Zuria X 42 Damot Gale X 43 Dire Dawa X 44 Wegera X 45 Tembaro X 46 Meiso X 47 Gursum X 48 Endamekoni X 49 Melkabelo X
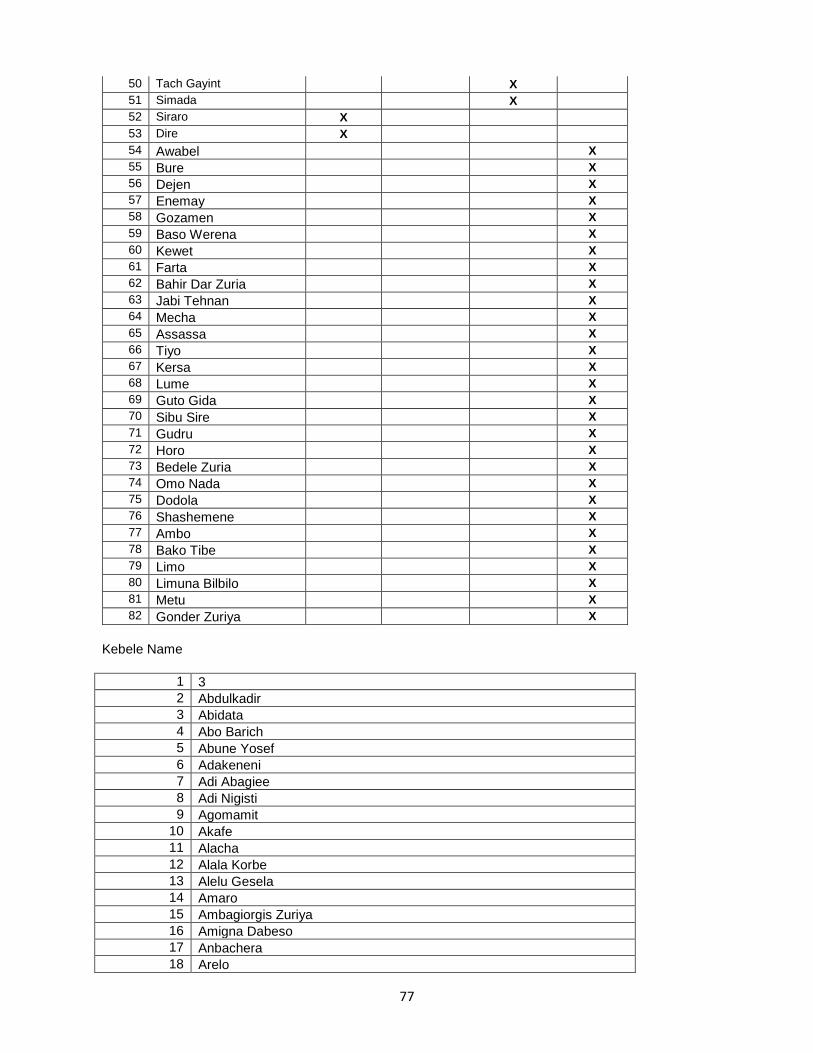
77
50 Tach Gayint X 51 Simada X 52 Siraro X 53 Dire X 54 Awabel X 55 Bure X 56 Dejen X 57 Enemay X 58 Gozamen X 59 Baso Werena X 60 Kewet X 61 Farta X 62 Bahir Dar Zuria X 63 Jabi Tehnan X 64 Mecha X 65 Assassa X 66 Tiyo X 67 Kersa X 68 Lume X 69 Guto Gida X 70 Sibu Sire X 71 Gudru X 72 Horo X 73 Bedele Zuria X 74 Omo Nada X 75 Dodola X 76 Shashemene X 77 Ambo X 78 Bako Tibe X 79 Limo X 80 Limuna Bilbilo X 81 Metu X 82 Gonder Zuriya X
Kebele Name
1 3 2 Abdulkadir 3 Abidata 4 Abo Barich 5 Abune Yosef 6 Adakeneni 7 Adi Abagiee 8 Adi Nigisti 9 Agomamit
10 Akafe 11 Alacha 12 Alala Korbe 13 Alelu Gesela 14 Amaro 15 Ambagiorgis Zuriya 16 Amigna Dabeso 17 Anbachera 18 Arelo
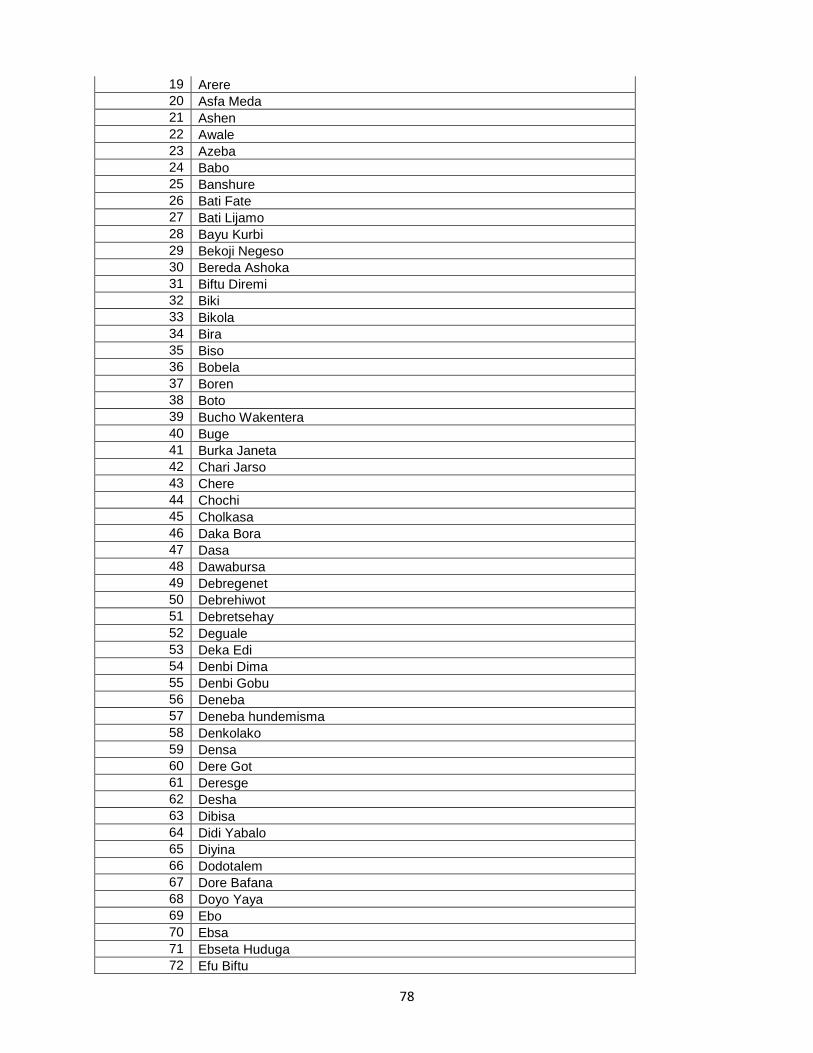
78
19 Arere 20 Asfa Meda 21 Ashen 22 Awale 23 Azeba 24 Babo 25 Banshure 26 Bati Fate 27 Bati Lijamo 28 Bayu Kurbi 29 Bekoji Negeso 30 Bereda Ashoka 31 Biftu Diremi 32 Biki 33 Bikola 34 Bira 35 Biso 36 Bobela 37 Boren 38 Boto 39 Bucho Wakentera 40 Buge 41 Burka Janeta 42 Chari Jarso 43 Chere 44 Chochi 45 Cholkasa 46 Daka Bora 47 Dasa 48 Dawabursa 49 Debregenet 50 Debrehiwot 51 Debretsehay 52 Deguale 53 Deka Edi 54 Denbi Dima 55 Denbi Gobu 56 Deneba 57 Deneba hundemisma 58 Denkolako 59 Densa 60 Dere Got 61 Deresge 62 Desha 63 Dibisa 64 Didi Yabalo 65 Diyina 66 Dodotalem 67 Dore Bafana 68 Doyo Yaya 69 Ebo 70 Ebsa 71 Ebseta Huduga 72 Efu Biftu
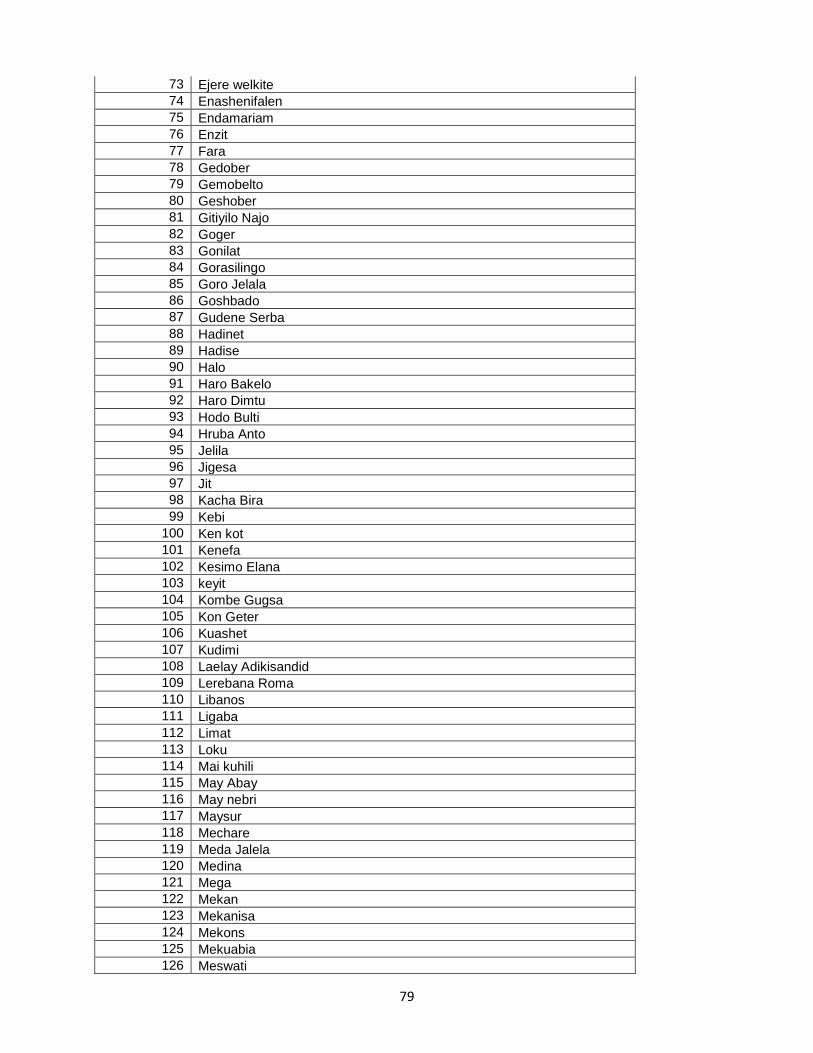
79
73 Ejere welkite 74 Enashenifalen 75 Endamariam 76 Enzit 77 Fara 78 Gedober 79 Gemobelto 80 Geshober 81 Gitiyilo Najo 82 Goger 83 Gonilat 84 Gorasilingo 85 Goro Jelala 86 Goshbado 87 Gudene Serba 88 Hadinet 89 Hadise 90 Halo 91 Haro Bakelo 92 Haro Dimtu 93 Hodo Bulti 94 Hruba Anto 95 Jelila 96 Jigesa 97 Jit 98 Kacha Bira 99 Kebi
100 Ken kot 101 Kenefa 102 Kesimo Elana 103 keyit 104 Kombe Gugsa 105 Kon Geter 106 Kuashet 107 Kudimi 108 Laelay Adikisandid 109 Lerebana Roma 110 Libanos 111 Ligaba 112 Limat 113 Loku 114 Mai kuhili 115 May Abay 116 May nebri 117 Maysur 118 Mechare 119 Meda Jalela 120 Medina 121 Mega 122 Mekan 123 Mekanisa 124 Mekons 125 Mekuabia 126 Meswati

80
127 Minje 128 Misilemariam 129 Monzino 130 Oda Sentela 131 Odo 132 Sardo 133 Sayida 134 Sefi Beret 135 Sekela 136 Selam 137 Senbete Lencho 138 Serte 139 Shakua 140 Sifa Bete 141 Sigazo 142 Siye Meja 143 Taba 144 Tahtay Adikisandid 145 Tikur Balto 146 Tis Abalima 147 Tsegur 148 Uda Wetate 149 Uke 150 Wedayitu 151 Wedebiye 152 Wejel 153 Weleh 154 Welgeymedano 155 Weljalechisa Sirba 156 Weltehageba 157 Werkamba 158 Werkawetu 159 wewamagera 160 Widgetina Gefersa 161 Yabda Gojela 162 Yediro 163 Yeneja Kinkina 164 Yisak Debir 165 Zabatsion 166 Zelima 167 Zigbana Twdober
Coops
1 Ambericho 2 Ambo 3 Angacha 4 Borkena 5 Buno Bedele 6 Damot 7 Erikum 8 Galema 9 Gibe Dedesa

81
10 Gozamen 11 Hawzen 12 Hitosa 13 Jember 14 Licha 15 Lume Adama 16 Megenagna 17 Melik 18 Merkeb 19 Seyemti 20 Sidama Elto 21 Tekeze 22 Uta Wayu 23 Wabi 24 Walta 25 Wedera 26 Welwalo
Market name
1 Wuchale 2 Woldiya 3 Lalibela 4 Sekota 5 Mehoni 6 Mayichew 7 Wukero 8 Hawozen 9 Adigrat
10 Abei Adi 11 Hagere Selam 12 Edaga Arbi 13 Entecho 14 Adi Daero 15 Wtetet Abay 16 Jiga 17 Arada Gebeya 18 Ferese Wega 19 Yigude 20 Bure 21 Mayangatom 22 Lumame 23 Dejen 24 Bichena 25 Sheraro 26 Bako 27 Nekemte 28 Kombolcha 29 Metu 30 Bedele 31 Assela Zuriya 32 Gonde 33 Sire 34 Dera

82
35 Bekoji 36 Nada 37 Bisheshe 38 Shambu 39 H/Shate 40 Amba Giorgis 41 Maksegnit 42 Mekene Birhan 43 Arbe Gebeya 44 Wogeda 45 Meda 46 Goli 47 Kone 48 Muja 49 Tireteriya 50 Segno Gebeya 51 Hamus 52 Dibre Birhan 53 Shewa Robit 54 Mehal Media 55 Molale 56 Zemero 57 Shashemene 58 Arsi Negele 59 Loke 60 Hossaena 61 Shenshecho 62 Enseno 63 Gebi 64 Mudela 65 Makesgno Gebeya 66 Boditi 67 Finchewa 68 Luke 69 Kella 70 Shurema 71 Wolonchiti 72 Chelenko 73 Wolenchiti 74 Metehara 75 Haro Adi 76 Dire Dawa 77 Babile 78 Jijiga 79 Kara Mile 80 F/Bir 81 Chiro 82 Measo 83 Dedere Menharia 84 Megala Chebetu 85 Kanbo Akababi 86 Girawa 87 Melka Belo 88 Jaja
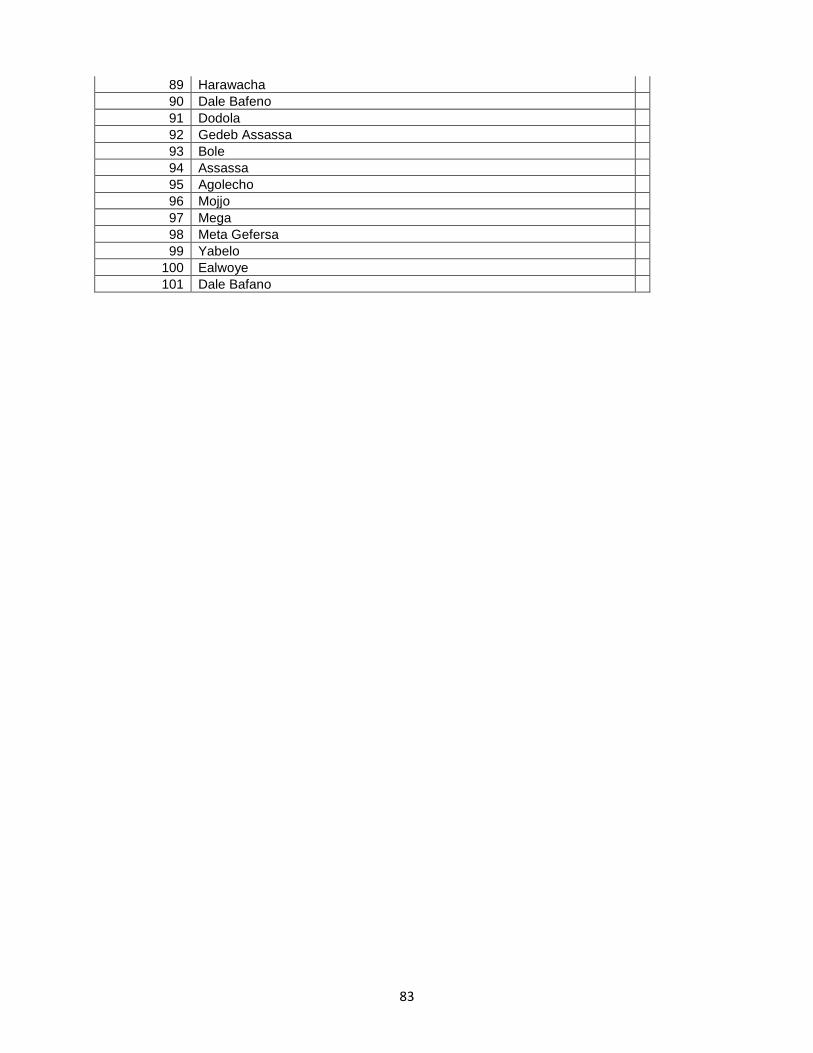
83
89 Harawacha 90 Dale Bafeno 91 Dodola 92 Gedeb Assassa 93 Bole 94 Assassa 95 Agolecho 96 Mojjo 97 Mega 98 Meta Gefersa 99 Yabelo
100 Ealwoye 101 Dale Bafano

84
Annex B: Questionnaires Questionnaire for Farmers’ Focus group Discussion (March 2015) Three focus groups of farmers (comprising of 8 farmers each) will be interviewed per Woreda.
A. Identification 1. Region_______ (A1) 2. Zone _________ (A2) 3. Woreda ______________ (A3) 4. Name of locality/PA where the interview was conducted __________ (A4) 5. Name of FGD Participants (A5)
1._________________________________ 5._____________________ 2._________________________________ 6._____________________ 3. ______________________________ 7. _____________________ 4. ________________________________ 8. _____________________
B. Farmers’ Assessment of Crop Yields 3. What is your assessment of average Meher yields in 2006/07 compared to 2005/2006 E.C?
Crop type Estimate of average yield in 2006/2007 crop year (in quintals/Ha)
Estimate of average yield in 2005/2006 crop year (in quintals/Ha)
B1a B1b B1c1=Maize2=Wheat3=Teff4=Sorghum5=Barley6=Horse bean7=Field pea8=Chick pea9=grass pea10=Haricot bean white11=Haricot bean red12=Nueg13=Flax14=Rape seed15=Other (specify_______

85
2. If wheat is grown in your area, was the production affected by rust? B2)
1=Not applicable - wheat is not an important crop in this area 2=No wheat yields were not affected by rust 3=Yes, there was some rust but the impact on yield was not noticeable 4=Yes there was some rust and the impact on yield was noticeable (more than 10%) 5=Yes, there was rust and the impact on yield was significant (more than 25%) 6=Yes there was rust and the impact on yield was very bad (more than 50%)
3. Was the grain harvest in your area affected by late rains at harvest time? (B3) 1=Yes 2=No 4. If the harvest was affected by late rains what was the impact on yield and quality?
5. Are root crops important in your area? (B5) 1=Yes 2=No 6. If root crops are important in your area, what is your assessment of average root crop yields
in 2006/2007 and 2005/2006 meher season?
Please express enset yield in terms of kocho and bula 7. Has the production of kocho increased in your area in 2006/2007 compared to 2005/2006?
(B7) 1=Yes 2=No
Crop type Yield impact: Quality impact:1= No impact on yield 1=No impact on quality2=Small yield loss (<5%) 2=A little sprouting3=Noticeable yield loss (5-10%) 3=Significant sprouting4=Significant yield loss (11-25% 4=A little mouldiness5=Very bad yield loss (>25% 5=Significant mouldiness
B4a B4b B4c1=Maize2=Wheat3=Sorghum4=Teff
Crop type Estimate of average yield in 2006/2007 crop year (in quintals/Ha)
Estimate of average yield in 2005/2006 crop year (in quintals/Ha)
B6a B6b B6c1=Irish potato2=Sweet potato3=Taro4=Enset

86
8. If production of Kocho increased in 2006/2007 compared to 2005/2006, what was the most
important reason? (B8)
1=Production of other crops was less so we produced more Kocho 2=Growth of enset was stronger so we were able to harvest more 3=We had more enset plants to harvest this year. 4=Price of Kocho was higher than last year (please indicate prices this year and last year)
9. If the production of Kocho has gone down in 2006/2007 compared with 2005/2006, what
was the main reason? (B9) 1=Production of other crops was more so we produced less Kocho 2=Growth of enset was weaker so we were able to harvest less 3=We had less enset plants to harvest this year. 4=Price of Kocho was lower than last year (please indicate prices this year and last
year:
10. How much is the producer’s price of Kocho in March 2007 E.C. (B10) ______________ (Birr/quintals) 11. How much was the producer’s price of Kocho in March 2006 E.C. ______________ (Birr/quintals) (B11)
C. Farmers’ grain sales and stock holding intentions and price expectations
1. What portion of your 2007 E.C. will you sell or exchange? .(C1) 1=up to 10% 2=11%-20% 3=21%-50% 4=More than 50%
2. How do you rate your grain sales in 2007 compared to 2006? Please answer for each type
of crop separately in the following table:
How do you rate your grain sales up to March 2007 compared to last year the same period?
How do you rate your total grain sales for 2007 compared to 2006 E.C?
1=Same as last year 1=Same as last year2=Less than last year 2=Less than last year3=More than lst year 3=More than lst year
C2a C2b C2c1=Maize2=Wheat3=Sorghum4=Teff
Crop type
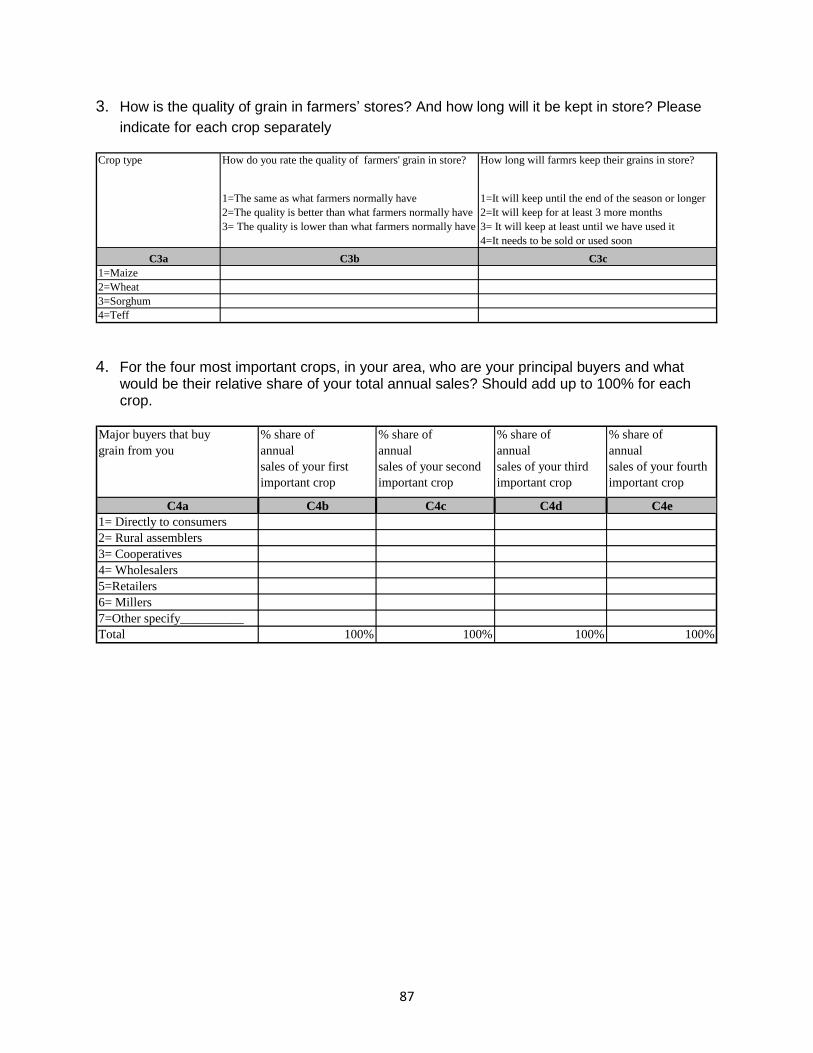
87
3. How is the quality of grain in farmers’ stores? And how long will it be kept in store? Please
indicate for each crop separately
4. For the four most important crops, in your area, who are your principal buyers and what
would be their relative share of your total annual sales? Should add up to 100% for each crop.
How do you rate the quality of farmers' grain in store? How long will farmrs keep their grains in store?
1=The same as what farmers normally have 1=It will keep until the end of the season or longer2=The quality is better than what farmers normally have 2=It will keep for at least 3 more months3= The quality is lower than what farmers normally have 3= It will keep at least until we have used it
4=It needs to be sold or used soonC3a C3b C3c
1=Maize2=Wheat3=Sorghum4=Teff
Crop type
Major buyers that buy grain from you
% share ofannual sales of your first important crop
% share ofannual sales of your second important crop
% share ofannual sales of your third important crop
% share ofannual sales of your fourth important crop
C4a C4b C4c C4d C4e1= Directly to consumers2= Rural assemblers3= Cooperatives4= Wholesalers5=Retailers6= Millers7=Other specify__________Total 100% 100% 100% 100%

Ethiopia: Bellmon Analysis - 2014/15
88
D. Labor 1. What is the cost of unskilled labor in your area (per day) now? ______ birr/day
(D1) 2. Has the cost of labor increased since last year or decreased? (D2)
1. 1=increased 2=decreased 3=the same 3. What was the cost of labor at this time last year? ________ birr/day (D3) 4. Is unskilled labor easier or harder to find than it was at this time last year? (D4)
A. =Easier 2=Harder 3=No change
E. Food Security
1. Will the average household be more or less food secure in 2007 E.C. as compared to the year before (2006)? (E1)
1=More food secure 2=Less food secure 3=No change
2. If there was a change what were the two most important reasons for it:
First important reason: ________ (E2a) Second important reason: ___________ (E2b)
3. If the food security situation of households is expected to improve, what are the
major reasons? (Please indicate two most important reasons. First important reason: __________ (E3a) Second important reason: ________ (E3b) Code for reasons 1= Improved yields this season due to better rainfall 2= Improved yields this season due to access to inputs and advice 3=Continued assistance from Government and donor programs to continue 4= Improved access to markets 5= Decline in food prices 6= Decline in prices of other things means more to spend on food 7=More employment opportunities 8=Higher wage levels 9=Better cash crop prices 10=Better livestock prices 11=Higher levels of remittance 12= Other (please specify)

Ethiopia: Bellmon Analysis - 2014/15
89
4. If the food security situation of households is expected to decline, what are the major
reasons? (Please indicate two most important reasons) First important reason: __________ (E4a) Second important reason: ________ (E4b) Code for reasons: 1= Reduced availability of land per household 2= Lower yields in last Belg seasons 3= Lower yields in this Meher seasons 4= High price or inaccessible inputs 5= Assistance from Government and donor programs is spread too thin 6=More competition from elsewhere in markets 7= Higher food prices 8= Higher prices of other things means less to spend on food 9= Less employment opportunities 10= Lower wage levels 11= Lower cash crop prices 12= Lower livestock prices 13= Lower levels of remittance 14=Other (please specify) 5. Has household consumption of the following foods over the last two years changed
as compared with their consumption five years ago? If so, please state by how much and why?
Has consumption Changed? If consumption has changed, by how much?
If consumption has changed, What is the main reason?
1= Increased 1= up to 10% 1= Other foods are cheaper2= decreased 2=11%-25% 2= price is too high3= No change 3= more than 25% 3=price is lower than other foods4= Don’t eat it. 4= Not as available in the market
5= we produced more.6= We produced less.7=Other (specify)
E5a E5b E5c E5dMaizeWheatTeffEdible OilMeat
Food

Ethiopia: Bellmon Analysis - 2014/15
90
6. Which statement applies best to the following foods in your area?
F. Food Security
1. Which would the poorest households in the area prefer to receive if available as
assistance (e.g. under the PSNP) (F1) 1=Food only 2=Cash only 3=Part food and part cash 4=Food in lean season and cash at other times
2. If their preference is for food only, what are the two main reasons? (F2)
1=Food can be sold to get cash and buy cheaper food as well 2=Cash is not enough to buy the food that we need 3=There is no food in the area to buy 4=Some people misuse cash, but it is harder to misuse food 5=Other (please list)
3. If the preference is for cash only, what are the two main reasons? (F3)
1=Cash can be spent on other things as well as food 2=Cash is easier to store than food 3=Cash is easier to carry home than food 4=Food is cheap and available and with cash we can do more 5=With cash we can buy the food that we want, not the food that we are given 6=Other (Please list)
4. If the preference is for food in one season and cash in another what is the preferred
mix? (F4) 1=First round : Food - next five rounds: Cash 2=First two rounds: Food - next four rounds: Cash 3=First three rounds: Food - next three rounds: Cash 4=First four rounds: Food - next two rounds: Cash 5=First five rounds: Food - last round: Cash.
Statement applying Best:1= It is available at a price we can afford2= It is available, but too expensive3= We have to travel out of the area to find it at a reasonable price4= It is not available anywhere
E6a EdbWheatMaizeSorghumTeff
Crop

Ethiopia: Bellmon Analysis - 2014/15
91
G. PSNP Impacts (for PSNP woredas only)
1. What is the average distance from the community to the nearest market selling:
wheat: ________________in km (G1a) pulses: _______________ in km (G1b) oil: ___________________in km (G1c)
2. Does this woreda receive food or cash or both under the PSNP? (G2)
1=food 2=cash 3=both
3. Do you notice a decrease in prices when PSNP food or cash is distributed? (G3)
1=yes 2=no 3= Not applicable 4. If you observed decrease in food price when food is distributed, what is your
estimate of the decrease? (G4) 1=less than 5% 2=5%to 10% 3=11% to 20% 4=21% to 40% 5=more than 40%
5. How long does the price decrease last when food is distributed? (G5) 1=less than two weeks 3=5 to 8 weeks 2=2 to 4 weeks 4= more than 8 weeks
6. Do you notice an increase in price when cash is distributed? (G6) 1= Yes 2= No 3= Not applicable
7. If you observed increase in food price when cash is distributed, what is your estimate of the increase? (G7)
1=less than 5% 4=21% to 40% 2=5% to 10% 5=more than 40% 3=11% to 20%
8. How long does the price increase last when cash is distributed? (G8) 1=less than two weeks 3=5 to 8 weeks 2=2 to 4 weeks 4=more than 8 weeks
For woredas that get food: 9. In those months when food aid is available through the PSNP, what
proportion of the food that a household eats will come from the PSNP? (G9)
1=Very small amount (up to 10%) 2=A significant amount (20-30%) 3=As much as half 4=More than half
10. Do traders come to buy food when it is distributed? (G10)
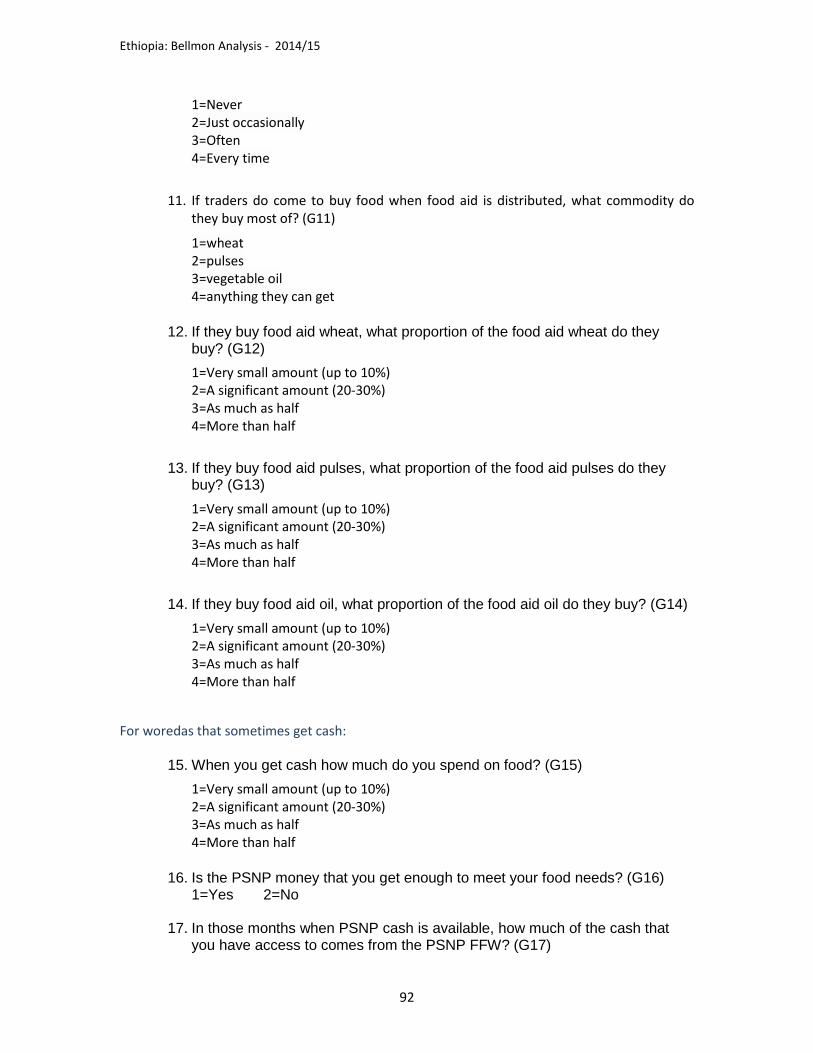
Ethiopia: Bellmon Analysis - 2014/15
92
1=Never 2=Just occasionally 3=Often 4=Every time
11. If traders do come to buy food when food aid is distributed, what commodity do they buy most of? (G11)
1=wheat 2=pulses 3=vegetable oil 4=anything they can get
12. If they buy food aid wheat, what proportion of the food aid wheat do they
buy? (G12) 1=Very small amount (up to 10%) 2=A significant amount (20-30%) 3=As much as half 4=More than half
13. If they buy food aid pulses, what proportion of the food aid pulses do they buy? (G13) 1=Very small amount (up to 10%) 2=A significant amount (20-30%) 3=As much as half 4=More than half
14. If they buy food aid oil, what proportion of the food aid oil do they buy? (G14) 1=Very small amount (up to 10%) 2=A significant amount (20-30%) 3=As much as half 4=More than half
For woredas that sometimes get cash:
15. When you get cash how much do you spend on food? (G15) 1=Very small amount (up to 10%) 2=A significant amount (20-30%) 3=As much as half 4=More than half
16. Is the PSNP money that you get enough to meet your food needs? (G16)
1=Yes 2=No
17. In those months when PSNP cash is available, how much of the cash that you have access to comes from the PSNP FFW? (G17)

Ethiopia: Bellmon Analysis - 2014/15
93
1=Very small amount (up to 10%) 2=A significant amount (20-30%) 3=As much as half 4=More than half
For all PSNP woredas:
18. Does the community know when food or cash will be distributed? (G18) 1=Yes 2=No
19. Is it on time enough to be able to predict it accurately? (G19) 1=Yes 2=No
20. Have farmers changed their use of inputs because of the PSNP? (G20)
1=Yes, we now use more of some inputs and/or less of others 2=No, there has been no change
21. Have farmers changed their cropping plans because of the PSNP? (G21) 1=Yes, we now grow more of some crops and/or less of others 2=No, there has been no change
Grain Traders’ Survey Questionnaire (March 2015) This questionnaire will be filled by interviewing grain traders operating in selected markets and three traders will be interviewed in each selected market. A. Identification
A. Region __________ (A1) B. Zone: ___________ (A2) C. Woreda _________ (A3) D. Market Place: _____________ (A4) E. Name of Interviewee: _______________ (A5) F. Date of Interview: ________________ (A6)
B. Market Flow
1. What is your assessment of the inflow and outflow of grain to the market so far this year (2007 EC) compared to the same period last year? Please provide answer for each of the five most important crops that the trader normally handles
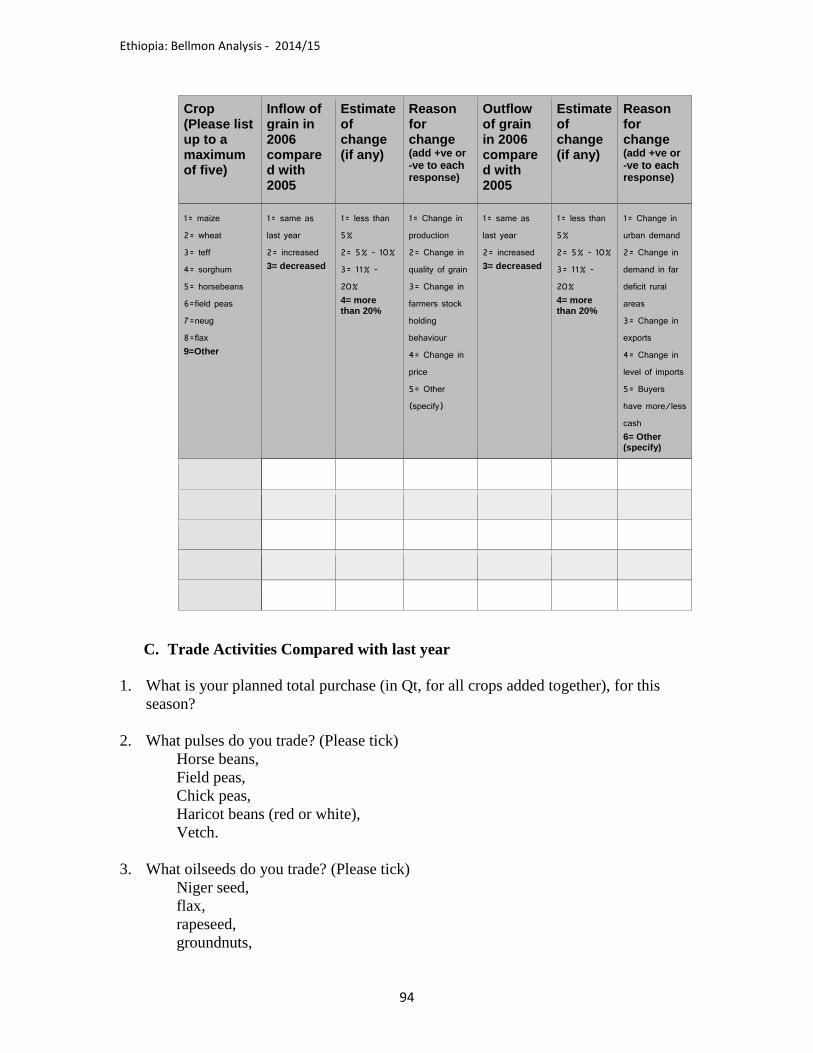
Ethiopia: Bellmon Analysis - 2014/15
94
Crop (Please list up to a maximum of five)
Inflow of grain in 2006 compared with 2005
Estimate of change (if any)
Reason for change (add +ve or -ve to each response)
Outflow of grain in 2006 compared with 2005
Estimate of change (if any)
Reason for change (add +ve or -ve to each response)
1= maize
2= wheat
3= teff
4= sorghum
5= horsebeans
6=field peas
7=neug
8=flax 9=Other
1= same as
last year
2= increased 3= decreased
1= less than
5%
2= 5% - 10%
3= 11% -
20% 4= more than 20%
1= Change in
production
2= Change in
quality of grain
3= Change in
farmers stock
holding
behaviour
4= Change in
price
5= Other
(specify)
1= same as
last year
2= increased 3= decreased
1= less than
5%
2= 5% - 10%
3= 11% -
20% 4= more than 20%
1= Change in
urban demand
2= Change in
demand in far
deficit rural
areas
3= Change in
exports
4= Change in
level of imports
5= Buyers
have more/less
cash 6= Other (specify)
C. Trade Activities Compared with last year
1. What is your planned total purchase (in Qt, for all crops added together), for this season?
2. What pulses do you trade? (Please tick)
Horse beans, Field peas, Chick peas, Haricot beans (red or white), Vetch.
3. What oilseeds do you trade? (Please tick)
Niger seed, flax, rapeseed, groundnuts,

Ethiopia: Bellmon Analysis - 2014/15
95
sunflower.
4. For each of the crops listed: how do your purchases so far this year compare to the same time last year ?
Crop How does
purchase in 2007 compare with purchase to same date in 2006
Extent of difference
Reason for change (add +ve or -ve to each response)
1= more
2= less
3= no change
4= Not applicable
1= >50%
2= 26-50%
3= 11-25%
4= 5-10%
5= <5%
1= Change in production
2= Change in quality of
grain
3= Change in farmers
stock holding behaviour
4= Change in price
5= Change in purchasing
capacity
6= Other (specify)
maize
wheat
sorghum
pulses
oilseeds
D. Market Structure
1. Please complete the following table for grain traders: Participant Assemblers Isuzu Buyers Traders Merchants
Number in area
Are numbers 1=increasing 2=decreasing 3= no change
2. What is the main cereal consumed in this area? 3. Is this area a deficit area for that cereal?

Ethiopia: Bellmon Analysis - 2014/15
96
4. If this area is not a cereal deficit area, go to question 5. Otherwise, please complete
the following table for the main cereal and for maize Please list the percentage supplied against each option. If the main cereal is maize, please complete only the maize column:
Cereal Cereal: Maize Options
Where do retailers buy their stocks from when local supplies have run out?
1= local traders with warehouses 2.= local Isuzu traders 3= large traders in bigger markets nearby 4= large traders in Addis 5= large traders in markets in surplus areas 6= Assemblers or Isuzu traders in surplus areas 7= Producers in surplus areas 8=Other (Please List)
Where do local traders buy their stocks from when local supplies have run out?
1.= local Isuzu traders 2= large traders in bigger markets nearby 3= large traders in Addis 4= large traders in markets in surplus areas 5= Assemblers or Isuzu traders in surplus areas 6= Producers in surplus areas 7=Other (Please List)

Ethiopia: Bellmon Analysis - 2014/15
97
Cereal Cereal: Maize Options
Where do local Isuzu traders buy their stocks from when local supplies have run out?
1= large traders in bigger markets nearby 2= large traders in Addis 3= large traders in markets in surplus areas 4= Assemblers or Isuzu traders in surplus areas 5= Producers in surplus areas 6=Other (Please List)
Do new traders ever move into the area when supplies have run out?
Which surplus area was the main source of supply last year?
What is the furthest place that cereals come from to the area?
What is the distance to that further market?
5. What is the main pulse consumed in this area? 6. Is this area a deficit area for that pulse? 7. If this area is not a pulse deficit area, please go to question 8. Otherwise please
complete the following table. Please list the percentages against each option

Ethiopia: Bellmon Analysis - 2014/15
98
Pulse Name: Options
Where do retailers buy their stocks from when local supplies have run out?
1= local traders with warehouses 2 = local Isuzu traders 3= large traders in bigger markets nearby 4= large traders in Addis 5= large traders in markets in surplus areas 6= Assemblers or Isuzu traders in surplus areas 7= Producers in surplus areas 8=Other (Please List)
Where do local traders buy their stocks from when local supplies have run out?
1= local Isuzu traders 2= large traders in bigger markets nearby 3= large traders in Addis 4= large traders in markets in surplus areas 5= Assemblers or Isuzu traders in surplus areas 6= Producers in surplus areas 7=Other (Please List)
Where do local Isuzu traders buy their stocks from when local supplies have run out?
1= large traders in bigger markets nearby 2= large traders in Addis 3= large traders in markets in surplus areas 4= Assemblers or Isuzu traders in surplus areas 5= Producers in surplus areas 6=Other (Please List)
Do new traders ever move into the area when supplies have run out?
Which surplus area was the main source of supply of pulses last year?

Ethiopia: Bellmon Analysis - 2014/15
99
Pulse Name: Options
What is the furthest place that pulses come from to the area?
What is the distance to that further market?
8. Would you please indicate in the following table your main grain buyers in 2003/4
E.C.? Major buyers that buy grain from you
% share of your annual sales they bought so far this year (2007 EC)
% share of your annual sales they bought last year (2006 EC)
1= Local retailers
2= Local Consumers
3= Local grain trading companies
4= Traders in Addis Ababa
5= Traders from deficit regions
6= Large and medium flour mills
7= EGTE
8= Other (specify)
Total 100%
9. Please indicate in the following table, where you buy grain from:
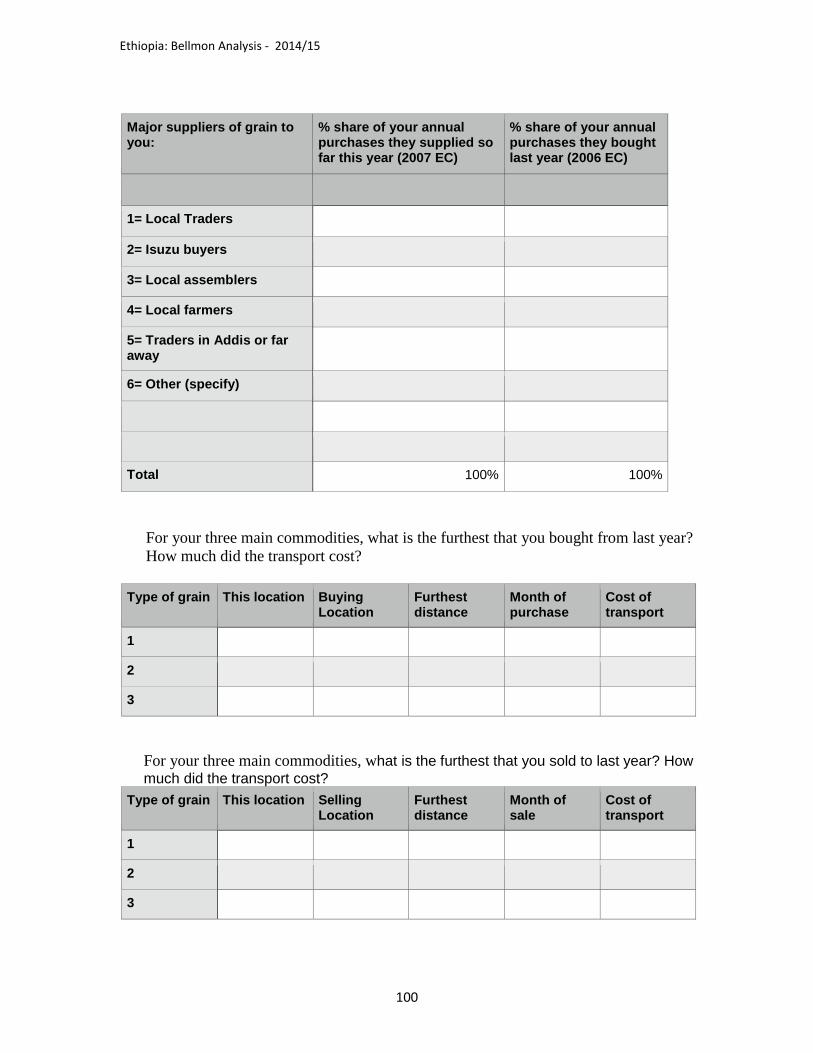
Ethiopia: Bellmon Analysis - 2014/15
100
Major suppliers of grain to you:
% share of your annual purchases they supplied so far this year (2007 EC)
% share of your annual purchases they bought last year (2006 EC)
1= Local Traders
2= Isuzu buyers
3= Local assemblers
4= Local farmers
5= Traders in Addis or far away
6= Other (specify)
Total 100% 100%
1. For your three main commodities, what is the furthest that you bought from last year?
How much did the transport cost? Type of grain This location Buying
Location Furthest distance
Month of purchase
Cost of transport
1
2
3
2. For your three main commodities, what is the furthest that you sold to last year? How
much did the transport cost? Type of grain This location Selling
Location Furthest distance
Month of sale
Cost of transport
1
2
3
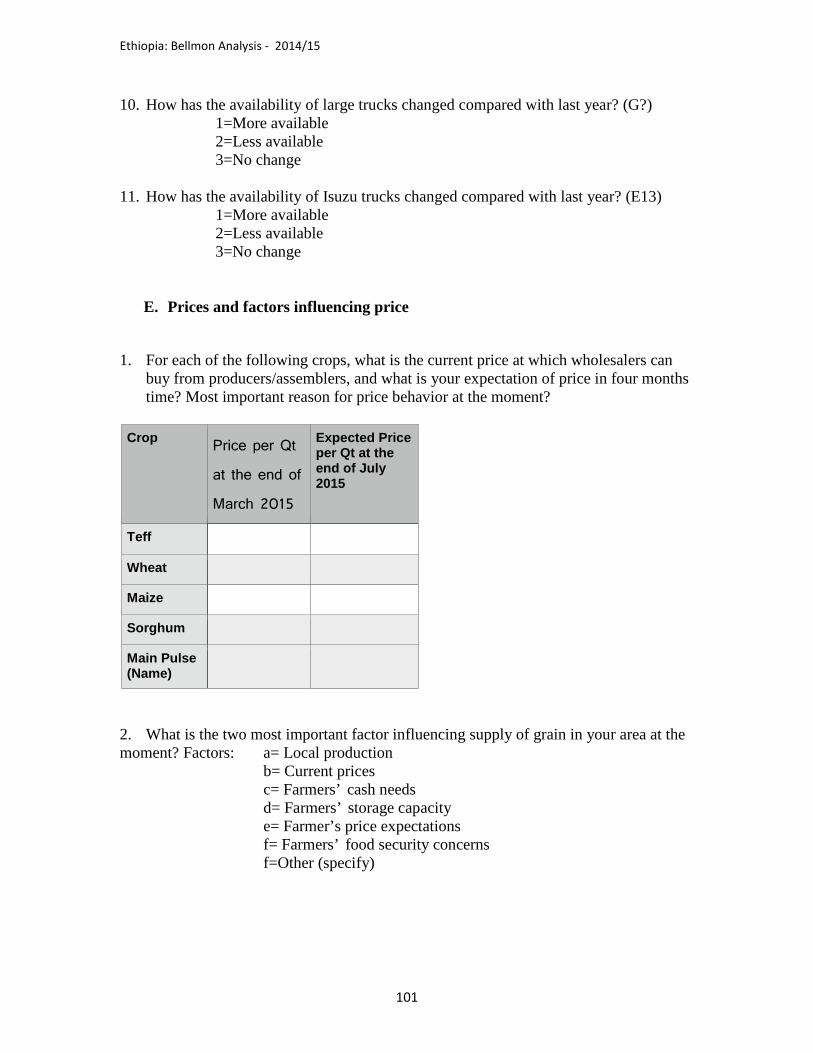
Ethiopia: Bellmon Analysis - 2014/15
101
10. How has the availability of large trucks changed compared with last year? (G?) 1=More available 2=Less available 3=No change
11. How has the availability of Isuzu trucks changed compared with last year? (E13)
1=More available 2=Less available 3=No change
E. Prices and factors influencing price
1. For each of the following crops, what is the current price at which wholesalers can
buy from producers/assemblers, and what is your expectation of price in four months time? Most important reason for price behavior at the moment?
Crop Price per Qt
at the end of
March 2015
Expected Price per Qt at the end of July 2015
Teff
Wheat
Maize
Sorghum
Main Pulse (Name)
2. What is the two most important factor influencing supply of grain in your area at the moment? Factors: a= Local production b= Current prices c= Farmers’ cash needs d= Farmers’ storage capacity e= Farmer’s price expectations f= Farmers’ food security concerns f=Other (specify)

Ethiopia: Bellmon Analysis - 2014/15
102
Teff Wheat Maize Sorghum Main Pulse
(Name)
Most important Factor
Second important
3. What are the most important factors that currently influence demand for grain in your
area? Please list top two factors in the table below: Factors: a= Local production b= Production in deficit areas (if this area is not a deficit area) c= EGTE purchase activity d= Purchasing capacity of traders e= Strong export markets f= Buying power of consumers g= WFP purchase activities h= Food aid distribution activities i= Millers purchase activities j=Other (specify)
Teff Wheat Maize Sorghum Main Pulse (Name)
Most important Factor
Second important
4. Who has the biggest influence and who has the least influence on the wholesale price
of your main three commodities? Please select from:
1. Traders like me 2. EGTE 3. WFP 4. Cooperatives 5. Isuzu traders 6. Big grain merchants in Addis 7. Government 8. Local authorities 9. Donors bringing food aid 10. Little retail outlets

Ethiopia: Bellmon Analysis - 2014/15
103
11. Consumers 12. Other (please specify)
Crop Biggest
Influence Least influence
1
2
3
F. Access to credit 1. Do you have access to bank credit for the purchase of grain? (E1)
1=yes 2=no
2. Has the availability of credit changed over the last six months? (E2) 1. No. 2. Yes, it has become harder to obtain credit 3. Yes, credit is available but interest rates have gone up. 4. Credit is now easier to obtain.
3. If credit has become harder to obtain, has that affected your purchase and sales? (E3)
a. No. b. Yes, I purchase and sell less c. Yes, I purchase and sell the same but in smaller amounts
4. If credit has become harder to get, what is the main reason? (E4) d. No collateral e. Interest rates too high f. Other bank charges too high g. Don’t have the necessary contacts
5. If you purchase and sell less overall, by how much has your business been reduced?
(E5) 1. Up to 10% 2. Up to 25% 3. Up to 50% 4. More than 50%
G. Labor
1. What is the cost of unskilled labor in your area (per day) now? ______ birr/day (H1)

Ethiopia: Bellmon Analysis - 2014/15
104
2. Has the cost of labor increased since this time last year or decreased? (H2) 1=increased 2=the same 3=decreased
3. What was the cost of labor at this time last year? ________ birr/day (H3)
4. Is unskilled labor easier or harder to find than it was at this time last year? (H4) 1=Easier 2=No change 3=Harder
H. Additional Questions for Traders in PSNP woredas
1. Are there areas in this woreda where pulses are not available in the markets at some
times of the year? 1=Yes 2=No 3=Don’t know 2. Are there areas in this woreda where cereals are not available in the markets at some
times of the year? 1=Yes 2=No 3=Don’t know 3. If there are areas where pulses or cereals are sometimes not available in the markets,
what is the main reason? 1= There are no towns or villages big enough for a market 2= The cost of transport to bring cereals or pulses to the markets that exist is too high. 3= There is a better market in the woreda so all grain goes there instead 4= The population there is so small that it is not worth it to bring grain to the area. 5= The population there is too poor to be able to afford enough grain to make the business worthwhile 6= Food aid makes the markets there too uncertain 7= No one goes there 8= Other( please list) 4. Are there areas in this woreda where edible oil is not available in the markets at some
times of the year? 1=Yes 2=No 3=Don’t know 5. If there are areas where edible oil is sometimes not available in the markets, what is
the main reason? 1= There are no towns or villages big enough for a market 2= The cost of transport to bring oil to the markets that exist is too high. 3= There is a better market in the woreda so all oil goes there instead 4= The population there is so small that it is not worth it to bring oil to the area. 5= The population there is too poor to be able to afford enough oil to make the business worthwhile 6= Food aid makes the markets there too uncertain 7= No one goes there 8= Other( please list)

Ethiopia: Bellmon Analysis - 2014/15
105
6. Does this woreda receive food or cash or both under the PSNP? (G1)
1= Food 2= Cash 3= Both
7. Do you notice any change in prices when PSNP food or cash is distributed? (G2) 1=Yes 2= No
8. If yes, what changes do you notice when food is distributed? (G3)
1=increase in food prices 2=decrease in price
9. If you observed increase in food price when food is distributed, what is your estimate of the increase? (G4)
1=less than 5% 2=5%to 10% 3=11% to 20% 4=21% to 40% 5=more than 40%
10. If you observed decrease in food price when food is distributed, what is your estimate
of the decrease? (G5) 1=less than 5% 2=5%to 10% 3=11% to 20% 4=21% to 40% 5=more than 40%
11. How long does the price increase last when food is distributed? (G6)
1=less than two weeks 2=2-4 weeks 3=5-8 weeks 4=more than 8 weeks
12. How long does the price decrease last when food is distributed? (G7)
1=less than two weeks 2=2-4 weeks 3=5-8 weeks 4=more than 8 weeks
13. If you noticed any change in prices when cash is distributed, what were the changes?
(G8) 1=increase in food prices 2=decrease in price
14. If you observed increase in food price when cash is distributed, what is your estimate of the increase? (G9)
1=less than 5% 2=5%to 10% 3=11% to 20% 3=21% to 40% 4=more than 40%
15. If you observed decrease in food price when cash is distributed, what is your estimate
of the decrease? (G10) 1=less than 5% 2=5%to 10% 3=11% to 20% 3=21% to 40% 4=more than 40%

Ethiopia: Bellmon Analysis - 2014/15
106
16. How long does the price increase last when cash is distributed? (G11) 1= less than two weeks 2= 2-4 weeks 3= 5-8 weeks 4= more than 8 weeks
17. If prices rise, do they rise enough to:
1. attract new suppliers to the area? 2. encourage local traders to look for more supplies?
Which is more common? (1 or 2)
18. How long does the price decrease last when cash is distributed? (G12) 1= less than two weeks 2= 2-4 weeks 3= 5-8 weeks 4= more than 8 weeks
19. If food aid is distributed in your area, are there beneficiaries ready to sell food aid in your area?
1. yes 2. No 3. Food aid is not distributed in this area
20. How much food aid wheat do beneficiaries in your area sell?
1. None at all 1. A small amount (0–10%) 2. Quite a lot (20–30%) 3. About half 4. More than half
23. How much food aid pulses do beneficiaries in your area sell?
1. None at all 2. A small amount (0–10%) 3. Quite a lot (20–30%) 4. About half 5. More than half
24. How much food aid oil do beneficiaries in your area sell?
1. None at all 2. A small amount (0–10%) 3. Quite a lot (20–30%) 4. About half 5. More than half
25. Is your business affected by the PSNP? - select one only: (G13)
1= No – there is no impact 2= Yes, PSNP restricts our business

Ethiopia: Bellmon Analysis - 2014/15
107
3= Yes, PSNP stabilizes our market 4= Yes, PSNP increases our profit 5= Yes, PSNP reduces our profit 6= Yes, other (please specify)