Embed Size (px)
Citation preview

LUND UNIVERSITY
PO Box 117221 00 Lund+46 46-222 00 00
Ethanol from Sugarcane Lignocellulosic Residues - Opportunities for ProcessImprovement and Production Cost Reduction
Macrelli, Stefano
Published: 2014-01-01
Link to publication
Citation for published version (APA):Macrelli, S. (2014). Ethanol from Sugarcane Lignocellulosic Residues - Opportunities for Process Improvementand Production Cost Reduction Department of Chemical Engineering, Lund University
General rightsCopyright and moral rights for the publications made accessible in the public portal are retained by the authorsand/or other copyright owners and it is a condition of accessing publications that users recognise and abide by thelegal requirements associated with these rights.
• Users may download and print one copy of any publication from the public portal for the purpose of privatestudy or research. • You may not further distribute the material or use it for any profit-making activity or commercial gain • You may freely distribute the URL identifying the publication in the public portal

Take down policyIf you believe that this document breaches copyright please contact us providing details, and we will removeaccess to the work immediately and investigate your claim.
Download date: 30. Aug. 2018

Ethanol from sugarcane lignocellulosic residues
STEFANO MACRELLI | CHEMICAL ENGINEERING | LUND UNIVERSITY
Opportunities for process improvement and production cost reduction


Ethanol from sugarcane lignocellulosic residues
Opportunities for process improvement and production cost reduction
DOCTORAL DISSERTATION
2014
Stefano Macrelli
Department of Chemical Engineering, Lund University, Sweden
by due permission of the Faculty of Engineering, Lund University, Sweden, will be publicly defended on 3rd of October at 10.30 in lecture hall K:B at the
Center of Chemistry and Chemical Engineering, Getingevägen 60, Lund, for the degree of Doctor of Philosophy in Engineering.
The faculty opponent is Dr. Antonio Bonomi, Brazilian Bioethanol Science and Technology Laboratory (CTBE), Campinas-SP, Brazil.

ii
Ethanol from sugarcane lignocellulosic residues
© 2014 Stefano Macrelli
Department of Chemical Engineering Lund University ISBN 978-91-7623-087-9 (print) ISBN 978-91-7623-088-6 (pdf) Printed in Sweden by Media-Tryck, Lund University Lund 2014

iii
To my Mother, and in loving memory of my Father


v
Abstract
Bioethanol from sugarcane is a sustainable alternative to fossil fuels, and the increasing demand for fuel ethanol has prompted studies on the use of the lignocellulosic residues of sugarcane, namely bagasse and leaves, as new feedstock. This thesis describes various process designs and the economic feasibility of producing second generation (2G) ethanol from bagasse and leaves via the enzymatic route in an integrated sugarcane biorefinery, where first-generation (1G) ethanol is produced from sugarcane sugar. Techno-economic analysis have been performed for the Brazilian context to evaluate the influence of several process designs and the main production factors on the 2G ethanol process, in terms of energy efficiency, 2G ethanol production cost (2G MESP) and profitability.
The study of process design focused on ways to integrate the 1G and 2G ethanol processes, and on configurations to hydrolyse and ferment bagasse. The existing 1G ethanol process and the proposed 2G ethanol process were combined in a single plant by integration of thermal and material streams. The resulting synergies could improve the use of feedstock and reduce the 2G ethanol production cost. Simultaneous saccharification and fermentation (SSF) and time-separated hydrolysis and fermentation (tSHF) were the configurations investigated experimentally for the production of 2G ethanol from bagasse. In an attempt to increase the ethanol concentration before distillation, the fermented liquid of tSHF was also recirculated back to tSHF. The tSHF configurations showed a lower 2G MESP than SSF.
Process options were also investigated considering the pentose use and the addition of leaves to the 1G+2G process. Pentoses can either be fermented to ethanol or anaerobically digested to produce electricity from biogas combustion, and in the former case the highest potential reduction in 2G MESP could be achieved. The addition of leaves could improve the overall profitability of the 1G+2G process.
Residence time and water-insoluble solids (WIS) loading in hydrolysis were the main process conditions considered together with costing factors, such as enzyme, sugarcane and leaves costs. The selling price of electricity and ethanol were found to have relevant impacts on the profitability of the 1G+2G ethanol process.

vi
Among the numerous operating conditions studied for the 2G ethanol process, the cases showing the best trade-off between technical and economic feasibility were also tested experimentally on laboratory scale obtaining promising results. In fact, it was possible to achieve high concentrations of 2G ethanol (47 g/L) in short time (60 hours), overcoming the mixing problems by feeding repeatedly the pretreated bagasse up to 20% WIS.

vii
Popular Scientific Summary
Modern society is still largely based on fossil resources. However, there are growing concerns about the security and cost of these resources, as well as climate change resulting from the combustion of fossil fuels. Biofuels represent renewable fuels with the potential to mitigate the adverse effects of fossil fuels, providing a more sustainable alternative.
The transport sector in Brazil currently relies mainly on first generation (1G) fuel ethanol produced from the fermentation of the sugar fraction of sugarcane, and is considered a successful example of biofuel penetration and replacement of fossil fuels. Theoretically, almost double the amount of ethanol could be produced if the residues from the sugarcane industry, namely the bagasse and leaves, were also used as feedstock. Bagasse and leaves constitute the lignocellulosic fraction of sugarcane, and the ethanol obtained from these materials is known as second generation (2G) ethanol or lignocellulosic ethanol. However, lignocellulose is made up of a complex matrix containing the three constituents, cellulose, hemicellulose and lignin, which are strongly bound to each other. For this reason, it is more difficult to break down lignocellulose to fermentable sugars, than sucrose or starch, and the production process is thus more complex and costly. High production costs are the major drawback of the 2G ethanol production process, delaying the deployment of commercial-scale facilities. Many production parameters and economic factors influence the final cost of 2G ethanol, and several technological options and trade-offs can be explored and analysed in order to improve the competitiveness of 2G ethanol.
The aim of the work presented in this thesis was to analyse the production of 2G ethanol from sugarcane bagasse and leaves in Brazil, and to identify opportunities for reducing the production cost by considering process designs and factors affecting the cost. Simulation of the ethanol production process was the major tool used, together with laboratory experiments for interesting cases.
The availability of bagasse at 1G ethanol production sites and local availability of leaves makes it favourable to co-locate 2G ethanol plants with existing 1G ethanol plants. The two processes can be combined in a plant

viii
where process and energy streams are integrated. Producing 1G and 2G ethanol in an integrated plant can provide a reduction in the cost of 2G ethanol, and more efficient energy use. Such an integrated ethanol production plant can be regarded as an ethanol-oriented biorefinery, where electricity is also produced from the combustion of residual streams, namely biogas and unreacted lignocellulose. Maximizing 2G ethanol production was found to be more profitable than selling electricity. However, the additional cost of achieving a high conversion of bagasse and leaves to 2G ethanol depends on the strategies employed as well as the degree of conversion.
A range of options with different technical feasibility and the most relevant production factors were studied. The process configuration can be designed to tackle specific issues, but experimental data are necessary to prove the feasibility of the concept both technically and economically. Experiments were performed to collect data for a few process configurations, and simulations showed that in some cases the production cost involved in improving the ethanol production was too high to be commercially feasible. External economic factors, such as the selling prices of electricity and ethanol, and the cost of feedstock and biocatalyst also appeared to have a considerable effect on the profitability of 2G ethanol.
In none of the cases investigated the combination of technical options and economic factors was found that could reduce the production cost of 2G ethanol from bagasse and leaves to that of 1G ethanol without subsidies. However, 2G ethanol could be cheaper than 1G ethanol if selling prices were lower for electricity and higher for ethanol. Moreover, 2G ethanol could also contribute to achieve better profitability than producing 1G ethanol and electricity. Finally, there is considerable scope for further reductions in cost that could improve the competitiveness of 2G ethanol on the fuel market.

ix
List of publications This thesis is based on the following publications, which will be referred to in
the text by their roman numerals.
I. Macrelli S, Mogensen J, Zacchi G Techno-economic evaluation of 2nd generation bioethanol production from sugar cane bagasse and leaves integrated with the sugar-based ethanol process. Biotechnology for Biofuels 5:22 (2012)
II. Macrelli S, Galbe M, Wallberg O Effects of production and market factors on ethanol profitability for an integrated first and second generation ethanol plant using the whole sugarcane as feedstock. Biotechnology for Biofuels 7:26 (2014)
III. Macrelli S, Galbe M, Wallberg O Concepts and strategies for hydrolysis and fermentation to reduce the production cost of cellulosic ethanol from sugarcane bagasse. (Submitted)
IV. Macrelli S, Galbe M, Wallberg O Evaluation of feasible cost margins for yield-improving strategies in the production of cellulosic ethanol from sugarcane bagasse. (Manuscript)

x

xi
My contributions to the publications
I. I participated in the design of the study and the analysis of the results. I carried out the simulations and the economic evaluation, and wrote the manuscript.
II. I designed the study, carried out the simulations, interpreted the data and wrote the manuscript.
III. I designed the experimental and the techno-economic parts of the study. I participated in the experimental work and carried out the simulations. I interpreted the data and wrote the manuscript.
IV. I designed the study, carried out the simulations, interpreted the data and wrote the manuscript.
Other related publications I also have contributed to the following publications, which are not included in this thesis:
Kovacs K, Macrelli S, Szakacs G, Zacchi G Enzymatic hydrolysis of steam-pretreated lignocellulosic materials with Trichoderma atroviride enzymes produced in-house. Biotechnology for Biofuels 2:14 (2009)
Ferreira-Leitão V, Perrone CC, Rodrigues J, Franke AP, Macrelli S, Zacchi G An approach to the utilisation of CO2 as impregnating agent in steam pretreatment of sugar cane bagasse and leaves for ethanol production. Biotechnology for Biofuels 3:7 (2010)

xii
xiii
Acknowledgements The few doubts I had when I started my PhD were readily gone thanks to people that contributed to make my time great at work and afterwork, and also supported me during difficult moments. During these years I have had the privilege to perform my research at the Department of Chemical Engineering and to meet friendly and skilled colleagues who made my stay fruitful and joyful.
Above all, I want to express my deep and sincere gratitude to:
My former supervisor Guido Zacchi, for your help and invaluable suggestions arriving with a magic timing, for that blank page that you always made available for me to fill with new ideas and side-projects, and the only boundaries you wanted to establish were the page borders you called perspectives.
My co-supervisor Mats Galbe, for the many years of your unconditioned support also in the lab, for your contagious enthusiasm in research, even when you were dragged around to solve daily issues in the lab. Your answer “why not” to my improbable research dilemmas kept the spark alive until I had nothing left but to blame the results, and learn from them, and learn from you.
My new supervisor Ola Wallberg, for your right “touch” and for showing me that thumb rules work fine and save time instead of adopting a cosmologic framework. Thanks for great pieces of advice. And now also for your quick but precious artwork.
Life in lab and out would have been unbearable without such special past and present colleagues, friends and companions! I want to thank all of you, one by one! Even for a short chitchat or “fika” we had together or for weeks lost in conferences/courses and in crazy-weekends abroad. Thanks for a small gesture of care and/or for the major help you gave me. And I apologise in advance if I forget to include all of you. Special thank goes to my roommates with whom I shared several hundred days: Kerstin, Kriszta, Marie, Sarita, every day side by side... Thanks for the many laughs, chats and for serious work too! Starting with my former mentor Borbala, I want to thank: Elisabeth partner of travels and adventures, Johanna, Anders, Fredrik, Pia-Maria, Balazs, Dora, Christian R; and from +1 Sara, Karin, Benny, for the intense time together in the lab and chill-out moments. Thanks to Claudia, Lorenzo, Martina, Silvia, Alessandra, Michele, Andrea, for working “gomito a gomito”, it has been amusing too running experiments with you!

xiv
Many thanks also to past colleagues, to Mariagrazia, Per, Mattias, Sanam, Holger, Aurelie, Kim, Magnus. I want also to thank colleagues from the other departments for exchanging ideas how to solve lab problems: Maurizio, Rodrigo, Rosa, Violeta. What about Hans-Olof, Leif, Lill, Lena and Maria who made the days easier and free from technical and administrative problems?!?! Thank you!
Outside the department was a kind of a lovely jungle and big family: I want to mention and thank Folks from Möllevångsvägen & the German Embassy: Chiara P., Severine, Alba, Bruno, Agnieszka, Reno, Federico, Mariano, Ana, Stephane, the Tiago M&F, Miguel, Irem, Nata, Mike, Basti, Charlotte, Janina, Celen, Rafael. Obviously my “ossequi e riconoscenze” to the Italian gang in Lund: Carlo, Marisa, Fabio, Serena, Chiara, Antonio, Florido, Francesca, Gabriele. David Cannella, for the experiments we never managed to run together but at least we compensated for with equally good parties… The Hungarian squad: Zsolti, Miklos, Balint, always the first in line. To Helen, for your kindness and suggestions about the thesis. To Paula, for your artistic taste, patience and fundamental help in setting the thesis print. I could not have had the opportunity to accomplish my PhD studies without the help and support coming from my hometown:
Linda Tollja, you have been invaluable for your constant help over these years, thank you for caring and taking care while I was here. Thank you also for your precious friendship.
Leonardo, the brother I never had, and Mauro, the cousin I luckily have, thanks for always being there in case of need and in case of fun!
To the cheerful company of Rimini beach boyz ‘n girlz and our nights out!
I am very grateful to my Godfather Lidano, for always being inspiring with enlightening talks from science to metaphysics which have been ending up in hints on how to remove the Maya’s veil…. thanks for letting me sail in your deep culture and affection.
Probably I wouldn’t be here if it wasn’t for the love and education I have received from my parents. Starting from that chocolate bar hidden by my mom when I was a child… which I like to think it triggered the impulse towards some kind of research … Or the continuous flow of my dad’s patience permeating me the first time we went fishing with rod and line… These and much more have held me up during these years at work, so this PhD is dedicated to you both.

xv
Abbreviations
1G First generation
2G Second generation
1G+2G Combined first and second generation
B Bagasse
B+L Bagasse with addition of leaves
C6 Hexose fermentation and biogas production from pentoses
C5+C6 Pentose co-fermentation
CHP Combined heat and power
DM Dry matter
dSC Sugarcane, on dry basis
EHE Enzymatic hydrolysis efficiency
EtOH Ethanol
MESP Minimum ethanol selling price
SC Sugarcane, on wet basis
SHF Separate hydrolysis and fermentation
SSF Simultaneous hydrolysis and fermentation
tSHF time-separated hydrolysis and fermentation
WIS Water-insoluble solids


xvii
Contents
1 Introduction 1
1.1 World production of fuel ethanol 3
1.2 Ethanol as a transportation fuel 4
1.3 Aim and outline of this thesis 5
2 The sugarcane biorefinery 7
2.1 Raw material: sugarcane 8
2.2 The first-generation ethanol process 11
2.3 The second-generation ethanol process 13
2.3.1 The enzymatic route for 2G ethanol 13
2.4 The ethanol process by-products 19
2.4.1 Vinasse 19
2.4.2 Biogas 20
2.4.3 Bioelectricity 21
2.5 Green chemistry and inherent safety principles 22
3 Factors influencing the production, costs and profitability 25
3.1 Process design 28
3.1.1 Integration of 1G and 2G ethanol 28
3.1.2 Configurations for hydrolysis and fermentation 34

xviii
3.2 Process options 39
3.2.1 Use of pentoses: electricity from biogas vs. ethanol 39
3.2.2 Addition of leaves 40
3.3 Yields 42
3.4 Process conditions 46
3.4.1 Residence time for hydrolysis and fermentation 46
3.4.2 Water-insoluble solids 49
3.5 Costing factors and market prices 50
3.5.1 Enzyme efficiency and cost 50
3.5.2 Cost of sugarcane and leaves 52
3.5.3 Ethanol and electricity selling prices 52
3.6 Rank of 2G MESPs and 1G+2G MESPs by combining the production factors 53
4 Conclusions and future work 57
4.1 General conclusions 57
4.2 Specific conclusions from techno-economic evaluations 58
4.3 Specific conclusions from experiments 60
4.4 Future work 60
References 61

1
1 Introduction
The society of the 21st century is facing considerable challenges related to the increase in population and in the demand for food and energy, the depletion of fossil resources, oil price fluctuations, energy security and climate change. New policies addressing these issues are being introduced to improve sustainability, and reduce the negative effects on the environment resulting from human activities.
Since 1970 the energy demand worldwide has been growing at an average rate of 2% per year, mainly due to the expansion of industrial and transportation systems, which are the most energy-intensive sectors, and rely heavily on fossil resources for energy and raw materials (IEA 2012). Oil prices exceeding 100 US$/barrel, recorded in recent years, have motivated the search for alternative energy sources, preferably renewable ones, and ones more geographically evenly distributed. The IEA has predicted that the price of oil may increase to 150 US$/barrel by 2035 if no new policies are implemented, posing a threat to the economic activities (IEA 2012).
Over 50% of global oil consumption is used for the transportation of people and goods. This is expected to increase further with the growth in population and wealth, especially in the developing countries, mainly due to the increase in light-duty vehicles and road freight (IEA 2012). It has been estimated that the transport sector was responsible in 2010 for the 14% of all greenhouse gas (GHG) emissions (IEA 2012). In recent years a reduction of GHG emissions was observed due to global economic downturn and the implementation of policies to decrease the GHG emissions. Nevertheless, recent measurements and prognoses show that the CO2 concentration in the atmosphere has been rising since 1850, and will continue to rise unless stringent policies and measures are implemented (IPCC 2013).
There is strong scientific evidence that the CO2 generated from the combustion of fossil fuels and other GHG emissions from human activities cause global warming and climate change (IPCC 2013). The increased frequency and intensity of extreme weather events, which have caused widespread disasters in communities and countries, with substantial economic losses, have been ascribed to climate change with high confidence (IPCC

2
2012). Hence, the need for alternative and more carbon-neutral energy sources has increased interest in renewable fuels produced from biomass, which have the potential to reduce GHG emissions. Biogas, ethanol, butanol and biogasoline are the major transportation biofuels that can be obtained by processing the sugar, starch and lignocellulosic fractions present in biomass, as well as municipal waste.
Expanding current biofuel production from sugar- and starch-based crops has raised concerns about competition with crops cultivated for food and natural resources, such as water and productive land (FAO 2011). However, food equity and security could be guaranteed by the use of non-edible feedstock for biofuel production, such as lignocellulosic materials, that can be cultivated on marginal land (e.g. switchgrass, sweet sorghum, Arundo donax), or agricultural residues from food crops (e.g. wheat straw, corn stover and cobs, sugarcane bagasse and leaves). Both hardwood and softwood are made up of lignocellulose, and forestry residues are also a viable alternative to sugar- and starch-based crops for biofuel production.
Biofuels obtained from lignocellulosic feedstock, so-called second-generation (2G) biofuels are recognized to have greater GHG mitigation potential than first generation (1G) biofuels produced from starch (Directive 2009/28/EC). The GHG emission for a given biofuel is estimated considering the entire life cycle “from field to wheel”, including all the material and energy inputs, as well as effects on the environment. Attention has recently been drawn to the land required for the start-up or expansion of dedicated energy crops, which is considered to affect the environmental performance of biofuel. Indeed, by displacing competing crops (food/animal feed) and thereby forcing these crops to be grown on previously non-utilized land may lead to new GHG emissions; an effect known as indirect land use change (ILUC). Legislators in the EU and the USA aiming to reduce the carbon intensity of transportation fuels have acknowledged the relevance of the ILUC effect in biofuel production, and decided to account for ILUC-generated GHG emissions in directives where the minimum GHG reduction potential is set for each feedstock and production system (EISA 2007; Directive 2009/30/EC).
Given the high fuel demand for transportation purposes, the replacement of fossil fuels with biofuels can contribute only in part to the energy supply problem (IEA 2012). However, biofuels currently offer the best opportunity to tackle the issues of sustainability and energy security simultaneously and efficiently, if advanced production/life-cycle systems are carefully designed to meet the environmental, economic and social constraints, while ensuring high production targets.
3
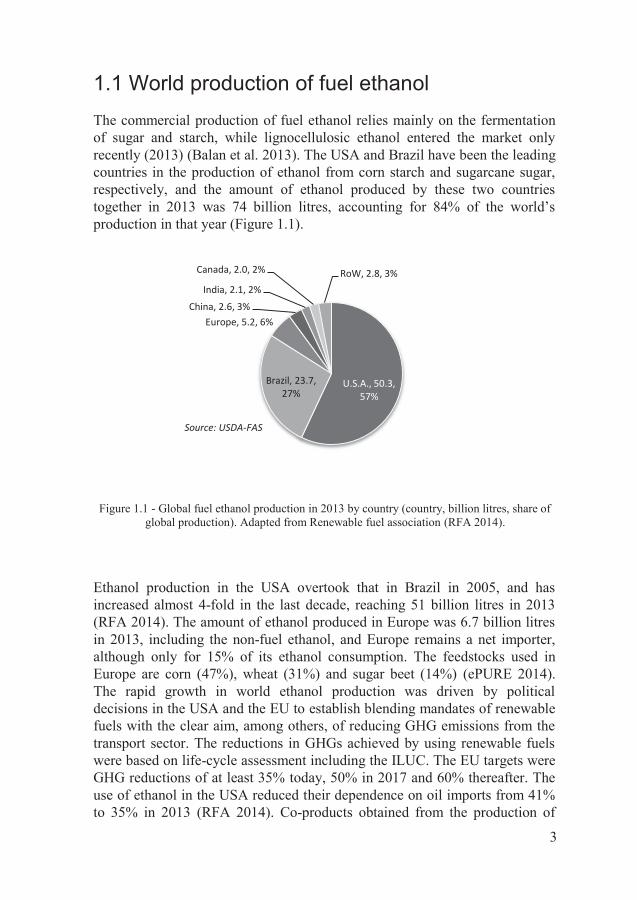
1.1 World production of fuel ethanol The commercial production of fuel ethanol relies mainly on the fermentation of sugar and starch, while lignocellulosic ethanol entered the market only recently (2013) (Balan et al. 2013). The USA and Brazil have been the leading countries in the production of ethanol from corn starch and sugarcane sugar, respectively, and the amount of ethanol produced by these two countries together in 2013 was 74 billion litres, accounting for 84% of the world’s production in that year (Figure 1.1).
Figure 1.1 - Global fuel ethanol production in 2013 by country (country, billion litres, share of global production). Adapted from Renewable fuel association (RFA 2014).
Ethanol production in the USA overtook that in Brazil in 2005, and has increased almost 4-fold in the last decade, reaching 51 billion litres in 2013 (RFA 2014). The amount of ethanol produced in Europe was 6.7 billion litres in 2013, including the non-fuel ethanol, and Europe remains a net importer, although only for 15% of its ethanol consumption. The feedstocks used in Europe are corn (47%), wheat (31%) and sugar beet (14%) (ePURE 2014). The rapid growth in world ethanol production was driven by political decisions in the USA and the EU to establish blending mandates of renewable fuels with the clear aim, among others, of reducing GHG emissions from the transport sector. The reductions in GHGs achieved by using renewable fuels were based on life-cycle assessment including the ILUC. The EU targets were GHG reductions of at least 35% today, 50% in 2017 and 60% thereafter. The use of ethanol in the USA reduced their dependence on oil imports from 41% to 35% in 2013 (RFA 2014). Co-products obtained from the production of
U.S.A., 50.3, 57%
Brazil, 23.7, 27%
Europe, 5.2, 6% China, 2.6, 3%
India, 2.1, 2%
Canada, 2.0, 2% RoW, 2.8, 3%
Source: USDA-FAS
4
ethanol from corn are fundamental to the economy of the process: 27% of the gross revenues is obtained from selling distillers grains and corn distiller oil (RFA 2014). The results of modelling suggest that producing ethanol from corn reduces GHG emissions by 34%, and the energy return on energy invested (EROEI) is 2.3 (RFA 2014).
In Brazil, however, ethanol production decreased during the harvest seasons 2011/2012 and 2012/2013 due to adverse climate conditions and reduced renewal rate of sugarcane plantations. Moreover, an increase in sugar prices shifted the use of sugarcane towards the more remunerative production of crystal sugar (up to 50%). In the 2013/2014 season the sugarcane harvest increased by 12% to 653 million tons, and 55% of the sugarcane was used to produce ethanol, reaching a volume of 30 billion litres. Anhydrous ethanol was 45% of the total amount of ethanol produced (UNICA 2014). Importation of ethanol to Brazil was necessary to fulfil the high demand, and to comply with the mandates for blending. The share of blending anhydrous ethanol with gasoline returned to 25% after falling to 20% in 2011, and recently has risen to 27.5% (MAPA 2014).
1.2 Ethanol as a transportation fuel Ethanol is regarded as a promising alternative to liquid fossil fuels as it can be blended with gasoline at various ratios depending on the car engine capability, and thus has the potential to gradually replace gasoline without any need to change the existing distribution infrastructure. Ethanol blends depend on many factors, including government policies, geographic location and climate. Generally, up to 10% anhydrous ethanol can be used in conventional combustion engines, while blends up to 100% can be used in flexible-fuel engines.
The private car market in Brazil has been shifting towards flexible-fuel vehicles since 2003, and in 2013, 94% of new spark-ignition vehicles purchased in Brazil had a flexible-fuel engine. However, the demand for gasoline A (containing no ethanol) in Brazil is still rising (from 22.8 billion litres in 2010 to 31.7 in 2013) due to the increase in the total number of vehicles (Bloomberg 2013).
Ethanol could be used as a transportation fuel in other kinds of engines than spark-ignition engines employing the Otto cycle. Diesel engines and electric vehicles equipped with fuel cells represent new opportunities to improve the efficiency and reduce the pollution. A novel ethanol-based diesel engine allows the fuel to be used more efficiently and with near-zero particulate

5
emission. The fuel ED95 contains 95% v/v ethanol, and is used in Scania diesel engines in trucks and busses providing 43% efficiency and particulate reduction (SEKAB). Ethanol could also be used in vehicles powered by fuel cells to avoid the pollution from combustion and remove the risk associated with hydrogen storage, as well as reducing the emission of GHGs. Two options are currently being investigated, the hydrogen fuel cell and the direct ethanol fuel cell; the latter showed low yields compared with the more efficient fuel cells where ethanol undergoes an intermediate reforming step to hydrogen before electricity production (Deluga et al. 2004; Kamarudin et al. 2013).
1.3 Aim and outline of this thesis The purpose of the work presented in this thesis was to identify ways of improving the process and the economics of sugarcane-based ethanol production. Experimental and techno-economic studies have been carried out in order to find the optimal process for 2G sugarcane ethanol. The research was divided as follows:
- modelling and evaluation of production processes for first- and
second-generation ethanol from sugarcane and possible integrated configurations,
- analysis of the main production design and costing factors in the 2G ethanol process,
- reduction of the ethanol production cost by using different
process designs and strategies to increase the ethanol yield,
- experimental verification of potentially cost-effective process designs.

6

7
2 The sugarcane biorefinery
In analogy with oil refineries, where crude oil is fractionated and processed to obtain a variety of products, a biorefinery is a facility where biomass is separated and converted into renewable commodities, such as fuels, chemicals, heat and power in a sustainable way (IEA Task42 2008). The demand for renewable fuels has been the driver for the development of biofuel-oriented biorefineries, where food and feed can also be co-produced. For example, the 1G ethanol industry produces crystal sugar from sugarcane and distillers grains from corn, which can improve the economics of the process. High-value building blocks, that can be used as precursors for the synthesis of a wide variety of chemicals, can also be obtained by processing biomass in a biorefinery (Werpy 2004; Bozell and Petersen 2010). Their role is fundamental for the future of the biobased industry, in particular when integrated with the production of biofuels (BIOREF-INTEG 2010).
Since the development of the Pró-Álcool Program in Brazil in 1975, the sugarcane industry has been a forerunner of today’s biorefinery concept, producing fuel, food and energy in an integrated plant. Ethanol and crystal sugar are produced from the sucrose contained in the sugarcane stem, while electricity and heat are obtained from combustion of the stem fibre residues known as bagasse. Only a fraction of the whole sugarcane plant is currently processed into food and fuel, while the efficient exploitation of the remaining fraction via novel pathways has not yet been commercially deployed. Large amounts of bagasse and leaves are available providing a lignocellulosic material that can be used as a source of sugars in polymeric form or functional building blocks for the synthesis of chemicals.
This thesis deals primarily with the production of ethanol in a biorefinery using sugarcane, and the expansion of the sugar platform for ethanol production from the sugars contained in bagasse and leaves. Several by-products can also be obtained, such as biogas, vinasse and yeast, but only electricity surplus is considered in this study to be sold to the market. Since the process investigated does not include the production of crystal sugar, the biorefinery is called autonomous distillery if only 1G ethanol is produced, and a 1G+2G ethanol plant when ethanol is also produced from lignocellulose.
8
2.1 Raw material: sugarcane Sugarcane is a perennial grass belonging to the Saccharum genus, grown in tropical and subtropical regions, and believed to come originally from New Guinea. There are six recognized species, the most abundant being S. officinarum due to its high sugar content and other desirable characteristics making it suitable for industrial processing. S. officinarum hybrids have been selected and improved with the aim of adapting the plant for large-scale industrial purposes by enhancing its resistance to pests and drought, sugar content and biomass yield per hectare (Souza and Van Sluys 2010). The worldwide sugarcane production in 2012 reached 1.96 billion tons, from 26 million hectares of harvested area, and the major producing countries were Brazil, India and China, accounting for 39%, 19% and 7%, respectively (FAO 2013). Brazil has doubled its production in the past decade, and this increase is greater than the average rate in the sugarcane-producing countries (37%) (FAO 2013). The area dedicated to sugarcane plantations in Brazil is expected to reach 14.4 million hectares in 2017, corresponding to 1.7% of the area of Brazil (MAPA 2013). However, new sugarcane plantations are restricted by law to the agroecological zone (known as ZAE Cana), according to an innovative planning policy designed to guide expansion and simultaneously guarantee sustainability (Decree no.6961/2009). According to this decree, expansion is prioritized in degraded areas where mechanized harvest is feasible and the requirement for irrigation is minimal; it is forbidden on land with native vegetation and in biomes including the Amazon. Thus, only 7.5% of Brazil’s total area is suitable for sugarcane cultivation in compliance with agroecological zoning.
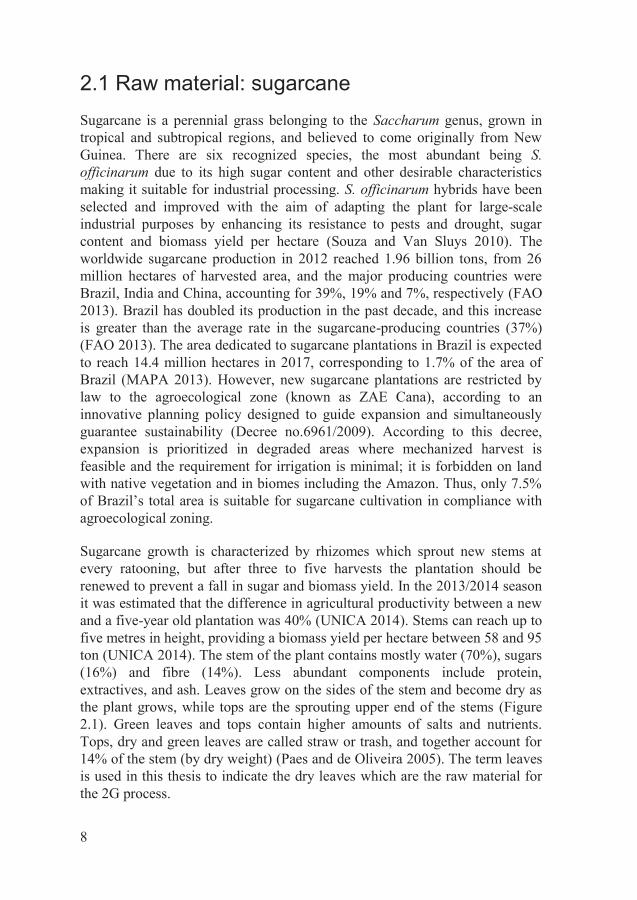
Sugarcane growth is characterized by rhizomes which sprout new stems at every ratooning, but after three to five harvests the plantation should be renewed to prevent a fall in sugar and biomass yield. In the 2013/2014 season it was estimated that the difference in agricultural productivity between a new and a five-year old plantation was 40% (UNICA 2014). Stems can reach up to five metres in height, providing a biomass yield per hectare between 58 and 95 ton (UNICA 2014). The stem of the plant contains mostly water (70%), sugars (16%) and fibre (14%). Less abundant components include protein, extractives, and ash. Leaves grow on the sides of the stem and become dry as the plant grows, while tops are the sprouting upper end of the stems (Figure 2.1). Green leaves and tops contain higher amounts of salts and nutrients. Tops, dry and green leaves are called straw or trash, and together account for 14% of the stem (by dry weight) (Paes and de Oliveira 2005). The term leaves is used in this thesis to indicate the dry leaves which are the raw material for the 2G process.

9
Figure 2.1. Illustration of sugarcane. Adapted from (Paes 2005).
The sugar contained in the stem is 90% sucrose with small amounts of monomeric glucose and fructose. The fibre fraction composing the stem, the bagasse, is a by-product of sugar mills after sugar extraction. The practice of manual harvesting of sugarcane was first discouraged in areas where machinery can be used and then will be forbidden by law (Decree no. 2.661/1998), due to the release of pollution and GHG gases emitted by burning the plantation to facilitate harvesting. This was done to reduce the risk of exposing the workers to the sharp leaves and dangerous animals living in sugar plantations. The State of São Paulo, the principal producer of sugarcane in the Brazilian Federation, outlawed the burning of plantations, where possible, several years earlier, in June 2014 (State Bill no.11241/2002 ; State of São Paulo 2007). In mechanical harvesting, additional lignocellulosic material is made available for processing; the sugarcane stem is chopped and separated from the leaves and tops, some of which are left in the field to preserve the quality of the soil and to control weed infestation (Manechini et al. 2005). It was assessed that up to the 66% of the leaves could be removed from the field for processing without harming or leading to deterioration of the plantation, as long as the tops and green leaves were left on the field (Franco et al. 2011). Other previous studies suggested that 33% was the maximum amount that could be removed, leaving in place at least 7.5 ton/ha of dry trash (Manechini et al. 2005).
Stem
Dry leaves
TopsGreen leaves

10
The greatest difference in composition of the lignocellulosic residues of sugarcane (tops, green and dry leaves, and bagasse) is seen in the moisture content, which varies between 13.5% in dry leaves and 82.3% in the tops. Elemental analysis showed similar values regarding the contents of carbon (~45%), hydrogen (~6%), oxygen (~43%), nitrogen (~0.8%) and sulphur (~0.1%) (Neto 2005). Given the similar elemental composition to bagasse, leaves can be considered as additional feedstock for the production of ethanol.
Bagasse and leaves consist of lignocellulose, which is mainly composed of cellulose, hemicellulose and lignin. The composition of raw bagasse and leaves is given in Table 2.1.
Table 2.1 - Composition of raw bagasse and leaves
Bagasse (Paper III)
Leaves (unpublished)
Glucan 45.3% 36.5%
Xylan 22.2% 24.1%
Arabinan 2.4% 2.7%
Galactan 0.7% 1.5%
Acid insoluble lignin 20.7% 24.1%
Acetic acid 2.8% 2.3%
Lignin Ash 2.2% 4.5%
Total Ash 3.7% 6.1%
These macromolecules are present in the cell wall at different proportions and morphological regions. The structure of the plant cell wall can be divided into three layers: the middle lamella, where pectin is the most abundant component; the primary cell wall and the secondary cell wall. In the primary cell wall, cellulose microfibrils are linked to hemicellulose and surrounded by a pectin matrix, while in the secondary cell wall pectin is generally replaced by lignin.
Cellulose is the most abundant polysaccharide in the cell wall and in plant biomass. The structure consists of a linear homopolymer of glucose units linked with β-1,4-glycosidic bonds showing a variable degree of polymerisation, usually between 3000 and 8 000 cellobiose units. Cellulose chains are organised in microfibrils and the degree of crystallinity can vary depending on the network of the lateral hydrogen bonds and van der Waals interactions. Despite forming hydrogen bonds, cellulose is insoluble in water.

11
Hemicellulose is a branched heteropolysaccharide with a low degree of polymerisation and ramification. It consists of several saccharides, such as glucose, mannose, galactose, arabinose and xylose. Hemicellulose is easily broken down and solubilized by acid. The degree of substitution with acetyl- and methyl- groups depends on the type of biomass. Sugarcane hemicellulose has a xylose backbone branched through arabinofuranosyl and 4-O-methyl glucopyranosyl units; hemicellulose can also be acetylated and linked to ferulic acid and p-coumaric acid (Sun et al. 2004). In contrast to other plants, xyloglucans seem not to be present in sugarcane tissues, while glucuronoarabinoxylans have been found to be relatively abundant (Silva 2005).
Lignin is a highly cross-linked aromatic heteropolymer, made up of phenylpropanoid units of p-hydroxyphenyl, guaiacyl, syringyl. The precursors of these are the hydroxy-cinnamyl alcohols (or monolignols) p-coumaryl, coniferyl and sinapyl. The amount and structure of lignin vary in different morphological regions of sugarcane. Differences in the structure are found between the fibre, the vessel and the parenchyma. The most abundant phenylpropanoid in the secondary wall of the fibre is syringyl followed by guaiacyl and p-hydroxyphenyl (He and Terashima 1990). Martín et al. analysed 13 phenolics released after steam pretreatment, and found that p-coumaric acid, ferulic acid and 4-hydroxybenzaldehyde had the highest concentrations in the hydrolysate (Martín et al. 2002).
2.2 The first-generation ethanol process The production of 1G ethanol from sugarcane has experienced a boost in Brazil following the introduction of the Pró-Álcool Program in 1975, in order to reduce the country’s dependence on oil for transportation. In the 30 years from 1975 to 2005, the production of ethanol from sugarcane juice increased nearly four times, while the production price was reduced by a factor of 3.5, from 0.79 to 0.20 US$2004/L, as a result of technological innovations and economies of scale (Goldemberg et al. 2008).
Ethanol production from sugarcane in Brazil is still entirely based on the fermentation of the juice and/or molasses in either autonomous distilleries (39%) or in facilities co-located with sugar mills (61%) where crystal sugar is produced (MAPA 2009). Since the topic of this thesis is limited to the production of ethanol in facilities where the entire amount of juice is used for ethanol, the basis of the study is the autonomous distillery (Figure 2.2) receiving cane harvested mechanically.

12
Figure 2.2 - Flowsheet for the autonomous distillery
The mineral (soil) and vegetal (leaves, tops, stubbles) impurities contained in the harvested sugarcane must be removed to avoid equipment malfunctioning and wear, and to maintain a high quality of the raw material. A “dry cleaning” stage before sugar extraction is used to separate the cane from the harvested material, and to avoid sugar losses that would arise from washing with water. In a conventional mill, the juice used for fermentation is separated from the bagasse by shredding and milling the sugarcane. A series of mills operating in counter-current mode provide high sugar extraction, with a recovery of about 97% w/w in the sugar juice stream and a sucrose concentration of 13.7% w/w. The juice is then purified by adding CaO and a flocculant polymer, and a clarification step is used to remove solid residues before the sugar is concentrated to 19% w/w by evaporation, which also reduces microbial contamination. The juice is fermented with an industrial yeast strain giving an ethanol yield of about 94% of the theoretical, and an ethanol concentration above 70 g/L, before the ethanol is distilled to obtain hydrous or anhydrous fuel grade ethanol. The Melle-Boinot process for fermentation is the most frequently adopted in Brazilian distilleries, and is characterized by batch fermentation and yeast cell recycling through centrifugation. Acid washing of yeast cells is also implemented to control microbial contamination (Basso et al. 2008). Stress tolerance and increased ethanol productivity are the two major outcomes of the Melle-Boinot process, which can be considered as a pioneer concept of evolutionary engineering (Kavanagh and Whittaker 1994; Basso et al. 2008).
After sugar extraction, the bagasse has a moisture content of about 50% and is then combusted in a combined heat and power (CHP) plant to provide live steam and electricity for the entire process. Brazilian CHP plants were traditionally based on low-efficiency 22-bar boilers and the steam cycle was coupled to backpressure turbines. The aim of this was to eliminate the bagasse by incineration as it was considered to be waste (Camargo 1990).
SHREDDING MILLING
EVAPORATIONFERMENTATION
1GYEAST
SEPARATION
WARM WASHING
BAGASSE HANDLING
YEAST ACID WASH
CLARIFICATION
DISTILLATION1G
1G ethanol 1G vinasse
BOILER STEAM TURBINE
ElectricitySteam
Filter cake
Sugarcane
13
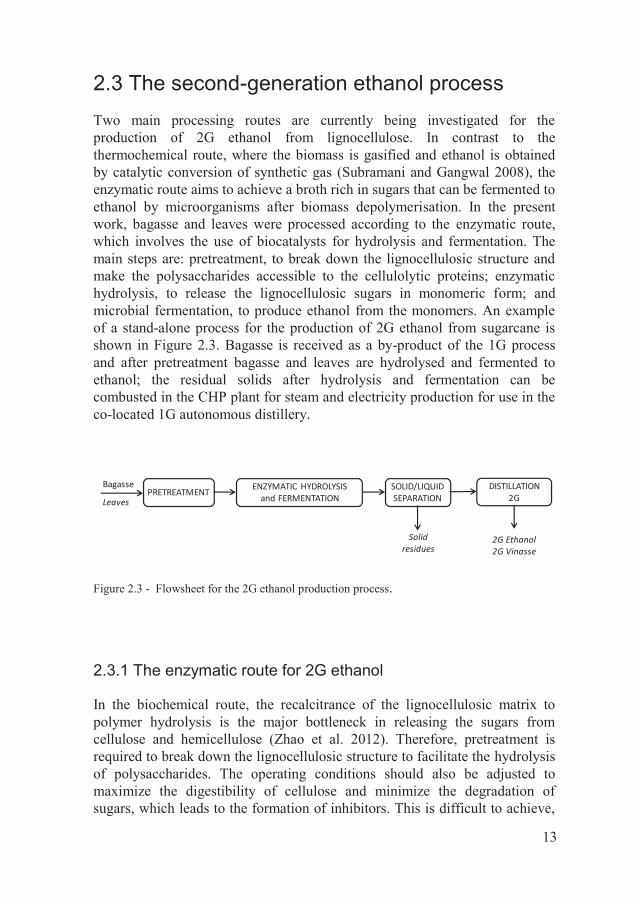
2.3 The second-generation ethanol process Two main processing routes are currently being investigated for the production of 2G ethanol from lignocellulose. In contrast to the thermochemical route, where the biomass is gasified and ethanol is obtained by catalytic conversion of synthetic gas (Subramani and Gangwal 2008), the enzymatic route aims to achieve a broth rich in sugars that can be fermented to ethanol by microorganisms after biomass depolymerisation. In the present work, bagasse and leaves were processed according to the enzymatic route, which involves the use of biocatalysts for hydrolysis and fermentation. The main steps are: pretreatment, to break down the lignocellulosic structure and make the polysaccharides accessible to the cellulolytic proteins; enzymatic hydrolysis, to release the lignocellulosic sugars in monomeric form; and microbial fermentation, to produce ethanol from the monomers. An example of a stand-alone process for the production of 2G ethanol from sugarcane is shown in Figure 2.3. Bagasse is received as a by-product of the 1G process and after pretreatment bagasse and leaves are hydrolysed and fermented to ethanol; the residual solids after hydrolysis and fermentation can be combusted in the CHP plant for steam and electricity production for use in the co-located 1G autonomous distillery.
Figure 2.3 - Flowsheet for the 2G ethanol production process.
2.3.1 The enzymatic route for 2G ethanol
In the biochemical route, the recalcitrance of the lignocellulosic matrix to polymer hydrolysis is the major bottleneck in releasing the sugars from cellulose and hemicellulose (Zhao et al. 2012). Therefore, pretreatment is required to break down the lignocellulosic structure to facilitate the hydrolysis of polysaccharides. The operating conditions should also be adjusted to maximize the digestibility of cellulose and minimize the degradation of sugars, which leads to the formation of inhibitors. This is difficult to achieve,
ENZYMATIC HYDROLYSIS and FERMENTATIONPRETREATMENT SOLID/LIQUID
SEPARATIONDISTILLATION
2G
2G Ethanol2G Vinasse
Bagasse
Leaves
Solid residues

14
but trade-offs have been found to reduce the negative effects on the overall process, as well as on specific steps (Galbe and Zacchi 2007).
Steam pretreatment Several methods of pretreatment have been used to treat sugarcane bagasse and leaves, and can be classified as biological, physical, chemical and physico-chemical depending on the agents employed and the mechanism of action (Dekker and Wallis 1983; Laser et al. 2002; Martín et al. 2008; Krishnan et al. 2010; Ferreira-Leitão et al. 2010). In the present studies only the steam-pretreatment, a physico-chemical pretreatment, was used in experiments and considered in simulations.
In steam pretreatment, saturated steam at a temperature between 160 and 240°C is generally used to treat biomass with various residence times (1-20 minutes). After this treatment, the valve is rapidly opened resulting in flashing of part of the water. The sudden expansion breaks the lignocellulosic structure, reduces particle size and increases the pore volume (Mosier et al. 2005). However, the physical mechanism is not the primary pretreatment mechanism, as biomass digestibility is enhanced mainly by the combination of heat and the presence of acetyl groups in the hemicellulose that catalyses hydrolysis (Brownell and Saddler 1987; Biermann et al. 1984). Hemicellulose solubilisation is regarded as the principal reason for the improvement in the accessibility of the cellulose to the enzymes (McMillan 1994; Mosier et al. 2005). Mineral acids with lower pKa can be used as a catalyst in order to achieve a better breakdown of the lignocellulosic structure, primarily due to the disruption of glycosidic bonds and carbohydrate-lignin linkages. This leads to the solubilisation of hemicellulose, although only a small fraction of the cellulose is hydrolysed (Galbe and Zacchi 2007; Pedersen and Meyer 2010). Under acidic conditions, the lignin is also altered and rearranged as depolymerisation/repolymerisation reactions occur (Li et al. 2007). Pseudo-lignin formed by the inclusion of dehydrated carbohydrates has also been observed (Sannigrahi et al. 2011). Temperature, residence time and pH are regarded as the most important parameters, as being mainly responsible for the release and production of compounds that are inhibitory to hydrolysis, and especially fermentation, (Palmqvist and Hahn-Hägerdal 2000). Moisture content and biomass particle size can affect the effectiveness of pretreatment but with lower magnitude (Brownell et al. 1986; Galbe and Zacchi 2012; Ewanick and Bura 2011). Inhibitors are produced by the degradation of the lignocellulosic structure, resulting in solubilised phenolics from lignin, acetic acid from hemicellulose, and by the dehydration of polysaccharides yielding furaldehydes, formic acid and levulinic acid. The type and amount of inhibitors produced during steam explosion of sugarcane bagasse depend on

15
the acid used as catalyst (Martín et al. 2002). In Table 2.2 and Table 2.3 the composition of the solid and liquid fractions of bagasse and leaves after steam-pretreatment are reported; leaves were pretreated at the same conditions as bagasse. The use of steam as a heating agent and not liquid water, as in the dilute-acid pretreatment, facilitates the recovery of the sugars as they are not excessively diluted in the liquid fraction. Continuous steam pretreatment units have been tested on pilot- and demonstration-scale, and commercial-scale units have recently been brought into operation (Balan et al. 2013).
Table 2.2 - Composition of the solid fraction of bagasse and leaves after pretreatment
Bagasse (Paper III)
Leaves (unpublished)
Glucan 56.1% 44.1% Xylan 6.2% 6.8% Arabinan 0.2% 0.4% Galactan 0.7% 0.3% Acid insoluble lignin 24.2% 35.3%
Acetic acid 0.3% 0.2% Lignin Ash 3.3% 7.5% Total Ash 4.2% 12.6%
Table 2.3 - Composition of the liquid fraction of pretreated bagasse
(g/L)
Bagasse (Paper III)
Leaves (unpublished)
Glucose 6.0 9.4 Xylose 48.3 38.2 Galactose 1.4 0.8 Arabinose 5.5 4.2 Formic acid 0.9 0.5 Acetic acid 5.1 6.0 HMF 0.2 0.1 Furfural 1.7 0.4
16
Enzymatic hydrolysis After the lignocellulose has been pretreated to enhance the accessibility of cellulose fibres, a mixture of enzymes with cellulolytic activity is used to hydrolyse the cellulose and other polysaccharides into fermentable sugars. Several microorganisms have the ability to excrete cellulolytic enzymes, but only a few, such as filamentous fungi, belonging to the genus of Trichoderma, Penicillium, Aspergillus and Phanerochaete, are suitable for industrial production.
Three main subclasses of glycoside hydrolase enzymes are necessary to depolymerise cellulose into glucose. The exo-1,4-β-glucanases (cellobiohydrolase, CBH) attack the cellulose from both the reducing and non-reducing ends of the chain, releasing cellobiose and continuing the hydrolysis in a processive manner. The activity of CBH enzymes is improved by the cellulose binding module which binds the enzyme and its catalytic domain onto the cellulose chain and also act as a sort of pretreatment breaking the intra- and inter-chain hydrogen bonds, thus reducing the crystallinity (Hall et al. 2011). The endo-1,4-β-glucanases act mainly in amorphous cellulose regions by cleaving the internal 1,4-glycosidic bonds at random sites, creating new chain ends for attack by the CBH enzymes. The β-glucosidases perform the hydrolysis of the cellobiose dimer released by CBH into two glucose monomers.
The hydrolysis of cellulose is the result of the synergistic effects of the enzymatic activities, as described above. Cellulase synergism has been studied extensively (Zhang and Lynd 2004; Van Dyk and Pletschke 2012), and it is fundamental for industrial applications to achieve the rapid and complete hydrolysis of cellulose. Several solutions have been proposed to tackle the end-product inhibition of the enzyme complex, which reduces the hydrolysis rate. One is to supplement β-glucosidases to reduce the inhibitory effect of glucose and cellobiose (Tengborg et al. 2001; Berlin et al. 2005). However, the new enzyme preparations are already high in β-glucosidase activity, making supplementation less important (Cannella and Jørgensen 2013). Alternatively, the synergism can be extend to a fermenting organism able to avoid the accumulation of glucose (end-product) by consuming it as soon as it is released by the β-glucosidases (Gauss et al. 1976).
Novel enzymes have recently been found to be very efficient in the hydrolysis of cellulose (Harris et al. 2010; Westereng et al. 2011; Quinlan et al. 2011; Phillips et al. 2011; Forsberg et al. 2011), by attacking the cellulose chains at apparently random sites in the crystalline regions (Horn et al. 2012). The hydrolysis mechanism of an enzyme activity previously unknown was ascribed to the oxidation of cellulose (Vaaje-Kolstad et al. 2010), and these

17
enzymes have therefore been reclassified as lytic polysaccharide monooxygenases (Levasseur et al. 2013).
Fermentation A wide variety of bacteria and fungi have the ability to ferment sugars into ethanol, but only a few are suitable for the challenging conditions encountered in industrial applications. Saccharomyces cerevisiae is regarded as the best microorganism for industrial ethanol production due to its high specific ethanol productivity, and its high tolerance to ethanol and osmotic pressure from substrates and salts. Other fermentative microorganisms, such as Zymomonas mobilis, Pichia stipitis and Escherichia coli, lack these characteristics, and they are genetically engineered to increase their tolerance (Klinke et al. 2004).
S. cerevisiae was used in the experimental study described in Paper III, while in Papers I, II and IV the choice of microorganism was not relevant as long as the strain showed the characteristics assumed in the study, regarding ethanol yield and productivity, non-flocculant behaviour, the possibility of being recovered by centrifugation and being treated by dilute acid washing. S. cerevisiae is facultative anaerobic chemoorganoheterotrophic unicellular yeast and is therefore characterised by aerobic and anaerobic metabolism. The substrates that can be utilised by S. cerevisiae are monosaccharides (glucose, fructose, mannose), disaccharides (sucrose, maltose) and trisaccharides (maltotriose, raffinose) (Walker 1998). The uptake of substrates through the cell membrane occurs by facilitated diffusion. The transporter proteins of glucose are stereospecific and can also import fructose and mannose. The transport system has a higher affinity for glucose than fructose and mannose, thus in presence of the three monosaccharides glucose is taken up preferentially (Walker 1998). Sugar catabolism takes place through the glycolysis (also called the EMP pathway) providing the yeast with 2 moles ATP, 2 moles NADH and 2 moles pyruvate per mole glucose. Under aerobic conditions, pyruvate is used to produce energy for cell growth and anabolism via the tricarboxylic acid (TCA) cycle. In case of high substrate concentration, pyruvate is directed towards the fermentative pathway instead of the TCA cycle due to the overflow metabolism. Under anaerobic conditions the fermentative pathway (shown in the following equation) is active instead of the TCA cycle, and pyruvate is decarboxylated to acetaldehyde, which is the final electron acceptor being reduced to ethanol.
C6H12O6 + 2 Pi + 2 ADP → 2 C2H5OH + 2 ATP + 2 CO2
18
Despite the almost stoichiometric yield obtained in 1G ethanol production, native S. cerevisiae cannot ferment the pentose sugars present in bagasse and leaves due to the lack of efficient catabolic pathways linked to the pentose phosphate pathway. Genetically engineered strains of S. cerevisiae can express enzymes able to convert pentoses into xylulose-5-phosphate by two alternative pathways: the xylose isomerase (XI) pathway, or xylose reductase and xylitol dehydrogenase (XR-XDR) pathway (Hahn-Hägerdal et al. 1994).
The fermentation conditions in the production of 2G ethanol from bagasse and leaves could be especially challenging due to the presence of inhibitory chemicals from the pretreatment, which could reduce the ethanol yield and productivity (Martín et al. 2002). Several configurations of combining enzymatic hydrolysis with fermentation have been proposed in order to tackle specific problems. The most commonly used have been separate hydrolysis and fermentation (SHF) and simultaneous saccharification and fermentation (SSF). SHF and SSF will be discussed in more detail in Section 3.1.2.
The integration of 2G ethanol process within the existing autonomous distilleries can benefit from the well-experienced and optimized fermentation technology in ethanol production from sugar juice. Only a few distilleries employ the continuous fermentation process, which is designed to maximize the productivity by allowing the yeast to perform under log-phase kinetics during anaerobic growth and ethanol production. Another advantage is the lower investment cost, compared with batch fermentation, as a consequence of being a continuous process; thus, there is no down time (loading-emptying-cleaning cycles) and smaller volumes are required. However, continuous fermentation is severely affected by low ethanol productivity due to microbial contamination, which is also responsible for considerable economic losses (Ingledew 2003). The main reasons for microbial contamination are the lack of a fermenter cleaning cycle and the microbial infection of the fresh medium. Infections in continuous fermentation can be controlled by the addition of antibiotics, the dosage of which must be increased as the resistance of the microbial population increases, and this is therefore a costly method (Godoy et al. 2008). It was found by Godoy et al. that converting a continuous process to batch fermentation led to an increase in ethanol yield of at least 2 percentage points, reaching almost 92% in year 2002; moreover, the yeast viability was higher and the microbial population was two orders of magnitude lower (Godoy et al. 2008). Persistent strains of wild yeast showing resistance to acid washing (pH 2-2.5 for 1-2 hours at 10-17% w/v wet basis) have been found in distilleries using sugar juice and molasses as fermentation substrates. However, these strains could not be suitable for industrial production due to undesired characteristics, such as low ethanol yield, excessive formation of glycerol and foam, low viability after acid treatment (Basso et al. 2008).

19
Regardless of the mode of fermentation, another factor causing a reduction in yield is the carbon used for cell anabolism. This should be minimized despite already being low under anaerobic conditions. Rapid fermentation at high yeast cell concentration can ensure high productivity (Basso et al. 2008). Glycerol is the major by-product of alcoholic fermentation, and is due to cell cofactor regeneration as well as osmotic stress (Walker 1998).
2.4 The ethanol process by-products The 1G and 2G ethanol processes have the potential to produce the same type of by-products, mainly electricity, biogas and fertilizers, and the integration of the two processes could result in a better usage of the input material by also sharing the same equipment. While bagasse is a by-product of the 1G process, used mainly for steam and electricity production, in the 2G process bagasse represents the raw material together with leaves, and their residues from enzymatic hydrolysis are combusted. If the amounts of steam and electricity generated exceed the internal requirement for the plant, these can be exported to the electrical grid providing an income. Another by-product that can be used to increase electricity generation is the biogas obtained from the anaerobic digestion of process streams, in particular vinasse, which reduces the high COD present in the streams and thus the GHG emissions. Biodigested vinasse still has a fertilizing capacity and can be used for fertigation of sugarcane plantations, replacing synthetic fertilizers. As an alternative to combustion, biogas can be purified and upgraded for use as a transportation fuel or for domestic purposes.
2.4.1 Vinasse
Fertilizers and nutrients are required to increase the quality of sugarcane plantation soil and, if obtained as by-products from the ethanol plant, can also reduce the use of synthetic fertilizers. The stillage from the distillation unit, also called vinasse, is a large by-product stream characterized by a high biological oxygen demand (BOD) and nutrient content, which may pollute rivers and fields if released untreated. For every litre of ethanol produced, 7 to 15 litres of vinasse have to be treated (Cortez et al. 1992). The most common use of vinasse is as a fertilizer by irrigation of the sugarcane plantation. Alternatively, it can be used for energy recovery by burning its organic content, for protein production by aerobic fermentation, for animal feed after it has been dried, or for biogas production by anaerobic digestion (Camhi 1979). The advantage of anaerobic digestion is that no additional heat is required to reduce the BOD to biomethane. Moreover, anaerobically treated vinasse can

20
be still used for fertigation given the high levels of potassium, nitrogen and phosphorus, greatly reducing the need for chemical fertilizers (Lucas et al. 1997). The direct application of untreated or inadequately treated vinasse can, in fact, cause several environmental problems, such as salinization, leaching of metals to the groundwater, changes in soil quality, a reduction in alkalinity and crop losses due to phytotoxicity, as summarized by Christofoletti et al. (Christofoletti et al. 2013).
The properties of the vinasse resulting from 1G and 2G ethanol production may vary regarding the amount produced and the composition. The amount of vinasse depends on the substrate loading in fermentation and the final ethanol purity. The volume ratio between vinasse and ethanol was found to be 13 in the 1G plant, while in the 2G process it varied from a minimum of 4.5 for fermentation at 30% water-insoluble solids (WIS) including pentoses (Paper II), to a maximum of 40 when only glucan was hydrolysed and fermented at 10% WIS with a combined ethanol yield of 63% (Paper III). When vinasse is sold at 0.02 US$/ton, the revenue is below 0.005 US$/L of ethanol produced and that is negligible to the process profitability; however, the use of H3PO4 as steam pretreatment catalyst and NH3 as neutralizing agent after pretreatment can increase the content of ammonium phosphate and thus the selling price (Paper I).
2.4.2 Biogas
In contrast to the 1G process, where biogas is generally produced from vinasse containing ethanol, residual sugars and fermentation by-products, such as glycerol and organic acids, the 2G process is a source of a multitude of additional components resulting from the depolymerisation of the lignocellulose. The amount and composition of the streams reaching the water treatment unit can vary considerably, depending on the operational conditions used for hydrolysis and fermentation (Papers I and II). These streams include the liquid fraction from pretreated bagasse and leaves, the condensate from steam pretreatment and drying units, the washing water from the filter-press and rotary drum filters, strippers and rectifiers bottom streams. If pentoses are not co-fermented to ethanol, the most abundant components flowing into the water treatment unit would be xylose and other polysaccharides, regardless of whether SSF or SHF is used (Papers I, II, III and IV). The degradation products generated in pretreatment, such as furaldehydes and soluble lignin can be present in the 2G streams and can have an inhibitory effect on biogas production (Barakat et al. 2012). Due to high concentration of inhibitors, untreated vinasse from processing lignocellulosic material at 30% WIS could be toxic to biogas-producing organisms. Thus, dilution or recirculation may be

21
required, cancelling out the advantage of having smaller volumes to treat and the consequent lower capital investment (Paper II). The equipment available to carry out anaerobic digestion is continuous stirred tank reactor (CSTR), upflow anaerobic sludge blanket (UASB) reactor and internal circulation (IC) reactor. There are major differences not only in design but also in terms of biogas productivity, which is the result of organic loading rate (kgCOD/m3/day), specific COD removal rate per kg of sludge (kgCOD/kgVSS/day), the yield of biogas on COD (Nm3 biogas/kgCOD) and the hydraulic retention time HRT (hours).
2.4.3 Bioelectricity
Bagasse, leaves and enzymatic hydrolysis residues are potential sources of fuel for the CHP plant, supplying steam and electricity to the 1G and 2G processes. The flowsheet for a CHP plant is shown in Figure 2.4. The greatest difference between these three kinds of fuel lies in their lower heating value (LHV), which depends on the moisture content and composition. Bagasse has a moisture content of about 50%, dry leaves 15% (Neto 2005), and hydrolysis residues above 60% (Papers I and III). The higher heating values of the three fuels are comparable, 18, 17, 20 MJ/kg, respectively (CaneBioFuel 2011), although the heat recoverable by the boiler depends on fuel moisture content. If most of the cellulose and hemicellulose is used for ethanol production, the hydrolysis residues can contain ash more than 14% on dry basis, leading to higher boiler maintenance costs and particulate emission (CaneBioFuel 2011). More efficient boilers and condensing turbines able to produce a higher electricity surplus can be seen as an important source of income as a result of higher electricity prices and market deregulation, while bagasse has been reported to be an ideal fuel for bioelectricity generation, improving the economy of autonomous distilleries (Ensinas et al. 2007; Dias et al. 2011a; Dias et al. 2011b; Seabra and Macedo 2011; Paper I; Paper II). Despite the increase in the investment cost of the CHP plant with increasing boiler pressure and electricity output, high-pressure cogeneration systems have been found to be more economically profitable (Dias et al. 2013).

22
Figure 2.4 - Flowsheet for the combined heat and power (CHP) plant
2.5 Green chemistry and inherent safety principles
The environmental, economic and social sustainability of production processes has been the driver for the modification and improvement of several kinds of industries concerning raw material input, reaction reagents, equipment efficiency and waste minimization. The tools used were good design practices, which first evolved into a series of design principles ensuring inherent safety (Kletz 1978), and then extended to include sustainability criteria, yielding a list of principles known as the green chemistry principles (Anastas and Warner 1998). The concept of sustainable development was first used in the Brundtland Report, “Our Common Future”, where the main framework and traits were outlined (WCED 1987). This report included topics already dealt with in 1972 in a previous report, “Limits to Growth”, commissioned by the Club of Rome, and compiled by researchers at MIT, which highlighted the problems facing society as a result of growth (Meadows et al. 1972). Nowadays, the biorefinery concept is based on “the sustainable processing of biomass into a spectrum of marketable products and energy” (IEA Task42 2008), and can, thus, be naturally integrated with the principles of green chemistry, helping to enhance the sustainability and robustness of the process. Good design practices, as outlined in the principles of inherent safety and green chemistry, have been applied in this work with the aim of
BOILERHX 1
HX 2
HOT AIR
TURBINE CONDENSINGTURBINE
HX 3
CONDENSER
BOILER FEED WATER
FACTORY
PUMP 1PUMP 2
BAGASSE
(SHF residues)
HOT GAS
PRE-HEATED 1
GENERATED STEAM
2.5 bar STEAM
SPLITTER
LIVE STEAM
0.2 bar STEAM
WATERREINTEGR.
COMPRESSED AIR
AIR FAN COLD AIRFLUE GAS
STACK
CONDENSATE
23
optimizing the experimental results, the ethanol process scenarios, and taking environmental issues into consideration.
The traditional 1G ethanol process based on sugarcane already satisfies many of these new criteria, such as using a renewable raw material and relying on the fermentative capacity of yeast biocatalyst for the conversion of sugars to ethanol. Moreover, vinasse and ash can be returned to the land, in an attempt to close the water and nutrient cycles. These principles are adhered to even more in the 2G ethanol process, as lignocellulosic agricultural residues are used as feedstock and the products obtained can have a higher value than electricity produced from bagasse. In addition, the hydrolysis of the polysaccharides is generally based on steam, low-concentration acid catalyst and enzyme biocatalyst.
The steam pretreatment of bagasse and leaves with the addition of lower amounts of acid catalyst is superior to harsher methods such as acid hydrolysis, which requires more concentrated acid and neutralizing agent, consequently producing more inhibitors and waste streams (Taherzadeh and Karimi 2007a). The use of an acid catalyst in steam pretreatment can be regarded as a source of unnecessary pollution compared with autohydrolysis, in which the thermal effect of steam and the acetic acid present in the lignocellulose are used to make the cellulose more available. However, this depends on the nature of the acid catalyst and on its fate within the production system. For instance, despite being very effective, sulphur-based catalysts (H2SO4, SO2) may produce lignosulfonates by inclusion of the sulphur into the lignin. Combustion of this material would rise the emission of SO2, increasing the flue gas desulphurization and gypsum disposal. In contrast, if phosphoric acid is used as a catalyst, it can be neutralized with ammonia, creating ammonium phosphate, a valuable fertilizer, which can be recovered in the vinasse for fertigation. However, the use of phosphoric acid is still associated with problems related to the corrosion of equipment, since industrial grade phosphoric acid contains also hydrofluoric acid, which is extremely corrosive to metals.
Enzymatic hydrolysis and fermentation take place at almost ambient conditions, and are catalysed by biocatalysts that can be recovered with different degrees of effort. The yeast employed in sugar juice fermentation and in SHF is easily recycled, while the recovery of enzymes requires more complex configurations or equipment (Vallander and Eriksson 1987; Jin et al. 2012; Weiss et al. 2013), which may hamper the economic feasibility of their reuse.

24
The fermentation of sugars to ethanol is not a synthetic pathway since the carbon present in sugars is also converted to CO2 by pyruvate decarboxylase. In native Saccharomyces cerevisiae, the molar ratio of carbon lost as CO2 per carbons supplied as sugar is 2:6. Attempts have been made to use this CO2 in synthetic pathway for the production of succinic acid (Cok et al. 2014). Otherwise, carbon sequestration techniques can be an alternative for CO2 disposal (Azar et al. 2006).
Although that bagasse was combusted in the autonomous distilleries without maximizing the heat recovery, one of the aims in the design of the integrated 1G and 2G ethanol process throughout this work was to maximize the energy efficiency, allowing not only better use of the heat available in the plant, but also maximization of the ethanol produced using bagasse and leaves (Papers I and II).

25
3 Factors influencing the production, costs and profitability
Ethanol production cost and economic profitability are important metrics obtained from techno-economic analysis that convey the feasibility of a plant design regarding both production factors (configurations, operating conditions, energy efficiency, yields, productivities) and local conditions (spot prices for electricity and feedstock, etc.). Production cost is a general term accounting for revenues, capital and operating costs, and sometimes the producer’s profits. The production cost for a chemical produced in a plant is evaluated over the life-span of the plant, which usually varies between 10 and 25 years, thus annualized cash flows, based on the interest rate and the depreciation, must be considered. The main assumptions used in the economic calculations are given in Table 3.1. If the condition “revenues equal costs” is imposed, the ethanol production cost obtained is the minimum possible and is named Minimum Ethanol Selling Price (MESP). The MESP is, by definition, the production cost obtained when the net present value (NPV) equals zero, i.e. when revenues and costs break even. For a more realistic evaluation, the producer’s profit should be included, and this is conventionally expressed as the expected return on investment. In this case, the MESP is calculated imposing the break-even condition (NPV = 0) and assuming an internal rate of return (IRR) of 10%.
In this thesis, the focus is on 2G ethanol production in an integrated 1G+2G ethanol plant, and 2G MESP is the metric used to compare alternatives involving the 2G process. It is assumed that the production cost of 1G ethanol is constant, and any variation in capital and operating costs is attributed to the production of 2G ethanol. 2G MESP is the sum of the production cost items, calculated according to the equation below:

26
where Ci2G is the 2G ethanol production cost for the cost item i given by a
weighted ratio between the difference in the cost of item i for 1G+2G and 1G ethanol, and the volume of 2G produced. Ci denotes the production cost for the item i and V the volume of ethanol produced.
The two complementary metrics appropriate for expressing the profitability of the ethanol plant are the IRR and NPV, which provide measures of the yield and the value of the investment, but do not necessarily identify the same scenario as being the best alternative.
Table 3.1 - Main assumptions used in the economic calculations
Parameter Value
Internal rate of return (IRR) after tax, above inflation 10% Net present value duration 20 years Tax rate 34% Period of tax-deductible linear depreciation in capital cost 10 years Plant scrap value None Payment of total project investment prior to start-up 12 months Working capital (% of turnover) 20% Financing 100% equity Currency basis 2011 US$
The overall MESP for the integrated production of 1G+2G ethanol is divided into cost items associated with operating, opportunity and capital costs, as reported in Table 3.2. The cost of sugarcane and leaves was only accounted for in the autonomous distillery for the production of 1G ethanol and electricity, and bagasse was assumed to have no cost. The costs of enzymes, acids, bases and other raw materials are additional operating costs. The cost for water consumption includes that required for the processes and for cooling. Vinasse can be sold providing an income, but this is often negligible. A producer profit of 10% IRR is included in the capital cost, and labour, maintenance and insurance are proportional to the capital cost. Surplus electricity, obtained by combusting bagasse and leaves, provides a source of revenue for the autonomous distillery, while in the 2G process it is considered

27
as an opportunity cost, i.e. a loss of income due to the use of bagasse and leaves for ethanol instead of electricity production. In an integrated 1G+2G ethanol plant, the major cost was found to be the capital cost, followed by the cost of sugarcane and the enzyme cost (Paper II).
Table 3.2 - Cost items composing the MESP for 1G, 2G and overall ethanol production. (Paper II, case {C5 EtOH, B+L, 20% WIS, 96h, 250% EHE})
1G+2G
Ethanol 1G
Ethanol 2G
Ethanol Ethanol, L/ton-dSC 585 274 311 Power production, kWhr/ton-dSC 56 230 22
Cost items, USD/L
Sugarcane 0.110 0.235 0.000 Leaves 0.012 0.026 0.000 Enzymes 0.090 0.000 0.170 Acid 0.013 0.000 0.024 Base 0.003 0.002 0.004 Water consumption 0.001 0.002 0.001 Other raw materials 0.003 0.007 0.000 Labor, Maintenance, Insurance 0.054 0.069 0.041 Net electricity /opportunity cost -0.021 -0.231 0.150 Vinasse sales 0.006 0.005 0.008 Capital Cost 0.177 0.196 0.160 Minimum Ethanol Selling Price 0.438 0.301 0.558

28
3.1 Process design The design of the 2G process has the potential to greatly affect the energy efficiency, the capital cost of the equipment and the operating costs. The designs studied are mainly related to ways in which the 2G process is integrated with the 1G process, and the configuration of hydrolysis and fermentation.
3.1.1 Integration of 1G and 2G ethanol
The ability of 2G technology to depolymerise lignocellulosic materials, through the combination of pretreatment and enzymatic hydrolysis, enables bagasse and leaves to be used for ethanol production, making sugarcane an even more valuable raw material. The 2G ethanol process can be regarded as a natural extension of the existing autonomous distillery, and can be co-located with the 1G plant, allowing the sharing of process utilities, such as steam, cooling water and electricity. Moreover, the conversion of monomeric sugars to ethanol via fermentation and the downstream processing are common steps in both processes. The integration of 1G and 2G ethanol processes is best achieved in a new facility, which can be designed in different ways. For example, the heating streams can be integrated by a common heat exchange network, by allowing a stream from one process to be combined with a similar stream in the other, or using the same equipment. From a cost perspective, integrating the 1G and 2G technologies in a single plant sharing material and energy streams could reduce the production cost, due to synergies obtained from higher energy efficiency and better equipment use.
Heat integration and energy efficiency The energy requirement for the plant has not previously been a constraint in conventional autonomous distilleries, as the bagasse was usually incinerated as a waste product in low efficiency boilers. Since the increase in the price of electricity due to the energy crisis in 2001 (Cardona et al. 2010), and the deregulation of the electricity market, more efficient and, therefore, more costly boilers have been introduced for the efficient recovery of heat (Camargo 1990; Ensinas et al. 2010). High energy efficiency not only allows surplus electricity to be sold, but is fundamental in a 2G process to maximize the 2G ethanol produced from bagasse and leaves. In fact, the combustion of hydrolysis residues may not provide sufficient heat, and some of the bagasse and leaves must thus be used for energy production, rather than ethanol production. It was found that in a plant characterized by low energy efficiency (59.2%), the 25% of the bagasse was diverted from 2G ethanol production and
29
used as fuel in the CHP (Paper I). The most heat-demanding unit operations in a combined crystal sugar and ethanol facility are sugar juice evaporation and ethanol distillation after fermentation, including preheating, representing 22% and 38% of the consumption of 2.5 bar saturated steam (Ensinas et al. 2007). These two units are also included in an autonomous distillery and in an integrated 1G+2G ethanol plant.
Several ways of reducing the energy demand and increasing the energy recovery by the use of more efficient equipment have been studied, for example: improving the heat exchanger network, thermally integrated distillation, mechanical vapour recompression in evaporation, higher boiler pressure, five-effect evaporation and drying solid fuels before combustion (Ensinas et al. 2007; Dias et al. 2013; Dias et al. 2011b; Wingren et al. 2008; Sassner and Zacchi 2008; Paper I). However, the capital cost associated with the installation of more efficient equipment may not always lead to higher economic returns or lower production cost.
The first step towards thermal integration of the 1G and 2G processes is the design of a common heat exchange network. The heat recovery can be either obtained using the pinch analysis technique, which optimizes the entire network (Dias et al. 2011b), or by adopting the minimum temperature approach for a single heat exchange (Paper I). A 16% reduction in overall steam consumption was found to be possible in a heat-integrated plant in Paper I, while Dias et al. found that a 31% reduction in 2.5 bar steam and a 34% reduction in 6.0 bar steam could be achieved (Dias et al. 2011b).
Evaporation and distillation may often be thermally integrated in an autonomous distillery. The steam from the backpressure turbine discharged at 2.5 bar is generally sent to the single-effect evaporators for juice concentration, and the secondary steam, generated with a low steam economy (0.26 kg liquid evaporated per kg steam supplied), is condensed in the stripper reboiler to distil the ethanol in the fermented broth. The steam consumption of thermally integrated evaporation and distillation is 0.28 kg steam per kg of feed in the evaporator (expert personal communication). The consumption could be reduced by a further 23% if the single-effect evaporation unit is replaced by a five-effect unit. In Paper I, the plant energy efficiency was found to increase from 62.0% to 64.7%, while the electricity exported increased from 43 to 46 kWh/ton-SC, and the 2G ethanol production from 14 to 29 L/ton-SC (from 46 to 95 L/ton-dSC). However, the investment cost of the new equipment did not pay off, considering the overall ethanol production cost, due to the larger amount of costly 2G ethanol produced. Thus, the existing design was more economically feasible, although it was characterized by low 2G ethanol production (Paper I).
30
In the forward-feed five-effect evaporation unit the live steam is injected into the first effect where secondary steam is generated by liquid evaporation from the juice, and used for evaporation in the following effect. By adjusting the vacuum in the last effect and the pressure drop in each effect it is possible to set appropriate temperature differences for efficient heat transfer, taking the boiling point elevation of the sucrose solution into consideration. As a result of the sequential secondary steam generation in each effect, five-effect evaporation results in higher steam economy (2.6 kg liquid evaporated per kg steam supplied) and lower steam consumption (0.09 kg steam per kg feed) compared with a single-effect unit used in traditional autonomous distilleries (Paper I; Ensinas et al. 2007). Mechanical vapour recompression can be employed in multiple-effect evaporation to further reduce the steam demand (Wingren et al. 2008).
Thermal integration can also be applied within the distillation unit, providing the possibility of exchanging heat between two strippers in parallel and a rectifier operating at lower pressures. For this to be possible, it is necessary for the stripper condenser operating at a higher pressure to transfer heat to the stripper reboiler operating at a lower pressure. Moreover, the rectifier operating at an even lower pressure could receive the heat from the stripper condenser operating at the intermediate pressure. In this way, the steam required for the entire distillation unit can be considerably reduced (Wingren et al. 2008; Dias et al. 2009a; Dias et al. 2011b; Ensinas et al. 2007). It has been found that the reduced steam requirement resulting from the use of double-effect distillation could increase the use of bagasse for 2G ethanol from 76% to 90%, leading to a higher production of ethanol and lower electricity surplus (Dias et al. 2009b).
After juice extraction, bagasse has a moisture content of 50%. This dramatically reduces the LHV and the surplus of electricity that can be sold. The enzymatic hydrolysis residues, which have a water content of 60%, suffer from similar drawbacks. Thus, the energy output would benefit from the introduction of a dryer before the combustion of any fuel having high water content. If a steam dryer is adopted, the latent heat of the flue gases after combustion is reduced, and a high fraction of secondary steam is also recoverable, diminishing the demand for live steam. At least 85% of the primary steam supplied to the dryer could be recovered for other uses in the configuration studied in Paper I. Since more bagasse and leaves can be made available for 2G ethanol production by using a steam dryer, the additional capital cost for the equipment was compensated for by the higher volume of 2G ethanol, and the production cost of 2G ethanol was also decreased. An alternative to a steam dryer is a pneumatic dryer using flue gases as drying medium. The use of such a dryer has been shown to increase boiler efficiency

31
from 64.1% to 70.4%, by increasing the LHV, and the equipment cost of the bagasse dryer with a capacity of 22.9 kg/s was comparable to that of the economizer, according to preliminary cost estimates (Sosa-Arnao and Nebra 2009).
Boiler pressure is a fundamental parameter determining the electricity production via the steam cycle and the surplus that can be sold. Boilers operating at 22 bar used to be installed in the sugar-alcohol industry until the 1980s (Camargo 1990), but more recently, 65-bar boilers have been more frequently installed. In recent years, manufacturers have started supplying boilers at even higher pressures (82-118 bar) to meet the sugar industry requests for more efficient production of bioelectricity (Ensinas et al. 2010; Seabra and Macedo 2011; Caldema 2014; Dedini 2014). Dias et al. reported that the surplus electricity generated was 26.5, 52.3, 80.0 and 91.7 kWh/ton-SC for boilers operating at 22, 42, 65 and 82 bar, respectively, in an integrated 1G+2G ethanol plant also using pentoses for ethanol production (Dias et al. 2013). In an analogous plant with hydrolysis and co-fermentation yields of 95%, the electricity surplus achieved with a 90-bar boiler was only 56 kWh/ton-SC, due to the lower amount of hydrolysis residues combusted (Paper II). However, the low electricity surplus was compensated for by a higher 1G+2G ethanol yield: 179 L/ton-SC (Paper II), compared with 115.7 L/ ton-SC obtained in the case when 82-bar boiler was used in an integrated 1G+2G plant producing ethanol with non-theoretical yields (Dias et al. 2013). Also in an autonomous distillery, the surplus electricity from bagasse could be increased by using a higher boiler pressure. For example, it could be increased from 109 to 126 kWh/ton-SC by adopting a boiler pressure of 90 bar compared to 65 bar (Papers I and II). The advantage is greater if dry leaves are added as a fuel for the combustion in 90-bar boiler because of their low moisture content (15%), thus increasing the electricity surplus by 83% to 230 kWh/ ton-SC (Paper II).
From a cost perspective, maximization of the heat recovery using new heat exchangers and a steam dryer, as well as the combination of five-effect evaporation with thermally integrated distillation units, contributed to the decrease in 2G MESP in a heat integrated 1G+2G ethanol plant (Paper I). However, increasing the plant energy efficiency by the installation of more efficient equipment, and consequently increasing the bagasse available for the production of 2G ethanol, was found to have a negative effect on the overall ethanol production cost (1G+2G MESP), because of the higher production of costly 2G ethanol compared to 1G ethanol. As a consequence, 1G+2G MESP increased from 0.43 to 0.48 US$/L, while 2G MESP decreased from 1.55 to 1.11 US$/L (Paper I). It was noted that increasing the pressure in the boilers reduced the ethanol production cost by only 0.01 R$/L (0.004 US$/L), in spite

32
of the significant variations in the amounts of electricity and ethanol produced (Dias et al. 2013), suggesting that different production ratios between ethanol and electricity can be economically equivalent.
Integration of energy and process streams Synergies arising from the integration of streams are expected to reduce the energy demand and the capital cost. Streams rich in fermentable sugars or ethanol can be combined and subjected to the same processing. Streams can be mixed at three different stages: before evaporation, before fermentation or before distillation. The mixing of the juice stream in the bagasse hydrolysis and fermentation was not investigated in the present work. However, experimental results on mixing sugar beet molasses at various ratios in the SSF of bagasse showed that lower ethanol yields were obtained at higher sucrose ratios. The two probable reasons identified were the initial glucose inhibition of cellulases, and the reduced fermentation rate of yeast caused by toxic compounds from pretreatment and by the slow rate of enzymatic hydrolysis (Macrelli 2007). Instead of mixing the sugar streams completely before evaporation, a more efficient and cheaper integration configuration was chosen. This design, shown in Figure 3.1, was characterized by smaller volumes flowing through the evaporators and, thus, less heat being needed to increase the temperature of the liquid to boiling point.
SHREDDING MILLING
5-EFFECT EVAPORATION
FERMENTATION 1G+2G
YEAST SEPARATION
WARM WASH
BAGASSE HANDLING
ENZYMATIC HYDROLYSIS
STEAM PRETREATMENT
SOLID/LIQUID SEPARATION
YEAST ACID WASH
BOILERSTEAM TURBINE
ANAEROBIC DIGESTION
DRYING
DISTILLATION1G+2G
1G+2GEthanol
Biogas
CLARIFICATION
SOLID/LIQUID SEPARATION
Sugarcane
(Leaves)
Vinasse
Solidresidues
Pentose-rich
Hexose-rich
Filter cake
ElectricitySteam
33
Figure 3.1 - Flowsheet for the integrated 1G+2G plant. The integration is obtained by mixing the 2G sugar stream with 1G juice stream before and after evaporation. (Paper I)
In Paper I, the partial blending of the 2G sugar-rich liquid with the sugar juice before and after evaporation was used to obtain an intermediate concentration of 25% w/w sucrose and a final concentration of mixed sugar of 8.5% w/w before joint fermentation. In the simulations it was assumed that mixing the two sugar streams had no effect on fermentation yields and/or rates. Therefore, the same ethanol yield as that from 1G fermentation was assumed for the integrated fermentation, giving a final ethanol concentration of 4.2% w/w before being distilled in a single distillation unit.
The other integration configuration, shown in Figure 3.2, relied only on mixing the two fermented broths containing 7% w/w (1G) and 1.4% w/w (2G) ethanol, to give an average ethanol concentration of 3.5% w/w, before entering the common distillation unit. The capital cost can be also reduced as the stripper reboilers are smaller, and a single unit is generally cheaper than two smaller units for the separate distillation of 1G and 2G fermented broths. Both integration designs led to similar and slightly higher energy efficiency and lower capital cost per litre, in terms of 2G MESP and 1G+2G MESP (Paper I). Moreover, the integrated distillation configuration offers simplicity of layout and flexibility for the use of different microorganisms in sugar fermentation.
SHREDDING MILLING
5-EFFECT EVAPORATION
FERMENTATION1G
YEAST SEPARATION
WARM WASH
BAGASSE HANDLING
ENZYMATIC HYDROLYSIS
STEAM PRETREATMENT
SOLID/LIQUID SEPARATION
FERMENTATION 2G
YEAST ACID WASH
BOILERSTEAM TURBINE
ANAEROBIC DIGESTION
DRYING
DISTILLATION1G+2G
1G+2GEthanol
YEAST SEPARATION
Biogas
CLARIFICATION
SOLID/LIQUID SEPARATION
Sugarcane
Solid residues
Vinasse
Filter cake
Pentose-rich
ElectricitySteam
34
Figure 3.2 - Flowsheet for the integrated 1G+2G plant. The integration is obtained by mixing the 2G fermented broth with 1G fermented juice before distillation. (Paper I)
Other integration opportunities have been investigated in terms of using different feedstocks than sugarcane in the same facility, and expanding the process using ethanol as raw material. Sweet sorghum can be effectively processed in sugar mill facilities outside the sugarcane crushing season, and has been shown to be a viable feedstock for electricity and ethanol production (Cutz 2014). Ethanol produced in an integrated 1G+2G plant can be further converted via vapour-phase catalysis to butanol, but the process economics are favourable only if the butanol is used for chemical purposes, and not sold as a fuel (Pereira et al. 2014).
3.1.2 Configurations for hydrolysis and fermentation
Simultaneous saccharification and fermentation (SSF) and separate hydrolysis and fermentation (SHF) are two alternative concepts of process configurations that have been widely used to produce bioethanol via the enzymatic route (Taherzadeh and Karimi 2007b; Olofsson et al. 2008). In Figure 3.3 a schematic representation of SSF and SHF is shown. In SHF the enzymatic hydrolysis and fermentation are performed in two separate vessels where different optimal conditions of temperature and pH are set: 45-50°C and pH 4.8-4.9 for hydrolysis with cellulase enzymes, 30-40°C and pH 4.5-6.5 for fermentation, depending on the fermenting microorganism. After hydrolysis the solid fraction is removed and only the liquid is fermented, and that facilitates the recovery of the fermenting microorganisms. In contrast, in SSF the hydrolysis of polysaccharides and fermentation of monomers occur in the same vessel at the same conditions of temperature and pH (Gauss et al. 1976). The main advantage of adopting SSF is to avoid the enzyme inhibition due to end-product accumulation in the broth because monomers are consumed by the fermenting microorganisms as soon as they are released. However, the main disadvantage of SSF is that the temperature and pH conditions used are a compromise between two optimal ones and the rates of hydrolysis and fermentation are reduced. Numerous studies comparing the two configurations showed that higher ethanol yield and rate could be obtained by SSF rather than SHF (Alfani et al. 2000; Olsson et al. 2006; Öhgren et al. 2007; Tomás-Pejó et al. 2008; Alves dos Santos et al. 2010). Nevertheless, depending on enzyme cocktail used, SSF and SHF could be alternatively the best option (Cannella and Jørgensen 2013).

35
Figure 3.3 - Schematic representation of the SSF, tSHF and SHF configurations.
Several studies have recently been published in which hybrid configurations that combines features from SSF and SHF to deal with the high solids loading and to reduce fibre viscosity before SSF have been used (Merino and Cherry 2007; Hoyer et al. 2013; Cannella and Jørgensen 2013; Alvira et al. 2013; Palmqvist and Lidén 2014; Mesa et al. 2011). The technique adopted consist in pre-hydrolysis at the temperature optimal for the enzymes, at least for a period long enough to ensure liquefaction and efficient mixing. If pre-hydrolysis is run for an extended period, it can be considered as complete hydrolysis, since lignocellulose is almost completely hydrolysed before yeast inoculation. This configuration can be regarded as hydrolysis and delayed fermentation, or time-separated hydrolysis and fermentation (tSHF) (Figure 3.3), due to the fact that most of the hydrolysis takes place prior to fermentation, and there is no physical separation of the liquid from the hydrolysis residues, as in SHF.
HYDROLYSIS AND FERMENTATION
FERMENTATIONENZYMATIC HYDROLYSIS
ENZYMATIC HYDROLYSIS
FERMENTATION
time-Separated Hydrolysis and Fermentation (tSHF)
Simultaneous Saccharification and Fermentation (SSF)
Separate Hydrolysis and Fermentation (SHF)
SOLID/LIQUID SEPARATION
solid residues

36
From a process design perspective, these configurations result in different equipment, tank number and energy requirements. SSF is the simplest configuration because hydrolysis and fermentation take place in the same vessel and the process is isothermal, thus, there is no need for intermediate cooling. However, if a mesophilic microorganism, such as S. cerevisiae, is used, the hydrolysis and fermentation rates are negatively affected due to their different temperature optima, resulting in a longer residence time and a higher number of tanks being required. Moreover, the electricity demand for stirring is higher, due not only to the extended residence time, but also the slower rate of viscosity decrease than in SHF.
The SHF configuration has several advantages compared with SSF in terms of productivities if the enzymatic cocktail is designed to limit end-product inhibition. However, efficient separation and intermediate cooling are required, due to the different temperature optima of hydrolysis and fermentation, and relevant sugar losses may occur if the filter cake is not thoroughly washed. The equipment suitable for solid-liquid separation depends on the particle size of hydrolysed fibres, but filter presses and rotary drum filters are generally recommended. The sugar recovery, the amount of water used for cake washing and the dry matter content of the cake are important parameters that directly determine the water content in both the solid and liquid fractions. However, efficient counter-current washing in rotating drum vacuum filters (Grähs 1976) and filter presses can increase the sugar content and minimize the sugar lost with the cake to 2-6%. The negative effect of high water content in the filter cake can be reduced with a steam dryer which removes the water before combustion by drying the filter cake up to 80% dry matter, and recovers above 85% of the heat as secondary steam (Paper I). The heat required to maintain the hydrolysis tanks at a temperature of about 50°C can be provided by the 0.25 bar steam from the condensing turbine, which is available at least in an amount of 480 kWh/ton of dry bagasse feed in the 2G process, as there is no use of low pressure steam for district heating in Brazil.
In Paper III, the tSHF hybrid configuration is designed to take advantage of the best characteristics of SSF and SHF, i.e. maximal hydrolysis and fermentation rates and minimal tank size. Moreover, capital cost is decreased, and sugar losses and dilution are avoided because the solid-liquid separation is unnecessary in this configuration. No additional costs for electricity or heat are required, except that for intermediate cooling. Fed-batch of pretreated material can enhance the advantages of using the hybrid configuration by allowing an efficient mixing of high solids loading while minimizing the feeding intervals (Paper III). In Figure 3.4 a design is illustrated on how tSHF can be integrated in the 2G ethanol production process.

37
Figure 3.4 - Flowsheet for 2G ethanol production by using the SSF or tSHF configuration in
fed-batch mode (FB-L). (Paper III)
However, in tSHF, as in SSF, it is difficult to recover the yeast from the solid residues of hydrolysis, and this has a negative effect on the operating cost. Three possible options to tackle this problem are: i) the recovery of yeast cells present at moderate concentration (10 gDM/L) in the broth by centrifugation, which includes the extra cost to remove the solid residues from the centrifugate to purify the yeast; ii) the use of yeast cell at very low concentration to avoid the need for cell recovery; iii) the recycle of yeast together with the solid residues for a few times. The feasibility of these alternatives depends on the costs of fresh yeast, equipment and electricity. Given the cost of fresh yeast of 0.10 US$/L of ethanol in both SSF and tSHF, it may be profitable to recycle the yeast. The tSHF configuration showed an 8% reduction in 2G MESP compared to SSF, due to higher ethanol productivity and lower capital cost of the tanks. In fact, SSF required a 54% greater tank volume to obtain the same ethanol yield (Paper III).
In the tSHF configuration, at 10% WIS content and when only hexoses were fermented, the ethanol concentration before distillation was found to be 23 g/L (Figure 3.5b), which is below the 4% w/w threshold considered to be economically feasible. Therefore, the ethanol concentration was increased by modifying the tSHF configuration by recirculating the fermented liquid, as shown in Figure 3.6.
FB-L SSF or tSHF STEAM PRETREATMENT
BOILERSTEAM TURBINE
ANAEROBIC DIGESTION
DRYING
DISTILLATION1G+2G
Ethanol1G+2G
Biogas
SOLID/LIQUID SEPARATION
Liquid fractions
Pentose-rich liquid
SOLID/LIQUID SEPARATION
Dry solid residues
Bagasse from 1G
Fermented broth from 1G
10% WIS

38
Figure 3.5 - Concentration profiles of glucose (□), ethanol (◊), glycerol (○), acetic acid (Δ) for the four experimental configurations. (Paper III)
The concentration was increased to 35.8 g/L (Figure 3.5c), as a result of adding a further solid-liquid separation unit after the tSHF to obtain the fermented liquid, and including an extra dryer unit (Dryer 1, Figure 3.6) to remove the water from the solids and simultaneously recover ethanol. The overall capacity for solid-liquid separation and drying in this new configuration, denoted tSHF+R, is the same as in the tSHF configuration, but they are carried out in two units. Furthermore, the addition of Dryer 1 allowed the recovery of the ethanol in the solid residues at a higher concentration (28 g/L) than the 22.6 g/L present in the fermented liquid, while the solid-liquid separation unit reduced by 41% the solid residues passing through the distillation column. As expected, tSHF+R yielded a higher electricity surplus (+12.5%), but the capital cost (+1.6%) also increased. However, this configuration was not economically viable compared to the tSHF configuration without recirculation, as the 2G MESP was 0.03 US$/L higher. The reasons for this are the higher capital cost and lower 2G ethanol yield obtained during the hydrolysis and fermentation in tSHF+R.
0102030405060708090
100110
0 20 40 60 80 100
Conc
entr
atio
n (g
/L)
Time (h)
010203040
5060708090
100110
0 20 40 60 80 100
Conc
entr
atio
n (g
/L)
Time (h)
0102030405060708090
100110
0 20 40 60 80 100
Conc
entr
atio
n (g
/L)
Time (h)
0102030405060708090
100110
0 20 40 60 80 100
Conc
entr
atio
n (g
/L)
Time (h)
tSHF10SSF10
tSHF20tSHF10+R
a)
d)c)
b)

39
Figure 3.6 - Flowsheet for 2G ethanol production using the tSHF configuration in fed-batch mode (FB-L), followed by the separation of the fermented liquid and the recirculation in a new
tSHF. (Paper III)
3.2 Process options
3.2.1 Use of pentoses: electricity from biogas vs. ethanol
The considerable amount of pentoses contained in bagasse and leaves can be used in the 2G process to produce ethanol and/or biogas. Theoretically, a maximum of either 89 L of ethanol or 66 Nm3 of methane per dry ton of lignocellulosic material can be obtained from pentoses contained in bagasse and leaves. The economics of the 1G+2G ethanol plant is heavily influenced by the choice of producing ethanol or electricity from biogas. In fact, the values of 2G MESP could be grouped into two macro-regions corresponding to the production of ethanol or electricity from biogas. Ethanol production from pentoses gave the lowest 2G MESP, ranging between 0.50 and 0.63 US$/L. When electricity was produced form biogas the 2G MESP increased to 0.88-1.14 US$/L (Paper II). This is due to a combination of several factors. The first, and most relevant one, is the volume of ethanol produced, since this is the allocation base for costs. The cost per litre was thus higher when a lower volume of ethanol was produced, as a result of the production of electricity from biogas. When pentose co-fermentation increased the volume of 2G ethanol by 80%, the allocation basis reduced the 2G capital cost per litre more than 30%. Secondly, the capital cost for producing electricity from biogas is
STEAM PRETREATMENT
SOLID/LIQUID SEPARATION DRYER 1
BOILERSTEAM TURBINE
ANAEROBIC DIGESTION
DRYER 2
DISTILLATION1G+2G
Ethanol1G+2G
Biogas
SOLID/LIQUID SEPARATION
Liquid fractions
Pentose-richliquid
SOLID/LIQUID SEPARATION
Dry solid residues
Recirculation of fermented liquid
Bagasse from 1G
Fermented broth from 1G
FB-L FERMENTATION
10% WIS
ENZYMATIC HYDROLYSIS
tSHF
FB-L tSHF10+R

40
higher because of the need for additional internal circulation reactors, which operate at constant productivity with an increased organic loading rate, and due to the need for a larger CHP plant. The capital cost per litre increased by 20% in the 2G process, corresponding to 0.10 US$/L. The third reason is that the electricity selling price (87 US$/MWh) is not high enough to compensate for the lower ethanol production despite the additional generation of 285kWh/ton of dry lignocellulosic materials (Paper II). A more efficient CHP cycle than the Rankine cycle, such as the combined-cycle gas turbine, could be employed to yield a higher electricity surplus, and this would probably be competitive with ethanol production from pentoses. Instead of producing electricity, the biogas could be upgraded and sold as transportation fuel. This was found to improve the economics of the 2G ethanol from softwood (Barta et al. 2010).
3.2.2 Addition of leaves
The addition of leaves to the 2G process is an option to increase the volume of 2G ethanol, as this allows the plant input capacity to be increased, while keeping the same ethanol yield per ton of material processed. In the cases investigated in this work, leaves were added at a proportion of 50% dry basis of the bagasse input to the 2G process. In the ideal scenarios described in Paper II, the overall 1G+2G ethanol production increased by 22.4% and 14.4%, if pentoses were co-fermented or used for biogas, respectively. The larger equipment required for the increased input capacity could reduce the 2G capital cost per litre by up to 18% due to economies of scale. However, the high opportunity cost for electricity had a negative effect on the 2G MESP. The reason is ascribed to the enhanced electricity generation from leaves (908 kWh/ton dry of bagasse and leaves) compared to bagasse (747 kWh/ton dry bagasse) in the 1G process. This is due to the lower moisture of leaves (15%), which consequently reduced the heat loss as latent heat of vaporization. The negative effect on 2G MESP due to the high opportunity cost is enhanced when electricity selling prices are high; however, at lower electricity prices the negative influence was reduced more quickly than if only bagasse was used (Paper II). Thus, 2G ethanol from bagasse and leaves can be competitive with 1G ethanol at 32 US$/MWh without subsidies (Figure 3.7b), while for bagasse only the electricity price must (unrealistically) fall to 12 US$/MWh (Figure 3.7a). The combined effect of the addition of leaves and a 250% more efficient enzyme could move the point of MESP equivalence, i.e. the competitiveness with 1G ethanol, towards an electricity selling price (54 US$/MWh) closer to market value (Figure 3.8b).

41
Figure 3.7 - MESP of 1G, 2G and 1G+2G are plotted for (a) the case without leaves {B} and (b) with addition of leaves {B+L}. Case {C5 EtOH, 20% WIS, 96 h, 100% EHE}in Paper II.
Figure 3.8 - MESP of 1G, 2G and 1G+2G are plotted for (a) the case without leaves {B} and (b) with addition of leaves {B+L}. Case {C5 EtOH, 20% WIS, 96 h, 250% EHE}in Paper II
.
0.25
0.30
0.35
0.40
0.45
0.50
0.55
0.60
0 20 40 60 80 100
MES
P, U
S$/l
itre
Electricity selling price, US$/MWh
a)
0.25
0.30
0.35
0.40
0.45
0.50
0.55
0.60
0 20 40 60 80 100
MES
P, U
S$/l
itre
Electricity selling price, US$/MWh
b)1G+2G {B}1G {B} 1G {B+L} 1G+2G {B+L}2G {B} 2G {B+L}
0.25
0.30
0.35
0.40
0.45
0.50
0.55
0.60
40 50 60 70 80 90
MES
P, U
S$/l
itre
Electricity selling price, US$/MWh
a) 1G {B} 2G {B}1G+2G {B} 2G {B, 100% EHE}
0.25
0.30
0.35
0.40
0.45
0.50
0.55
0.60
40 50 60 70 80 90
MES
P, U
S$/l
itre
Electricity selling price, US$/MWh
b) 1G {B+L} 2G {B+L}1G+2G {B+L} 2G {B+L, 100% EHE}

42
3.3 Yields In mature industrial processes the cost of the feedstock accounts for most of the production cost (Lynd et al. 1996), about 60-70% (CGEE 2009; Bajay and Nogueira 2011). It is thus of paramount importance to maximize the conversion of biomass into bioproducts (Wyman 2007). The cost of the feedstock when producing 1G ethanol from sugarcane was found to be 61% of the production cost (Paper I), and maximizing the yield in the 2G ethanol process could reduce the 2G MESP significantly (Paper III).
In ethanol production from lignocellulose, the overall ethanol yield has been found to be the most important factor influencing the production cost (Von Sivers and Zacchi 1996; Wyman 2007; Paper I ; Paper IV). The overall yield in the 2G ethanol process from sugarcane depends on the design of the process and on the operating conditions in each step: bagasse handling, pretreatment, solid-liquid separation, enzymatic hydrolysis and fermentation. Sugar losses can be minimized in the first three steps (Diedericks et al. 2013; Rocha et al. 2012; Wingren et al. 2003), and research is currently directed towards improving the ethanol yield from the last two steps, especially when enzymatic hydrolysis is performed at high WIS, and when pentoses are co-fermented with hexoses.
In general, the MESP is calculated based on the volume of ethanol produced, and a reduction in the MESP may be obtained by maximizing the overall 2G ethanol yield. Theoretically, a reduction of about 42% could be achieved in 2G MESP by co-fermenting the pentoses to ethanol (Paper II) or by increasing the cellulose hydrolysis and pentose co-fermentation yields form 50% to 90% (Paper IV). The capital cost of the distillation/dehydration unit increased by 10%, while the total capital investment for the plant decreased by about 10%, mainly due to the smaller size of CHP plant generating half of the electricity surplus (Paper IV). However, the costs incurred by the strategy chosen to improve the yield may not be economically feasible, as the MESP would increase as a result of yield maximization.
Since the effect of the 2G ethanol yield on the production cost can be either positive or negative, trade-offs can be found by techno-economic analysis when considering all the production parameters and the specific flowsheet simultaneously. In fact, it was found that the 2G MESP could be reduced by lowering (Paper III) or increasing (Paper I) the yield compared to the reference case. Lower 2G ethanol yields in an energy-efficient plant resulted in more biomass being available for electricity generation. 2G ethanol was more expensive when assuming 50% yields in both cellulose hydrolysis and pentose co-fermentation. At a selling price of 87 US$/MWh the process did

43
not benefit from the high electricity surplus (65 kWh/ton-SC) (Paper IV). At almost theoretical yields (95%) the electricity surplus can be as low as 22 kWh/ton-SC, and the profitability of the 1G+2G ethanol plant was not considerably improved, even at extremely high electricity selling prices (140 US$/MWh) (Figure 3.9).
Figure 3.9 - NPV and IRR for 1G and 1G+2G ethanol when bagasse {B} and bagasse supplemented with leaves {B+L} are used as feedstock.
Case {C5 EtOH, 20% WIS, 96 h, 250% EHE}in Paper II.
Several strategies can be employed to improve the production of 2G ethanol per ton of sugarcane processed, such as process integration (Paper I), low WIS loading (Paper III), longer residence times in hydrolysis and fermentation (Papers I and III), increasing the enzyme dosage (Paper I) and broth detoxification (Alriksson et al. 2011). Pentose co-fermentation is regarded as the most promising, showing the highest theoretical reduction of 2G MESP (42%) (Paper II) and the highest IRR (Dias et al. 2011a).
The economic feasibility of a strategy capable to improve the yield of cellulose hydrolysis and/or pentose co-fermentation can be estimated using the concept of feasible cost margin, which allows the cost incurred by the improvement to be theoretically predicted. The cost margin shown in Figure 3.10 was calculated as the difference in 2G MESP between Case 1 (the reference case), having the lowest yields for both cellulose hydrolysis (50%) and pentose co-fermentation (50%), and each of the other cases characterized by higher yields. In Cases 2 to 9 no cost are incurred to obtain yield improvements compared to the reference case. The cost margin can also be
200
250
300
350
400
450
500
550
600
650
40 60 80 100 120 140
Net
Pre
sent
Val
ue, m
illio
n US
$
Electricity selling price, US$/MWh
a)
16%
18%
20%
22%
24%
26%
28%
30%
40 60 80 100 120 140
Inte
rnal
Rat
e of
Ret
urn,
%
Electricity selling price, US$/MWh
b)
1G+2G {B}1G {B} 1G {B+L} 1G+2G {B+L}
0.60 US$/L or102 US$/MWhLHV
0.60 US$/L or102 US$/MWhLHV

44
regarded as the maximum amount that can be spent to obtain a specific yield improvement compared to the reference case (Case 1). Strategies for enhancing the yields of cellulose hydrolysis and/or pentose co-fermentation are associated with a cost, and this cost was calculated for some of these strategies, regardless of whether the yield improvement could be obtained experimentally.
Figure 3.10 - MESP for 2G ethanol production without additional cost incurred to achieve the yield improvement (hatched bars) and the maximum cost (margin) that can be spent to improve
the yields (dotted bars) compared to Case 1. The notation 50/70 for Case 2 indicates that 2G ethanol production is obtained with a 50% yield for cellulose hydrolysis and 70% yield for
pentose co-fermentation. (Paper IV)
In Figure 3.11, the cost of each strategy for increasing the yield is added to the 2G MESP, which does not include the cost for yield improvement. Thus, if a single strategy, or a combination of strategies, is expected to achieve the yields shown in the Figure 3.11, the extra cost incurred can be estimated and compared with a chosen reference case, in order to assess the economic feasibility. Or, if a feasible strategy or strategies are adopted, then the yields are given compared with a chosen reference, and represent the target for experimental confirmation.
0.76 0.67
0.63 0.60 0.56 0.53 0.51 0.48 0.44
0.09 0.13 0.16 0.20 0.23 0.25 0.28 0.32
0.00
0.10
0.20
0.30
0.40
0.50
0.60
0.70
0.80
0.90
Case 150/50
Case 250/70
Case 470/50
Case 350/90
Case 570/70
Case 790/50
Case 670/90
Case 890/70
Case 990/90
2G M
ESP
and
Cost
Mar
gin,
US
$/L

45
Figure 3.11 - Costs associated with yield improvement. The notation 50/70 for Case 2 indicates that 2G ethanol production is obtained with a 50% yield for cellulose hydrolysis and 70% yield
for pentose co-fermentation. (Paper IV)
Another effect of high yields is that small-scale 1G+2G plants, producing 88 million litres of 2G ethanol per year, may be competitive with larger-scale 1G+2G plants that produce 73% more 2G ethanol (152 million litres per year) with the same high yields. The input capacity of the small-scale 1G+2G plant was obtained by scaling down from a plant with an input of 540 ton-SC/h, and the capital cost was assumed to be increased using the six-tenths rule. The small-scale plant could produce 2G ethanol at 2G MESP 0.034 US$/L higher than the larger plant. However, the smaller plant may benefit from a lower cost for sugarcane and leaves, due to lower costs for transportation (Paper IV).
0.00
0.10
0.20
0.30
0.40
0.50
0.60
0.70
0.80
0.90
Case 150/50
Case 250/70
Case 470/50
Case 350/90
Case 570/70
Case 790/50
Case 670/90
Case 890/70
Case 990/90
US$
/litr
e
Decreasing the WIS from 20% to 10%Increasing enzyme dosage by 50%Increasing enzymatic hydrolysis time by 48 hIncreasing fermentation time by 48 hUse of 10 mM sodium dithionite2G MESP

46
3.4 Process conditions
3.4.1 Residence time for hydrolysis and fermentation
The residence time in hydrolysis and fermentation is a crucial parameter that contributes in determining the sugar and ethanol yields obtained, as well as the capital cost of the hydrolysis and fermentation tanks. Thus, the effect on the 2G MESP can be used to discriminate between economically feasible and unfeasible options, if a too long residence time is used. In the 2G ethanol production from bagasse and leaves the combined effect of residence time and yield is summarized by the overall ethanol productivity for hydrolysis and fermentation. Residence time was the key factor in establishing which configuration, SSF or tSHF, could provide cheaper 2G ethanol when performing experiments with the same enzyme and yeast dosage, and obtaining the same yield in hydrolysis and fermentation (Paper III). In fact, tSHF required only 48 hours of hydrolysis and 8 hours of fermentation to outperform the 96-hour-long SSF (Figure 3.5a,b and Table 3.3). The difference in 2G MESP between SSF and tSHF was 0.08 U$/L, and could be entirely attributed to the higher capital cost of the SSF tanks (Paper III). When the fermentation time was extended to 25 hours in all three tSHF cases studied in Paper III, the ethanol productivity during fermentation decreased by between 46% and 67%, and the overall ethanol yield, based on hydrolysis and fermentation, increased slightly, by 4.6 percentage points at most (Table 3.3). As a consequence of the higher 2G ethanol production, the 2G MESP could be slightly reduced (Paper III).

47
Table 3.3: Experimental results obtained using the short and long fermentation times. (Paper III)
SSF10 tSHF10 tSHF10+R tSHF20
EH time 96 h a 48 h 48 h 48 h Yglu, EH
b 67.7% 67.7% 61.8% 65.6% Yxyl, EH
b 14% 22% 22% 23% Yara, EH
b 28% 42% 36% 34%
Fermentation time: SHORT 96 h a 8 h 13 h 12 h ce, final (g/L) 22.7 22.6 34.2 47.4 Yg/e, EH+F 63.0% c 63.0% 59.1% 59.6% Yg/e 93.0% 93.0% 95.7% 90.9% Y g/gly 1.2% 2.4% 3.0% 3.2% Y g/x+bp 5.8% 4.6% 1.3% 5.9% q g/e (g/L/h) - 2.83 1.55 3.95 r g/e (g/g/h) - 0.57 0.31 0.34 q g/e, EH+F (g/L/h) 0.24 0.40 0.56 0.79 r g/e, EH+F (g/g/h) 0.05 0.08 0.11 0.07
Fermentation time: LONG - 25 h 25 h 25 h ce, final (g/L) - 23.7 35.8 48.4 Yg/e, EH+F - 65.9% 63.7% 60.9% Yglu, EH
d - 70.9% 66.5% 67.0% q g/e (g/L/h) - 0.95 0.84 1.94 r g/e (g/g/h) - 0.19 0.17 0.17 q g/e, EH+F (g/L/h) - 0.32 0.48 0.66 r g/e, EH+F (g/g/h) - 0.06 0.10 0.06
q g/e, max (g/L/h) 1.18 5.11 4.43 7.14 r g/e, max (g/g/h) 0.24 1.02 0.89 0.62
a Hydrolysis and fermentation occur simultaneously in SSF with a total duration of 96 hours. b The EH yield for glucose (Yglu, EH), xylose (Yxyl, EH) and arabinose (Yara, EH) were calculated based on the amount of sugar released during the 48 hours of EH, except in SSF10, where the yield was back-calculated by dividing the glucose to ethanol yield (Yg/e, EH+F) by the assumed fermentation yield (Yg/e) c The fermentation yield for SSF10 was assumed to be equal to that for tSHF10. d Yield of glucose back-calculated assuming that the glucose to ethanol yield (Yg/e) was equal to that obtained with a short fermentation time. Yglu, EH : glucan to glucose yield in enzymatic hydrolysis Yxyl, EH : xylan to xylose yield in enzymatic hydrolysis Yara, EH: arabinan to arabinose yield in enzymatic hydrolysis ce, final : final ethanol concentration measured at the specified fermentation time Yg/e, EH+F : glucose to ethanol yield in enzymatic hydrolysis and fermentation Yg/e : glucose to ethanol yield in fermentation Y g/gly : glucose to glycerol yield in fermentation Y g/x+bp: glucose to biomass and other by-products yield in fermentation

48
q g/e: glucose to ethanol volumetric productivity in fermentation r g/e: glucose to ethanol specific productivity per gram yeast in fermentation q g/e, EH+F : glucose to ethanol volumetric productivity in enzymatic hydrolysis and fermentation r g/e, EH+F : glucose to ethanol specific productivity per gram yeast in enzymatic hydrolysis and fermentation q g/e, max : glucose to ethanol maximum volumetric productivity in fermentation r g/e, max : glucose to ethanol maximum specific productivity per gram yeast in fermentation
In SHF, fermentation can be performed at high yeast concentration in order to reduce the residence time, as in the 1G process, where the fermentation time is often less than 12 hours and the ethanol obtained ranges between 6% and 8.5% w/v (Basso et al. 2008). For this reason, enzymatic hydrolysis is regarded as the most time-demanding step, especially at high WIS, even when performed at optimal conditions of temperature and pH.
In another study (Paper I), a residence time of 72 hours for enzymatic hydrolysis was shown to outweigh the extra capital cost, giving a lower 2G MESP than a residence time of 48 hours, regardless of the enzyme dosage used. The higher yield achieved with the longer hydrolysis time had the effect of increasing the production of 2G ethanol (cases with low enzyme dosage) and improving the 1G+2G plant energy efficiency (cases with high enzyme dosage). The 2G MESP was thus reduced by a longer residence time by 0.09 US$/L (-6.2%) in the former cases, and by 0.06 US$/L (-4.8%) in the latter cases.
At almost theoretical yields (95%), increasing the residence time in enzymatic hydrolysis from 48 hours to 96 hours was found to have a smaller effect than changing the enzyme dosage or WIS loading, but was still responsible for an increase in 2G MESP between 0.03-0.13 US$/L, corresponding to 4% and 13% of the total 2G MESP, respectively. The effect of residence time on 2G MESP varies depending on the WIS loading, and together they determine the number of tanks required, and, thus, the cost. Extending the residence time affects the capital cost more at low WIS than at high WIS, due to the larger tank volume required (Paper II).

49
3.4.2 Water-insoluble solids
In contrast to the residence time, the choice of the WIS loading in enzymatic hydrolysis influences not only the ethanol yield and the capital cost of the tanks, but also the amount of water required and the ethanol concentration, which ultimately affect the cost and the energy demand for distillation. The ethanol yield from hydrolysis and fermentation is lower at high WIS loading than at low WIS loading, as a result of inhibitory compounds affecting the enzymes and the fermenting microorganism, inefficient mixing and water effect (Kristensen et al. 2009; Hoyer et al. 2009; Cannella and Jørgensen 2013). The rate and yield of enzymatic hydrolysis are primarily affected by non-productive adsorption of enzymes and end-product inhibition (Kristensen et al. 2009). In the tSHF of bagasse performed at 20% WIS, the overall yield (Yg/e,EH+F) achieved was 60.9%; 5 percentage points lower than at 10% WIS (Table 3.3). However, a glucose concentration above 100g/L was obtained after 48 hours of enzymatic hydrolysis, showing the low end-product inhibition of the cellulase cocktail used (Figure 3.5d). Moreover, the overall specific ethanol productivity of hydrolysis and fermentation (rg/e,EH+F) was found to be the same as with 10% WIS (0.06 gethanol/g dry yeast/h) after 25 hours of fermentation (Table 3.3), suggesting that the performance of the yeast was not negatively influenced by higher concentrations of inhibitors (Paper III).
When the WIS loading is increased from 10% to 20% the amount of water required to dilute the pretreated fibres is halved, as is the number of tanks needed. For the plant size investigated with 96 hours residence time for the enzymatic hydrolysis, this corresponds to a reduction of 36 tanks (2500m3 each) whose capital cost is roughly 43 million US$ altogether (Paper II). More powerful drivers and electricity are generally required to mix efficiently high-viscosity material. However, the amount of electricity needed to mix 20% WIS has been reported for agricultural residues to decrease very rapidly in the first 5 hours of hydrolysis, due to fast liquefaction, and the extra electricity required was found to be minimal (Palmqvist and Lidén 2012). It can be a reasonable assumption that this would also be the case for bagasse. Theoretically, doubling the WIS amount corresponds to double the 2G ethanol concentration prior to distillation. Nevertheless, the effect in terms of equipment cost reduction is much smaller, particularly if the distillation of 1G and 2G ethanol is combined in a single unit, as the variation in 2G ethanol concentration will be reduced by mixing with 1G ethanol. For the same reason, the difference in the energy requirement for distillation compared with that in the non-integrated case would reduce the 2G MESP by only 0.015 US$/L at most (Papers II and III). The lower investment cost, as a consequence of adopting 20% WIS, would lead the decrease of 2G MESP up to 0.11 US$/L (Paper II). The ethanol yield and the volumetric productivity

50
in tSHF at 20% WIS are lower than at 10% WIS, as expected (Table 3.3). However, the 2G MESP at high WIS is lesser, regardless of the fermentation time, due to the lower capital cost, which outweighs the negative effect of the reduced production of 2G ethanol (Paper III).
In the case of almost theoretical yields (95%), WIS loading up to 30% is regarded as the best strategy to decrease the 2G MESP, after reducing the enzyme cost (Paper II). A similar conclusion can be drawn from Figure 3.11 considering that the highest cost incurred when increasing the yield is associated with the reduction of the WIS from 20% to 10% (Paper III).
However, when the WIS is increased from 20% to 30% in Paper II, the benefit in terms of cost reduction is reduced as a smaller number of tanks is avoided, and the energy gain in distillation is lower at higher ethanol concentration. The magnitude of the capital cost reduction that can be obtained by increasing the WIS loading also depends on the residence time, and is higher for longer residence times (Paper II).
3.5 Costing factors and market prices The cost of feedstock and chemicals, in combination with market prices for electricity and ethanol, determine the production cost and profitability of 2G ethanol. Price variations could make the 2G process feasible or unfeasible.
3.5.1 Enzyme efficiency and cost
Ethanol production from lignocellulose via the enzymatic route employs cellulolytic enzymes able to hydrolyse the polysaccharides contained in the pretreated material, aiming to achieve yield and rate as high as possible. Variations in the rate and yield of enzymatic hydrolysis can have a considerable effect on the final volume of 2G ethanol, the capital cost of tanks and the distillation unit, on the energy requirement and, finally, on the 2G MESP (Papers I and III). The “cost of using enzymes” in the process is not simply given by the combination of enzyme activity, dosage and price, but also depends to a large extent on the efficacy of pretreatment making the biomass susceptible to hydrolysis (Galbe and Zacchi 2007). In contrast, the “enzyme cost” (US$/L ethanol) is an operating cost, defined as the weight of enzymes used per litre of 2G ethanol multiplied by the price of the enzyme per unit weight. The enzyme cost can be used as an indicator of the performance of enzymatic hydrolysis, allowing new and more efficient enzymes to be modelled as a reduction in the enzyme cost. New enzymes are assumed to

51
have an enzymatic hydrolytic efficiency (EHE) of 250% higher than the reference enzyme in 2009 (100% EHE). From the cost perspective, this is equivalent to a reduction in the price or dosage of enzymes by 2.5 times.
The enzyme cost per litre of ethanol is regarded as one of the major costs after capital cost, hampering the production of 2G ethanol. The maximum values found in the present work were 37% (Paper I), 32% (Paper II) and 44% (Paper III) of the 2G MESP relative to the cost in 2009. Although it had such a considerable influence on the 2G MESP, doubling the enzyme dosage increased the glucose yield and hydrolysis rate, leading to a reduction in 2G MESP (Paper I). In addition, assuming 250% EHE in a 1G+2G plant producing ethanol at almost theoretical yields (95%), the higher EHE led to a reduction in the enzyme cost from 0.31 US$/L to 0.12 US$/L when only hexose sugars are fermented to ethanol. Co-fermentation of pentoses would lead to a decrease in the enzyme cost per litre to 0.07 US$/L, lowering the share to 16% of the 2G MESP (Paper II).
Beside the reduction in the 2G MESP, a 250% EHE enzyme cocktail could considerably reduce the gap between 1G MESP and 2G MESP due to electricity revenue, and could also improve the profitability of 2G ethanol, although this would also depend on the electricity selling price. The most promising series of cases for feasibility and profitability in Paper II (SHF with pentose co-fermentation, hydrolysis performed at 20% WIS and 96 hours residence time with a new enzyme having 250% EHE), corresponds to the {C5 EtOH, 20% WIS, 96 h, 250% EHE} notation. For this case, at the current electricity selling price (87 US$/MWh), 2G ethanol would be competitive with 1G ethanol if 0.13 US$/L and 0.16 US$/L were provided as subsidies for bagasse and bagasse with addition of leaves, respectively. If 100% EHE enzymes were used, the subsidies would have to be increased by 0.10 US$/L. The use of 250% EHE enzymes was also beneficial for 2G ethanol in relation to the electricity selling price: in the sensitivity analysis, the point of equal MESP was moved from 12 US$/MWh (Figure 3.7a), towards higher (and more realistic) electricity selling prices, indicating that 2G ethanol could compete with 1G ethanol without subsidies at 49 US$/MWh for bagasse only (Figure 3.8a), and at 54 US$/MWh for bagasse supplemented with leaves (Figure 3.8b). Furthermore, the point of equal MESP was also decreased from 46 US$/L (Figure 3.7), previously found for the 100% EHE case, to about 40 US$/L in the 250% EHE case (Figure 3.8), thus broadening the revenue margins. It should be pointed out that at lower electricity selling prices than that of the point of equal MESP, 2G ethanol is cheaper than 1G ethanol.

52
3.5.2 Cost of sugarcane and leaves
The cost of sugarcane is the most relevant cost in 1G ethanol production accounting for at least 60% of the 1G MESP (CGEE 2009; Bajay and Nogueira 2011). Therefore, any variation in sugarcane cost will have a considerable impact on 1G MESP, while the influence on 1G+2G MESP, when 2G ethanol is produced with very high yields (95%), will be lower. Increasing the sugarcane cost by 50% would increase the 1G MESP by 43% and the 1G+2G MESP by 14%, if pentoses are co-fermented, and by 17% if pentoses are instead used for biogas production (Paper II).
In contrast, the cost of leaves represents the 3% of the 1G+2G MESP at most, and the effect of increasing the cost of leaves by 50% was only one-tenth of that when a similar increase was considered for sugarcane. 2G MESP is not directly influenced by the cost of leaves, as well as by the cost of sugarcane (Paper II).
3.5.3 Ethanol and electricity selling prices
The selling prices of electricity and ethanol are market variables that determine when 1G+2G ethanol can be competitive with or outperform 1G ethanol. The {C5 EtOH, 20% WIS, 96 h, 250% EHE} case in Paper II was analysed adopting IRR and NPV as complementary metrics of profitability. Figure 3.12b shows that at an electricity selling price of 87 US$/MWh, 1G ethanol and electricity production can have a better IRR, even at high ethanol selling prices (1 US$/L). Nonetheless, the NPV of 1G ethanol was found to be higher than for 1G+2G ethanol only up to 0.53 US$/L (Figure 3.12a). At higher ethanol selling prices, the 1G ethanol was outweighed in terms of NPV by 1G+2G ethanol due to the larger volume of overall ethanol produced. In Figure 3.9a when the selling price of anhydrous ethanol was fixed at 0.60 US$/L, which was the average price in the State of Sao Paulo between 2001 and 2011, 1G+2G ethanol with the addition of leaves was the most profitable in terms of NPV. In contrast, in Figure 3.9b, 1G ethanol was the most profitable in terms of IRR at electricity selling prices above 55 US$/MWh (Paper II).

53
Figure 3.12 - Effect of ethanol selling price (wholesale) on NPV and IRR for the {C5 EtOH, 20% WIS, 96 h, 250% EHE} case. Addition of leaves to bagasse and bagasse only are the two
feedstock used in evaluating the 1G+2G ethanol and 1G ethanol profitability. (Paper II)
3.6 Rank of 2G MESPs and 1G+2G MESPs by combining the production factors
The synergies arising from the combination of process options (pentose co-fermentation vs. biogas production, addition of leaves) and process conditions (WIS, residence time) can be seen in Figures 3.13 and 3.14, where the cases at 250% EHE from Paper II are presented in decreasing order in terms of 2G MESP and the 1G+2G MESP. These results were obtained for theoretical cases discussed in Paper II, in which the 1G and 2G processes were integrated in the distillation unit, and the SHF configuration was used.
0
200
400
600
800
1000
1200
1400
1600
0.2 0.4 0.6 0.8 1
Net
pre
sent
valu
e, m
illio
n US
$
Wholesale ethanol price, US$/L
87 US$/MWh
a)
0%
5%
10%
15%
20%
25%
30%
35%
40%
0.2 0.4 0.6 0.8 1
Inte
rnal
rate
of r
etur
n, %
Wholesale ethanol price, US$/L
87 US$/MWh
b)
1G+2G {Bagasse}1G {Bagasse} 1G {Bagasse+Leaves} 1G+2G {Bagasse+Leaves}

54
Figure 3.14 - 2G MESP for the 250% cases from Paper II, considering residence time (48h, 96h), hexose fermentation (C6) or pentose co-fermentation (C5+C6), bagasse feed(B) or
bagasse with addition of leaves (B+L), and WIS loadings (10%, 20%, 30%).
0.00 0.20 0.40 0.60 0.80 1.00
96h C6 B 10%WIS
96h C6 B+L 10%WIS
48h C6 B+L 10%WIS
48h C6 B 10%WIS
96h C6 B 20%WIS
96h C6 B+L 20%WIS
96h C6 B 30%WIS
96h C6 B+L 30%WIS
48h C6 B+L 20%WIS
48h C6 B 20%WIS
48h C6 B+L 30%WIS
48h C6 B 30%WIS
96h C5+C6 B+L 10%WIS
96h C5+C6 B 10%WIS
96h C5+C6 B 20%WIS
96h C5+C6 B+L 20%WIS
48h C5+C6 B+L 10%WIS
48h C5+C6 B 10%WIS
96h C5+C6 B+L 30%WIS
96h C5+C6 B 30%WIS
48h C5+C6 B 20%WIS
48h C5+C6 B+L 20%WIS
48h C5+C6 B+L 30%WIS
48h C5+C6 B 30%WIS Sugarcane
Leaves
Enzymes
Acid
Base
Water consumption
Labor, Maintenance,InsuranceNet electricity/opportunity costVinasse sales
Capital Cost

55
Figure 3.14 - 1G+2G MESP for the 250% cases from Paper II, considering residence time (48h, 96h), hexose fermentation (C6) or pentose co-fermentation (C5+C6), bagasse feed(B) or
bagasse with addition of leaves (B+L), and WIS loadings (10%, 20%, 30%).
-0.10 0.10 0.30 0.50 0.70 0.90
96h C6 B+L 10%WIS
96h C6 B 10%WIS
48h C6 B+L 10%WIS
48h C6 B 10%WIS
96h C6 B+L 20%WIS
96h C6 B 20%WIS
96h C6 B+L 30%WIS
48h C6 B+L 20%WIS
96h C6 B 30%WIS
48h C6 B+L 30%WIS
48h C6 B 20%WIS
48h C6 B 30%WIS
96h C5+C6 B+L 10%WIS
96h C5+C6 B 10%WIS
96h C5+C6 B 20%WIS
48h C5+C6 B 10%WIS
96h C5+C6 B+L 20%WIS
48h C5+C6 B+L 10%WIS
96h C5+C6 B 30%WIS
48h C5+C6 B 20%WIS
96h C5+C6 B+L 30%WIS
48h C5+C6 B 30%WIS
48h C5+C6 B+L 20%WIS
48h C5+C6 B+L 30%WISSugarcane
Leaves
Enzymes
Acid
Base
Water consumption
Labor, Maintenance,InsuranceNet electricity/opportunity costVinasse sales
Capital Cost

56

57
4 Conclusions and future work
The aim of the research described in this thesis was to find ways of improving the technical and economic feasibility of a biorefinery producing 2G ethanol from bagasse and leaves. A comprehensive study of the most important factors in the 2G ethanol process was performed considering design options, production and market factors in Brazil. Their influence on the production process, cost and profitability was highlighted by techno-economical evaluations.
The following general and specific conclusions were drawn from the results presented in this thesis.
4.1 General conclusions The production cost for 2G ethanol (expressed in terms of 2G MESP)
was considerably reduced by synergies resulting from the combination of process design, production and market factors.
The total volume of 2G ethanol and the volume produced per ton of lignocellulosic material were the primary factors influencing the 2G MESP and the profitability.
Without subsidies, 2G ethanol could not reach the production cost of 1G ethanol (1G MESP) under the conditions investigated in the Brazilian context. However, 2G ethanol could be cheaper than 1G ethanol if the selling price were lower for electricity and higher for ethanol.
The overall 1G+2G ethanol produced could be more profitable in terms of NPV than 1G ethanol, although the 1G+2G MESP was higher.

58
4.2 Specific conclusions from techno-economic evaluations
Minimization of the energy demand was very important for the combined 1G and 2G ethanol process. As a result, bagasse could be used entirely for 2G ethanol production enhancing the yield of ethanol per ton-SC, more steam was available for electricity production increasing the surplus that could be sold, and the 2G MESP was ultimately lowered. This was achieved by:
o integration of the heat exchanger networks of the 1G and 2G ethanol processes,
o thermal integration of the distillation unit,
o use of a single unit for the distillation of the fermented broths from the 1G and 2G processes,
o use of more efficient equipment, such as a steam dryer and five-effect evaporation.
Pentose co-fermentation to produce ethanol could be more profitable than the production of electricity from the biogas obtained by the anaerobic digestion of pentoses. Co-fermentation could increase the 2G ethanol production by 80% and reduced the 2G MESP by 42%.
Novel enzymes with 250% higher hydrolytic efficiency (or 2.5 times cheaper) than the 2009 reference enzymes, could significantly decrease the 2G MESP and improve the competitiveness of 2G ethanol compared with electricity production from 1G ethanol. The point of equal MESP, where 2G ethanol has the same cost of 1G ethanol, was found at the electricity price of 0.54 US$/MWh. At lower electricity prices 2G ethanol would be cheaper than 1G ethanol.
WIS and residence times for hydrolysis and fermentation had a relevant but smaller influence than 250% more efficient enzymes on the 2G MESP.
The addition of leaves was crucial in increasing the 1G+2G ethanol profitability in terms of NPV, although it did not reduce the 2G MESP.

59
The cost of sugarcane was relevant for 1G+2G ethanol production, accounting for 30% (on average) of the 1G+2G MESP, while the cost of leaves only for 3%.
The capital cost per litre of ethanol for the 2G process varied from 0.15 to 0.56 US$/L depending primarily on the volume of 2G ethanol produced, and secondly on the total investment cost.
The marginal cost was a useful concept in simultaneously analysing the economic feasibility of several strategies for improving the yield.
The ethanol yield from hydrolysis and fermentation was a key factor in determining the trade-offs with the processing costs. The following experimental results were obtained by strategies influencing the ethanol yield and could make it possible to achieve a reduction of 2G MESP:
o doubling the enzyme dosage increased the yield in SHF,
o longer hydrolysis and fermentation time increased the yield in SHF and tSHF,
o high WIS decreased the yield in tSHF.
Varying the electricity and ethanol selling prices highlighted conditions where 1G+2G ethanol could be more profitable than 1G in terms of IRR and NPV.
The most promising configuration for 2G ethanol production in terms of technical and economic feasibility identified from the screening of SHF theoretical SHF cases was characterized by the enzymatic hydrolysis of 20% WIS for 96 hours using a 250% more efficient enzyme followed by pentose co-fermentation.

60
4.3 Specific conclusions from experiments tSHF of bagasse at 10% WIS outperformed SSF in terms of overall
ethanol yield, and volumetric and specific productivity. As a result, the 2G MESP was lower for tSHF.
Experiments using tSHF showed that increasing the WIS from 10% to 20% led to a greater reduction in 2G MESP than recirculating the fermented liquid and increasing the fermentation time, in spite of the lower overall ethanol productivity and yield. At 20% WIS, a glucose concentration of above 100 g/L was obtained after enzymatic hydrolysis, showing that end-product inhibition was not the limiting factor for that enzyme cocktail.
4.4 Future work The versatility of the sugar platform, combined with 1G+2G ethanol production offers opportunities for the integration with new processes and feedstock, in order to increase the ethanol production and/or to obtain valuable products. Techno-economic studies considering these new possibilities of integration can help in designing profitable processes. For instance, other feedstocks could be processed in a 1G+2G ethanol plant outside the sugarcane crushing season, reducing the contribution of capital cost to the production cost. New processing pathways for the production of building blocks for chemicals and drop-in biofuels can be included in the 1G+2G ethanol plant to take advantage of the side-streams of the process, creating synergies. In the 1G+2G ethanol plant lignin was considered only for combustion purposes, reducing its potential as a source of building blocks for industrial applications.
Experimental results using tSHF showed that after 48-hours of enzymatic hydrolysis the ethanol yield from glucose was about 70%, and that only a negligible amount of glucan was hydrolysed during fermentation for 48 hours. Thus, longer enzymatic hydrolysis should be performed to investigate whether additional measures must be taken to enhance cellulose hydrolysis. SSF may still be a viable option if fermenting microorganisms, that have a temperature and pH optimum close to the enzymatic hydrolysis optimum, could be engineered. Given its importance for process economics, pentose co-fermentation could be investigated in the three fermentation configurations mentioned above, and also integrated with sugarcane juice fermentation. The feasibility of SSF and tSHF should be re-evaluated and compared to SHF, also to investigate the possibility of yeast recycling.

61
References
Alfani F, Gallifuoco A, Saporosi A, Spera A, Cantarella M (2000) Comparison of SHF and SSF processes for the bioconversion of steam-explode wheat straw. Journal of Industrial Microbiology and Biotechnology 25 (4):184-192
Alriksson B, Cavka A, Jönsson LJ (2011) Improving the fermentability of enzymatic hydrolysates of lignocellulose through chemical in-situ detoxification with reducing agents. Bioresource Technology 102 (2):1254-1263
Alves dos Santos JR, Souto-Maior AM, Gouveia ER, Martín C (2010) Comparison of shf and ssf processes from sugar cane bagasse for ethanol production by Saccharomyces Cerevisiae. Quimica Nova 33 (4):904-908
Alvira P, Moreno AD, Ibarra D, Sáez F, Ballesteros M (2013) Improving the fermentation performance of saccharomyces cerevisiae by laccase during ethanol production from steam-exploded wheat straw at high-substrate loadings. Biotechnology Progress 29 (1):74-82
Anastas PT, Warner JC (1998) Green chemistry: theory and practice. Oxford University Press, New York
Azar C, Lindgren K, Larson E, Möllersten K (2006) Carbon capture and storage from fossil fuels and biomass - Costs and potential role in stabilizing the atmosphere. Climatic Change 74 (1-3):47-79
Bajay SVN, Nogueira L.A.H., de Sousa F.J.R. (2011) Ethanol in the Brazilian energy matrix. In: Unica (ed) Ethanol and bioelectricity: sugarcane in the future energy matrix. Unica, Sao Paulo, pp 260-308
Balan V, Chiaramonti D, Kumar S (2013) Review of US and EU initiatives toward development, demonstration, and commercialization of lignocellulosic biofuels. Biofuels, Bioproducts and Biorefining 7 (6):732-759. doi:10.1002/bbb.1436
Barakat A, Monlau F, Steyer JP, Carrere H (2012) Effect of lignin-derived and furan compounds found in lignocellulosic hydrolysates on biomethane production. Bioresource Technology 104:90-99
Barta Z, Reczey K, Zacchi G (2010) Techno-economic evaluation of stillage treatment with anaerobic digestion in a softwood-to-ethanol process. Biotechnology for Biofuels 3 (1):21
Basso LC, De Amorim HV, De Oliveira AJ, Lopes ML (2008) Yeast selection for fuel ethanol production in Brazil. FEMS Yeast Research 8 (7):1155-1163
Berlin A, Gilkes N, Kilburn D, Bura R, Markov A, Skomarovsky A, Okunev O, Gusakov A, Maximenko V, Gregg D, Sinitsyn A, Saddler J (2005) Evaluation of novel fungal cellulase preparations for ability to hydrolyze softwood substrates – evidence for the role of accessory enzymes. Enzyme and Microbial Technology 37 (2):175-184. doi:http://dx.doi.org/10.1016/j.enzmictec.2005.01.039
62
Biermann CJ, Schultz TP, McGinnis GD (1984) Rapid steam hydrolysis/ extraction of mixed hardwoods as a biomass pretreatment. Journal of Wood Chemistry and Technology 4 (1):111-128
BIOREF-INTEG (2010) Development of advanced biorefinery schemes to be integrated into existing industrial (fuel producing) complexes. Final report. Available at www.bioref-integ.eu/fileadmin/biorefinteg /user/documents /Final_Report.pdf
Bloomberg (2013) Bioenergy - White paper. Mind the gap: Brazil's looming transport fuel shortage. Bloomberg New Energy Finance
Bozell JJ, Petersen GR (2010) Technology development for the production of biobased products from biorefinery carbohydrates - The US Department of Energy's "top 10" revisited. Green Chemistry 12 (4):539-554
Brownell HH, Saddler JN (1987) Steam pretreatment of lignocellulosic material for enhanced enzymatic hydrolysis. Biotechnology and Bioengineering 29 (2):228-235
Brownell HH, Yu EKC, Saddler JN (1986) Steam-explosion pretreatment of wood: effect of chip size, acid, moisture content and pressure drop. Biotechnology and Bioengineering 28 (6):792-801
Caldema (2014) Steam boilers monodrum -AMD-75-7GI 100 kgf/cm² 530º C 225 t/h. http://www.caldema.com.br/index_portugues_1024.html. Accessed 2014-08-24
Camargo CA (1990) Conservação de energia na indústria do açúcar e do álcool. Manual de reconmendaçoes. Istituto de Pesquisa Tecnologica, São Paulo
Camhi JD (1979) Tratamento do vinhoto, subproduto da destilação de álcool. Brazil Açucareiro 94 (1):18-23
CaneBioFuel (2011) CaneBioFuel - Residues analysis WP5. http://www.canebiofuel.org/files /DeliveryReport5.1.pdf.
Cannella D, Jørgensen H (2013) Do new cellulolytic enzyme preparations affect the industrial strategies for high solids lignocellulosic ethanol production? Biotechnology and Bioengineering 111 (1):59-68. doi:10.1002/bit.25098
Cardona CA, Quintero JA, Paz IC (2010) Production of bioethanol from sugarcane bagasse: Status and perspectives. Bioresource Technology 101 (13):4754-4766
CGEE (2009) Bioetanol combustível: uma oportunidade para o Brasil. CGEE, Brasilia Christofoletti CA, Escher JP, Correia JE, Marinho JFU, Fontanetti CS (2013)
Sugarcane vinasse: Environmental implications of its use. Waste Management 33 (12):2752-2761
Cok B, Tsiropoulos I, Roes AL, Patel MK (2014) Succinic acid production derived from carbohydrates: An energy and greenhouse gas assessment of a platform chemical toward a bio-based economy. Biofuels, Bioproducts and Biorefining 8 (1):16-29
Cortez LAB, Magalhães PSG, Happi J (1992) Principais subprodutos da agroindústria canavieira e sua valorização. Revista Brasileira de Energia 2 (2)
Decree no.6961/2009 Decreto n. 6961 de 17 de setembro de 2009. Aprova o zoneamento agroecológico da cana-de-açúcar e determina ao Conselho

63
Monetário Nacional o estabelecimento de normas para as operações de financiamento ao setor sucroalcooleiro, nos termos do zoneamento. Presidencia da Republica, Brazil
Decree no. 2.661/1998 Decreto Nº 2.661/1998 Regulamenta o parágrafo único do art. 27 da Lei nº 4.771, de 15 de setembro de 1965 (código florestal), mediante o estabelecimento de normas de precaução relativas ao emprego do fogo em práticas agropastoris e florestais, e dá outras providências. Presidência da República. Brazil
Dedini (2014) Steam boiler AT-single drum 120kg/cm2g 540°C 400t/h. http://www.codistil.com.br/index.php?option=com_docman&task=doc_download&gid=79&Itemid=40. Accessed 2014-08-24
Dekker RFH, Wallis AFA (1983) Enzymatic saccharification of sugarcane bagasse pretreated by autohydrolysis -steam. Biotechnology and Bioengineering 25 (12):3027-3048
Deluga GA, Salge JR, Schmidt LD, Verykios XE (2004) Renewable Hydrogen from Ethanol by Autothermal Reforming. Science 303 (5660):993-997
Dias MOS, Cunha MP, Jesus CDF, Rocha GJM, Pradella JGC, Rossell CEV, Maciel Filho R, Bonomi A (2011a) Second generation ethanol in Brazil: Can it compete with electricity production? Bioresource Technology 102 (19):8964-8971
Dias MOS, Ensinas AV, Nebra SA, Maciel Filho R, Rossell CEV, Maciel MRW (2009a) Production of bioethanol and other bio-based materials from sugarcane bagasse: Integration to conventional bioethanol production process. Chemical Engineering Research and Design 87 (9):1206-1216. doi:10.1016/j.cherd.2009.06.020
Dias MOS, Junqueira TL, Cavalett O, Cunha MP, Jesus CDF, Mantelatto PE, Rossell CEV, Maciel Filho R, Bonomi A (2013) Cogeneration in integrated first and second generation ethanol from sugarcane. Chemical Engineering Research and Design 91 (8):1411-1417
Dias MOS, Junqueira TL, Filho RM, Maciel MRW, Rossell CEV, Atala DIP (2009b) Optimization of bioethanol distillation process evaluation of different configurations of the fermentation process. Vol 27, pp 1893–1898.
Dias MOS, Modesto M, Ensinas AV, Nebra SA, Filho RM, Rossell CEV (2011b) Improving bioethanol production from sugarcane: Evaluation of distillation, thermal integration and cogeneration systems. Energy 36 (6):3691-3703
Diedericks D, van Rensburg E, Görgens JF (2013) Enhancing sugar recovery from sugarcane bagasse by kinetic analysis of a two-step dilute acid pretreatment process. Biomass and Bioenergy. 57 (0):149-160. doi:http://dx.doi.org/10.1016/ j.biombioe.2013.07.00
Directive 2009/28/EC - Directive 2009/28/EC of the European Parliament and of the Council of 23 April 2009 on the Promotion of the Use of Energy from Renewable Sources. Brulssels
Directive 2009/30/EC - Directive 2009/30/EC of the European Parliament and of the Council of 23 April 2009 amending Directive 98/70/EC as regards the specification of petrol, diesel and gas-oil and introducing a mechanism to monitor and reduce greenhouse gas emissions and amending Council Directive

64
1999/32/EC as regards the specification of fuel used by inland waterway vessels and repealing Directive 93/12/EEC. Brussels
EISA (2007) Energy Independence and Security Act of 2007. The Senate and House of Representatives of the United States of America in Congress. Washington, DC
Ensinas AV, Nebra SA, Lozano MA, Serra LM (2007) Analysis of process steam demand reduction and electricity generation in sugar and ethanol production from sugarcane. Energy Conversion and Management 48 (11):2978-2987
Ensinas AVA, Arnao J. H. S., Nebra S. A. (2010) Increasing energetic efficiency in sugar, ethanol, and electricity producing plants. In: Cortez (ed) Sugarcane bioethanol: R&D for productivity and sustainability. 1st edn. Editora Edgard Blucher Ltda, Sao Paulo, pp 583-600
ePURE (2014) State of the industry report 2014. Renewable ethanol: driving jobs, growth and innovation throughout Europe. European Renewable Ethanol
Ewanick S, Bura R (2011) The effect of biomass moisture content on bioethanol yields from steam pretreated switchgrass and sugarcane bagasse. Bioresource Technology 102 (3):2651-2658. doi:10.1016/j.biortech.2010.10.117
FAO (2011) The state of the world’s land and water resources for food and agriculture (SOLAW) – Managing systems at risk. Food and Agriculture Organization of the United Nations. Earthscan, Abingdon
FAO (2013) FAOSTAT. Food and Agriculture Organization of the United Nations. http://faostat.fao.org/
Ferreira-Leitão V, Perrone CC, Rodrigues J, Franke APM, MacRelli S, Zacchi G (2010) An approach to the utilisation of CO2 as impregnating agent in steam pretreatment of sugar cane bagasse and leaves for ethanol production. Biotechnology for Biofuels 3 (1):7
Forsberg Z, Vaaje-kolstad G, Westereng B, Bunsæ AC, Stenstrøm Y, Mackenzie A, Sørlie M, Horn SJ, Eijsink VGH (2011) Cleavage of cellulose by a cbm33 protein. Protein Science 20 (9):1479-1483
Franco HCJ, Magalhães PSG, Cavalett O, Cardoso TF, Braunbeck OA, Bonomi A, Trivelin PCO How much trash to removal from sugarcane field to produce bioenergy? In: Brazilian BioEnergy Science and Technology, Campos do Jordão, 2011.
Galbe M, Zacchi G (2007) Pretreatment of lignocellulosic materials for efficient bioethanol production. In: Olsson L (ed) Biofuels, vol 108. Advances in Biochemical Engineering/Biotechnology. Springer Berlin Heidelberg, pp 41-65. doi:10.1007/10_2007_070
Galbe M, Zacchi G (2012) Pretreatment: The key to efficient utilization of lignocellulosic materials. Biomass and Bioenergy 46:70-78
Gauss WF, Suzuki S, Takagi M (1976) Manufacture of alcohol from cellulosic materials using plural ferments. Volume 3990944. Issue 610731 Edited by: Office USPT. USA , Bio Research Center Company Limited; 1976.,
Godoy A, Amorim HV, Lopes ML, Oliveira AJ (2008) Continuous and batch fermentation processes: Advantages and disadvantages of these processes in the Brazilian ethanol production. International Sugar Journal 110 (1311):175-181

65
Goldemberg J, Nigro FEB, Coelho ST (2008) Bioenergia no Estado de São Paulo: Situação atual, perspectivas, barreiras e propostas. Imprensa Oficial do Estado de São Paulo, São Paulo
Grähs LE (1976) Displacement Washing of Packed Beds of Cellulose Fibers, part 1. A Comparison of the Behaviour of Sodium and Lignin. Swed Pap J 4 (79):123-128
Hahn-Hägerdal B, Jeppsson H, Skoog K, Prior BA (1994) Biochemistry and physiology of xylose fermentation by yeasts. Enzyme and Microbial Technology 16 (11):933-943
Hall M, Bansal P, Lee JH, Realff MJ, Bommarius AS (2011) Biological pretreatment of cellulose: Enhancing enzymatic hydrolysis rate using cellulose-binding domains from cellulases. Bioresource Technology 102 (3):2910-2915
Harris PV, Welner D, McFarland KC, Re E, Navarro Poulsen JC, Brown K, Salbo R, Ding H, Vlasenko E, Merino S, Xu F, Cherry J, Larsen S, Lo Leggio L (2010) Stimulation of lignocellulosic biomass hydrolysis by proteins of glycoside hydrolase family 61: Structure and function of a large, enigmatic family. Biochemistry 49 (15):3305-3316
He L, Terashima N (1990) Formation and structure of lignin in monocotyledons. III. Heterogeneity of sugarcane (Saccharum officinarum L.) lignin with respect to the composition of structural units in different morphological regions. Journal of Wood Chemistry and Technology 10 (4):435-459
Horn SJ, Vaaje-Kolstad G, Westereng B, Eijsink VGH (2012) Novel enzymes for the degradation of cellulose. Biotechnology for Biofuels 5 (1):45
Hoyer K, Galbe M, Zacchi G (2009) Production of fuel ethanol from softwood by simultaneous saccharification and fermentation at high dry matter content. Journal of Chemical Technology and Biotechnology 84 (4):570-577
Hoyer K, Galbe M, Zacchi G (2013) The effect of prehydrolysis and improved mixing on high-solids batch simultaneous saccharification and fermentation of spruce to ethanol. Process Biochemistry 48 (2):289-293
IEA (2012) World energy outlook 2012. International Energy Agency, IEA Publications, Paris
IEA Task42 (2008) Minutes of the third Task meeting. International Energy Agency - Bioenergy Task 42 on Biorefineries
Ingledew WM (2003) Continuos fermentation in the alcohol industry: How does the technology affect the yeast? In: Jacques, Lyons, Kelsall (eds) The Alcohol Textbook, 4th Edition. pp 135-143
IPCC (2012) Managing the Risks of Extreme Events and Disasters to Advance Climate Change Adaptation. A Special Report of Working Groups I and II of the Intergovernmental Panel on Climate Change. Intergovernmental Panel on Climate Change, Cambridge University Press, New York
IPCC (2013) Climate Change 2013: The Physical Science Basis. Contribution of Working Group I to the Fifth Assessment Report of the Intergovernmental Panel on Climate Change. Intergovernmental Panel on Climate Change, Cambridge University Press, New York
Jin M, Gunawan C, Uppugundla N, Balan V, Dale BE (2012) A novel integrated biological process for cellulosic ethanol production featuring high ethanol

66
productivity, enzyme recycling and yeast cells reuse. Energy and Environmental Science 5 (5):7168-7175
Kamarudin MZF, Kamarudin SK, Masdar MS, Daud WRW (2013) Review: Direct ethanol fuel cells. International Journal of Hydrogen Energy 38 (22):9438-9453
Kavanagh K, Whittaker PA (1994) Application of the melle-boinot process to the fermentation of xylose by Pachysolen tannophilus. Applied Microbiology and Biotechnology 42 (1):28-31
Kletz T (1978) What you don’t have can’t leak. Chemistry & Industry, 6 May 1978 pp287-292
Klinke HB, Thomsen AB, Ahring BK (2004) Inhibition of ethanol-producing yeast and bacteria by degradation products produced during pre-treatment of biomass. Applied Microbiology and Biotechnology 66 (1):10-26
Krishnan C, da Costa Sousa L, Jin M, Chang L, Dale BE, Balan V (2010) Alkali-based AFEX pretreatment for the conversion of sugarcane bagasse and cane leaf residues to ethanol. Biotechnology and Bioengineering 107 (3):441-450
Kristensen JB, Felby C, Jørgensen H (2009) Yield-determining factors in high-solids enzymatic hydrolysis of lignocellulose. Biotechnology for Biofuels 2 (1):11
Laser M, Schulman D, Allen SG, Lichwa J, Antal Jr MJ, Lynd LR (2002) A comparison of liquid hot water and steam pretreatments of sugar cane bagasse for bioconversion to ethanol. Bioresource Technology 81 (1):33-44. doi:10.1016/s0960-8524(01)00103-1
Levasseur A, Drula E, Lombard V, Coutinho PM, Henrissat B (2013) Expansion of the enzymatic repertoire of the CAZy database to integrate auxiliary redox enzymes. Biotechnology for Biofuels 6 (1):41
Li J, Henriksson G, Gellerstedt G (2007) Lignin depolymerization/repolymerization and its critical role for delignification of aspen wood by steam explosion. Bioresource Technology 98 (16):3061-3068
Lucas JJ, Cortez LAB, Silva A (1997) Biodigestão. In: Cortez LAB (ed) Tecnologias de conversão energética de biomassa. vol Sistema energeticos II. Editora Universidade do Amazonas, Manaus, AM, p 527
Lynd LR, Elander RT, Wyman CE (1996) Likely features and costs of mature biomass ethanol technology. Applied Biochemistry and Biotechnology - Part A Enzyme Engineering and Biotechnology 57-58:741-761
Macrelli S (2007) Produzione di bioetanolo da scarti lignocellulosici della canna da zucchero: condizioni di saccarificazione e fermentazione simultanee (SSF) e aspetti ambientali del processo. Master thesis. 17-12-2007 Alma Mater Studiorum - Bologna University, Bologna
Manechini C, Ricci AJ, Donzelli JL (2005) Benefits and problems of trash left in the field. In: Hassuani SJ, Leal MRLV, Macedo IC (eds) Biomass power generation -Sugar cane bagasse and trash. PNUD - Programa das Nações Unidas para o Desenvolvimento / CTC - Centro de Tecnologia Canavieira, Piracicaba, Brazil,
MAPA (2009) Dados da agroenergia estão disponíveis no portal do Ministério da Agricultura . MAPA. 14.8.2009 http://www.agricultura.gov.br/comunicacao/noticias/2009/08/especial-dados-da-agroenergia-estao-disponiveis-no-portal-do-ministerio-da-agricultura.

67
MAPA (2013) Projeções do Agronegocio - Brazil 2012/13 a 2022/23. 4th edition edn. Ministério da Agricultura, Pecuária e Abastecimento, Brasilia
MAPA (2014) Relatório da MP que aumenta percentual de biodiesel e de etanol é aprovado. http://www.agricultura.gov.br/comunicacao/noticias/2014/08/relatorio-da-mp-que-aumenta-percentual-de-biodiesel-e-de-etanol-e-aprovado. Accessed 2014-08-26
Martín C, Galbe M, Nilvebrant NO, Jönsson LJ (2002) Comparison of the fermentability of enzymatic hydrolyzates of sugarcane bagasse pretreated by steam explosion using different impregnating agents. Applied Biochemistry and Biotechnology - Part A Enzyme Engineering and Biotechnology 98-100:699-716
Martín C, Marcet M, Thomsen AB (2008) Comparison between wet oxidation and steam explosion as pretreatment methods for enzymatic hydrolysis of sugarcane bagasse. BioResources 3 (3):670-683
McMillan JD (1994) Pretreatment of lignocellulosic biomass. In: Himmel ME, Baker JO, Overend RP (eds) Enzymatic Conversion of Biomass for Fuels Production. American Chemical Society, Washington, DC, pp pp. 292–324
Meadows DH, Meadows DL, Randers J, Behrens WWI (1972) The limits to growth. Merino ST, Cherry J (2007) Progress and challenges in enzyme development for
biomass utilization. vol 108:95-120 Mesa L, González E, Romero I, Ruiz E, Cara C, Castro E (2011) Comparison of
process configurations for ethanol production from two-step pretreated sugarcane bagasse. Chemical Engineering Journal 175 (1):185-191
Mosier N, Wyman C, Dale B, Elander R, Lee YY, Holtzapple M, Ladisch M (2005) Features of promising technologies for pretreatment of lignocellulosic biomass. Bioresource Technology 96 (6):673-686
Neto MAT (2005) Characterization of sugar cane trash and bagasse. In: Hassuani SJ, Leal MRLV, Macedo IC (eds) Biomass power generation -Sugar cane bagasse and trash. PNUD - Programa das Nações Unidas para o Desenvolvimento / CTC - Centro de Tecnologia Canavieira, Piracicaba, Brazil,
Olofsson K, Bertilsson M, Lidén G (2008) A short review on SSF - An interesting process option for ethanol production from lignocellulosic feedstocks. Biotechnology for Biofuels 1:7
Olsson L, Soerensen HR, Dam BP, Christensen H, Krogh KM, Meyer AS (2006) Separate and simultaneous enzymatic hydrolysis and fermentation of wheat hemicellulose with recombinant xylose utilizing Saccharomyces cerevisiae. Applied Biochemistry and Biotechnology 129 (1-3):117-129
Paes LAD, de Oliveira MA (2005) Potential trash biomass of the sugar cane plant. In: Hassuani SJ, Leal MRLV, Macedo IC (eds) Biomass power generation -Sugar cane bagasse and trash. PNUD - Programa das Nações Unidas para o Desenvolvimento / CTC - Centro de Tecnologia Canavieira, Piracicaba, Brazil,
Palmqvist B, Lidén G (2012) Torque measurements reveal large process differences between materials during high solid enzymatic hydrolysis of pretreated lignocellulose. Biotechnology for Biofuels 5 (1):57

68
Palmqvist B, Lidén G (2014) Combining the effects of process design and pH for improved xylose conversion in high solid ethanol production from Arundo donax. AMB Express 4 (1)
Palmqvist E, Hahn-Hägerdal B (2000) Fermentation of lignocellulosic hydrolysates. II: Inhibitors and mechanisms of inhibition. Bioresource Technology 74 (1):25-33
Pedersen M, Meyer AS (2010) Lignocellulose pretreatment severity - relating pH to biomatrix opening. New Biotechnology 27 (6):739-750
Pereira LG, Dias MOS, Junqueira TL, Pavanello LG, Chagas MF, Cavalett O, Maciel Filho R, Bonomi A (2014) Butanol production in a sugarcane biorefinery using ethanol as feedstock. Part II: Integration to a second generation sugarcane distillery. Chemical Engineering Research and Design 92 (8):1452-1462
Phillips CM, Beeson WT, Cate JH, Marletta MA (2011) Cellobiose dehydrogenase and a copper-dependent polysaccharide monooxygenase potentiate cellulose degradation by Neurospora crassa. ACS chemical biology 6 (12):1399-1406
Quinlan RJ, Sweeney MD, Lo Leggio L, Otten H, Poulsen JCN, Johansen KS, Krogh KBRM, Jørgensen CI, Tovborg M, Anthonsen A, Tryfona T, Walter CP, Dupree P, Xu F, Davies GJ, Walton PH (2011) Insights into the oxidative degradation of cellulose by a copper metalloenzyme that exploits biomass components. Proceedings of the National Academy of Sciences of the United States of America 108 (37):15079-15084
RFA (2014) Ethanol industry outlook - Falling walls & rising tides. Renewable Fuel Association, Available at: http://www.ethanolrfa.org/page/-/rfa-association-site/Resource%20Center/2014%20Ethanol%20Industry%20Outlook.pdf?nocdn=1
Rocha GJM, Martín C, da Silva VFN, Gómez EO, Gonçalves AR (2012) Mass balance of pilot-scale pretreatment of sugarcane bagasse by steam explosion followed by alkaline delignification. Bioresource Technology 111:447-452. doi:10.1016/j.biortech.2012.02.005
Sannigrahi P, Kim DH, Jung S, Ragauskas A (2011) Pseudo-lignin and pretreatment chemistry. Energy and Environmental Science 4 (4):1306-1310
Sassner P, Zacchi G (2008) Integration options for high energy efficiency and improved economics in a wood-to-ethanol process. Biotechnology for Biofuels 1. doi:10.1186/1754-6834-1-4
Seabra JEA, Macedo IC (2011) Comparative analysis for power generation and ethanol production from sugarcane residual biomass in Brazil. Journal Name: Energy Policy; Journal Volume: 39; Journal Issue: 1; Other Information: Elsevier Ltd All rights reserved:page(s) 421-428
SEKAB ED95 reduces emissions from heavy goods transports. http://www.sekab.com/sustainability/work-in-progress/ed95-reduces-emissions-from-heavy-goods-transports. Accessed 2014-08-26
Silva AM (2005) Caracterização da parede celular de Saccharum officinarum L. e Brachiaria decumbens Stapf. Dotourado em Biologia Celular Estrutural, Universidade Estadual de Campinas,
69
Sosa-Arnao JH, Nebra S (2009) Bagasse dryer role in the energy recovery of water tube boilers. Drying Technology 27 (4):587-594. doi:10.1080/07373930802716326
Souza GM, Van Sluys MA (2010) Sugarcane genomics and biotechnology. In: Cortez LAB (ed) Sugarcane Bioethanol for Editora Edgard Blucher Ldta, São Paulo,
State Bill no.11241/2002 Lei Estadual nº 11.241/02 Dispõe sobre a eliminação gradativa da queima da palha da cana-de-açúcar e dá outras providências. Governo do Estado de São Paulo,
State of São Paulo (2007) Protocolo Agroambiental do Estado de São Paulo. Governo do Estado de São Paulo. http://www.ambiente.sp.gov.br/etanolverde/protocolo-agroambiental/o-protocolo/.
Subramani V, Gangwal SK (2008) A review of recent literature to search for an efficient catalytic process for the conversion of syngas to ethanol. Energy and Fuels 22 (2):814-839
Sun JX, Sun XF, Sun RC, Su YQ (2004) Fractional extraction and structural characterization of sugarcane bagasse hemicelluloses. Carbohydrate Polymers 56 (2):195-204
Taherzadeh MJ, Karimi K (2007a) Acid-based hydrolysis processes for ethanol from lignocellulosic materials: A review. BioResources 2 (3):472-499
Taherzadeh MJ, Karimi K (2007b) Enzyme-based hydrolysis processes for ethanol from lignocellulosic materials: A review. BioResources 2 (4):707-738
Tengborg C, Galbe M, Zacchi G (2001) Influence of enzyme loading and physical parameters on the enzymatic hydrolysis of steam-pretreated softwood. Biotechnology Progress 17 (1):110-117
Tomás-Pejó E, Oliva JM, Ballesteros M, Olsson L (2008) Comparison of SHF and SSF processes from steam-exploded wheat straw for ethanol production by xylose-fermenting and robust glucose-fermenting Saccharomyces cerevisiae strains. Biotechnology and Bioengineering 100 (6):1122-1131
UNICA (2014) Final report of 2013/2014 harvest season - South-Central region. Vaaje-Kolstad G, Westereng B, Horn SJ, Liu Z, Zhai H, Sørlie M, Eijsink VGH
(2010) An oxidative enzyme boosting the enzymatic conversion of recalcitrant polysaccharides. Science 330 (6001):219-222
Walker GM (1998) Yeast - Physiology and biotechnology. Wiley, Chichester-UK Vallander L, Eriksson KE (1987) Enzyme recirculation in saccharification of
lignocellulosic materials. Enzyme and Microbial Technology 9 (12):714-720 Van Dyk JS, Pletschke BI (2012) A review of lignocellulose bioconversion using
enzymatic hydrolysis and synergistic cooperation between enzymes-Factors affecting enzymes, conversion and synergy. Biotechnology Advances 30 (6):1458-1480
WCED (1987) Our Common Future. World Commission on Environment and Development, Oxford University Press, pp416
Weiss N, Börjesson J, Pedersen LS, Meyer AS (2013) Enzymatic lignocellulose hydrolysis: Improved cellulase productivity by insoluble solids recycling. Biotechnology for Biofuels 6 (1):5

70
Werpy T, Petersen, G., Aden, A., Bozell, J., Holladay, J., White, J., Manheim, A., (...), Jones, S. (2004) Top Value Added Chemicals from Biomass. Volume 1 - Results of Screening for Potential Candidates from Sugars and Synthesis Gas. U.S. Department of Energy,
Westereng B, Ishida T, Vaaje-Kolstad G, Wu M, Eijsink VGH, Igarashi K, Samejima M, Ståhlberg J, Horn SJ, Sandgren M (2011) The putative endoglucanase pcGH61D from phanerochaete chrysosporium is a metal-dependent oxidative enzyme that cleaves cellulose. PLoS ONE 6 (11)
Wingren A, Galbe M, Zacchi G (2003) Techno-economic evaluation of producing ethanol from softwood: Comparison of SSF and SHF and identification of bottlenecks. Biotechnology Progress 19 (4):1109-1117. doi:10.1021/bp0340180
Wingren A, Galbe M, Zacchi G (2008) Energy considerations for a SSF-based softwood ethanol plant. Bioresource Technology 99 (7):2121-2131. doi:10.1016/j.biortech.2007.05.058
Von Sivers M, Zacchi G (1996) Ethanol from lignocellulosics: A review of the economy. Bioresource Technology 56 (2-3):131-140
Wyman CE (2007) What is (and is not) vital to advancing cellulosic ethanol. Trends in Biotechnology 25 (4):153-157
Zhang YHP, Lynd LR (2004) Toward an aggregated understanding of enzymatic hydrolysis of cellulose: Noncomplexed cellulase systems. Biotechnology and Bioengineering 88 (7):797-824
Zhao X, Zhang L, Liu D (2012) Biomass recalcitrance. Part I: The chemical compositions and physical structures affecting the enzymatic hydrolysis of lignocellulose. Biofuels, Bioproducts and Biorefining 6 (4):465-482
Öhgren K, Bura R, Lesnicki G, Saddler J, Zacchi G (2007) A comparison between simultaneous saccharification and fermentation and separate hydrolysis and fermentation using steam-pretreated corn stover. Process Biochemistry 42 (5):834-839

Printed by Media-Tryck, Lund, Sw
eden
Lund University Doctoral Dissertation 2014
ISBN 978-91-7623-087-9 (print) ISBN 978-91-7623-088-6 (pdf)
Bioethanol from sugarcane is a sustainable alternative to fossil fuels, and the increasing demand for fuel ethanol has prompted stud-ies on the use of the lignocellulosic residues of sugarcane, namely bagasse and leaves, as new feedstock.
This thesis describes various process designs and the economic feasibility of producing sec-ond generation (2G) ethanol from bagasse and leaves in an integra- ted sugarcane biorefinery, where first-generation (1G) ethanol is pro-duced from sugarcane sugar.
Computer simulations, based on Brazilian conditions, have been per-formed to evaluate the influence of several process designs and the main production factors on the 2G ethanol process, in terms of ener-gy efficiency and 2G ethanol production cost. The existing 1G ethanol process and the new 2G ethanol process were combined in a single plant by integration of thermal and material streams, and the resulting synergies could improve the use of feedstock and the economics of the 2G ethanol process. Among the numerous operating conditions investigated for the 2G ethanol process, the series showing the best trade-off between technical and economic feasibility were also test-ed experimentally on laboratory scale, obtaining promising results. In fact, it was possible to achieve high concentrations of 2G ethanol in short time, overcoming the mixing problems. Furthermore, the techno- economic studies contributed to a better understanding of which variables have major influence on 2G ethanol production process, cost and profitability.