Embed Size (px)
DESCRIPTION
Ethanol Fermentation Performance of Grain Sorghums
Citation preview
pubs.acs.org/JAFC Published on Web 08/17/2010 © 2010 American Chemical Society
9556 J. Agric. Food Chem. 2010, 58, 9556–9562
DOI:10.1021/jf101555d
Ethanol Fermentation Performance of Grain Sorghums(Sorghum bicolor) with Modified Endosperm Matrices
XIAORONGWU,† BABITHA JAMPALA,‡ ADRIANAROBBINS,‡ DIRKHAYS,‡ SHUPINGYAN,§
FENG XU,† WILLIAM ROONEY,‡ GARY PETERSON, ) YONG-CHENG SHI,§ AND
DONGHAI WANG*,†
†Department of Biological and Agricultural Engineering, Kansas State University, Manhattan,Kansas 66506, ‡Department of Soil and Crops Science, Texas A&M University, College Station,
Texas 77843, )Texas AgriLife Research & Extension Center, Lubbock, Texas 79403, and §Department ofGrain Science and Industry, Kansas State University, Manhattan, Kansas 66506
We tested 13 sorghum entries (lines and hybrids) with different endosperm matrices for ethanol
production using a laboratory dry grind process. Waxy and heterowaxy samples had the highest
efficiencies. Free amino nitrogen (FAN) contents in sorghum samples were positively related to the
fermentation rate during fermentation (R2 = 0.8618). Dried distiller’s grain with solubles (DDGS) from
different sorghums had significantly different crude protein and crude fat contents. Residual starch
content in DDGS ranged from 0.60% for the most efficient sample to 2.66% for the least efficient
sample. This study showed that the HD lines (TX1, TX3, TX5, TX7, and TX9) with modified endosperm
protein matrix have several attributes desirable for ethanol production: easily pasted starch granules,
significantly higher FAN content in finished mashes, 30-45% faster ethanol fermentation rate during
early stages, and 50-60% higher lysine content in DDGS.
KEYWORDS: Ethanol; fermentation; dry grinding; grain sorghum (Sorghum bicolor); DDGS; endo-sperm matrices
INTRODUCTION
In 2009, approximately 95%of themore than 10billion gallonsof fuel ethanol in the United States was produced from corn,and∼4% was produced from sorghum (1). Annual U.S. ethanolproduction from cereal grains is projected to grow and remainat 15 billion gallons even after lignocellulosic ethanol technologyis fully commercialized, which will consume ∼30% of the U.S.corn crop each year (2). To keep up with such a challenging goal,intensive efforts has been devoted to the development of high-performance corn hybrids, which results in several high-yieldingcorn varieties and hybrids with excellent agronomic traits for fuelethanol production (3, 4) and other industrial uses (5). Sorghumhas been identified as a promising feedstock for bioethanolproduction because of its lower fertilizer requirement, higherwater efficiency, and other favorable agronomic traits (6). Similarresearch efforts have been made in sorghum breeding, but thoseefforts mostly focused on improvement of sorghum food qualityand yield. High-lysine, high-protein-digestibility (HD) sorghumlines have been developed (7-9). Research on the compoundingfactors influencing fuel ethanol production from sorghum hasbeen conducted recently, revealing that genotype or cultivar hasthe most significant effects on ethanol yields. Growing locationsignificantly affected chemical compositions and physical proper-ties of tested sorghum varieties inKansas and Texas, which led tovery different ethanol yields (10, 11).
We have developed several mutant HD sorghum genotypeswith modified endosperm matrices. The original HD lines werederived within a high-lysine sorghum population; additional lineswere developed using pedigree breeding approaches (12). Theincreased protein digestibility of these lines is derived from anincrease inR-kafirin digestibility. TheHD lines are unique in theirprotein body structure; they have abnormal, highly invaginatedkafirin protein bodies. Immunocytochemistry reveals a normaldistribution of R- and β-kafirins but a reduced presence of thehighly folded γ-kafirins in the HD lines (13). Segregated progenywith HD population lack the kafirin protein body matrices thatsurround the starch granules and restrict starch granule swellingand pasting. These genotypes have several benefits. First, thegrain starch swells and pastes more easily at lower tempera-tures (14). Second, the proteins present have improved feed valuewith higher bioavailability and 60%more lysine, similar to high-lysine corn lines (12).
Several approaches have been used to evaluate ethanol fer-mentation performance of a limited number of grain sor-ghums (11, 15, 16), and results may be helpful for sorghumbreeders and the ethanol industry. The goal of this study was todevelop a system approach for breeding sorghum cultivars thatoptimizes the grain’s endosperm matrix for bioethanol conver-sion and grain distillers feed. We generated data that suggest thatthe waxy characteristic individually improves the endospermmatrix for low-energy-input gelatinization, enzymatic hydrolysis,and total ethanol production. Given the favorable low energy forgelatinization characteristic of the HD trait, we reasoned that it,*Corresponding author. Fax: 785-5325825. E-mail: [email protected].
Article J. Agric. Food Chem., Vol. 58, No. 17, 2010 9557
too, would improve ethanol fermentation efficiency of the sor-ghum grain. If true, sorghum cultivars that combine a HD traitwith a high amylopectin (waxy) starch trait would be ideal forbioethanol conversion.
MATERIALS AND METHODS
Thirteen sorghum inbred lines with different endosperm matrices(HD, waxy, or wild types) were planted in the normal cropping seasonin 2008 at the Texas Agrilife Research Farm near College Station, TX.Entries were combine harvested and processed in fall 2008; this grain wasused for the remainder of the experiments. The samples were ground usinga Udy cyclone sample mill with a 0.5 mm screen (UDY Corp., FortCollins,CO) for analysis and the fermentation test. Physical properties andchemical compositions of the sorghum samples are listed in Table 1.
Potassium phosphatemonobasic, magnesium sulfate, dextrose, sodiumacetate, hydrochloric acid, sodium hydroxide, acetic acid, and dimethylsulfoxide (DMSO) were purchased from Fisher Scientific (Fairlawn, NJ).Difco yeast extract and Difco peptone were from Becton-Dickinson(Sparks, MD). Maltose, maltotriose, 4-morpholinepropanesulfonic acid(MOPS), and analytical standard glucose were from Supelco (Bellefonte,PA). Standard reference ethanol (SRM 2899a) was purchased fromNIST(Gaithersburg, MD). All other chemicals were reagent grade or better.
The hydrolyzing enzymes, Liquozyme (a high-temperature R-amylaseproduced by Bacillus licheniformis) and Spirizyme (a glucoamylase pro-duced by Aspergillus niger), were provided by Novozymes (NovozymesNorth America, Inc., Franklinton, NC). The dry alcohol yeast, EthanolRed, was provided by Fermentis in vacuum-packed aluminum foil bags(Lesaffre Yeast Corp., Milwaukee, WI).
Analytical Methods. Free Amino Nitrogen (FAN) Analysis. Freeamino nitrogen content of finished mashes (after liquefaction and beforeadditionof yeast extract, glucoamylase, and inoculation of activated yeast)was determined by following European Brewery Convention method8.8.1 (17). Finished mash samples were diluted by mixing 100 μL of clearsupernatant with 1900 μL of HPLC-grade distilled water in a screw-capped 16 mL test tube before being analyzed.
Total Starch in Original Sorghum Samples and DDGS. Total starchesin sorghum samples and corresponding freeze-dried DDGS were deter-mined by using Megazyme K-TSTA kits with modified DMSO proce-dures (18). Starches in the samples were completely solubilized in DMSOand hydrolyzed in two steps into glucose by using thermostableR-amylase(100 �C, pH 6-6.5) and amyloglucosidase (50 �C, pH 4.5).
Apparent Amylose Content.Apparent amylose content of the sorghumsamples was analyzed colorimetically using the dual wavelengthapproach (19-21). Sorghum flours containing ∼100 mg starch werewetted with 1.0 mL of 95% ethanol and dissolved in 10 mL of 1.0 NNaOH in a 100mLvolumetric flaskwith continuous shaking (120 rpm) ona rotary shaker at room temperature overnight. The clear dissolvedmixture was diluted with distilled water to 100 mL. Two milliliters of
the dissolved sample was transferred into another 100 mL volumetricflask, mixed with ∼50 mL of distilled water, and neutralized with 2.0 mLof 0.1 N HCl. After 2.0 mL of colorant iodine solution (0.2% iodine in0.2% KI solution) was added, the mixture was brought to volume withdistilled water. The mixture was left at room temperature for 30 min forcolor development, and then absorbance values at 510 and 620 nm wereread on a spectrophotometer against distilled water and iodine solutionblanks.
Amino Acid Composition of DDGS. Samples were weighed and thenplaced in about 0.5 mL of 6 N HCl along with the internal standard andhydrolyzed at 110 �C for 20 h. An aliquot, usually 10 or 20 μL, of thatHClwas diluted up to 250 μL with 0.4 M borate buffer to dilute the sampleand raise the pH. After precolumn derivatization with o-phthalaldehyde(OPA) and 9-fluorenylmethyl chloroformate (FMOC), 1 μLof this diluentwas injected into anHPLC systemwith a C18 column (Hypersil AA-ODS,2.1 � 200 mm, 5 μm). Mobile phase A was 20 mM sodium acetate bufferwith 0.018% (v/v) triethylamine, 0.05mMEDTA, and 0.3% tetrahydrofur-an, pHadjusted to 7.2 using acetic acid.Mobile phaseBwas 100mMsodiumacetate:acetonitrile:methanol (20:40:40, v/v). The elution conditions werefrom 100% A to 60% B in 17 min at 0.45 mL/min. Amino acid derivativeswere detectedwith a fluorescent detector at 340/450nm (excitation/emission)for primary amino acids and 266/305 nm for secondary amino acids.Humanserum albumin was used as a control, and norvaline and sarcosine wereused as internal standards.
Methods for analyses of crude protein, lipid, and ash were AOAC990.03, 920.39, and 942.05, respectively. Crude fiber was analyzed by thefilter bag technique using the ANKOM A200 (http://www.ankom.com/media/documents/CrudeFiber_1108_A200.pdf).
Physical Properties of Sorghum Samples. RVA Test. RVA testswere performed on a model S4A RVA analyzer with Thermocline forWindows ver. 3.10 software (Newport Scientific, Warriewood, NSW,Australia) using Standard Procedure 1 (holding at 50 �C for 1min, heatingto 95 at 10 �C/min, holding at 95 �C for 2 min, and cooling to 50 �C).
DSC Analysis. DSC analyses of selected sorghum flour samples wereconducted on a PerkinElmer Diamond DSC by weighing ∼9 mg of flourinto stainless steel pans on a PerkinElmer autobalance (model AD6;PerkinElmer Life and Analytical Sciences, Shelton, CT). The flour wasthen mixed with distilled water to form a slurry with a moisture content of75%. The temperature program was holding at 30 �C for 3 min and thenramping to 180 at 10 �C/min.
Starch Crystallinity of Selected Sorghums Using Wide-Angle X-rayDiffraction (WAXD). Sorghum starch from selected sorghum samples wasprepared by following a laboratory wet milling procedure described byWang and Chung (22). The starches were examined with an AdvancedPolymers Beamline (X27C) in the National Synchrotron Light Source(NSLS) at Brookhaven National Laboratory. Experimental setups at theX27C beamline followed those reported by Chen et al. (23, 24). Thewavelength used was 0.1371 nm, and the sample-to-detector distance was97.33 mm. A 2DMAR-CCD (MARUSA, Inc.) X-ray detector was used
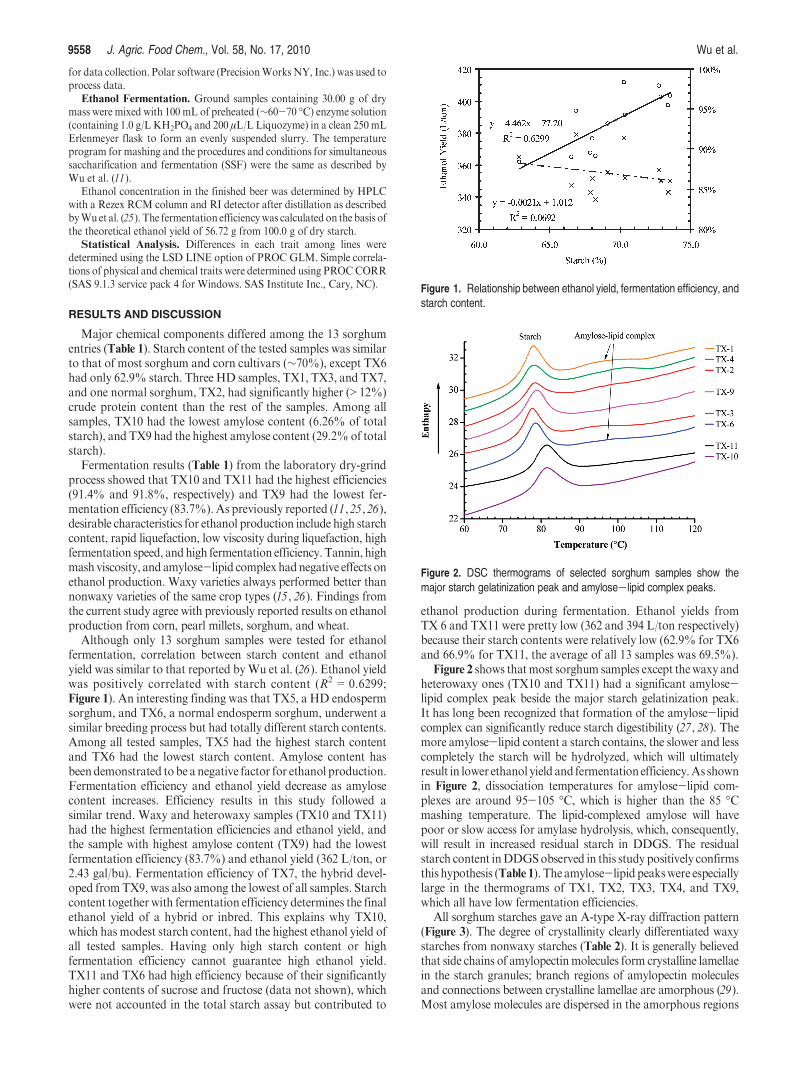
Table 1. Chemical Composition of Texas Sorghum Samples (( SD; %, db)a
efficiency
entry pedigree
endosperm
phenotypeb starch
crude
protein crude fat
crude
fiber ash FAN (mg/L) amylose at 24 h at 72 h
TX 1 P850029 HD 66.6 d 14.47 a 3.89 de 2.80 c 1.89 c 119 b 23.5 73.7 85.5 f
TX 2 BTx635 WT 73.3 a 12.63 c 3.15 h 2.61 de 1.57 ef 44.7 h 27.0 54.5 84.6 g
TX 3 (BTx635*P850029)-CS9-CS1-CS1 HD 67.9 cd 13.17 b 3.78 ef 2.48 e 2.05 b 133 a 24.3 79.5 84.6 g
TX 4 RTx436 WT 72.9 a 10.48 f 3.43 g 1.91 g 1.59 e 78.1 ef 27.5 60.1 86.1 ef
TX 5 (RTx436*P850029)-CS42-CS1-CS1-CS1 HD 73.5 a 11.16 e 2.82 i 2.49 e 1.49 f 64.4 g 24.1 57.6 86.0 ef
TX 6 RTx436*P850029)-CS22-CS1-CS1-CS2 WT 62.9 e 11.75 d 5.52 a 3.69 a 2.55 a 77.8 ef 26.2 68.7 89.0 b
TX 7 (96GCPOB124*P851171)-CS28-CS1-CS1-CS1 HD 68.0 cd 12.64 c 3.78 f 2.69 cd 1.74 d 116 b 25.1 74.2 86.3 cd
TX 8 96GCPOB124 WT 70.4 b 10.35 g 3.34 g 2.70 cd 1.53 ef 72.2 f 24.6 61.4 86.4 de
TX 9 P851171 HD 68.3 bcd 11.22 e 3.15 h 2.32 f 1.35 g 108 c 29.2 76.8 83.7 g
TX 10 ATxARG-1/RTX2907 Waxy 70.3 b 10.38 fg 3.12 h 2.30 f 1.36 g 83.7 e 6.26 62.1 91.4 a
TX 11 ATxARG-1/RTx436 heterowaxy 66.9 d 9.56 h 4.91 b 3.02 b 1.97 bc 102 cd 20.1 66.6 91.8 a
TX 12 ATx2928/RTx436 WT 72.7 a 8.75 i 3.98 d 2.78 c 1.72 d 76.9 ef 26.6 59.8 87.4 c
TX 13 ATx2928/RTx2907 heterowaxy 69.1 bc 9.54 h 4.40 c 3.05 b 1.93 c 97.0 d 20.2 66.7 87.1 d
aMeans in a column with different letters differ (P < 0.05). bHD refers to a high protein digestible and nonwaxy endosperm phenotype;WT refers to a normal nonwaxy, averagedigestible endosperm phenotype; waxy refers to a waxy, average digestible endosperm phenotype; and heterowaxy is grain that segregated for waxy endosperm phenotype withnormal protein digestibility.
9558 J. Agric. Food Chem., Vol. 58, No. 17, 2010 Wu et al.
for data collection. Polar software (PrecisionWorksNY, Inc.) was used toprocess data.
Ethanol Fermentation. Ground samples containing 30.00 g of drymass were mixed with 100 mL of preheated (∼60-70 �C) enzyme solution(containing 1.0 g/L KH2PO4 and 200 μL/L Liquozyme) in a clean 250mLErlenmeyer flask to form an evenly suspended slurry. The temperatureprogram for mashing and the procedures and conditions for simultaneoussaccharification and fermentation (SSF) were the same as described byWu et al. (11).
Ethanol concentration in the finished beer was determined by HPLCwith a Rezex RCM column and RI detector after distillation as describedbyWuet al. (25). The fermentation efficiencywas calculated on the basis ofthe theoretical ethanol yield of 56.72 g from 100.0 g of dry starch.
Statistical Analysis. Differences in each trait among lines weredetermined using the LSD LINE option of PROC GLM. Simple correla-tions of physical and chemical traits were determined using PROCCORR(SAS 9.1.3 service pack 4 for Windows. SAS Institute Inc., Cary, NC).
RESULTS AND DISCUSSION
Major chemical components differed among the 13 sorghumentries (Table 1). Starch content of the tested samples was similarto that of most sorghum and corn cultivars (∼70%), except TX6had only 62.9% starch. Three HD samples, TX1, TX3, and TX7,and one normal sorghum, TX2, had significantly higher (>12%)crude protein content than the rest of the samples. Among allsamples, TX10 had the lowest amylose content (6.26% of totalstarch), and TX9 had the highest amylose content (29.2%of totalstarch).
Fermentation results (Table 1) from the laboratory dry-grindprocess showed that TX10 and TX11 had the highest efficiencies(91.4% and 91.8%, respectively) and TX9 had the lowest fer-mentation efficiency (83.7%). As previously reported (11,25,26),desirable characteristics for ethanol production include high starchcontent, rapid liquefaction, low viscosity during liquefaction, highfermentation speed, andhigh fermentation efficiency. Tannin, highmash viscosity, and amylose-lipid complex hadnegative effects onethanol production. Waxy varieties always performed better thannonwaxy varieties of the same crop types (15, 26). Findings fromthe current study agree with previously reported results on ethanolproduction from corn, pearl millets, sorghum, and wheat.
Although only 13 sorghum samples were tested for ethanolfermentation, correlation between starch content and ethanolyield was similar to that reported byWu et al. (26). Ethanol yieldwas positively correlated with starch content (R2= 0.6299;Figure 1). An interesting finding was that TX5, a HD endospermsorghum, and TX6, a normal endosperm sorghum, underwent asimilar breeding process but had totally different starch contents.Among all tested samples, TX5 had the highest starch contentand TX6 had the lowest starch content. Amylose content hasbeendemonstrated to be a negative factor for ethanol production.Fermentation efficiency and ethanol yield decrease as amylosecontent increases. Efficiency results in this study followed asimilar trend. Waxy and heterowaxy samples (TX10 and TX11)had the highest fermentation efficiencies and ethanol yield, andthe sample with highest amylose content (TX9) had the lowestfermentation efficiency (83.7%) and ethanol yield (362 L/ton, or2.43 gal/bu). Fermentation efficiency of TX7, the hybrid devel-oped fromTX9, was also among the lowest of all samples. Starchcontent together with fermentation efficiency determines the finalethanol yield of a hybrid or inbred. This explains why TX10,which has modest starch content, had the highest ethanol yield ofall tested samples. Having only high starch content or highfermentation efficiency cannot guarantee high ethanol yield.TX11 and TX6 had high efficiency because of their significantlyhigher contents of sucrose and fructose (data not shown), whichwere not accounted in the total starch assay but contributed to
ethanol production during fermentation. Ethanol yields fromTX 6 and TX11 were pretty low (362 and 394 L/ton respectively)because their starch contents were relatively low (62.9% for TX6and 66.9% for TX11, the average of all 13 samples was 69.5%).
Figure 2 shows thatmost sorghum samples except thewaxy andheterowaxy ones (TX10 and TX11) had a significant amylose-lipid complex peak beside the major starch gelatinization peak.It has long been recognized that formation of the amylose-lipidcomplex can significantly reduce starch digestibility (27, 28). Themore amylose-lipid content a starch contains, the slower and lesscompletely the starch will be hydrolyzed, which will ultimatelyresult in lower ethanol yield and fermentation efficiency.As shownin Figure 2, dissociation temperatures for amylose-lipid com-plexes are around 95-105 �C, which is higher than the 85 �Cmashing temperature. The lipid-complexed amylose will havepoor or slow access for amylase hydrolysis, which, consequently,will result in increased residual starch in DDGS. The residualstarch content inDDGSobserved in this study positively confirmsthis hypothesis (Table 1). The amylose-lipid peakswere especiallylarge in the thermograms of TX1, TX2, TX3, TX4, and TX9,which all have low fermentation efficiencies.
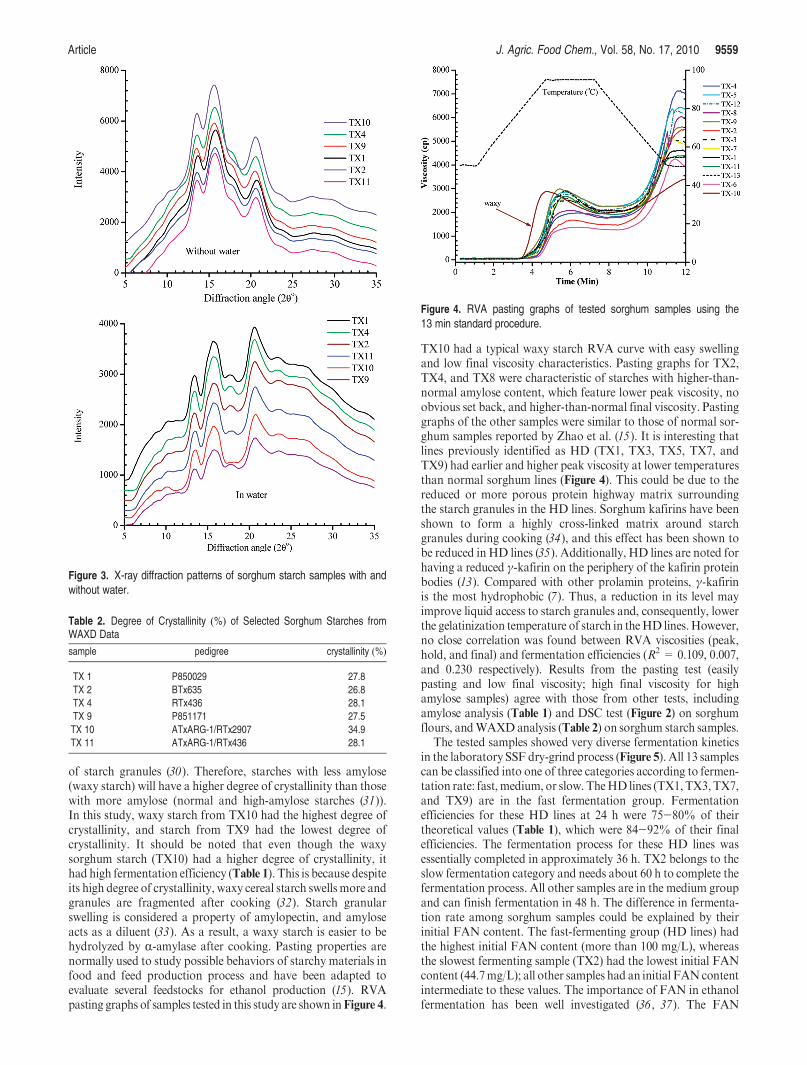
All sorghum starches gave an A-type X-ray diffraction pattern(Figure 3). The degree of crystallinity clearly differentiated waxystarches from nonwaxy starches (Table 2). It is generally believedthat side chains of amylopectinmolecules form crystalline lamellaein the starch granules; branch regions of amylopectin moleculesand connections between crystalline lamellae are amorphous (29).Most amylose molecules are dispersed in the amorphous regions
Figure 1. Relationship between ethanol yield, fermentation efficiency, andstarch content.
Figure 2. DSC thermograms of selected sorghum samples show themajor starch gelatinization peak and amylose-lipid complex peaks.
Article J. Agric. Food Chem., Vol. 58, No. 17, 2010 9559
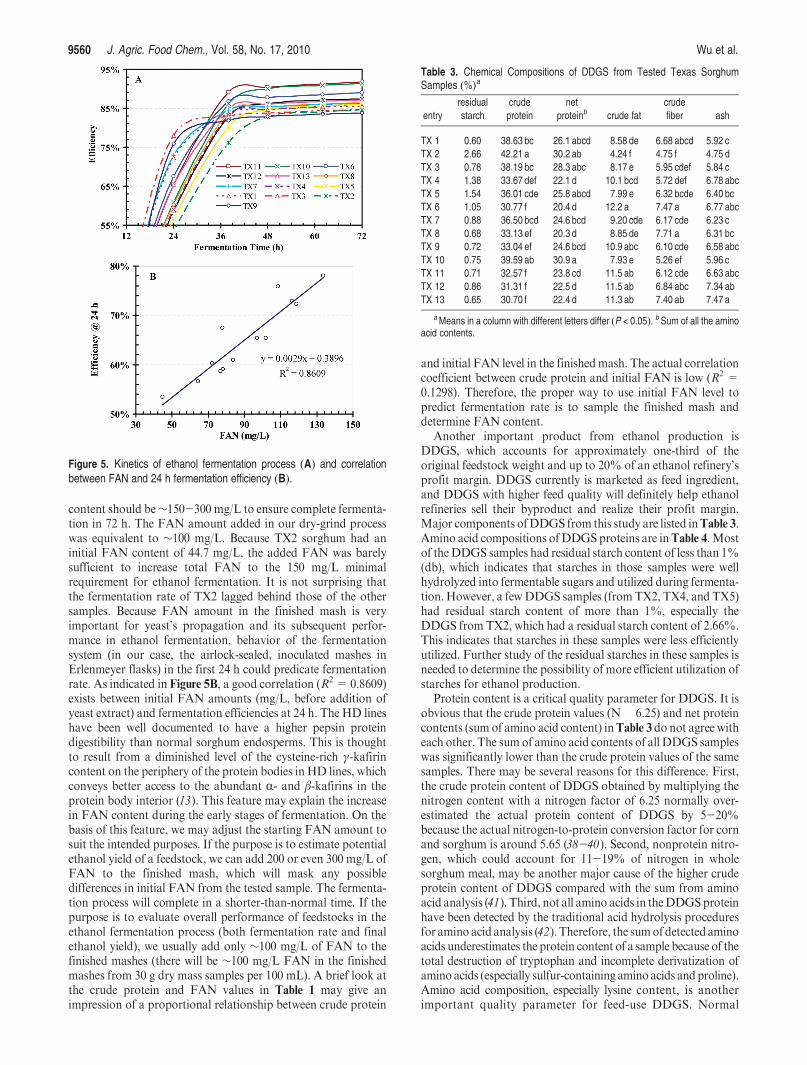
of starch granules (30). Therefore, starches with less amylose(waxy starch) will have a higher degree of crystallinity than thosewith more amylose (normal and high-amylose starches (31)).In this study, waxy starch from TX10 had the highest degree ofcrystallinity, and starch from TX9 had the lowest degree ofcrystallinity. It should be noted that even though the waxysorghum starch (TX10) had a higher degree of crystallinity, ithad high fermentation efficiency (Table 1). This is because despiteits high degree of crystallinity, waxy cereal starch swells more andgranules are fragmented after cooking (32). Starch granularswelling is considered a property of amylopectin, and amyloseacts as a diluent (33). As a result, a waxy starch is easier to behydrolyzed by R-amylase after cooking. Pasting properties arenormally used to study possible behaviors of starchy materials infood and feed production process and have been adapted toevaluate several feedstocks for ethanol production (15). RVApasting graphs of samples tested in this study are shown inFigure 4.
TX10 had a typical waxy starch RVA curve with easy swellingand low final viscosity characteristics. Pasting graphs for TX2,TX4, and TX8 were characteristic of starches with higher-than-normal amylose content, which feature lower peak viscosity, noobvious set back, and higher-than-normal final viscosity. Pastinggraphs of the other samples were similar to those of normal sor-ghum samples reported by Zhao et al. (15). It is interesting thatlines previously identified as HD (TX1, TX3, TX5, TX7, andTX9) had earlier and higher peak viscosity at lower temperaturesthan normal sorghum lines (Figure 4). This could be due to thereduced or more porous protein highway matrix surroundingthe starch granules in the HD lines. Sorghum kafirins have beenshown to form a highly cross-linked matrix around starchgranules during cooking (34), and this effect has been shown tobe reduced in HD lines (35). Additionally, HD lines are noted forhaving a reduced γ-kafirin on the periphery of the kafirin proteinbodies (13). Compared with other prolamin proteins, γ-kafirinis the most hydrophobic (7). Thus, a reduction in its level mayimprove liquid access to starch granules and, consequently, lowerthe gelatinization temperature of starch in theHD lines.However,no close correlation was found between RVA viscosities (peak,hold, and final) and fermentation efficiencies (R2 = 0.109, 0.007,and 0.230 respectively). Results from the pasting test (easilypasting and low final viscosity; high final viscosity for highamylose samples) agree with those from other tests, includingamylose analysis (Table 1) and DSC test (Figure 2) on sorghumflours, andWAXDanalysis (Table 2) on sorghum starch samples.
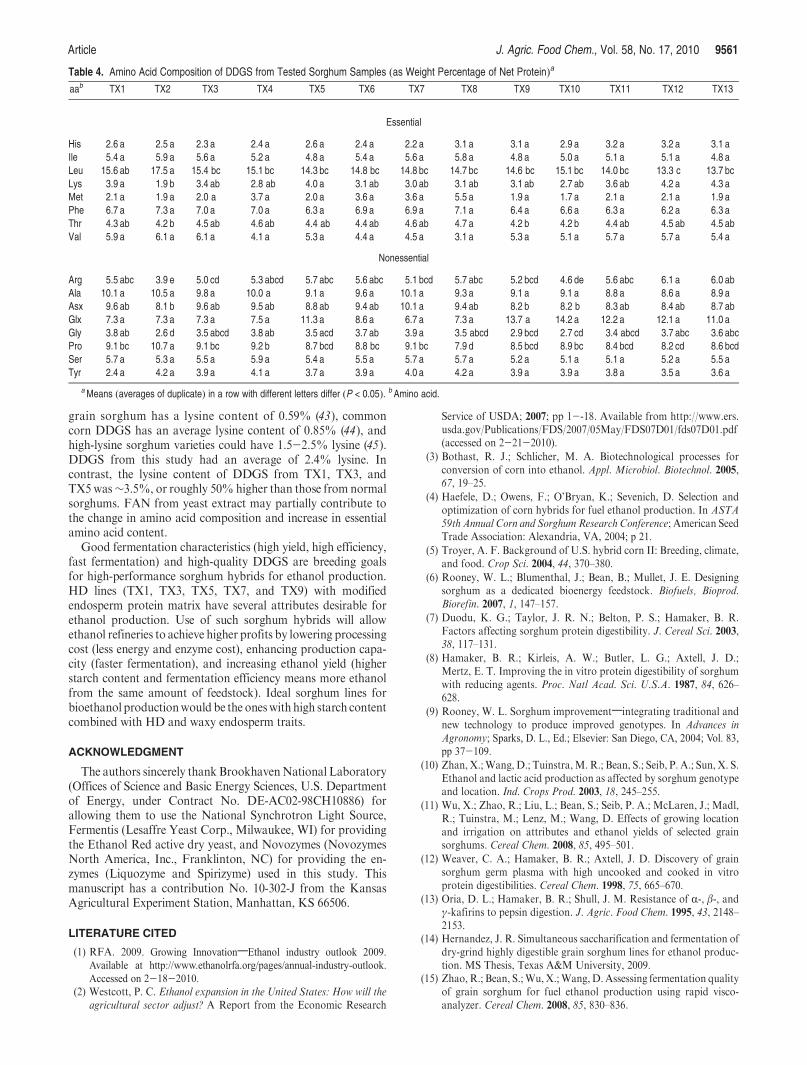
The tested samples showed very diverse fermentation kineticsin the laboratory SSF dry-grind process (Figure 5). All 13 samplescan be classified into one of three categories according to fermen-tation rate: fast,medium, or slow. TheHD lines (TX1,TX3,TX7,and TX9) are in the fast fermentation group. Fermentationefficiencies for these HD lines at 24 h were 75-80% of theirtheoretical values (Table 1), which were 84-92% of their finalefficiencies. The fermentation process for these HD lines wasessentially completed in approximately 36 h. TX2 belongs to theslow fermentation category and needs about 60 h to complete thefermentation process. All other samples are in the medium groupand can finish fermentation in 48 h. The difference in fermenta-tion rate among sorghum samples could be explained by theirinitial FAN content. The fast-fermenting group (HD lines) hadthe highest initial FAN content (more than 100 mg/L), whereasthe slowest fermenting sample (TX2) had the lowest initial FANcontent (44.7mg/L); all other samples had an initial FAN contentintermediate to these values. The importance of FAN in ethanolfermentation has been well investigated (36, 37). The FAN
Figure 3. X-ray diffraction patterns of sorghum starch samples with andwithout water.
Table 2. Degree of Crystallinity (%) of Selected Sorghum Starches fromWAXD Data
sample pedigree crystallinity (%)
TX 1 P850029 27.8
TX 2 BTx635 26.8
TX 4 RTx436 28.1
TX 9 P851171 27.5
TX 10 ATxARG-1/RTx2907 34.9
TX 11 ATxARG-1/RTx436 28.1
Figure 4. RVA pasting graphs of tested sorghum samples using the13 min standard procedure.
9560 J. Agric. Food Chem., Vol. 58, No. 17, 2010 Wu et al.
content should be∼150-300 mg/L to ensure complete fermenta-tion in 72 h. The FAN amount added in our dry-grind processwas equivalent to ∼100 mg/L. Because TX2 sorghum had aninitial FAN content of 44.7 mg/L, the added FAN was barelysufficient to increase total FAN to the 150 mg/L minimalrequirement for ethanol fermentation. It is not surprising thatthe fermentation rate of TX2 lagged behind those of the othersamples. Because FAN amount in the finished mash is veryimportant for yeast’s propagation and its subsequent perfor-mance in ethanol fermentation, behavior of the fermentationsystem (in our case, the airlock-sealed, inoculated mashes inErlenmeyer flasks) in the first 24 h could predicate fermentationrate. As indicated in Figure 5B, a good correlation (R2 = 0.8609)exists between initial FAN amounts (mg/L, before addition ofyeast extract) and fermentation efficiencies at 24 h. The HD lineshave been well documented to have a higher pepsin proteindigestibility than normal sorghum endosperms. This is thoughtto result from a diminished level of the cysteine-rich γ-kafirincontent on the periphery of the protein bodies in HD lines, whichconveys better access to the abundant R- and β-kafirins in theprotein body interior (13). This feature may explain the increasein FAN content during the early stages of fermentation. On thebasis of this feature, we may adjust the starting FAN amount tosuit the intended purposes. If the purpose is to estimate potentialethanol yield of a feedstock, we can add 200 or even 300 mg/L ofFAN to the finished mash, which will mask any possibledifferences in initial FAN from the tested sample. The fermenta-tion process will complete in a shorter-than-normal time. If thepurpose is to evaluate overall performance of feedstocks in theethanol fermentation process (both fermentation rate and finalethanol yield), we usually add only ∼100 mg/L of FAN to thefinished mashes (there will be ∼100 mg/L FAN in the finishedmashes from 30 g dry mass samples per 100 mL). A brief look atthe crude protein and FAN values in Table 1 may give animpression of a proportional relationship between crude protein
and initial FAN level in the finishedmash. The actual correlationcoefficient between crude protein and initial FAN is low (R2 =0.1298). Therefore, the proper way to use initial FAN level topredict fermentation rate is to sample the finished mash anddetermine FAN content.
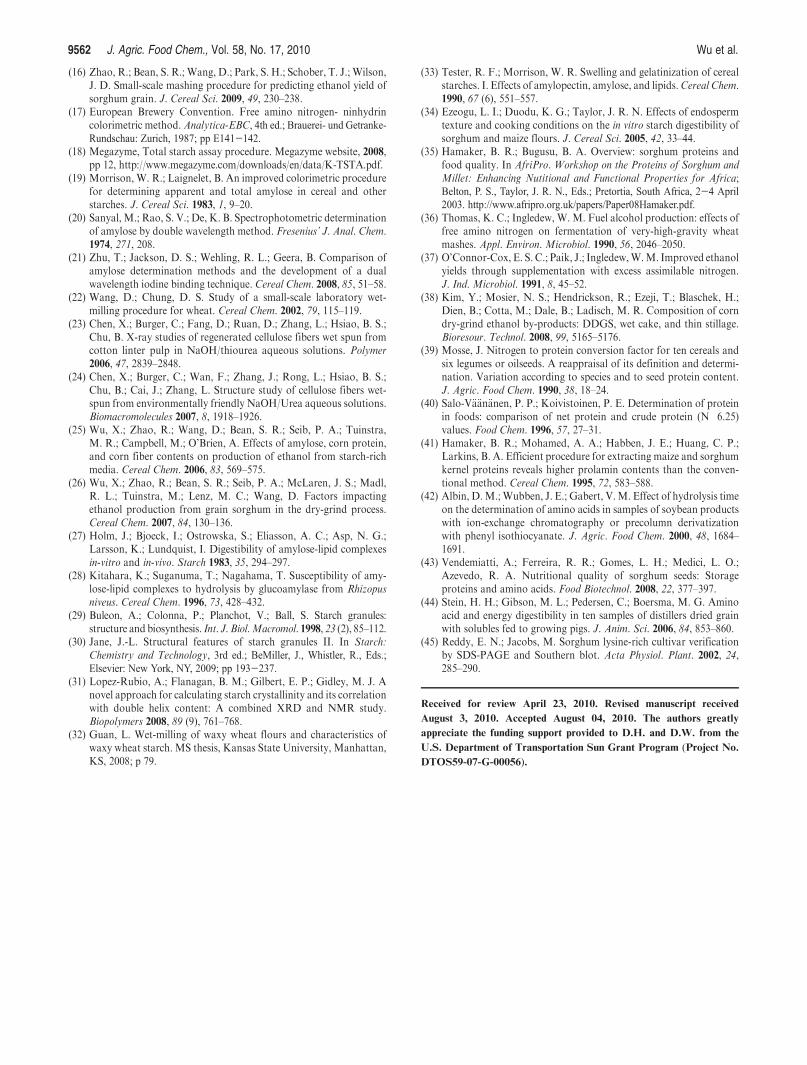
Another important product from ethanol production isDDGS, which accounts for approximately one-third of theoriginal feedstock weight and up to 20% of an ethanol refinery’sprofit margin. DDGS currently is marketed as feed ingredient,and DDGS with higher feed quality will definitely help ethanolrefineries sell their byproduct and realize their profit margin.Major components ofDDGS from this study are listed inTable 3.Amino acid compositions ofDDGSproteins are inTable 4.Mostof theDDGS samples had residual starch content of less than 1%(db), which indicates that starches in those samples were wellhydrolyzed into fermentable sugars and utilized during fermenta-tion. However, a fewDDGS samples (fromTX2, TX4, and TX5)had residual starch content of more than 1%, especially theDDGS from TX2, which had a residual starch content of 2.66%.This indicates that starches in these samples were less efficientlyutilized. Further study of the residual starches in these samples isneeded to determine the possibility of more efficient utilization ofstarches for ethanol production.
Protein content is a critical quality parameter for DDGS. It isobvious that the crude protein values (N � 6.25) and net proteincontents (sum of amino acid content) inTable 3 do not agree witheach other. The sum of amino acid contents of all DDGS sampleswas significantly lower than the crude protein values of the samesamples. There may be several reasons for this difference. First,the crude protein content of DDGS obtained by multiplying thenitrogen content with a nitrogen factor of 6.25 normally over-estimated the actual protein content of DDGS by 5-20%because the actual nitrogen-to-protein conversion factor for cornand sorghum is around 5.65 (38-40). Second, nonprotein nitro-gen, which could account for 11-19% of nitrogen in wholesorghum meal, may be another major cause of the higher crudeprotein content of DDGS compared with the sum from aminoacid analysis (41). Third, not all amino acids in theDDGSproteinhave been detected by the traditional acid hydrolysis proceduresfor amino acid analysis (42). Therefore, the sumofdetected aminoacids underestimates the protein content of a sample because of thetotal destruction of tryptophan and incomplete derivatization ofamino acids (especially sulfur-containing aminoacids andproline).Amino acid composition, especially lysine content, is anotherimportant quality parameter for feed-use DDGS. Normal
Figure 5. Kinetics of ethanol fermentation process (A) and correlationbetween FAN and 24 h fermentation efficiency (B).
Table 3. Chemical Compositions of DDGS from Tested Texas SorghumSamples (%)a
entry
residual
starch
crude
protein
net
proteinb crude fat
crude
fiber ash
TX 1 0.60 38.63 bc 26.1 abcd 8.58 de 6.68 abcd 5.92 c
TX 2 2.66 42.21 a 30.2 ab 4.24 f 4.75 f 4.75 d
TX 3 0.78 38.19 bc 28.3 abc 8.17 e 5.95 cdef 5.84 c
TX 4 1.38 33.67 def 22.1 d 10.1 bcd 5.72 def 6.78 abc
TX 5 1.54 36.01 cde 25.8 abcd 7.99 e 6.32 bcde 6.40 bc
TX 6 1.05 30.77 f 20.4 d 12.2 a 7.47 a 6.77 abc
TX 7 0.88 36.50 bcd 24.6 bcd 9.20 cde 6.17 cde 6.23 c
TX 8 0.68 33.13 ef 20.3 d 8.85 de 7.71 a 6.31 bc
TX 9 0.72 33.04 ef 24.6 bcd 10.9 abc 6.10 cde 6.58 abc
TX 10 0.75 39.59 ab 30.9 a 7.93 e 5.26 ef 5.96 c
TX 11 0.71 32.57 f 23.8 cd 11.5 ab 6.12 cde 6.63 abc
TX 12 0.86 31.31 f 22.5 d 11.5 ab 6.84 abc 7.34 ab
TX 13 0.65 30.70 f 22.4 d 11.3 ab 7.40 ab 7.47 a
aMeans in a column with different letters differ (P < 0.05). bSum of all the aminoacid contents.
Article J. Agric. Food Chem., Vol. 58, No. 17, 2010 9561
grain sorghum has a lysine content of 0.59% (43), commoncorn DDGS has an average lysine content of 0.85% (44), andhigh-lysine sorghum varieties could have 1.5-2.5% lysine (45).DDGS from this study had an average of 2.4% lysine. Incontrast, the lysine content of DDGS from TX1, TX3, andTX5 was∼3.5%, or roughly 50%higher than those from normalsorghums. FAN from yeast extract may partially contribute tothe change in amino acid composition and increase in essentialamino acid content.
Good fermentation characteristics (high yield, high efficiency,fast fermentation) and high-quality DDGS are breeding goalsfor high-performance sorghum hybrids for ethanol production.HD lines (TX1, TX3, TX5, TX7, and TX9) with modifiedendosperm protein matrix have several attributes desirable forethanol production. Use of such sorghum hybrids will allowethanol refineries to achieve higher profits by lowering processingcost (less energy and enzyme cost), enhancing production capa-city (faster fermentation), and increasing ethanol yield (higherstarch content and fermentation efficiency means more ethanolfrom the same amount of feedstock). Ideal sorghum lines forbioethanol productionwould be the oneswith high starch contentcombined with HD and waxy endosperm traits.
ACKNOWLEDGMENT
The authors sincerely thank BrookhavenNational Laboratory(Offices of Science and Basic Energy Sciences, U.S. Departmentof Energy, under Contract No. DE-AC02-98CH10886) forallowing them to use the National Synchrotron Light Source,Fermentis (Lesaffre Yeast Corp., Milwaukee, WI) for providingthe Ethanol Red active dry yeast, and Novozymes (NovozymesNorth America, Inc., Franklinton, NC) for providing the en-zymes (Liquozyme and Spirizyme) used in this study. Thismanuscript has a contribution No. 10-302-J from the KansasAgricultural Experiment Station, Manhattan, KS 66506.
LITERATURE CITED
(1) RFA. 2009. Growing Innovation;Ethanol industry outlook 2009.Available at http://www.ethanolrfa.org/pages/annual-industry-outlook.Accessed on 2-18-2010.
(2) Westcott, P. C. Ethanol expansion in the United States: How will theagricultural sector adjust? A Report from the Economic Research
Service of USDA; 2007; pp 1--18. Available from http://www.ers.usda.gov/Publications/FDS/2007/05May/FDS07D01/fds07D01.pdf(accessed on 2-21-2010).
(3) Bothast, R. J.; Schlicher, M. A. Biotechnological processes forconversion of corn into ethanol. Appl. Microbiol. Biotechnol. 2005,67, 19–25.
(4) Haefele, D.; Owens, F.; O’Bryan, K.; Sevenich, D. Selection andoptimization of corn hybrids for fuel ethanol production. In ASTA59th Annual Corn and Sorghum Research Conference; American SeedTrade Association: Alexandria, VA, 2004; p 21.
(5) Troyer, A. F. Background of U.S. hybrid corn II: Breeding, climate,and food. Crop Sci. 2004, 44, 370–380.
(6) Rooney, W. L.; Blumenthal, J.; Bean, B.; Mullet, J. E. Designingsorghum as a dedicated bioenergy feedstock. Biofuels, Bioprod.Biorefin. 2007, 1, 147–157.
(7) Duodu, K. G.; Taylor, J. R. N.; Belton, P. S.; Hamaker, B. R.Factors affecting sorghum protein digestibility. J. Cereal Sci. 2003,38, 117–131.
(8) Hamaker, B. R.; Kirleis, A. W.; Butler, L. G.; Axtell, J. D.;Mertz, E. T. Improving the in vitro protein digestibility of sorghumwith reducing agents. Proc. Natl Acad. Sci. U.S.A. 1987, 84, 626–628.
(9) Rooney, W. L. Sorghum improvement;integrating traditional andnew technology to produce improved genotypes. In Advances inAgronomy; Sparks, D. L., Ed.; Elsevier: San Diego, CA, 2004; Vol. 83,pp 37-109.
(10) Zhan, X.;Wang, D.; Tuinstra,M.R.; Bean, S.; Seib, P. A.; Sun, X. S.Ethanol and lactic acid production as affected by sorghum genotypeand location. Ind. Crops Prod. 2003, 18, 245–255.
(11) Wu, X.; Zhao, R.; Liu, L.; Bean, S.; Seib, P. A.; McLaren, J.; Madl,R.; Tuinstra, M.; Lenz, M.; Wang, D. Effects of growing locationand irrigation on attributes and ethanol yields of selected grainsorghums. Cereal Chem. 2008, 85, 495–501.
(12) Weaver, C. A.; Hamaker, B. R.; Axtell, J. D. Discovery of grainsorghum germ plasma with high uncooked and cooked in vitroprotein digestibilities. Cereal Chem. 1998, 75, 665–670.
(13) Oria, D. L.; Hamaker, B. R.; Shull, J. M. Resistance of R-, β-, andγ-kafirins to pepsin digestion. J. Agric. Food Chem. 1995, 43, 2148–2153.
(14) Hernandez, J. R. Simultaneous saccharification and fermentation ofdry-grind highly digestible grain sorghum lines for ethanol produc-tion. MS Thesis, Texas A&M University, 2009.
(15) Zhao, R.; Bean, S.;Wu,X.;Wang,D.Assessing fermentation qualityof grain sorghum for fuel ethanol production using rapid visco-analyzer. Cereal Chem. 2008, 85, 830–836.
Table 4. Amino Acid Composition of DDGS from Tested Sorghum Samples (as Weight Percentage of Net Protein)a
aab TX1 TX2 TX3 TX4 TX5 TX6 TX7 TX8 TX9 TX10 TX11 TX12 TX13
Essential
His 2.6 a 2.5 a 2.3 a 2.4 a 2.6 a 2.4 a 2.2 a 3.1 a 3.1 a 2.9 a 3.2 a 3.2 a 3.1 a
Ile 5.4 a 5.9 a 5.6 a 5.2 a 4.8 a 5.4 a 5.6 a 5.8 a 4.8 a 5.0 a 5.1 a 5.1 a 4.8 a
Leu 15.6 ab 17.5 a 15.4 bc 15.1 bc 14.3 bc 14.8 bc 14.8 bc 14.7 bc 14.6 bc 15.1 bc 14.0 bc 13.3 c 13.7 bc
Lys 3.9 a 1.9 b 3.4 ab 2.8 ab 4.0 a 3.1 ab 3.0 ab 3.1 ab 3.1 ab 2.7 ab 3.6 ab 4.2 a 4.3 a
Met 2.1 a 1.9 a 2.0 a 3.7 a 2.0 a 3.6 a 3.6 a 5.5 a 1.9 a 1.7 a 2.1 a 2.1 a 1.9 a
Phe 6.7 a 7.3 a 7.0 a 7.0 a 6.3 a 6.9 a 6.9 a 7.1 a 6.4 a 6.6 a 6.3 a 6.2 a 6.3 a
Thr 4.3 ab 4.2 b 4.5 ab 4.6 ab 4.4 ab 4.4 ab 4.6 ab 4.7 a 4.2 b 4.2 b 4.4 ab 4.5 ab 4.5 ab
Val 5.9 a 6.1 a 6.1 a 4.1 a 5.3 a 4.4 a 4.5 a 3.1 a 5.3 a 5.1 a 5.7 a 5.7 a 5.4 a
Nonessential
Arg 5.5 abc 3.9 e 5.0 cd 5.3 abcd 5.7 abc 5.6 abc 5.1 bcd 5.7 abc 5.2 bcd 4.6 de 5.6 abc 6.1 a 6.0 ab
Ala 10.1 a 10.5 a 9.8 a 10.0 a 9.1 a 9.6 a 10.1 a 9.3 a 9.1 a 9.1 a 8.8 a 8.6 a 8.9 a
Asx 9.6 ab 8.1 b 9.6 ab 9.5 ab 8.8 ab 9.4 ab 10.1 a 9.4 ab 8.2 b 8.2 b 8.3 ab 8.4 ab 8.7 ab
Glx 7.3 a 7.3 a 7.3 a 7.5 a 11.3 a 8.6 a 6.7 a 7.3 a 13.7 a 14.2 a 12.2 a 12.1 a 11.0 a
Gly 3.8 ab 2.6 d 3.5 abcd 3.8 ab 3.5 acd 3.7 ab 3.9 a 3.5 abcd 2.9 bcd 2.7 cd 3.4 abcd 3.7 abc 3.6 abc
Pro 9.1 bc 10.7 a 9.1 bc 9.2 b 8.7 bcd 8.8 bc 9.1 bc 7.9 d 8.5 bcd 8.9 bc 8.4 bcd 8.2 cd 8.6 bcd
Ser 5.7 a 5.3 a 5.5 a 5.9 a 5.4 a 5.5 a 5.7 a 5.7 a 5.2 a 5.1 a 5.1 a 5.2 a 5.5 a
Tyr 2.4 a 4.2 a 3.9 a 4.1 a 3.7 a 3.9 a 4.0 a 4.2 a 3.9 a 3.9 a 3.8 a 3.5 a 3.6 a
aMeans (averages of duplicate) in a row with different letters differ (P < 0.05). bAmino acid.
9562 J. Agric. Food Chem., Vol. 58, No. 17, 2010 Wu et al.
(16) Zhao, R.; Bean, S. R.; Wang, D.; Park, S. H.; Schober, T. J.; Wilson,J. D. Small-scale mashing procedure for predicting ethanol yield ofsorghum grain. J. Cereal Sci. 2009, 49, 230–238.
(17) European Brewery Convention. Free amino nitrogen- ninhydrincolorimetric method.Analytica-EBC, 4th ed.; Brauerei- und Getranke-Rundschau: Zurich, 1987; pp E141-142.
(18) Megazyme, Total starch assay procedure. Megazyme website, 2008,pp 12, http://www.megazyme.com/downloads/en/data/K-TSTA.pdf.
(19) Morrison, W. R.; Laignelet, B. An improved colorimetric procedurefor determining apparent and total amylose in cereal and otherstarches. J. Cereal Sci. 1983, 1, 9–20.
(20) Sanyal, M.; Rao, S. V.; De, K. B. Spectrophotometric determinationof amylose by double wavelength method. Fresenius’ J. Anal. Chem.1974, 271, 208.
(21) Zhu, T.; Jackson, D. S.; Wehling, R. L.; Geera, B. Comparison ofamylose determination methods and the development of a dualwavelength iodine binding technique. Cereal Chem. 2008, 85, 51–58.
(22) Wang, D.; Chung, D. S. Study of a small-scale laboratory wet-milling procedure for wheat. Cereal Chem. 2002, 79, 115–119.
(23) Chen, X.; Burger, C.; Fang, D.; Ruan, D.; Zhang, L.; Hsiao, B. S.;Chu, B. X-ray studies of regenerated cellulose fibers wet spun fromcotton linter pulp in NaOH/thiourea aqueous solutions. Polymer2006, 47, 2839–2848.
(24) Chen, X.; Burger, C.; Wan, F.; Zhang, J.; Rong, L.; Hsiao, B. S.;Chu, B.; Cai, J.; Zhang, L. Structure study of cellulose fibers wet-spun from environmentally friendly NaOH/Urea aqueous solutions.Biomacromolecules 2007, 8, 1918–1926.
(25) Wu, X.; Zhao, R.; Wang, D.; Bean, S. R.; Seib, P. A.; Tuinstra,M. R.; Campbell, M.; O’Brien, A. Effects of amylose, corn protein,and corn fiber contents on production of ethanol from starch-richmedia. Cereal Chem. 2006, 83, 569–575.
(26) Wu, X.; Zhao, R.; Bean, S. R.; Seib, P. A.; McLaren, J. S.; Madl,R. L.; Tuinstra, M.; Lenz, M. C.; Wang, D. Factors impactingethanol production from grain sorghum in the dry-grind process.Cereal Chem. 2007, 84, 130–136.
(27) Holm, J.; Bjoeck, I.; Ostrowska, S.; Eliasson, A. C.; Asp, N. G.;Larsson, K.; Lundquist, I. Digestibility of amylose-lipid complexesin-vitro and in-vivo. Starch 1983, 35, 294–297.
(28) Kitahara, K.; Suganuma, T.; Nagahama, T. Susceptibility of amy-lose-lipid complexes to hydrolysis by glucoamylase from Rhizopusniveus. Cereal Chem. 1996, 73, 428–432.
(29) Buleon, A.; Colonna, P.; Planchot, V.; Ball, S. Starch granules:structure and biosynthesis. Int. J. Biol.Macromol. 1998, 23 (2), 85–112.
(30) Jane, J.-L. Structural features of starch granules II. In Starch:Chemistry and Technology, 3rd ed.; BeMiller, J., Whistler, R., Eds.;Elsevier: New York, NY, 2009; pp 193-237.
(31) Lopez-Rubio, A.; Flanagan, B. M.; Gilbert, E. P.; Gidley, M. J. Anovel approach for calculating starch crystallinity and its correlationwith double helix content: A combined XRD and NMR study.Biopolymers 2008, 89 (9), 761–768.
(32) Guan, L. Wet-milling of waxy wheat flours and characteristics ofwaxy wheat starch. MS thesis, Kansas State University, Manhattan,KS, 2008; p 79.
(33) Tester, R. F.; Morrison, W. R. Swelling and gelatinization of cerealstarches. I. Effects of amylopectin, amylose, and lipids.Cereal Chem.1990, 67 (6), 551–557.
(34) Ezeogu, L. I.; Duodu, K. G.; Taylor, J. R. N. Effects of endospermtexture and cooking conditions on the in vitro starch digestibility ofsorghum and maize flours. J. Cereal Sci. 2005, 42, 33–44.
(35) Hamaker, B. R.; Bugusu, B. A. Overview: sorghum proteins andfood quality. In AfriPro. Workshop on the Proteins of Sorghum andMillet: Enhancing Nutitional and Functional Properties for Africa;Belton, P. S., Taylor, J. R. N., Eds.; Pretortia, South Africa, 2-4 April2003. http://www.afripro.org.uk/papers/Paper08Hamaker.pdf.
(36) Thomas, K. C.; Ingledew, W. M. Fuel alcohol production: effects offree amino nitrogen on fermentation of very-high-gravity wheatmashes. Appl. Environ. Microbiol. 1990, 56, 2046–2050.
(37) O’Connor-Cox, E. S. C.; Paik, J.; Ingledew,W.M. Improved ethanolyields through supplementation with excess assimilable nitrogen.J. Ind. Microbiol. 1991, 8, 45–52.
(38) Kim, Y.; Mosier, N. S.; Hendrickson, R.; Ezeji, T.; Blaschek, H.;Dien, B.; Cotta, M.; Dale, B.; Ladisch, M. R. Composition of corndry-grind ethanol by-products: DDGS, wet cake, and thin stillage.Bioresour. Technol. 2008, 99, 5165–5176.
(39) Mosse, J. Nitrogen to protein conversion factor for ten cereals andsix legumes or oilseeds. A reappraisal of its definition and determi-nation. Variation according to species and to seed protein content.J. Agric. Food Chem. 1990, 38, 18–24.
(40) Salo-V€a€an€anen, P. P.; Koivistoinen, P. E. Determination of proteinin foods: comparison of net protein and crude protein (N�6.25)values. Food Chem. 1996, 57, 27–31.
(41) Hamaker, B. R.; Mohamed, A. A.; Habben, J. E.; Huang, C. P.;Larkins, B. A. Efficient procedure for extracting maize and sorghumkernel proteins reveals higher prolamin contents than the conven-tional method. Cereal Chem. 1995, 72, 583–588.
(42) Albin, D.M.;Wubben, J. E.; Gabert, V.M. Effect of hydrolysis timeon the determination of amino acids in samples of soybean productswith ion-exchange chromatography or precolumn derivatizationwith phenyl isothiocyanate. J. Agric. Food Chem. 2000, 48, 1684–1691.
(43) Vendemiatti, A.; Ferreira, R. R.; Gomes, L. H.; Medici, L. O.;Azevedo, R. A. Nutritional quality of sorghum seeds: Storageproteins and amino acids. Food Biotechnol. 2008, 22, 377–397.
(44) Stein, H. H.; Gibson, M. L.; Pedersen, C.; Boersma, M. G. Aminoacid and energy digestibility in ten samples of distillers dried grainwith solubles fed to growing pigs. J. Anim. Sci. 2006, 84, 853–860.
(45) Reddy, E. N.; Jacobs, M. Sorghum lysine-rich cultivar verificationby SDS-PAGE and Southern blot. Acta Physiol. Plant. 2002, 24,285–290.
Received for review April 23, 2010. Revised manuscript received
August 3, 2010. Accepted August 04, 2010. The authors greatly
appreciate the funding support provided to D.H. and D.W. from the
U.S. Department of Transportation Sun Grant Program (Project No.
DTOS59-07-G-00056).