Embed Size (px)
Citation preview
eta
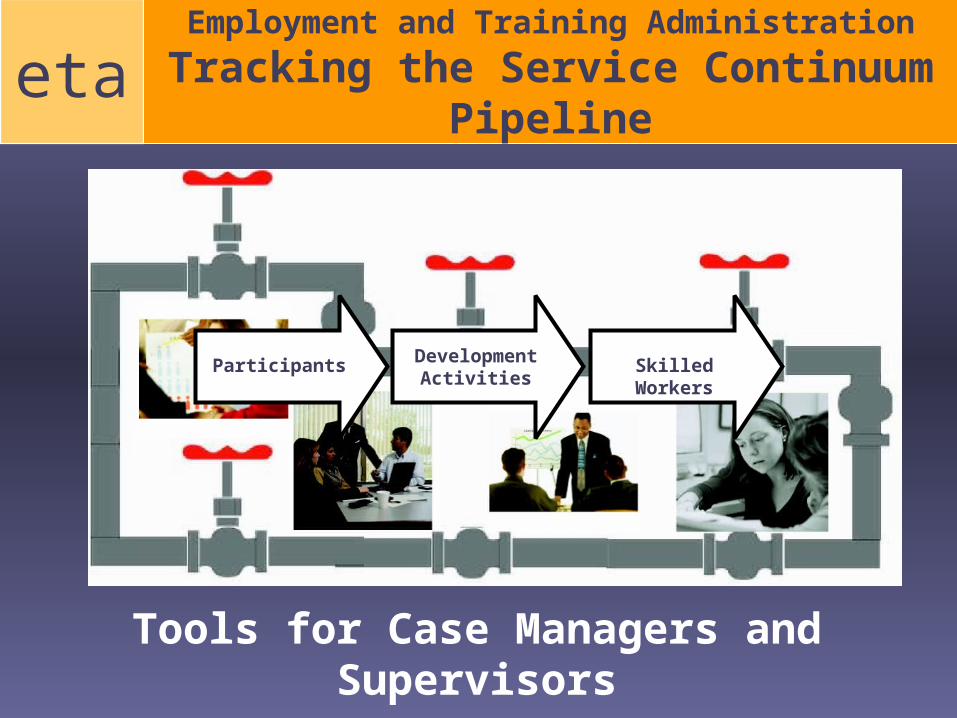
Tools for Case Managers and Supervisors
Participants Development Activities
Skilled Workers
Employment and Training Administration
Tracking the Service Continuum Pipeline

eta Today’s Objectives
1. Understand the service pipeline concept
2. Understand the capabilities of the ETA Pipeline Analysis Software Program
3. Learn to use the Case Manager Tool

eta
•It is a formal and informal process with clear outer boundaries that direct the activities through which participants flow
Like water flowing through a pipe:
Pipe = Service BoundariesWater = ParticipationConnections = Logical points that direct participants to the next phase of the pipeline
What is the Pipeline?

eta Why Perform a Pipeline Analysis?
Aids in assessing:Gaps in service delivery Case Manager
performanceLevel of engagement of
participantsProgram efficacy
It provides a snapshot of participant and case manager progress and program effectiveness
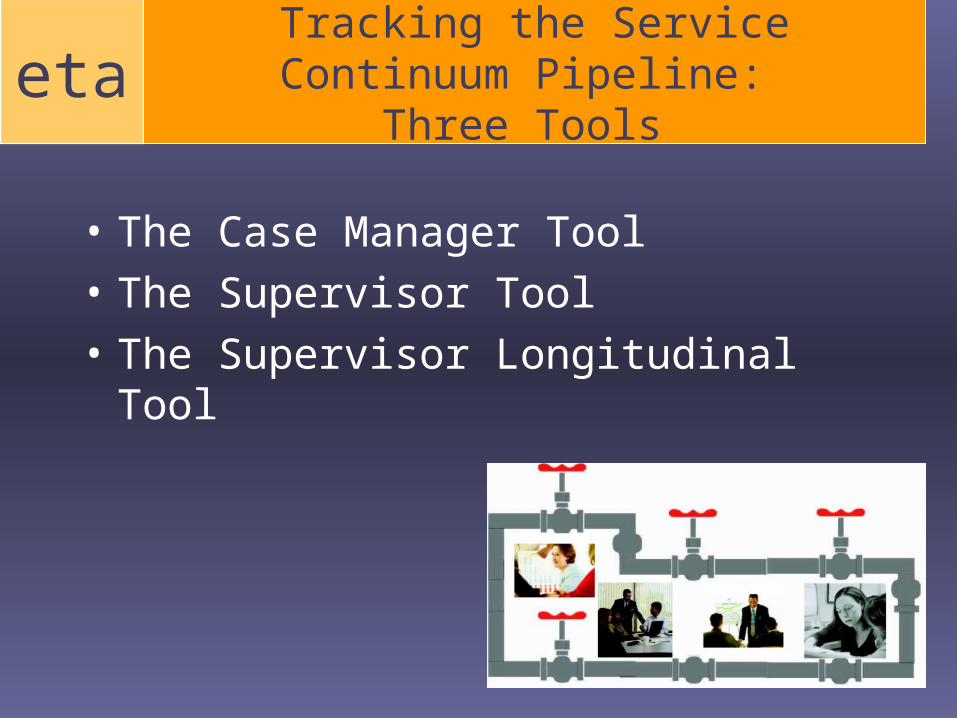
etaTracking the Service Continuum
Pipeline: Three Tools
• The Case Manager Tool
• The Supervisor Tool
• The Supervisor Longitudinal Tool
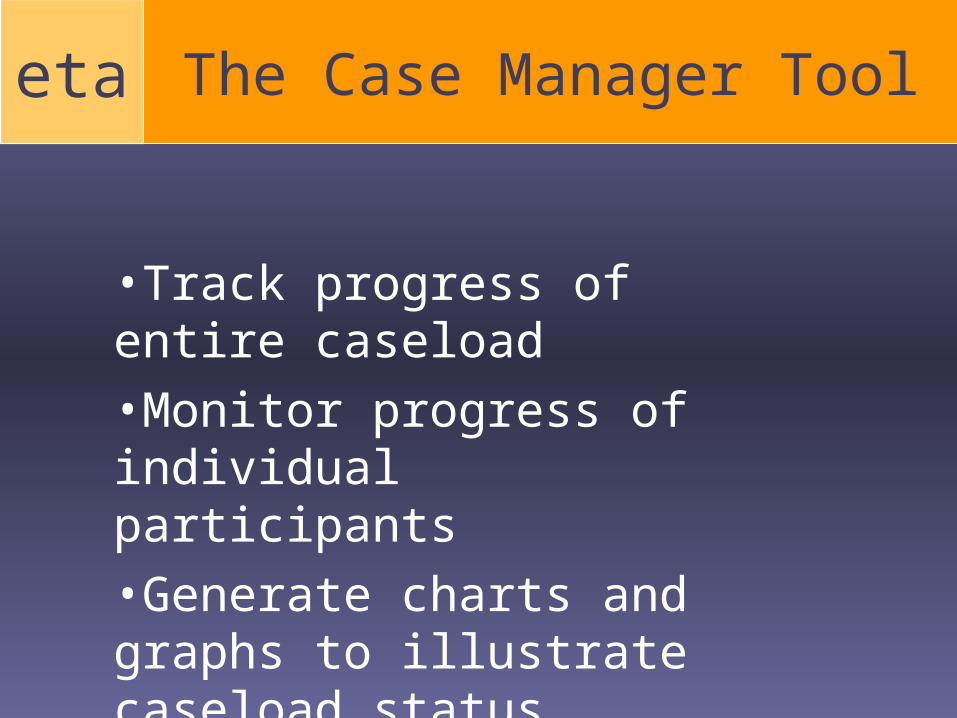
eta The Case Manager Tool
•Track progress of entire caseload
•Monitor progress of individual participants
•Generate charts and graphs to illustrate caseload status
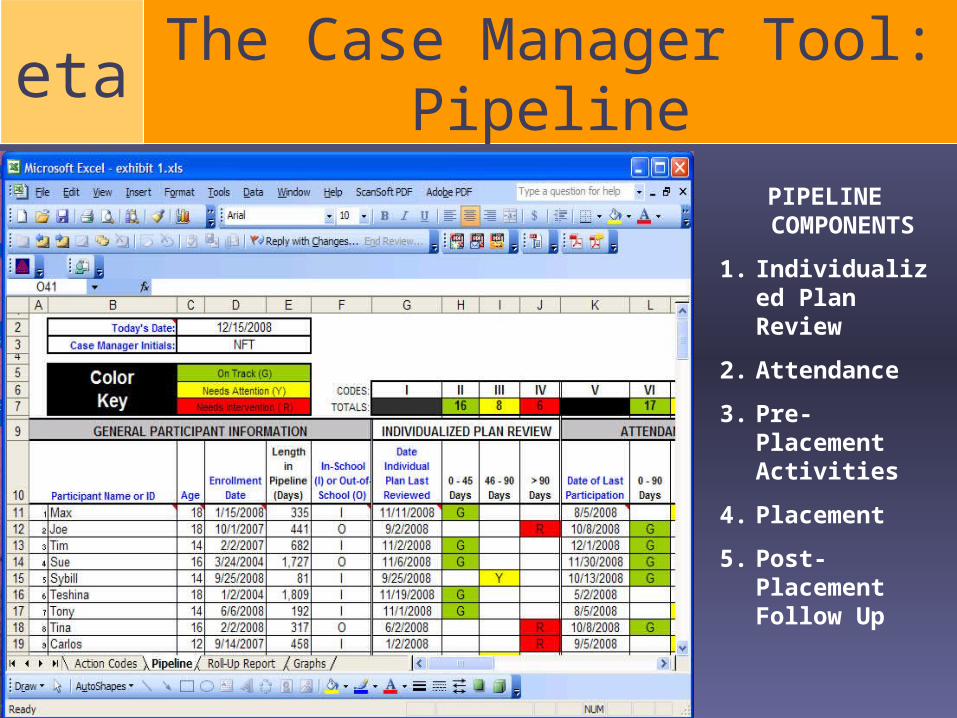
etaThe Case Manager Tool:
PipelinePIPELINE
COMPONENTS
1. Individualized Plan Review
2. Attendance
3. Pre-Placement Activities
4. Placement
5. Post-Placement Follow Up
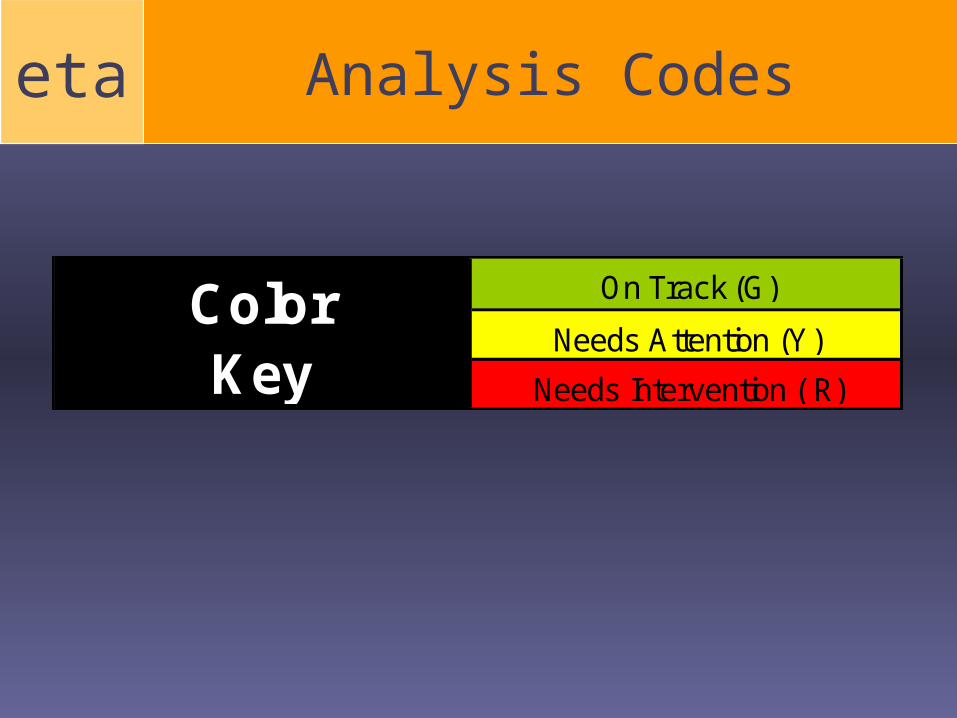
eta Analysis Codes
Color Key
On Track (G)
Needs Attention (Y)
Needs Intervention ( R)

eta The Supervisor Tool
• Track multiple case managers’ progress
• Monitor key program functions (e.g., placement) across case managers
• Generate charts and graphs to illustrate monthly performance of multiple case managers
etaThe Supervisor Longitudinal Tool
• Track performance individual case manager over time
• Generate longitudinal data on a case manager’s job performance
• Generate charts and graphs to illustrate performance of a case manager over time
eta
Using the Case Manager Tool
eta
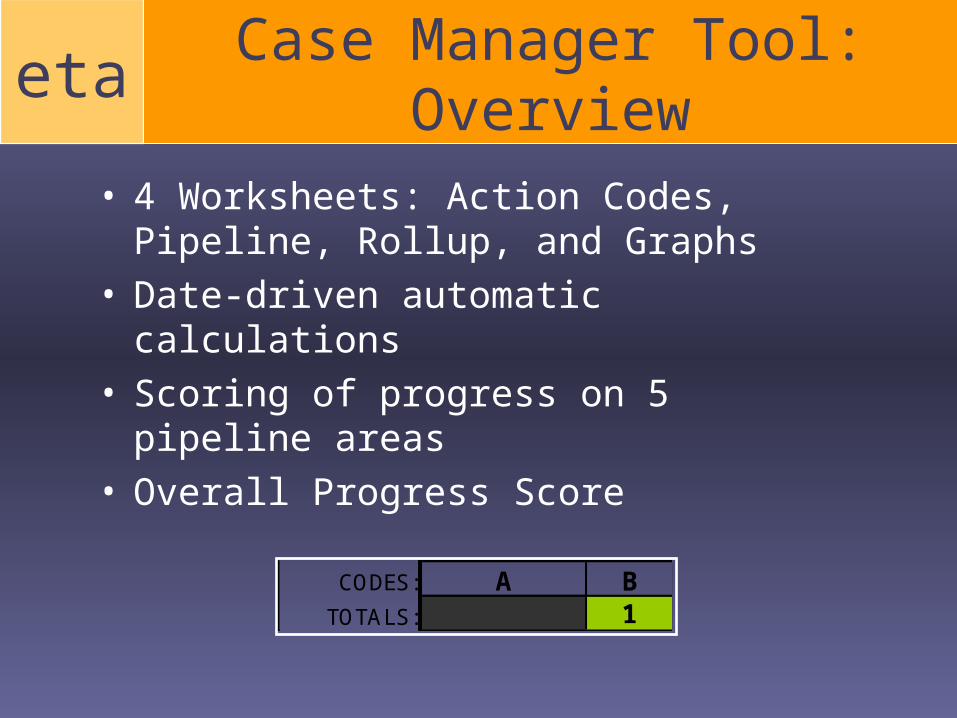
• 4 Worksheets: Action Codes, Pipeline, Rollup, and Graphs
• Date-driven automatic calculations• Scoring of progress on 5 pipeline areas • Overall Progress Score
CODES: A BTOTALS: 1
Case Manager Tool: Overview
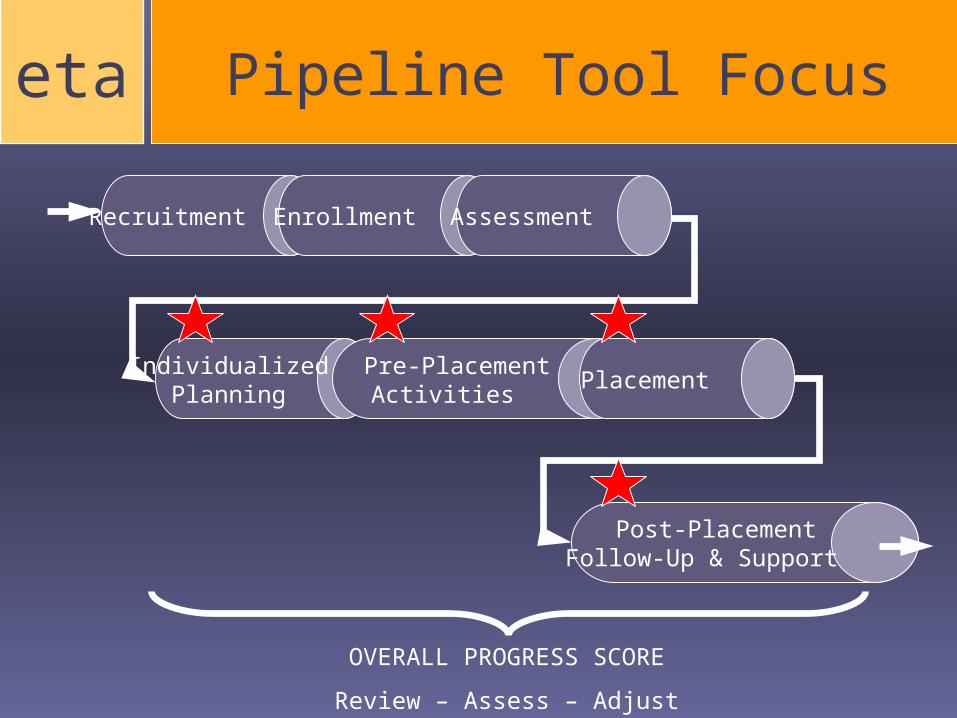
eta Pipeline Tool Focus
OVERALL PROGRESS SCORE
Review – Assess – Adjust
Recruitment Enrollment Assessment
Individualized Planning
Pre-Placement Activities
Placement
Post-Placement Follow-Up & Support
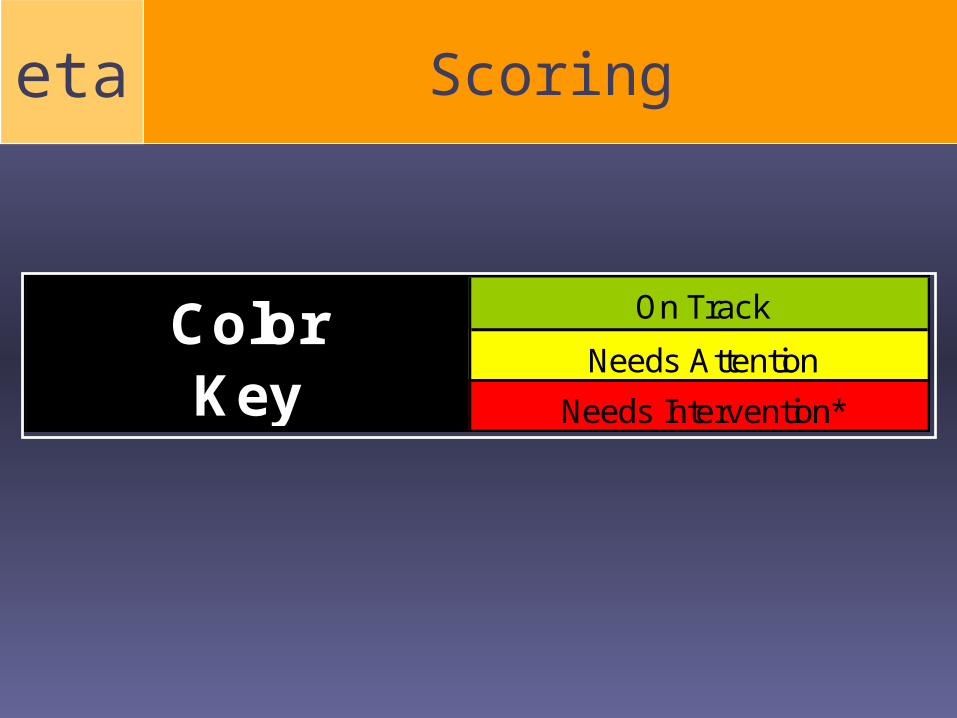
eta
Color Key
On Track
Needs Attention
Needs Intervention*
Scoring

eta Section 1: General Participant’s Information
AgeEnrollment
Date
Length in Pipeline (Days)
In-School (I) or Out-of-School (O)
1 Max 18 1/15/2005 248 IParticipant Name or ID
GENERAL PARTICIPANT INFORMATION
The tool automatically calculates the length of time each participant is in the pipeline.
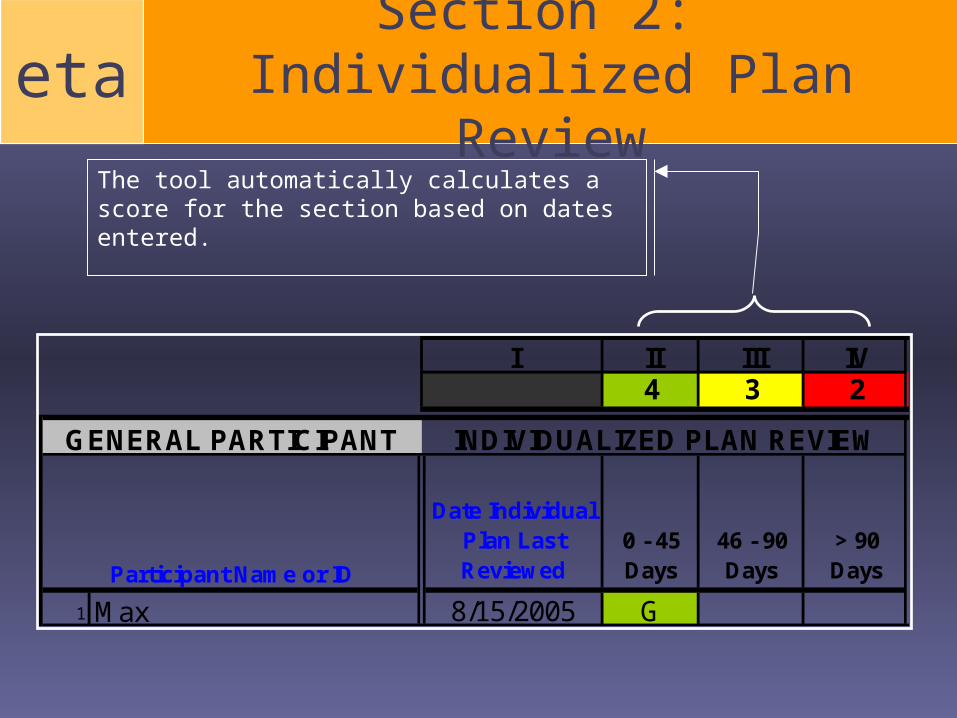
eta Section 2: Individualized Plan Review
I II III IV4 3 2
Date Individual Plan Last Reviewed
0 - 45 Days
46 - 90 Days
> 90 Days
1 Max 8/15/2005 GParticipant Name or ID
INDIVIDUALIZED PLAN REVIEWGENERAL PARTICIPANT
The tool automatically calculates a score for the section based on dates entered.

eta Section 3: Attendance
V VI VII VIII7 2 1
Date of Last Participation
0 - 90 Days
91 - 180 Days
> 180 Days
1 Max 6/5/2005 YParticipant Name or ID
ATTENDANCEGENERAL PARTICIPANT
The tool automatically calculates a score for the section based on dates entered.
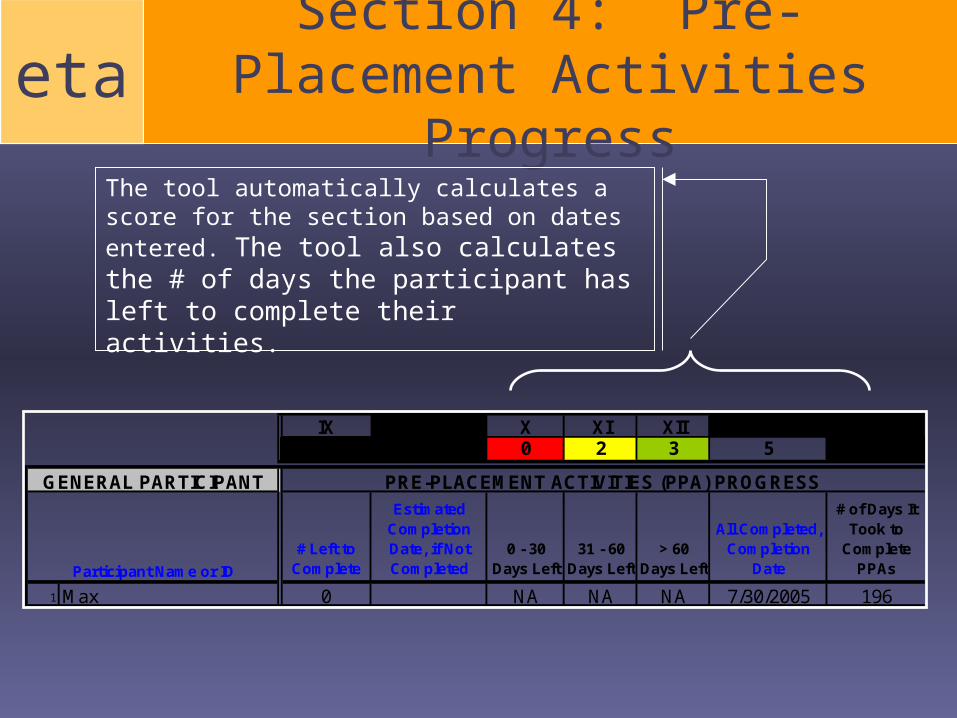
eta Section 4: Pre-Placement Activities Progress
IX X XI XII0 2 3 5
# Left to Complete
Estimated Completion Date, if Not Completed
0 - 30 Days Left
31 - 60 Days Left
> 60 Days Left
All Completed, Completion
Date
# of Days It Took to
Complete PPAs
1 Max 0 NA NA NA 7/30/2005 196Participant Name or ID
GENERAL PARTICIPANT PRE-PLACEMENT ACTIVITIES (PPA) PROGRESS
The tool automatically calculates a score for the section based on dates entered. The tool also calculates the # of days the participant has left to complete their activities.
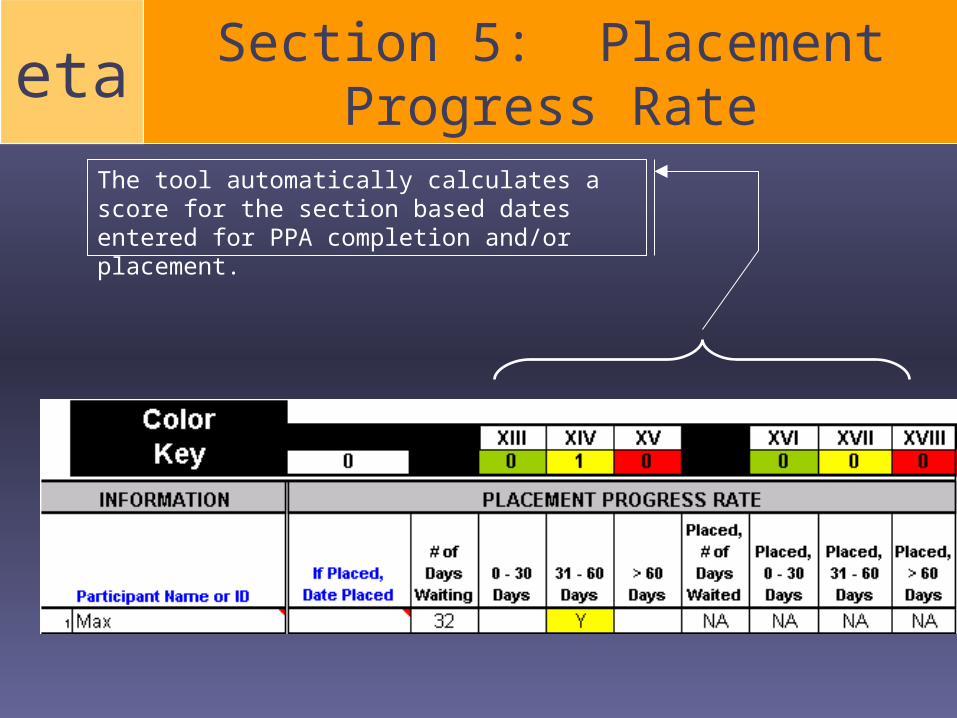
eta Section 5: Placement Progress Rate
The tool automatically calculates a score for the section based dates entered for PPA completion and/or placement.
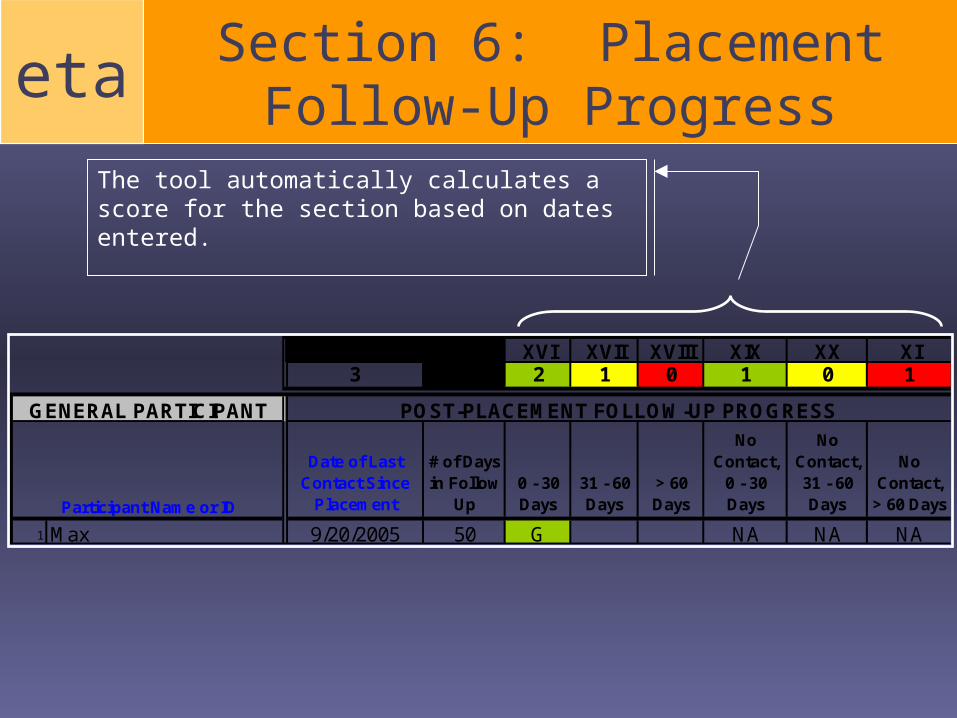
eta Section 6: Placement Follow-Up Progress
The tool automatically calculates a score for the section based on dates entered.
XVI XVII XVIII XIX XX XI3 2 1 0 1 0 1
Date of Last Contact Since
Placement
# of Days in Follow
Up0 - 30 Days
31 - 60 Days
> 60 Days
No Contact,
0 - 30 Days
No Contact, 31 - 60 Days
No Contact,
> 60 Days
1 Max 9/20/2005 50 G NA NA NAParticipant Name or ID
POST-PLACEMENT FOLLOW-UP PROGRESSGENERAL PARTICIPANT
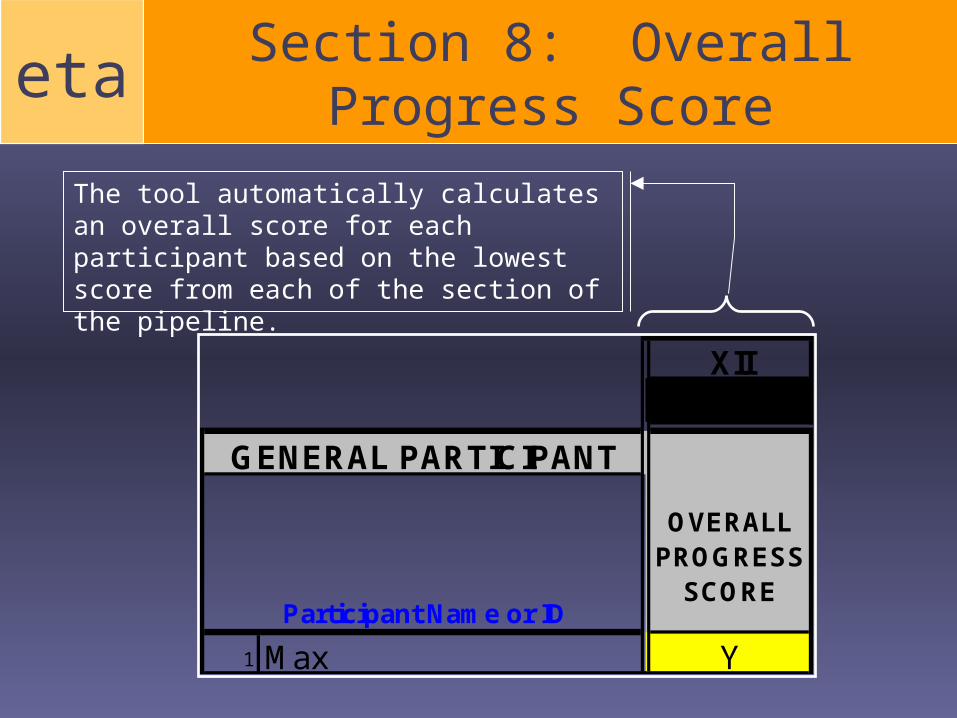
eta Section 8: Overall Progress Score
The tool automatically calculates an overall score for each participant based on the lowest score from each of the section of the pipeline.
XII
OVERALL PROGRESS
SCORE
1 Max YParticipant Name or ID
GENERAL PARTICIPANT
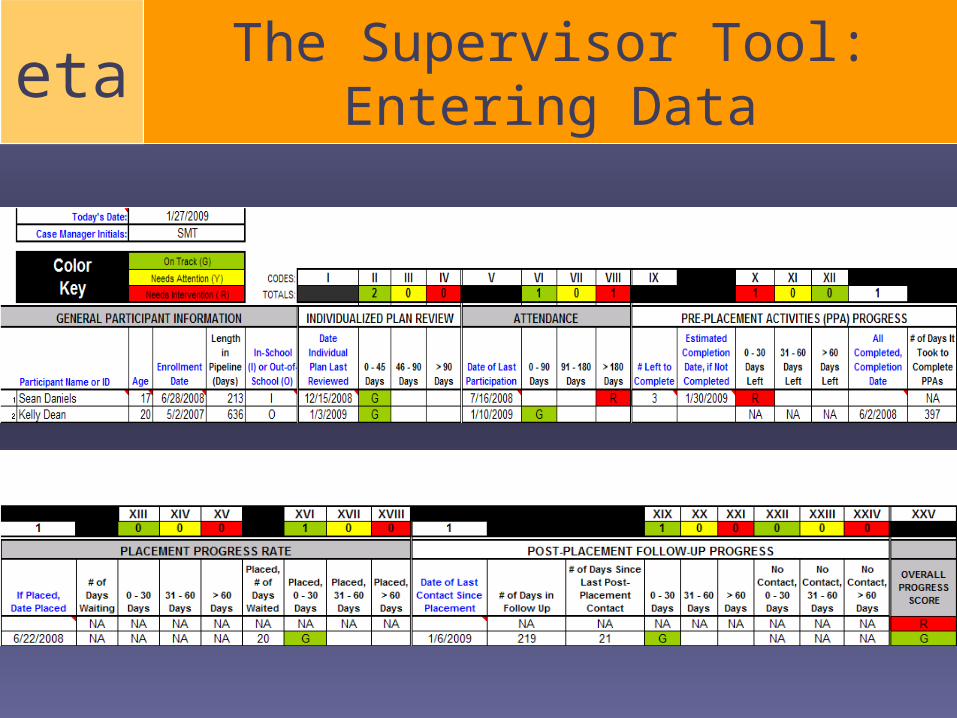
eta The Supervisor Tool: Entering Data

eta How to Find ETA Youth Services?
Youth Services
U.S. Department of Labor
Office of Workforce Investment
Employment and Training Administration
(202) 693-3030
www.doleta.gov/youth_services