Embed Size (px)
Citation preview

Taxable Sales
In California
(Sales & Use Tax)
During 2016
Fifty-Sixth Annual Report
CALIFORNIA STATE BOARD OF EQUALIZATION
SEN. GEORGE RUNNER (RET.)
First District
Lancaster
FIONA MA, CPA
Second District
San Francisco
JEROME E. HORTON Third District Los Angeles County
DIANE L. HARKEY
Fourth District
Orange County
BETTY T. YEE
State Controller
David J. GauExecutive Director
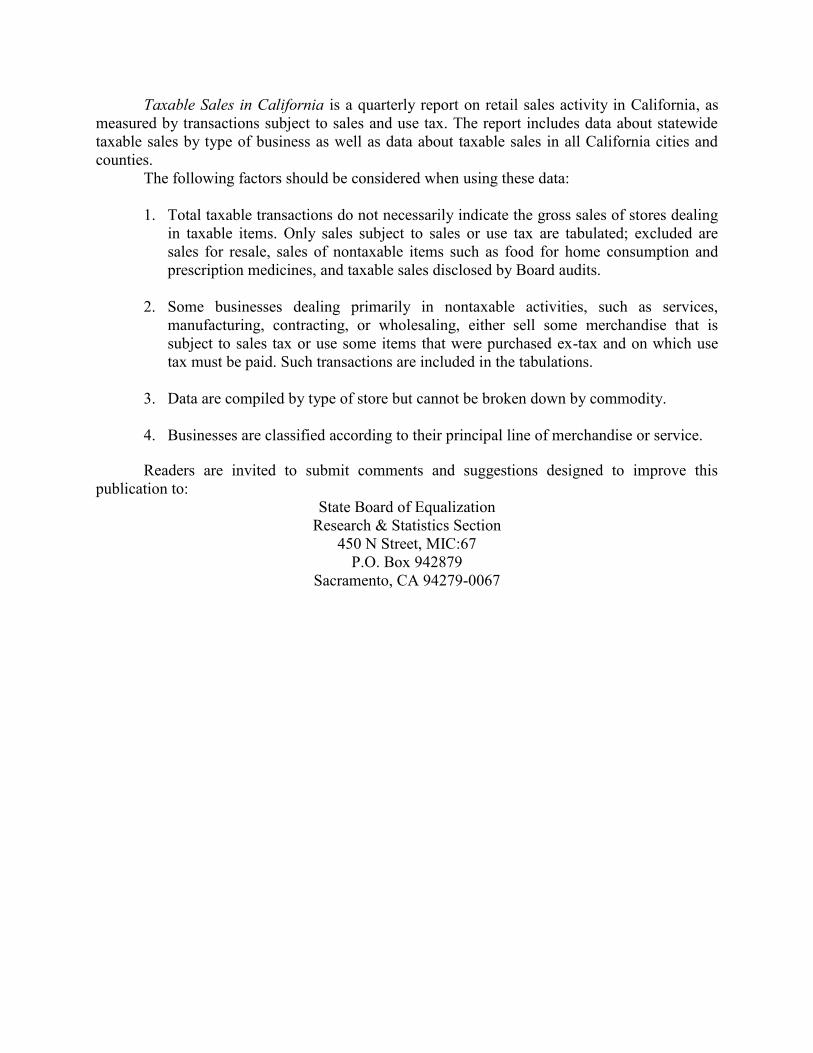
Taxable Sales in California is a quarterly report on retail sales activity in California, as
measured by transactions subject to sales and use tax. The report includes data about statewide
taxable sales by type of business as well as data about taxable sales in all California cities and
counties.
The following factors should be considered when using these data:
1. Total taxable transactions do not necessarily indicate the gross sales of stores dealing
in taxable items. Only sales subject to sales or use tax are tabulated; excluded are
sales for resale, sales of nontaxable items such as food for home consumption and
prescription medicines, and taxable sales disclosed by Board audits.
2. Some businesses dealing primarily in nontaxable activities, such as services,
manufacturing, contracting, or wholesaling, either sell some merchandise that is
subject to sales tax or use some items that were purchased ex-tax and on which use
tax must be paid. Such transactions are included in the tabulations.
3. Data are compiled by type of store but cannot be broken down by commodity.
4. Businesses are classified according to their principal line of merchandise or service.
Readers are invited to submit comments and suggestions designed to improve this
publication to:
State Board of Equalization
Research & Statistics Section
450 N Street, MIC:67
P.O. Box 942879
Sacramento, CA 94279-0067

TAXABLE SALES IN CALIFORNIA 2016
Taxable transactions in California totaled Measured in constant dollars, 2016 taxable
$649.1 billion in 2016. This was an increase of sales increased by 3.2 percent. The California
$15.2 billion, or 2.4 percent, from taxable sales Taxable Sales Deflator showed an inflation rate
in 2015. of -0.8 percent for the year.
2016 Taxable Sales by Quarter
Growth in Actual Dollars Compared to Growth in Constant Dollars
Quarter
Taxable Transactions Percent Change From Prior Year in
Amount (Dollars) Percent of
Total
Actual
Dollars
Constant Value
Dollars
California Taxable
Sales Deflator
January-March $151,082,185,156 23.3% 3.2% 4.4% -1.1%
April-June $163,814,868,075 25.2% 2.2% 3.4% -1.2%
July-September $164,671,639,673 25.4% 1.8% 2.8% -1.0%
October- $169,510,678,101 26.1% 2.5% 2.2% 0.3%
December
Annual $649,079,371,005 100.00% 2.4% 3.2% -0.8%
1

List of Tables
Table Page 1 Statewide Taxable Sales, By Type of Business ........................................... 32 Taxable Sales, By County ........................................................................... 4
Taxable Sales, By City ................................................................................ 5
To see the expanded web version of the Taxable Sales Report, please visit www.boe.ca.gov. TheTaxable Sales Report webpage, http://www.boe.ca.gov/news/tsalescont15.htm, contains detailedinformation by type of business for counties, cities, unincorporated areas, and unallocated sales.
Table3 Taxable Sales in California Counties by Type of Business4 Taxable Sales in California Cities by Type of Business5 Taxable Sales in Unincorporated Areas, by Type of Business6 Taxable Sales Allocated Countywide, by Type of Business
Notice
Beginning in 2015, the outlet counts in this report show the number of outlets that were active during the reporting period. Retailers that operate part-time are now tabulated with store retailers. Industry-level data for 2015 are not comparable to that of prior years; therefore, we will not publish year-over year percentage changes until 2016.
2

TABLE 1. STATEWIDE TAXABLE SALES, BY TYPE OF BUSINESS, 2016
Per capita taxable
transactions a/
Number of Percent
outlets in 2012
2016Taxable transactions Percent of change from
NAICS Type of business Amount total year to year 2016 2015
Retail and Food Services
441 Motor Vehicle and Parts Dealers 35,439 $84,225,652,029 12.98 4.8 $2,156.33 $2,056.41
44111 New Car Dealers 2,565 62,567,019,467 9.64 4.1 1,601.83 1,538.48
44112 Used Car Dealers 8,784 9,502,557,945 1.46 10.2 243.28 220.71
4412 Other Motor Vehicle Dealers 2,885 4,345,787,708 .67 6.9 111.26 104.04
4413 Automotive Parts, Accessories and Tire Stores 21,205 7,810,286,909 1.20 3.5 199.96 193.18
442 Furniture and Home Furnishings Stores 20,410 12,790,040,930 1.97 5.1 327.45 311.48
4421 Furniture Stores 9,123 8,208,835,274 1.26 4.2 210.16 201.59
4422 Home Furnishings Stores 11,287 4,581,205,656 .71 6.7 117.29 109.89
443 Electronics and Appliance Stores 25,161 17,120,029,935 2.64 4.7 438.30 418.45
444 Building Material and Garden Equipment and 18,259 35,238,332,762 5.43 4.9 902.16 860.01Supplies
4441 Building Material and Supplies Dealers 11,753 31,870,670,109 4.91 4.7 815.95 778.77
4442 Lawn and Garden Equipment and Supplies Stores 6,506 3,367,662,653 .52 6.1 86.22 81.24
445 Food and Beverage Stores 35,221 27,678,056,007 4.26 2.0 708.61 694.47
44511 Supermarkets and Other Grocery Stores 11,014 19,290,666,387 2.97 1.4 493.88 486.68
44512 Convenience Stores 5,755 2,933,516,368 .45 0.1 75.10 75.04
4452 Specialty Food Stores 11,182 1,138,397,674 .18 9.6 29.14 26.59
4453 Beer, Wine, and Liquor Stores 7,270 4,315,475,578 .66 4.0 110.48 106.18
446 Health and Personal Care Stores 41,108 13,163,568,763 2.03 6.5 337.01 316.46
44611 Pharmacies and Drug Stores 9,426 7,128,964,377 1.10 2.9 182.51 177.24
44612-44619 Health and Personal Care Stores 31,682 6,034,604,386 .93 10.9 154.50 139.23
447 Gasoline Stations 10,179 43,273,082,077 6.67 -10.2 1,107.87 1,233.72
448 Clothing and Clothing Accessories Stores 106,575 39,698,156,197 6.12 3.3 1,016.34 983.79
4481 Clothing Stores 81,183 31,333,395,766 4.83 3.1 802.19 777.69
4482 Shoe Stores 5,929 4,433,695,975 .68 5.6 113.51 107.45
4483 Jewelry, Luggage, and Leather Goods Stores 19,463 3,931,064,456 .61 2.0 100.64 98.65
451 Sporting Goods, Hobby, Musical Instruments, 36,193 11,441,555,505 1.76 0.9 292.92 290.27Book Stores
45111 Sporting Goods Stores 11,538 5,402,968,992 .83 3.5 138.33 133.66
45112-45114 Hobby, Toy and Musical Instrument Stores 13,936 4,126,266,944 .64 -0.5 105.64 106.16
4512 Book Stores and News Dealers 10,719 1,912,319,569 .29 -3.0 48.96 50.45
452 General Merchandise Stores 27,025 48,255,569,497 7.43 -0.2 1,235.43 1,238.02
453 Miscellaneous Store Retailers 187,503 19,617,819,990 3.02 -1.2 502.25 508.11
4531 Florists 6,666 568,050,490 .09 1.8 14.54 14.27
45321 Office Supplies and Stationery Stores 2,625 3,895,012,119 .60 -3.3 99.72 103.08
45322 Gift, Novelty, and Souvenir Stores 33,910 1,886,169,587 .29 5.1 48.29 45.94
4533 Used Merchandise Stores 31,735 967,536,752 .15 2.9 24.77 24.06
4539 Other Miscellaneous Store Retailers 112,567 12,301,051,042 1.90 -1.8 314.93 320.76
454 Nonstore Retailers 57,405 11,717,406,778 1.81 22.9 299.99 243.95
722 Food Services and Drinking Places 111,249 78,494,623,434 12.09 6.2 2,009.60 1,891.15
7223 Special Food Services 17,478 3,733,239,931 .58 12.3 95.58 85.09
7224 Drinking Places (Alcoholic Beverages) 3,072 1,652,377,206 .25 9.0 42.30 38.81
722511 Full-Service Restaurants 36,247 39,880,429,582 6.14 5.7 1,021.01 966.05
722513-722515 Limited-Service Eating Places 54,452 33,228,576,715 5.12 6.1 850.71 801.20
Total Retail and Food Services 711,727 442,713,893,904 68.21 2.6 11,334.26 11,046.31
All Other Outlets .00 0.00
11 Agriculture, Forestry, Fishing and Hunting 4,543 827,103,313 .13 -2.3 21.18 21.66
21 Mining, Quarrying, and Oil and Gas Extraction 520 507,278,833 .08 -21.8 12.99 16.60
22 Utilities 805 799,320,573 .12 -19.0 20.46 25.24
23 Construction 16,744 11,197,941,209 1.73 -6.6 286.69 306.96
31 - 33 Manufacturing 69,540 42,884,239,579 6.61 0.7 1,097.91 1,090.35
42 Wholesale Trade 112,891 74,743,923,139 11.52 2.0 1,913.58 1,875.04
48 - 49 Transportation and Warehousing 5,404 2,076,466,950 .32 5.8 53.16 50.23
51 Information 9,759 9,233,916,081 1.42 -5.3 236.40 249.52
52 Finance and Insurance 2,568 1,645,427,372 .25 1.1 42.13 41.65
53 Real Estate and Rental and Leasing 20,039 24,686,920,531 3.80 9.3 632.03 578.06
54 Professional, Scientific, and Technical Services 49,281 6,198,444,176 .95 4.8 158.69 151.32
55 Management of Companies and Enterprises 155 61,638,492 .01 38.3 1.58 1.14
56 Administrative and Support and Waste 15,268 3,194,800,996 .49 7.9 81.79 75.79Management and Remediation Services
61 Educational Services 9,419 1,083,232,685 .17 1.0 27.73 27.45
62 Health Care and Social Assistance 10,072 1,401,378,900 .22 4.3 35.88 34.37
71 Arts, Entertainment, and Recreation 16,852 3,526,730,162 .54 3.5 90.29 87.24
721 Accommodation 2,886 4,284,745,184 .66 3.2 109.70 106.24
81 Other Services (except Public Administration) 77,910 9,599,886,319 1.48 4.4 245.77 235.38
92 Public Administration 1,648 695,860,374 .11 17.2 17.82 15.19
Others Others 152 7,716,222,233 1.19 5.0 197.55 188.03
Total All Other Outlets 426,456 206,365,477,101 31.79 2.0 5,283.32 5,177.46
Total All Outlets 1,138,183 $649,079,371,005 100.00 2.4 $16,617.58 $16,223.76
NOTE: Detail may not compute to total due to rounding.
a/ Per capita taxable sales were derived by dividing annual 2016 self-assessed taxable sales by the population estimates of the State Department of Finance for July 1, 2016.
3

TABLE 2. TAXABLE SALES, BY COUNTY, 2016
Number of outlets in 2016 Taxable transactionsOutlets: Sales:
Outlets: Outside Sales: Outside
Incorporated incorporated Outlets: Outlets: Incorporated incorporated Sales: Sales:
County cities cities Unallocated Total cities cities Unallocated b/ Total
Alameda 42,396 2,301 102 44,799 $25,711,616,404 $829,570,658 $4,417,292,810 $30,958,479,872
Alpine 0 84 0 84 0 12,620,301 44,534,918 57,155,219
Amador 750 759 13 1,522 137,219,741 242,877,601 68,398,047 448,495,389
Butte 5,283 2,076 22 7,381 2,418,151,776 333,899,553 449,247,038 3,201,298,367
Calaveras 215 1,998 16 2,229 66,631,233 233,372,028 79,488,199 379,491,460
Colusa 403 231 1 635 164,117,318 159,856,847 56,196,493 380,170,658
Contra Costa 20,971 3,046 47 24,064 12,521,363,236 960,058,767 2,443,169,513 15,924,591,516
Del Norte 275 302 6 583 107,347,040 83,591,014 55,391,233 246,329,287
El Dorado 1,830 4,878 52 6,760 776,224,021 1,011,006,429 397,576,227 2,184,806,677
Fresno 16,859 3,344 327 20,530 10,838,176,259 1,544,041,603 1,691,028,389 14,073,246,251
Glenn 650 319 3 972 238,972,715 80,657,086 73,631,182 393,260,983
Humboldt 3,091 2,392 44 5,527 1,342,631,233 552,554,318 233,145,869 2,128,331,420
Imperial 3,082 454 21 3,557 1,754,778,590 330,001,064 374,203,921 2,458,983,575
Inyo 422 392 6 820 164,745,596 122,331,073 62,619,589 349,696,258
Kern 11,971 6,401 184 18,556 8,302,032,981 3,836,955,469 1,746,654,554 13,885,643,004
Kings 1,839 412 40 2,291 1,165,533,305 313,203,306 243,770,539 1,722,507,150
Lake 662 1,253 14 1,929 247,485,221 236,945,927 108,296,042 592,727,190
Lassen 313 344 3 660 134,060,793 78,017,628 121,373,062 333,451,483
Los Angeles 290,659 19,438 1,198 311,295 129,654,557,772 5,454,870,902 19,098,904,383 154,208,333,057
Madera 1,483 1,569 64 3,116 781,640,721 488,958,816 270,925,511 1,541,525,048
Marin 9,050 1,833 58 10,941 3,930,493,369 420,304,985 694,986,197 5,045,784,551
Mariposa 0 689 12 701 0 169,093,917 31,633,420 200,727,337
Mendocino 1,626 2,466 53 4,145 759,089,805 505,730,008 160,122,781 1,424,942,594
Merced 3,032 1,080 55 4,167 1,794,812,419 585,702,482 399,841,859 2,780,356,760
Modoc 156 217 3 376 41,580,807 16,309,838 35,743,924 93,634,569
Mono 475 232 4 711 182,859,390 48,349,723 49,406,744 280,615,857
Monterey 8,385 3,281 59 11,725 4,981,383,834 921,708,985 762,843,370 6,665,936,189
Napa 4,487 2,087 25 6,599 2,058,606,013 919,914,087 425,376,118 3,403,896,218
Nevada 2,435 2,629 20 5,084 880,501,173 207,683,948 246,212,331 1,334,397,452
Orange 109,543 2,560 374 112,477 54,520,649,031 655,634,104 7,335,138,590 62,511,421,725
Placer 9,289 3,878 60 13,227 6,571,169,522 1,341,371,345 1,008,350,922 8,920,891,789
Plumas 101 1,249 2 1,352 17,672,049 124,053,089 79,050,255 220,775,393
Riverside 51,282 6,163 326 57,771 27,939,090,974 2,473,289,392 3,818,763,501 34,231,143,867
Sacramento 24,307 12,440 168 36,915 13,091,328,034 6,868,169,733 3,225,001,342 23,184,499,109
San Benito 1,104 432 5 1,541 380,544,321 161,738,584 122,168,663 664,451,568
San Bernardino 51,425 5,857 260 57,542 30,192,932,600 2,725,175,379 4,063,585,593 36,981,693,572
San Diego 82,478 12,355 602 95,435 45,697,496,834 2,376,743,482 7,333,626,230 55,407,866,546
San Francisco 30,382 0 44 30,426 16,072,533,551 0 3,324,769,440 19,397,302,991
San Joaquin 11,640 2,861 181 14,682 7,874,564,492 1,521,501,941 1,526,204,724 10,922,271,157
San Luis Obispo 7,461 4,200 63 11,724 3,437,900,381 962,627,607 618,970,180 5,019,498,168
San Mateo 19,924 1,903 72 21,899 11,729,655,343 1,446,450,731 2,482,467,249 15,658,573,323
Santa Barbara 10,965 3,344 101 14,410 5,314,088,345 653,214,478 893,899,180 6,861,202,003
Santa Clara 48,444 1,901 174 50,519 34,690,131,108 401,309,227 6,740,228,454 41,831,668,789
Santa Cruz 5,170 4,662 59 9,891 2,230,026,208 932,214,272 449,033,950 3,611,274,430
Shasta 5,531 2,839 15 8,385 2,308,350,838 330,429,351 319,277,009 2,958,057,198
Sierra 20 113 1 134 3,101,494 8,245,222 10,123,370 21,470,086
Siskiyou 1,508 883 43 2,434 364,501,324 76,363,141 136,461,817 577,326,282
Solano 8,857 539 12 9,408 6,119,882,782 182,286,065 889,929,517 7,192,098,364
Sonoma 13,476 6,687 215 20,378 6,415,053,474 1,563,976,086 1,023,505,973 9,002,535,533
Stanislaus 8,601 2,506 129 11,236 5,619,465,620 1,865,469,734 1,186,689,149 8,671,624,503
Sutter 1,723 437 7 2,167 1,192,635,368 275,164,436 158,524,329 1,626,324,133
Tehama 972 1,038 5 2,015 570,911,064 124,496,123 97,655,284 793,062,471
Trinity 0 790 0 790 0 94,439,719 19,963,999 114,403,718
Tulare 6,566 2,539 127 9,232 5,103,503,395 783,551,651 801,204,596 6,688,259,642
Tuolumne 642 1,427 21 2,090 253,621,727 341,148,162 100,831,175 695,601,064
Ventura 23,737 2,219 205 26,161 11,771,243,352 466,527,903 1,508,178,989 13,745,950,244
Yolo 3,983 651 12 4,646 3,042,526,159 310,912,046 583,706,688 3,937,144,893
Yuba 454 919 6 1,379 155,767,049 260,847,991 108,404,812 525,019,852
Statewide 0 0 6,158 6,158 0 0 407,143,201 407,143,201
TOTAL 972,385 153,899 11,899 1,138,183 $513,836,959,187 $50,027,539,357 $85,214,872,444 $649,079,371,005
b/ Some permittees, by the nature of their business, are not required to allocate local sales or use tax to specific local jurisdictions. Their taxable transactions are listed under the column
headed "Unallocated" in Table 2. Contractors and manufacturers generate most of the countywide unallocable transactions through construction work and making installations of
manufactured products in the various counties.
4
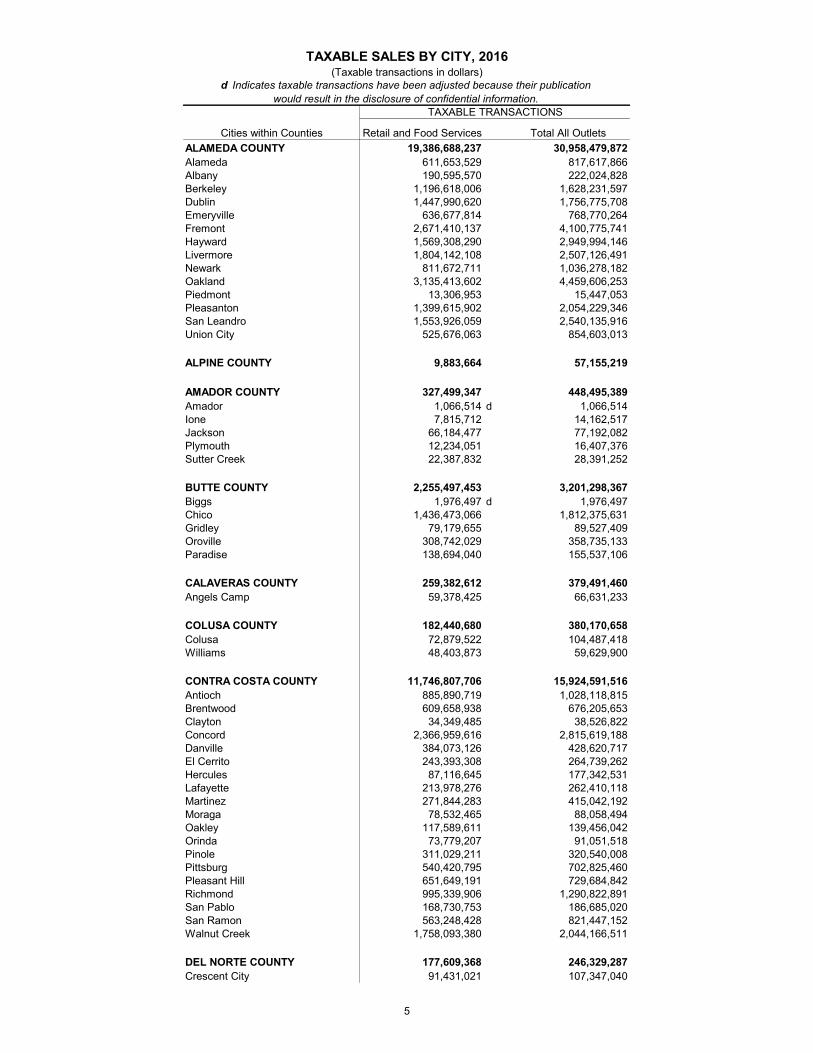
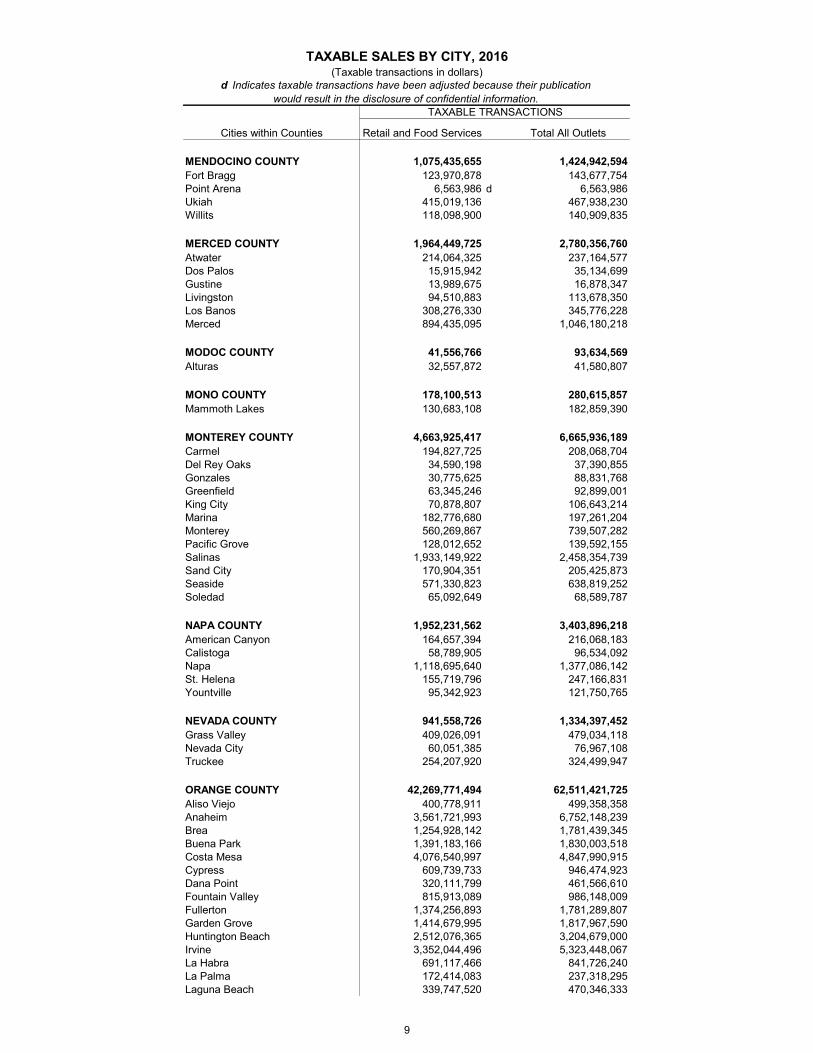
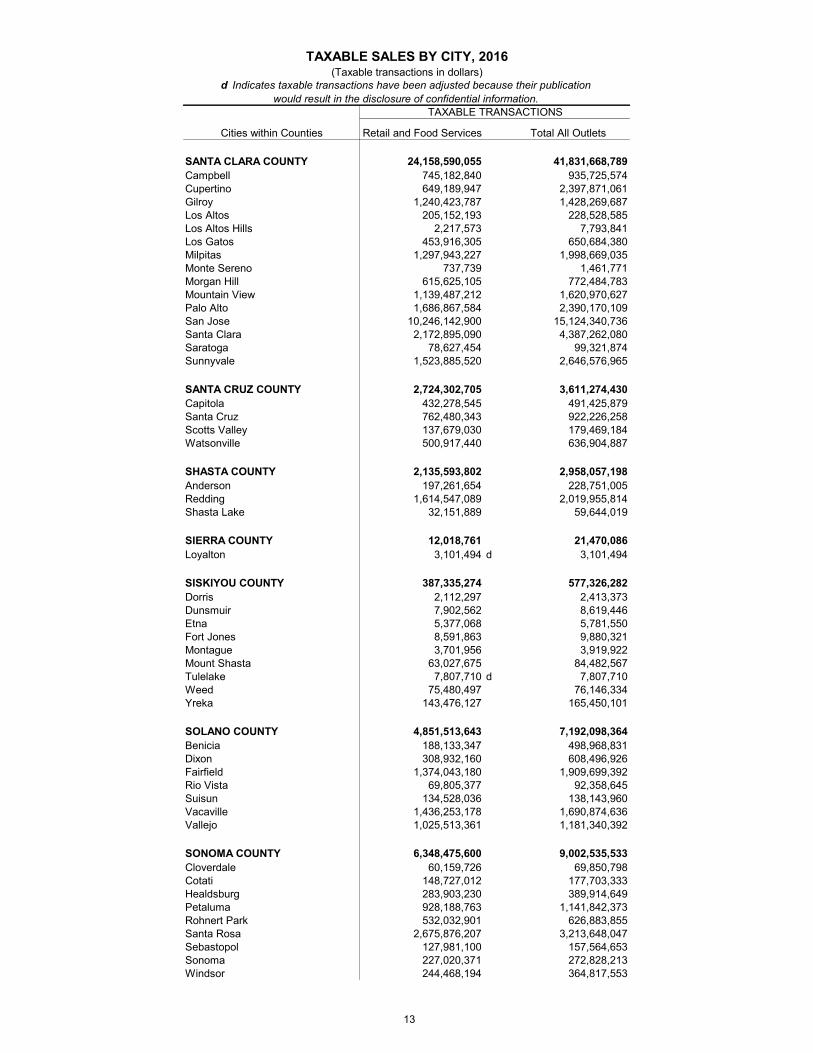
TAXABLE SALES BY CITY, 2016(Taxable transactions in dollars)
d Indicates taxable transactions have been adjusted because their publication
would result in the disclosure of confidential information.
Cities within Counties
TAXABLE TRANSACTIONS
Retail and Food Services IfD Total All Outlets
ALAMEDA COUNTY 19,386,688,237 30,958,479,872
Alameda 611,653,529 817,617,866
Albany 190,595,570 222,024,828
Berkeley 1,196,618,006 1,628,231,597
Dublin 1,447,990,620 1,756,775,708
Emeryville 636,677,814 768,770,264
Fremont 2,671,410,137 4,100,775,741
Hayward 1,569,308,290 2,949,994,146
Livermore 1,804,142,108 2,507,126,491
Newark 811,672,711 1,036,278,182
Oakland 3,135,413,602 4,459,606,253
Piedmont 13,306,953 15,447,053
Pleasanton 1,399,615,902 2,054,229,346
San Leandro 1,553,926,059 2,540,135,916
Union City 525,676,063 854,603,013
ALPINE COUNTY 9,883,664 57,155,219
AMADOR COUNTY 327,499,347 448,495,389
Amador 1,066,514 d 1,066,514
Ione 7,815,712 14,162,517
Jackson 66,184,477 77,192,082
Plymouth 12,234,051 16,407,376
Sutter Creek 22,387,832 28,391,252
BUTTE COUNTY 2,255,497,453 3,201,298,367
Biggs 1,976,497 d 1,976,497
Chico 1,436,473,066 1,812,375,631
Gridley 79,179,655 89,527,409
Oroville 308,742,029 358,735,133
Paradise 138,694,040 155,537,106
CALAVERAS COUNTY 259,382,612 379,491,460
Angels Camp 59,378,425 66,631,233
COLUSA COUNTY 182,440,680 380,170,658
Colusa 72,879,522 104,487,418
Williams 48,403,873 59,629,900
CONTRA COSTA COUNTY 11,746,807,706 15,924,591,516
Antioch 885,890,719 1,028,118,815
Brentwood 609,658,938 676,205,653
Clayton 34,349,485 38,526,822
Concord 2,366,959,616 2,815,619,188
Danville 384,073,126 428,620,717
El Cerrito 243,393,308 264,739,262
Hercules 87,116,645 177,342,531
Lafayette 213,978,276 262,410,118
Martinez 271,844,283 415,042,192
Moraga 78,532,465 88,058,494
Oakley 117,589,611 139,456,042
Orinda 73,779,207 91,051,518
Pinole 311,029,211 320,540,008
Pittsburg 540,420,795 702,825,460
Pleasant Hill 651,649,191 729,684,842
Richmond 995,339,906 1,290,822,891
San Pablo 168,730,753 186,685,020
San Ramon 563,248,428 821,447,152
Walnut Creek 1,758,093,380 2,044,166,511
DEL NORTE COUNTY 177,609,368 246,329,287
Crescent City 91,431,021 107,347,040
5

TAXABLE SALES BY CITY, 2016(Taxable transactions in dollars)
d Indicates taxable transactions have been adjusted because their publication
would result in the disclosure of confidential information.
Cities within Counties
TAXABLE TRANSACTIONS
Retail and Food Services IfD Total All Outlets
EL DORADO COUNTY 1,559,351,181 2,184,806,677
Placerville 320,797,806 371,676,078
South Lake Tahoe 340,394,887 404,547,943
FRESNO COUNTY 9,567,617,679 14,073,246,251
Clovis 1,555,633,415 1,757,621,129
Coalinga 52,695,426 73,558,837
Firebaugh 21,635,664 72,726,971
Fowler 56,691,600 127,108,810
Fresno 5,881,289,041 7,625,682,530
Huron 12,995,589 14,067,360
Kerman 119,711,815 164,174,900
Kingsburg 70,710,445 88,904,759
Mendota 32,429,677 46,852,322
Orange Cove 12,204,473 14,244,533
Parlier 29,381,941 34,207,138
Reedley 119,586,543 152,853,775
San Joaquin 7,418,445 16,765,160
Sanger 148,229,421 186,794,820
Selma 395,393,277 462,613,215
GLENN COUNTY 230,313,327 393,260,983
Orland 113,351,627 130,798,403
Willows 83,417,089 108,174,312
HUMBOLDT COUNTY 1,589,169,278 2,128,331,420
Arcata 187,453,636 231,090,307
Blue Lake 878,912 2,758,799
Eureka 747,774,456 908,123,078
Ferndale 13,567,164 15,950,385
Fortuna 125,248,132 161,109,586
Rio Dell 11,337,808 12,247,036
Trinidad 11,221,196 11,352,042
IMPERIAL COUNTY 1,600,491,229 2,458,983,575
Brawley 135,098,693 189,667,784
Calexico 357,313,554 373,308,411
Calipatria 6,492,849 8,769,017
El Centro 786,053,684 963,356,427
Holtville 15,050,188 26,128,952
Imperial 131,792,547 182,499,659
Westmorland 11,048,340 d 11,048,340
INYO COUNTY 243,196,157 349,696,258
Bishop 138,534,701 164,745,596
KERN COUNTY 8,566,623,320 13,885,643,004
Arvin 38,109,626 61,355,134
Bakersfield 4,673,367,156 5,737,514,021
California City 30,333,787 31,566,066
Delano 377,983,188 483,218,760
Maricopa 2,168,059 d 2,168,059
McFarland 23,113,470 33,907,723
Ridgecrest 248,471,996 272,793,177
Shafter 638,298,915 1,257,383,820
Taft 69,890,240 103,929,082
Tehachapi 193,794,352 203,355,605
Wasco 97,972,539 114,841,534
6

TAXABLE SALES BY CITY, 2016(Taxable transactions in dollars)
d Indicates taxable transactions have been adjusted because their publication
would result in the disclosure of confidential information.
Cities within Counties
TAXABLE TRANSACTIONS
Retail and Food Services IfD Total All Outlets
KINGS COUNTY 1,089,733,336 1,722,507,150
Avenal 19,486,012 26,710,323
Corcoran 46,222,272 89,813,458
Hanford 743,146,822 894,050,926
Lemoore 114,305,162 154,958,598
LAKE COUNTY 444,512,066 592,727,190
Clearlake 128,212,795 135,580,905
Lakeport 104,010,254 111,904,316
LASSEN COUNTY 203,551,863 333,451,483
Susanville 126,965,193 134,060,793
LOS ANGELES COUNTY 109,997,043,138 154,208,333,057
Agoura Hills 273,179,106 337,046,944
Alhambra 1,224,708,122 1,387,136,786
Arcadia 856,473,318 973,420,791
Artesia 186,902,585 218,327,201
Avalon 79,551,037 85,296,882
Azusa 340,457,433 437,554,771
Baldwin Park 433,826,848 523,462,348
Bell 141,875,705 190,340,852
Bell Gardens 219,103,816 249,719,524
Bellflower 441,668,095 515,073,049
Beverly Hills 2,370,447,582 2,852,104,361
Bradbury 408,520 d 408,520
Burbank 2,206,373,373 2,824,714,191
Calabasas 292,758,979 432,514,779
Carson 1,419,587,377 2,096,547,209
Cerritos 2,296,311,922 2,877,126,231
Claremont 291,514,796 323,328,075
Commerce 1,019,275,074 1,698,800,501
Compton 509,588,980 715,697,753
Covina 727,527,959 812,122,794
Cudahy 62,295,567 106,811,610
Culver City 1,461,467,484 1,699,318,708
Diamond Bar 247,981,924 433,615,518
Downey 1,374,776,873 1,678,320,152
Duarte 427,856,277 479,831,866
El Monte 1,280,044,368 1,480,105,386
El Segundo 691,874,911 1,029,352,951
Gardena 785,657,315 965,883,589
Glendale 3,191,203,748 3,842,145,824
Glendora 657,438,163 732,786,788
Hawaiian Gardens 69,991,103 79,408,971
Hawthorne 990,021,191 1,219,468,516
Hermosa Beach 216,757,697 245,581,729
Hidden Hills 401,018 d 401,018
Huntington Park 481,373,034 588,900,759
Industry 1,661,395,606 2,736,372,684
Inglewood 907,530,599 1,196,470,278
Irwindale 106,185,954 329,059,096
La Canada-Flintridge 209,286,492 233,188,433
La Habra Heights 340,893 3,442,452
La Mirada 611,654,404 912,522,675
La Puente 247,125,384 267,567,244
La Verne 271,764,147 370,931,278
Lakewood 1,133,889,045 1,180,458,964
Lancaster 1,266,224,649 1,711,539,869
Lawndale 215,261,155 247,048,530
Lomita 126,433,154 146,412,672
Long Beach 3,898,816,454 5,044,905,792
Los Angeles 34,355,804,181 44,980,230,260
7
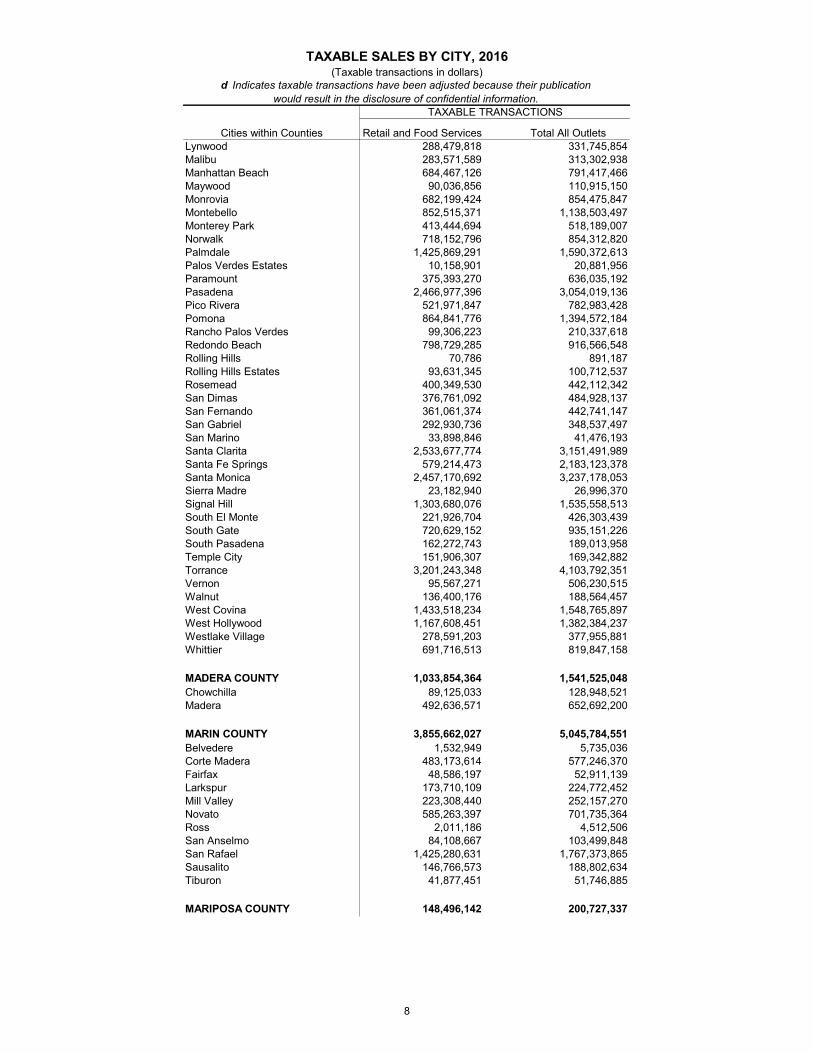
TAXABLE SALES BY CITY, 2016(Taxable transactions in dollars)
d Indicates taxable transactions have been adjusted because their publication
would result in the disclosure of confidential information.
Cities within Counties
TAXABLE TRANSACTIONS
Retail and Food Services IfD Total All Outlets
Lynwood 288,479,818 331,745,854
Malibu 283,571,589 313,302,938
Manhattan Beach 684,467,126 791,417,466
Maywood 90,036,856 110,915,150
Monrovia 682,199,424 854,475,847
Montebello 852,515,371 1,138,503,497
Monterey Park 413,444,694 518,189,007
Norwalk 718,152,796 854,312,820
Palmdale 1,425,869,291 1,590,372,613
Palos Verdes Estates 10,158,901 20,881,956
Paramount 375,393,270 636,035,192
Pasadena 2,466,977,396 3,054,019,136
Pico Rivera 521,971,847 782,983,428
Pomona 864,841,776 1,394,572,184
Rancho Palos Verdes 99,306,223 210,337,618
Redondo Beach 798,729,285 916,566,548
Rolling Hills 70,786 891,187
Rolling Hills Estates 93,631,345 100,712,537
Rosemead 400,349,530 442,112,342
San Dimas 376,761,092 484,928,137
San Fernando 361,061,374 442,741,147
San Gabriel 292,930,736 348,537,497
San Marino 33,898,846 41,476,193
Santa Clarita 2,533,677,774 3,151,491,989
Santa Fe Springs 579,214,473 2,183,123,378
Santa Monica 2,457,170,692 3,237,178,053
Sierra Madre 23,182,940 26,996,370
Signal Hill 1,303,680,076 1,535,558,513
South El Monte 221,926,704 426,303,439
South Gate 720,629,152 935,151,226
South Pasadena 162,272,743 189,013,958
Temple City 151,906,307 169,342,882
Torrance 3,201,243,348 4,103,792,351
Vernon 95,567,271 506,230,515
Walnut 136,400,176 188,564,457
West Covina 1,433,518,234 1,548,765,897
West Hollywood 1,167,608,451 1,382,384,237
Westlake Village 278,591,203 377,955,881
Whittier 691,716,513 819,847,158
MADERA COUNTY 1,033,854,364 1,541,525,048
Chowchilla 89,125,033 128,948,521
Madera 492,636,571 652,692,200
MARIN COUNTY 3,855,662,027 5,045,784,551
Belvedere 1,532,949 5,735,036
Corte Madera 483,173,614 577,246,370
Fairfax 48,586,197 52,911,139
Larkspur 173,710,109 224,772,452
Mill Valley 223,308,440 252,157,270
Novato 585,263,397 701,735,364
Ross 2,011,186 4,512,506
San Anselmo 84,108,667 103,499,848
San Rafael 1,425,280,631 1,767,373,865
Sausalito 146,766,573 188,802,634
Tiburon 41,877,451 51,746,885
MARIPOSA COUNTY 148,496,142 200,727,337
8
TAXABLE SALES BY CITY, 2016(Taxable transactions in dollars)
d Indicates taxable transactions have been adjusted because their publication
would result in the disclosure of confidential information.
Cities within Counties
TAXABLE TRANSACTIONS
Retail and Food Services IfD Total All Outlets
MENDOCINO COUNTY 1,075,435,655 1,424,942,594
Fort Bragg 123,970,878 143,677,754
Point Arena 6,563,986 d 6,563,986
Ukiah 415,019,136 467,938,230
Willits 118,098,900 140,909,835
MERCED COUNTY 1,964,449,725 2,780,356,760
Atwater 214,064,325 237,164,577
Dos Palos 15,915,942 35,134,699
Gustine 13,989,675 16,878,347
Livingston 94,510,883 113,678,350
Los Banos 308,276,330 345,776,228
Merced 894,435,095 1,046,180,218
MODOC COUNTY 41,556,766 93,634,569
Alturas 32,557,872 41,580,807
MONO COUNTY 178,100,513 280,615,857
Mammoth Lakes 130,683,108 182,859,390
MONTEREY COUNTY 4,663,925,417 6,665,936,189
Carmel 194,827,725 208,068,704
Del Rey Oaks 34,590,198 37,390,855
Gonzales 30,775,625 88,831,768
Greenfield 63,345,246 92,899,001
King City 70,878,807 106,643,214
Marina 182,776,680 197,261,204
Monterey 560,269,867 739,507,282
Pacific Grove 128,012,652 139,592,155
Salinas 1,933,149,922 2,458,354,739
Sand City 170,904,351 205,425,873
Seaside 571,330,823 638,819,252
Soledad 65,092,649 68,589,787
NAPA COUNTY 1,952,231,562 3,403,896,218
American Canyon 164,657,394 216,068,183
Calistoga 58,789,905 96,534,092
Napa 1,118,695,640 1,377,086,142
St. Helena 155,719,796 247,166,831
Yountville 95,342,923 121,750,765
NEVADA COUNTY 941,558,726 1,334,397,452
Grass Valley 409,026,091 479,034,118
Nevada City 60,051,385 76,967,108
Truckee 254,207,920 324,499,947
ORANGE COUNTY 42,269,771,494 62,511,421,725
Aliso Viejo 400,778,911 499,358,358
Anaheim 3,561,721,993 6,752,148,239
Brea 1,254,928,142 1,781,439,345
Buena Park 1,391,183,166 1,830,003,518
Costa Mesa 4,076,540,997 4,847,990,915
Cypress 609,739,733 946,474,923
Dana Point 320,111,799 461,566,610
Fountain Valley 815,913,089 986,148,009
Fullerton 1,374,256,893 1,781,289,807
Garden Grove 1,414,679,995 1,817,967,590
Huntington Beach 2,512,076,365 3,204,679,000
Irvine 3,352,044,496 5,323,448,067
La Habra 691,117,466 841,726,240
La Palma 172,414,083 237,318,295
Laguna Beach 339,747,520 470,346,333
9

TAXABLE SALES BY CITY, 2016(Taxable transactions in dollars)
d Indicates taxable transactions have been adjusted because their publication
would result in the disclosure of confidential information.
Cities within Counties
TAXABLE TRANSACTIONS
Retail and Food Services IfD Total All Outlets
Laguna Hills 398,501,995 500,167,229
Laguna Niguel 823,611,328 945,523,541
Laguna Woods 75,806,284 78,486,497
Lake Forest 878,939,522 1,281,117,487
Los Alamitos 197,345,377 268,046,171
Mission Viejo 1,298,595,965 1,539,348,805
Newport Beach 2,246,838,137 3,053,220,467
Orange 2,358,325,438 3,601,966,374
Placentia 366,439,332 562,598,976
Rancho Santa Margarita 457,784,085 575,369,267
San Clemente 633,815,299 768,392,967
San Juan Capistrano 562,273,139 677,821,296
Santa Ana 2,935,193,537 4,134,901,957
Seal Beach 318,628,557 347,398,984
Stanton 278,594,403 348,879,487
Tustin 1,695,120,338 2,000,351,009
Villa Park 17,170,142 20,498,820
Westminster 1,275,638,366 1,462,671,321
Yorba Linda 445,876,865 571,983,127
PLACER COUNTY 6,814,514,819 8,920,891,789
Auburn 498,309,129 563,363,914
Colfax 83,470,128 99,453,869
Lincoln 255,629,078 284,523,521
Loomis 49,259,037 101,169,900
Rocklin 850,846,200 1,096,719,328
Roseville 3,749,782,142 4,425,938,990
PLUMAS COUNTY 121,319,251 220,775,393
Portola 12,757,544 17,672,049
RIVERSIDE COUNTY 24,022,135,984 34,231,143,867
Banning 167,190,769 192,448,599
Beaumont 358,145,758 414,905,694
Blythe 131,548,168 150,103,621
Calimesa 56,959,840 63,981,872
Canyon Lake 17,058,204 20,819,933
Cathedral City 682,509,766 790,201,916
Coachella 235,308,558 299,236,206
Corona 1,934,927,042 3,396,904,713
Desert Hot Springs 114,147,306 125,456,238
Eastvale 359,099,187 633,525,987
Hemet 880,318,650 1,015,877,183
Indian Wells 31,117,152 106,586,606
Indio 810,097,811 986,137,073
Jurupa Valley 522,339,695 888,189,666
La Quinta 631,677,761 724,252,253
Lake Elsinore 689,897,148 791,622,096
Menifee 553,478,816 628,922,616
Moreno Valley 1,393,342,220 1,571,730,422
Murrieta 1,137,130,416 1,340,131,454
Norco 467,463,094 565,885,558
Palm Desert 1,343,984,790 1,618,077,531
Palm Springs 832,237,026 1,067,027,518
Perris 651,021,801 980,763,276
Rancho Mirage 337,142,348 459,544,320
Riverside 4,091,743,586 5,507,804,929
San Jacinto 224,461,238 244,673,182
Temecula 2,366,625,586 3,208,193,015
Wildomar 128,370,251 146,087,497
10

TAXABLE SALES BY CITY, 2016(Taxable transactions in dollars)
d Indicates taxable transactions have been adjusted because their publication
would result in the disclosure of confidential information.
Cities within Counties
TAXABLE TRANSACTIONS
Retail and Food Services IfD Total All Outlets
SACRAMENTO COUNTY 16,016,855,902 23,184,499,109
Citrus Heights 931,920,379 1,000,839,013
Elk Grove 1,931,315,093 2,158,382,408
Folsom 1,550,541,133 1,782,959,458
Galt 143,061,032 190,956,727
Isleton 2,079,334 9,412,131
Rancho Cordova 945,115,049 1,503,313,642
Sacramento 4,446,755,517 6,445,464,655
SAN BENITO COUNTY 387,568,767 664,451,568
Hollister 310,543,607 364,171,467
San Juan Bautista 14,342,162 16,372,854
SAN BERNARDINO COUNTY 24,242,145,292 36,981,693,572
Adelanto 115,928,829 d 115,928,829
Apple Valley 478,465,872 513,422,375
Barstow 628,840,720 644,374,497
Big Bear Lake 182,228,607 198,217,795
Chino 989,385,480 2,106,056,388
Chino Hills 544,387,719 644,051,540
Colton 538,711,918 744,222,181
Fontana 2,335,650,318 3,134,791,734
Grand Terrace 42,682,878 75,811,642
Hesperia 633,121,334 745,094,452
Highland 184,430,977 199,430,751
Loma Linda 305,504,487 565,765,269
Montclair 1,014,135,472 1,161,548,293
Needles 37,426,276 d 37,426,276
Ontario 4,634,312,401 8,124,275,646
Rancho Cucamonga 1,894,037,404 2,486,030,486
Redlands 941,204,543 1,117,829,403
Rialto 598,369,600 941,403,608
San Bernardino 2,415,645,605 2,947,080,197
Twentynine Palms 87,169,870 100,517,595
Upland 952,215,450 1,175,962,991
Victorville 1,671,388,394 1,820,652,666
Yucaipa 252,662,686 294,465,002
Yucca Valley 284,360,836 298,572,984
SAN DIEGO COUNTY 38,576,362,614 55,407,866,546
Carlsbad 2,155,107,454 2,857,832,984
Chula Vista 2,381,364,338 2,676,901,392
Coronado 165,484,045 294,902,836
Del Mar 152,594,550 193,341,896
El Cajon 1,689,726,350 2,166,328,408
Encinitas 977,800,592 1,109,798,722
Escondido 2,445,179,525 3,094,211,975
Imperial Beach 77,745,245 83,674,228
La Mesa 1,003,560,961 1,087,581,670
Lemon Grove 384,752,276 439,490,239
National City 1,378,584,214 1,568,105,797
Oceanside 1,433,141,157 1,719,339,543
Poway 745,388,825 1,125,623,868
San Diego 16,631,386,014 23,038,448,785
San Marcos 1,090,330,285 1,366,625,056
Santee 664,077,603 1,084,596,035
Solana Beach 238,423,459 268,623,234
Vista 986,288,242 1,522,070,166
SAN FRANCISCO 13,222,461,658 19,397,302,991
11

TAXABLE SALES BY CITY, 2016(Taxable transactions in dollars)
d Indicates taxable transactions have been adjusted because their publication
would result in the disclosure of confidential information.
Cities within Counties
TAXABLE TRANSACTIONS
Retail and Food Services IfD Total All Outlets
SAN JOAQUIN COUNTY 7,380,226,048 10,922,271,157
Escalon 63,287,354 74,535,165
Lathrop 169,154,577 240,571,745
Lodi 779,583,075 947,638,486
Manteca 782,817,552 964,422,828
Ripon 197,503,996 231,476,761
Stockton 2,928,311,906 3,879,746,894
Tracy 1,280,960,519 1,536,172,613
SAN LUIS OBISPO COUNTY 3,533,460,200 5,019,498,168
Arroyo Grande 289,335,846 319,036,376
Atascadero 283,912,648 320,085,796
Grover Beach 95,246,419 122,299,034
Morro Bay 129,915,312 144,859,344
Paso Robles 680,460,580 848,540,303
Pismo Beach 238,621,857 253,522,181
San Luis Obispo 1,182,401,114 1,429,557,347
SAN MATEO COUNTY 10,394,054,757 15,658,573,323
Atherton 8,348,712 21,300,131
Belmont 217,718,599 288,887,341
Brisbane 133,478,091 363,466,338
Burlingame 741,286,153 1,036,935,734
Colma 902,113,105 963,298,297
Daly City 921,262,797 992,068,475
East Palo Alto 285,671,479 315,354,378
Foster City 194,189,390 244,546,522
Half Moon Bay 179,727,338 227,440,730
Hillsborough 2,602,066 8,497,535
Menlo Park 301,180,592 471,557,541
Millbrae 192,728,805 233,802,628
Pacifica 167,091,429 177,763,664
Portola Valley 13,511,075 20,320,939
Redwood City 1,367,606,739 1,911,881,518
San Bruno 622,129,741 669,850,836
San Carlos 612,867,473 880,950,128
San Mateo 1,343,306,027 1,606,175,533
South San Francisco 719,852,389 1,248,679,785
Woodside 39,511,379 46,877,290
SANTA BARBARA COUNTY 4,856,924,127 6,861,202,003
Buellton 151,502,082 186,088,936
Carpinteria 122,654,243 165,451,636
Goleta 565,713,842 782,767,483
Guadalupe 15,646,391 30,769,953
Lompoc 325,587,610 382,265,051
Santa Barbara 1,506,322,317 1,870,902,401
Santa Maria 1,365,716,879 1,782,826,667
Solvang 88,020,033 113,016,218
12
TAXABLE SALES BY CITY, 2016(Taxable transactions in dollars)
d Indicates taxable transactions have been adjusted because their publication
would result in the disclosure of confidential information.
Cities within Counties
TAXABLE TRANSACTIONS
Retail and Food Services IfD Total All Outlets
SANTA CLARA COUNTY 24,158,590,055 41,831,668,789
Campbell 745,182,840 935,725,574
Cupertino 649,189,947 2,397,871,061
Gilroy 1,240,423,787 1,428,269,687
Los Altos 205,152,193 228,528,585
Los Altos Hills 2,217,573 7,793,841
Los Gatos 453,916,305 650,684,380
Milpitas 1,297,943,227 1,998,669,035
Monte Sereno 737,739 1,461,771
Morgan Hill 615,625,105 772,484,783
Mountain View 1,139,487,212 1,620,970,627
Palo Alto 1,686,867,584 2,390,170,109
San Jose 10,246,142,900 15,124,340,736
Santa Clara 2,172,895,090 4,387,262,080
Saratoga 78,627,454 99,321,874
Sunnyvale 1,523,885,520 2,646,576,965
SANTA CRUZ COUNTY 2,724,302,705 3,611,274,430
Capitola 432,278,545 491,425,879
Santa Cruz 762,480,343 922,226,258
Scotts Valley 137,679,030 179,469,184
Watsonville 500,917,440 636,904,887
SHASTA COUNTY 2,135,593,802 2,958,057,198
Anderson 197,261,654 228,751,005
Redding 1,614,547,089 2,019,955,814
Shasta Lake 32,151,889 59,644,019
SIERRA COUNTY 12,018,761 21,470,086
Loyalton 3,101,494 d 3,101,494
SISKIYOU COUNTY 387,335,274 577,326,282
Dorris 2,112,297 2,413,373
Dunsmuir 7,902,562 8,619,446
Etna 5,377,068 5,781,550
Fort Jones 8,591,863 9,880,321
Montague 3,701,956 3,919,922
Mount Shasta 63,027,675 84,482,567
Tulelake 7,807,710 d 7,807,710
Weed 75,480,497 76,146,334
Yreka 143,476,127 165,450,101
SOLANO COUNTY 4,851,513,643 7,192,098,364
Benicia 188,133,347 498,968,831
Dixon 308,932,160 608,496,926
Fairfield 1,374,043,180 1,909,699,392
Rio Vista 69,805,377 92,358,645
Suisun 134,528,036 138,143,960
Vacaville 1,436,253,178 1,690,874,636
Vallejo 1,025,513,361 1,181,340,392
SONOMA COUNTY 6,348,475,600 9,002,535,533
Cloverdale 60,159,726 69,850,798
Cotati 148,727,012 177,703,333
Healdsburg 283,903,230 389,914,649
Petaluma 928,188,763 1,141,842,373
Rohnert Park 532,032,901 626,883,855
Santa Rosa 2,675,876,207 3,213,648,047
Sebastopol 127,981,100 157,564,653
Sonoma 227,020,371 272,828,213
Windsor 244,468,194 364,817,553
13

TAXABLE SALES BY CITY, 2016(Taxable transactions in dollars)
d Indicates taxable transactions have been adjusted because their publication
would result in the disclosure of confidential information.
Cities within Counties
TAXABLE TRANSACTIONS
Retail and Food Services IfD Total All Outlets
STANISLAUS COUNTY 5,667,430,476 8,671,624,503
Ceres 376,911,346 514,908,229
Hughson 12,529,478 91,481,327
Modesto 2,205,519,148 2,753,051,369
Newman 28,043,364 41,524,077
Oakdale 239,517,841 298,699,132
Patterson 177,213,447 376,042,392
Riverbank 252,857,493 275,571,059
Turlock 921,174,317 1,221,243,206
Waterford 32,202,602 46,944,829
SUTTER COUNTY 1,173,846,040 1,626,324,133
Live Oak 26,346,716 26,936,857
Yuba City 997,515,602 1,165,698,511
TEHAMA COUNTY 607,771,142 793,062,471
Corning 239,577,994 248,210,676
Red Bluff 292,122,149 322,468,213
Tehama 232,175 d 232,175
TRINITY COUNTY 84,689,354 114,403,718
TULARE COUNTY 4,377,472,157 6,688,259,642
Dinuba 679,487,059 735,622,712
Exeter 63,231,084 75,100,310
Farmersville 41,576,984 46,840,590
Lindsay 52,355,829 73,032,512
Porterville 483,102,188 544,289,696
Tulare 679,004,267 871,219,527
Visalia 1,789,552,542 2,720,119,265
Woodlake 17,935,871 37,278,783
TUOLUMNE COUNTY 514,505,087 695,601,064
Sonora 229,664,536 253,621,727
VENTURA COUNTY 9,774,879,703 13,745,950,244
Camarillo 1,058,877,602 1,292,236,327
Fillmore 89,721,532 699,133,120
Moorpark 277,186,807 349,102,577
Ojai 82,451,514 121,127,648
Oxnard 2,085,890,067 2,639,291,038
Port Hueneme 84,876,362 93,517,350
Santa Paula 171,308,193 228,712,506
Simi Valley 1,271,428,463 1,508,864,247
Thousand Oaks 2,101,604,545 2,632,274,439
Ventura 1,805,630,158 2,206,984,100
YOLO COUNTY 2,281,956,678 3,937,144,893
Davis 605,147,410 657,094,415
West Sacramento 611,413,747 1,354,102,099
Winters 44,200,304 47,065,835
Woodland 732,949,909 984,263,810
YUBA COUNTY 360,294,850 525,019,852
Marysville 111,860,221 140,720,740
Wheatland 13,430,465 15,046,309
14