Embed Size (px)
Citation preview

Estudos e Documentos de Trabalho
Working Papers
31 | 2010
EMPLOYMENT AND WAGES OF IMMIGRANTS IN PORTUGAL
Sónia CabralCláudia Duarte
December 2010
The analyses, opinions and fi ndings of these papers represent the views of the authors, they are not necessarily those of the Banco de Portugal or the Eurosystem.
Please address correspondence to
Sónia Cabral
Banco de Portugal, Av. Almirante Reis no. 71, 1150-012 Lisboa, Portugal;
Tel.: 351 21 313 0992, Email: [email protected]

BANCO DE PORTUGAL
Edition
Economics and Research Department
Av. Almirante Reis, 71-6th
1150-012 Lisboa
www.bportugal.pt
Pre-press and Distribution
Administrative Services Department
Documentation, Editing and Museum Division
Editing and Publishing Unit
Av. Almirante Reis, 71-2nd
1150-012 Lisboa
Printing
Administrative Services Department
Logistics Division
Lisbon, December 2010
Number of copies
170
ISBN 978-989-678-058-6
ISSN 0870-0117
Legal Deposit no. 3664/83

Employment and wages of immigrants in Portugal∗
Sónia Cabral
Banco de Portugal
Cláudia Duarte
Banco de Portugal
December 2010
Abstract
Using matched employer-employee data, we examine the main characteristics of immigrants in the Por-
tuguese labour market in the 2002-2008 period. We find substantial differences in labour market outcomes
between native and immigrant workers and among different nationality groups, in terms of age, gender, tenure,
worker flows, geographical and sectoral concentration, andeducation levels. As in other countries, the wages
of immigrants in Portugal are lower than the wages of natives, though growing at a higher pace in the period
analysed. Moreover, downward wage rigidity appears to be slightly higher for immigrants than for natives.
Keywords: Immigration, Employment, Wages, Matched employer-employee data,
Portuguese economy
JEL Codes: F22, J31, J61
∗The authors thank João Amador, Mário Centeno, Paulo Estevesand Pedro Portugal for their comments and suggestions. We alsothank Lucena Vieira for excellent computational assistance. The opinions expressed in the paper are those of the authors and do notnecessarily coincide with those of Banco de Portugal or the Eurosystem. Any errors and omissions are the sole responsibility of theauthors. Address: Banco de Portugal, Economics and Research Department, R. Francisco Ribeiro 2, 1150-165 Lisboa - Portugal. E-mails:[email protected] and [email protected]
1

1 Introduction
Portugal has traditionally been a country of emigration andsignificant immigration flows
began much more recently (Figure 1). The first important waveof large-scale migration in
Portugal was of a political nature, as it occurred after the Revolution of 1974 with the mass
return of Portuguese citizens from former colonies in Africa. In the following years and until
the mid-nineties, immigration in Portugal was relatively modest in international terms, com-
prising mainly nationals from Portuguese speaking countries. Immigration flows accelerated
in the end-nineties, partly reflecting the high demand in theconstruction sector, and a sub-
stantial part of these arrivals originated from Central andEastern European countries, with
no particular historical or cultural link with Portugal, and also from Brazil. These recent im-
migration flows in Portugal were of irregular and economic nature, linked with employment
opportunities, and hence tend to have a high rate of activity.
Figure 1: Net migration rate in Portugal
-30
-20
-10
0
10
20
30
40
50
1956 1960 1964 1968 1972 1976 1980 1984 1988 1992 1996 2000 2004 2008
Per th
ou
san
d o
f to
tal p
op
ula
tion
Source: OECD.Note: Net migration is defined as the total number of immigrant nationals and foreigners minus the total number of emigrant foreignersand nationals. Arrivals and departures for purposes such astourism and business travel are not included. The net migration rate isexpressed per thousand of total population.
The impact of immigration on the labour market of the receiving country is an issue that has
been much debated for several years and there is an extensivestrand of the literature devoted
to it, firstly focusing on the US but also, more recently, on several European countries. The
strong increase of immigration flows of low-skilled individuals into developed countries has
revived the study of immigration issues in last years. In brief, the literature has focused in
two different but interrelated broad questions (see Borjas(1994), Borjas (1999), Card (2005)
and Jean et al. (2010) for comprehensive surveys on the economics of immigration). First,
how do immigrants perform in the host country? It is commonlyobserved that immigrants
earn less upon arrival than comparable native workers. The imperfect portability of human
capital and experience acquired in the origin country, as well as the lack of fluency in the
2

destination language were found to be important determinants of this wage gap (see, for
instance, Friedberg (2000) and Adsera and Chiswick (2007)). Over time, the wage disadvan-
tage tends to diminish as experience in the host economy increases but earnings assimilation
differs across nationalities and, in some countries, the catching up is never complete (see
Izquierdo et al. (2009) for a recent analysis of the case of Spain). Second, what is the impact
of immigrants on native wages and employment? In a competitive labour market, an increase
in the supply of immigrant workers should result in a lower wage or higher unemployment
of natives whose skills are substitute and impact positively the natives with complementary
skills. However, empirically there is no consensus and, depending on the data and method-
ology, some studies have found a negative and significant effect in native wages (like the
seminal work of Borjas (2003)) but the majority of studies does not obtain a sizeable ef-
fect on employment and wages of natives (see Longhi et al. (2005) for a survey and, more
recently, Ottaviano and Peri (2008) for a discussion).
At present, empirical evidence on the behaviour of immigrants in the Portuguese labour
market is relatively scarce, probably also reflecting the novelty of the phenomenon. Some
exceptions are Carneiro et al. (2010) who study the determinants of earnings of immigrants
in 2003-2004 using a longitudinal database and OECD (2008a) that provides a comprehen-
sive analysis of the main features of recent immigration in Portugal. This paper aims at
contributing to this literature, by providing a detailed portrait of recent immigration in the
Portuguese labour market. It adopts a fully empirical approach, describing and examining
the main characteristics of immigrant workers in Portugal,with an emphasis on wages. We
use matched employer-employee data from a longitudinal dataset (Quadros de Pessoal) from
2002 to 2008, focusing the analysis in the full-time employees segment and differentiating
the results by main nationality groups within immigrant workers. All workers in illegal and
irregular situations are, by definition, excluded from the analysis, leading to an underesti-
mation of immigrants in the Portuguese labour market. A comparative analysis of wage
developments (levels and growth) for natives and major immigrant groups over the period is
included, with a breakdown by main sectors of activity of immigrant employment. In this
context, differences between natives and immigrants in terms of wage rigidity are assessed
by using the International Wage Flexibility Project (IWFP)methodology.
The article is organized as follows. Section 2 describes briefly the evolution of recent im-
migration in Portugal, comparing some of the characteristics of immigrants in Portugal with
those observed for other OECD countries. Section 3 describes the database and the main
features of immigrants relative to those of native workers.Section 4 focuses on comparing
the wages of immigrants and natives. After a short presentation of the methodology for the
calculation of the wage rigidity measures, the results for both immigrants and natives are
reported in section 5. Finally, section 6 presents some concluding remarks.
3

2 Immigration in Portugal in the international context
Portugal has traditionally been a country of emigration, with sustained and large-scale out-
flows until 1974 (Figure 1). The end of the dictatorship in 1974 and the following indepen-
dence of Portugal’s colonies in Africa led to a mass return ofmigrants from these countries,
most of them with Portuguese nationality, the so-calledretornados. The migration of there-
tornadosresulted in the return of more than half a million persons, increasing the Portuguese
labour force by around 10 per cent in three years (see Carrington and de Lima (1996) for an
analysis of the impact of these migration flows from Africa onthe Portuguese labour market).
In the following years and until the mid-nineties, immigration flows in Portugal were modest
on an international scale and included mainly persons from Portuguese speaking countries in
Africa (PALOP) and Brazil.1 Nationals from Cape Verde constituted the largest immigrant
community in Portugal over the nineties, representing morethan 20 per cent of the total
foreign population. In the late nineties, immigration accelerated, driven by high and unmet
labour demand resulting from the strong dynamics in the construction sector, linked with
major infrastructure projects, and in some services sectors. There was also a change in the
composition of the flow of immigrants, with a substantial share of this recent immigration
originating from Central and Eastern European countries, with no apparent link with Portu-
gal, and also from Brazil (Figure 2). Immigrants from Central and Eastern Europe mainly
came from Ukraine but also from Romania and Moldova (see Baganha et al. (2004) for a
portrait of these recent migration flows from Eastern Europeto Portugal). In 2008, Brazilian
nationals were the major immigrant community in Portugal accounting for more than 24 per
cent of total immigrants, followed by nationals from Cape Verde and Ukraine, both with
individual shares of almost 12 per cent.
Most of these recent immigration flows in Portugal were of irregular nature, as evinced by
the series of regularisations that occurred since 2000. In fact, following the large inflows of
irregular migrants since the late nineties, a regularisation process occurred in 2001 (see Mar-
ques and Góis (2007) for a description of recent Portuguese immigration policies). With this
new legislative framework, Portugal started to adopt an universal approach to the different
immigrant groups, moving away from the preferential treatment traditionally given to im-
migrants from Portuguese-speaking countries. The 2001 legalization was directed towards
immigrants working in Portugal, although without the necessary documents, in contrast with
previous regularisation processes, which were directed toall immigrants irrespective of their
status in the labour market. In addition, this legalizationprocess remained open from Jan-
uary 2001 until November 2001, thus covering both immigrants already working in Portugal
and those immigrants who where able to come to Portugal and find work until the end of this
period. This regularisation was of an extraordinary scale,contributing to an increase in the1PALOP (Países Africanos de Língua Oficial Portuguesa) refers to the former Portuguese colonies in Africa (Angola, Cape Verde,
Guinea Bissau, Mozambique, and São Tomé and Príncipe).
4

stock of the legal foreign population in Portugal of around 70 per cent in 2001, as can be
seen in Figure 2. Most of the immigrant workers that benefitedfrom the 2001 regularisation
came from Central and Eastern European countries, in particular from Ukraine. As a result
of this regularisation process, the share of immigrants from Central and Eastern Europe in
the total foreign population legally residing in Portugal increased from 0.6 per cent in 2000
to 20.2 per cent in 2001.
Figure 2: Stock of foreign population in Portugalas a percentage of total population
0.0
0.5
1.0
1.5
2.0
2.5
3.0
3.5
4.0
4.5
5.0
1988 1990 1992 1994 1996 1998 2000 2002 2004 2006 2008
Per
cen
t
PALOP EU15 CEEC Brazil China Other Total
Source: OECD.Note: PALOP refers to the former Portuguese colonies in Africa (Angola, Cape Verde, Guinea-Bissau, Mozambique, and SãoTomé andPríncipe). CEEC includes Belarus, Bulgaria, Moldova, Romania, Russian Federation and Ukraine.
There are major differences in how immigrants are defined across countries (see, for instance,
Parsons et al. (2007) for a discussion on the quality and comparability of international data
on migration). Nationality and place of birth are the two criteria most commonly used to
define the immigrant population. The foreign-born population covers all persons who have
ever migrated from their country of birth to their current country of residence. The foreign
population consists of persons who still have the nationality of their home country, but it may
include persons born in the host country. Dealing with former colonies poses an additional
difficulty in the international comparison of data on migration, since there can be a substan-
tial difference between the stocks of foreign and foreign-born populations. In countries like
Portugal and France, the foreign-born population includesa significant proportion of per-
sons born abroad as national citizens and repatriated from former colonies. Historically, the
number of naturalisations in Portugal has been very low, so the difference in levels between
the two stocks mostly reflects the arrival of repatriates after the 1974 revolution and the evo-
lution of both series is very similar in the most recent period (Figure 3). These foreign-born
with Portuguese nationality should not be considered as migrants to evaluate the impact of
immigration on the domestic labour market outcomes, since they now share most of the rel-
5

evant characteristics with the native population. So, our definition of immigrants throughout
this paper focus on the nationality criterion, with the exception of some international data on
immigrants’ characteristics from census data that is only available for foreign-born popula-
tions. For instance, OECD (2008b) include a comprehensive and detailed comparison of the
profile of foreign-born populations in OECD countries usingCensus 2001 data.
Figure 3: Foreign-born population and foreign population in Portugalas a percentage of total population
0
1
2
3
4
5
6
7
8
1998 1999 2000 2001 2002 2003 2004 2005 2006 2007
Per
cen
t
Foreign-born population Foreign population
Source: OECD.
In international terms, the share of immigrants in total population in Portugal is relatively
low, representing around 4 per cent in 2007, with traditional destination countries like Lux-
embourg and Switzerland showing the highest shares (Figure4). As in other Southern Eu-
ropean countries, like Spain and Italy, and in other new immigration countries in Europe,
such as Ireland and Greece, immigration in Portugal is a recent but growing phenomenon.
As already mentioned, recent immigrant flows in Portugal were linked with employment
opportunities and hence, tend to have a high labour market attachment. In a cross-country
comparison, the strong labour-market orientation of recent immigrants in Portugal clearly
stands out. Portugal has one of the highest employment ratesof immigrants among OECD
countries, higher than that of natives for both men and women. However, immigrants in Por-
tugal seem to be more affected than natives by downturns in economic activity. Dustmann
et al. (2010) show that there is a larger cyclical response ofunemployment for immigrants
than for natives in Germany and the UK, even within narrowly defined skill groups. As
discussed in OECD (2008a), a good picture on the evolution of immigrants unemployment
over time in Portugal is hampered by the limited number of immigrants in the labour force
survey. Nevertheless, as can be seen in Figure 5, the unemployment rate of immigrants is
always higher than that of natives since 1998 and increases faster in periods of economic
recession.
6
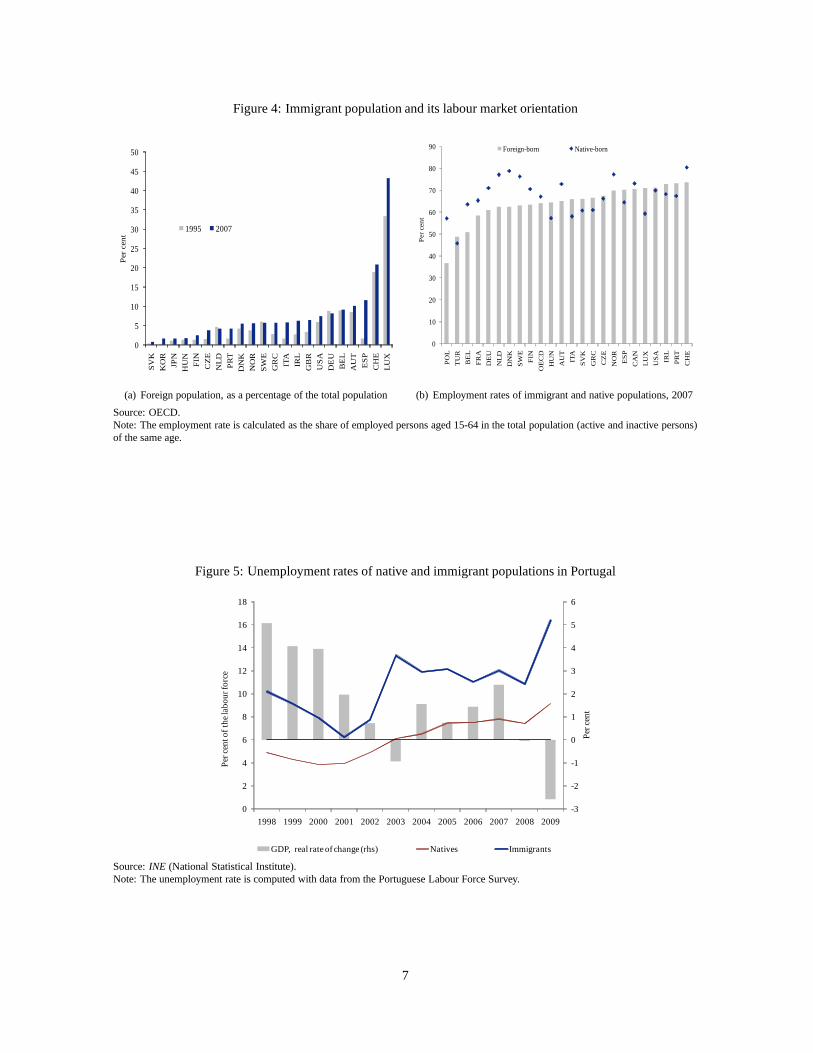
Figure 4: Immigrant population and its labour market orientation
0
5
10
15
20
25
30
35
40
45
50S
VK
KO
R
JPN
HU
N
FIN
CZ
E
NLD
PR
T
DN
K
NO
R
SW
E
GR
C
ITA
IRL
GB
R
US
A
DE
U
BE
L
AU
T
ES
P
CH
E
LU
X
Per
cen
t 1995 2007
(a) Foreign population, as a percentage of the total population
0
10
20
30
40
50
60
70
80
90
PO
L
TU
R
BE
L
FR
A
DE
U
NLD
DN
K
SW
E
FIN
OE
CD
HU
N
AU
T
ITA
SV
K
GR
C
CZ
E
NO
R
ES
P
CA
N
LU
X
US
A
IRL
PR
T
CH
E
Per
cen
t
Foreign-born Native-born
(b) Employment rates of immigrant and native populations, 2007
Source: OECD.Note: The employment rate is calculated as the share of employed persons aged 15-64 in the total population (active and inactive persons)of the same age.
Figure 5: Unemployment rates of native and immigrant populations in Portugal
-3
-2
-1
0
1
2
3
4
5
6
0
2
4
6
8
10
12
14
16
18
1998 1999 2000 2001 2002 2003 2004 2005 2006 2007 2008 2009
Per
cen
t
Per
cen
t of t
he
lab
ou
r fo
rce
GDP, real rate of change (rhs) Natives Immigrants
Source:INE (National Statistical Institute).Note: The unemployment rate is computed with data from the Portuguese Labour Force Survey.
7

3 Main characteristics of employed immigrants in Portugal
The main database used in this paper isQuadros de Pessoal(QP), a longitudinal dataset
matching workers and firms based in Portugal. The data are made available by the Ministry
of Labour and Social Solidarity, drawing on an annual mandatory employment survey that
covers virtually all establishments with wage earners in Portugal in a reference month (Octo-
ber). Reported data cover the establishment itself (location, economic activity, employment,
etc), the firm (location, economic activity, employment, sales, etc) and each of its workers
(gender, age, education, skill, occupation, tenure, worker status, hours worked, earnings,
etc). The information on earnings is very complete, including the base wage (gross pay for
normal hours of work), regular and irregular wage benefits and overtime pay.
The worker-level data covers all years since 1982, except for 1990 and 2001, but information
on the nationality of the worker only starts in 2000, so our sample period starts in 2002 and
ends in 2008. The exact nationality at the country level of the worker is the only information
available that helps to identify migrant workers in QP, since neither the place of birth nor the
year of arrival in Portugal are recorded. Nevertheless, given the nature of recent immigra-
tion in Portugal and the low naturalisation rate, this seemsa reasonable approximation of the
target population. Since some workers do not report their nationality in every year consid-
ered, we further assumed that individuals that declare at least once to be foreign nationals are
immigrants and maintain that nationality throughout the whole period (see D’Amuri et al.
(2010) for a similar assumption).
OECD data based on residence permits estimates that the foreign population in Portugal
amounts to around 440 thousand individuals in 2008, while immigrant workers in the QP
database used here are about 170 thousands (Table 1). The QP dataset does not cover do-
mestic work. This fact can have some impact on the results since many foreign women in
Portugal are linked to this sector. However, the longitudinal database made available by In-
stituto de Informática (Portuguese social security data-processing office) includes domestic
work but its share in total employment is around 0.01 per cent on average for both natives and
immigrants in the 2002-2007 period, which suggests that most people in this sector work in
the informal economy. In addition, all workers in illegal and irregular situations are excluded
from the analysis given the lack of information on these individuals in the QP database, lead-
ing to an underestimation of immigrants in the Portuguese labour market. Nevertheless, the
detailed characteristics of the QP database make it especially suitable to study the evolution
of immigration in the Portuguese labour market. Peixoto (2008) and Carneiro et al. (2010)
also use the QP to examine different aspects of recent immigration flows in Portugal. Peixoto
(2008) provides a descriptive analysis of employed immigrants in 2004 and Carneiro et al.
(2010) study the assimilation of immigrants in the Portuguese labour market in 2003-2004.
In addition, OECD (2008a) provides a very comprehensive study of the main features of
8

immigration in the Portuguese labour market using different databases including the QP.
Some additional filters were imposed on the database to eliminate erroneous, inconsistent
or missing reports. First, the analysis was restricted to individuals for whom there was
information available for a set of key variables, such as gender, age, nationality, sector of
activity and tenure. Second, we further restricted our sample to non-apatrid workers, aged
between 15 and 80 years and with a job tenure below 65 years. Inthe case of full-time
employees, we only considered those that reported a base wage above 80 per cent of the
minimum legal wage. Whenever a worker was present more than once in a given year we
kept the register corresponding to maximum earnings or maximum hours worked.
Table 1: Employment status of natives and immigrants in Portugal, levels and shares in percentage, 2008
Immigrants Share in total Level Share Level Share Level Share
Employer 4.1 200,226 7.3 191,965 7.4 8,261 4.8Unpaid family worker 5.1 1,039 0.0 986 0.0 53 0.0Employee 6.4 2,540,078 92.2 2,376,675 92.0 163,403 94.7
Full-time 6.3 2,409,333 87.5 2,258,521 87.5 150,812 87.4Part-time 9.6 130,745 4.7 118,154 4.6 12,591 7.3
Other 6.6 13,597 0.5 12,705 0.5 892 0.5
Total 6.3 2,754,940 100 2,582,331 100 172,609 100
Total Natives Immigrants
Sources:Quadros de Pessoaland authors’ calculations.Note: In the case of full-time employees, we only consideredthose that reported a base wage above 80 per cent of the minimum legalwage.
Dependent employment constitutes the main contractual form in the Portuguese labour mar-
ket, representing 92 per cent of total employment for natives and 94.7 per cent for immi-
grants in 2008 (Table 1).2 Full-time contracts have a similar incidence between natives and
immigrants but immigrants have a higher proportion of part-time jobs. In 2008, a higher
percentage of natives appears as employers, 7.4 per cent compared to 4.8 per cent for im-
migrants. The lower share of immigrants in self-employmentin Portugal contrasts with
evidence found in other countries where immigrants tend to be over-represented among the
self-employed (see Borjas (1986) for the US, Clark and Drinkwater (2000) for England and
Wales and Andersson and Wadensjo (2004) for Denmark and Sweden).3 In the Portuguese
labour market, the most notable difference between immigrants and natives relates to the na-
ture of the contract, i.e., permanent versus fixed-term (Figure 6). Considering only full-time
employees, 51.7 per cent of immigrant workers had fixed-term contracts, which are typically
associated with jobs with lower wages, compared to 24.6 per cent for native employees in2Table 1 includes only information for 2008, but the employment structure is similar over the 2002-2008 period. All yearly data is
available from the authors upon request.3Evidence on higher rates of self-employment among natives than immigrants is also obtained using data from the Portuguese Labour
Force Survey (comprising the self-employed with and without employees), although with substantial differences in levels reflecting thedifferent coverage of the two databases. According to this database, 24.1 per cent of employed natives are self-employed, on average,compared to 11.9 per cent for immigrants in the period 2002-2008.
9

2008. However, fixed-term contracts have been steadily gaining importance in the employ-
ment structure of native workers over this period, which canbe seen as a consequence of the
relative rigidity of permanent contracts in Portugal (see,for instance, Portugal (1999)). By
main nationality groups, the proportion of workers with fixed-term contracts in 2008 is the
highest for Brazilians (63.6 per cent) and it increased since 2006. An increasing incidence of
temporary contracts is also evident in workers from China though less markedly. Immigrants
from Central and Eastern European countries (CEEC) have also a significant share of fixed-
term contracts but it declined over this period from 67.1 per cent in 2002 to 56.9 per cent in
2008.4 Immigrants from the PALOP have a below average percentage offixed-term contracts
but it rose since 2005, from 40 per cent to 45.4 per cent in 2008. Finally, immigrants from
the other 14 initial Member-States of European Union (EU15)have a much lower proportion
of temporary contracts over the whole period (around 30 per cent).
Figure 6: Permanent and fixed-term contracts of natives and immigrants in Portugalshares in total full-time employment
0
10
20
30
40
50
60
70
80
2002 2003 2004 2005 2006 2007 2008
Per
cen
t
Natives - Permanent contract Natives -Fixed-term contract
Immigrants -Permanent contract Immigrants - Fixed-term contract
(a) Permanent and fixed-term contracts, shares in total
0
10
20
30
40
50
60
70
80
2002 2003 2004 2005 2006 2007 2008
Per
cen
t
PALOP CEEC EU15 Brazil China
(b) Fixed-term contracts, shares in total
Sources:Quadros de Pessoaland authors’ calculations.
The remainder of the analysis of this paper will focus on the full-time employees segment.
Full-time employed immigrants in Portugal increased by 46.2 per cent in cumulative terms
from 2002 to 2008, an average annual growth rate of 6.5 per cent. Hence, the share of
immigrants in full-time employees in Portugal increased from 5.2 per cent in 2002 to 6.3
per cent in 2008. Immigrants from Brazil had an impressive growth of 161 per cent in
cumulative terms over this period (average annual rate of 17.3 per cent), which translated into
an increase of their share in total immigrant employees from15.1 per cent in 2002 to 26.9
per cent in 2008 and made them the major single nationality group in Portuguese dependent
employment (Figure 7). Immigrants from China also grew steadily over this period, but
still represent a small proportion of total immigrants in Portugal (less than 2 per cent in4CEEC (Central and Eastern European countries) in the QP database includes Slovakia, Poland, Czech Republic, Hungary, Estonia,
Slovenia, Latvia, Lithuania, Romania, Russian Federation, Moldova, Ukraine and Serbia.
10

2008). On the contrary, the number of immigrants from CEEC remained almost stable over
this period, showing even negative rates of change since 2006, in line with the slowdown
of economic activity in some sectors. The strong inflows fromCEEC at the end of the
nineties were largely driven by labour market opportunities, specially in the construction
sector. Immigrants from Ukraine, the major nationality within the CEEC, declined by 18.1
per cent in cumulative terms over the 2002-2008 period, accounting for 13.1 per cent of total
immigrants in 2008 (23.3 per cent in 2002). In contrast, inflows from Romania, the second
major CEEC origin, continued to grow over this period, with its share in total full-time
immigrant worker increasing from 3.9 per cent in 2002 to 4.5 per cent in 2008. Immigrants
from the PALOP maintained their share in total around 24 per cent over this period, but
there was a decline in the share of employees from Angola (to 7.6 per cent in 2008) and an
increase in the percentage of immigrants from Cape Verde (to8.1 per cent in 2008). Finally,
immigration from the EU15 grew slightly below average, in particular since 2007, resulting
in a small decline of its share in total from 9 per cent in 2002 to 8.5 per cent in 2008. Within
the EU15, the main countries of origin of immigrants are France, Spain, Germany and the
United Kingdom. Summing up, immigration in Portugal is currently rather concentrated in
three main geographical origins, Brazil, PALOP and CEEC, each with a share above 20 per
cent of total and representing together 74.5 per cent of total full-time immigrant employees
in 2008 (73.3 per cent in 2002).
Figure 7: Main nationalities of immigrant employment in Portugal
90
110
130
150
170
190
210
230
250
270
2002 2003 2004 2005 2006 2007 2008
Inde
x 20
02 =
100
PALOP CEEC EU15 Brazil China
(a) Cumulative growth
0
5
10
15
20
25
30
35
40
2002 2003 2004 2005 2006 2007 2008
Per
cen
t
PALOP CEEC EU15 Brazil China
(b) Shares in total
Sources:Quadros de Pessoaland authors’ calculations.
As mentioned in other studies, immigrant workers in Portugal are slightly younger than
natives (Table 2). Full-time employees with less than 35 years account for 44 per cent of total
natives but represent 50.5 per cent of immigrants in the period 2002-2008. This difference is
higher in the case of workers from China and especially from Brazil. In the case of Brazilian
workers, 62.5 per cent of them have less than 35 years and almost 50 per centis aged between
11

25 and 34 years. The percentage of females in immigrant employment is lower than in
native employment, representing 34.8 and 43.1 per cent of total in this period, respectively.
However, the exclusion of domestic work from the analysis tends to underestimate female
employment in Portugal. For instance, OECD data based on residence permits of the foreign
population in Portugal shows a percentage of females of 40.6 per cent on average in the
period 2002-2008 (47.3 per cent in 2008). Looking at the main origins of immigrants, the
share of female workers is higher in the case of the EU15 and Cape Verde (43.3 per cent
in both cases) and lower in the case of CEEC and, particularly, Ukraine (23.6 per cent).
However, from 2002 to 2008 there was an increase in the proportion of females in dependent
employment in Portugal, common to all main nationalities but especially sharp in the case of
immigrants from CEEC (Figure 8). The share of female workersfrom the CEEC increased
from 20.3 per cent in 2002 to 29.5 per cent in 2008.
Table 2: Age and gender of native and immigrant employees in Portugal, average 2002-2008shares as a percentage
Natives ImmigrantsEU15 PALOP CEEC Brazil China
Cape Verde UkraineAGEAverage 37.8 35.7 36.4 36.5 37.5 36.3 37.2 33.0 34.3
15-24 10.7 10.2 8.3 9.6 12.6 7.6 5.6 15.2 12.325-34 33.3 40.3 43.0 36.0 29.1 39.7 37.8 47.3 41.535-44 28.2 30.7 27.9 34.0 31.1 31.6 33.2 26.6 34.045-54 19.3 15.4 13.8 16.7 21.8 18.7 20.7 9.4 10.855+ 8.6 3.4 7.1 3.7 5.5 2.3 2.7 1.5 1.5
100 100 100 100 100 100 100 100 100GENDERMen 56.9 65.2 56.7 59.4 56.7 75.5 76.4 61.4 64.4Women 43.1 34.8 43.3 40.6 43.3 24.5 23.6 38.6 35.6
100 100 100 100 100 100 100 100 100
Sources:Quadros de Pessoaland authors’ calculations.
As could be expected given the recent nature of most immigrant flows in Portugal, the tenure
of immigrant workers is much lower than that of natives, average of 2.4 and 7.4 years in
the same job over the period 2002-2008, respectively (Table3). Within immigrants, tenure
is higher for workers from the EU15 and, to a lesser extent, from Cape Verde, which are
the immigrant groups that have been longer in the country. The average tenure for other
nationality groups is less than 2 years in this period. The proportion of immigrants with
tenure less than 1 year is 37.7 per cent, which is more than double the share of natives
in the same situation (15.9 per cent on average in this period). In the period 2002-2008,
44 per cent of native workers have tenure up to 3 years, but that proportion increases to
78.7 per cent in the case of immigrants. This result is in line with the higher incidence
of temporary contracts, mostly with a length of 3 years, in immigrant employment. The
share of immigrants with tenure up to 3 years is especially high in workers from China and
12

Figure 8: Proportion of females in immigrant employment by main nationalitiesshares as a percentage
20
25
30
35
40
45
50
2002 2003 2004 2005 2006 2007 2008
Per
cen
t
Immigrants PALOP CEEC EU15 Brazil China
Sources:Quadros de Pessoaland authors’ calculations.
Brazil, 89.7 and 88.2 per cent on average in the period 2002-2008, respectively.A high
percentage of workers from the CEEC also shows a tenure less than or equal to 3 years on
average, but that proportion declined steadily over the period, from 98.7 per cent in 2002
to 76 per cent in 2008 (Figure 9). For workers from Brazil and China, the percentage of
individuals with tenure up to 3 years declined until 2006, but remained stable afterwards
at above 84 per cent. In 2008, 52.1 per cent of Brazilian workers had tenure inferior to 1
year and that share increased strongly in the last two years,while in the case of Ukraine that
share decreased over the period to 35.5 per cent in 2008. Although this evolution can suggest
that migrants from the CEEC have a higher probability of maintaining a job once they get
it, it also reflects the very strong growth of recent migration flows from Brazil in the last
two years. A precise analysis of the differences in labour market outcomes of the various
nationality groups requires controlling for a broad range of characteristics that differentiate
them. As no such control for heterogeneity is made here, these descriptive statistics should
be interpreted with caution.
An analysis of worker flows offers a complementary perspective of immigrant employment,
examining the allocation of workers through hires and separations. Even when aggregate
employment does not change, workers move between jobs or enter/exit the labour force, so
worker rotation rates exceed the rates of job creation and destruction (see Centeno et al.
(2008) for a detailed analysis of worker and job flows in the Portuguese labour market). Fol-
lowing Burgess et al. (2000), total worker flows or turnover refer to all movements of workers
into and out of jobs, i.e., the sum of hires and separations occurring between two years, and
job flows are computed as net job changes, i.e., the difference between hires and separations.
To obtain the corresponding rates, flows are divided by totalaverage employment in the two
13

Table 3: Tenure of native and immigrant employees in Portugal, average 2002-2008shares as a percentage
Natives ImmigrantsEU15 PALOP CEEC Brazil China
Cape Verde Ukraine[0, 3] 44.0 78.7 61.7 74.7 73.5 86.4 85.0 88.2 89.7of which 0 15.9 37.7 24.1 37.6 34.9 38.7 36.0 47.1 44.1
[4, 6] 16.9 12.1 17.8 13.1 13.2 11.2 12.2 8.5 7.8[7, 9] 10.8 3.9 8.8 5.2 5.2 1.4 1.5 1.7 1.5[10, 19] 18.9 4.1 9.6 5.6 5.8 0.4 0.5 1.3 0.8>=20 9.4 1.3 2.1 1.3 2.3 0.5 0.8 0.3 0.1
100 100 100 100 100 100 100 100 100
Average years 7.4 2.4 4.1 2.8 3.1 1.6 1.8 1.4 1.3
Sources:Quadros de Pessoaland authors’ calculations.
Figure 9: Immigrant employees with tenure up to 3 years by main nationalitiesshares as a percentage
70
75
80
85
90
95
100
2002 2003 2004 2005 2006 2007 2008
Per
cen
t
Immigrants PALOP CEEC Brazil China
Sources:Quadros de Pessoaland authors’ calculations.
years. In the 2003-2008 period, worker rotation rates in Portugal are higher for immigrants
than for natives, with both hiring and separation rates showing higher values (Figure 10).
This result is in line with the evidence in Centeno et al. (2008) that worker flows are higher
among younger worker and workers with fixed-term contracts.By main nationality, Chinese
immigrants have particularly high rotation rates, with thehighest hiring and separation rates
over the period. The hiring rate of immigrants from Brazil isalso above 60 per cent, which
partly translates into an important net job creation. In contrast, the hiring rates of workers
from Ukraine are smaller that their separation rates, leading to a net job destruction over this
period. Among immigrants, workers from the EU15 have the lowest rates of worker flows,
but still above those of natives.
As discussed in Burgess et al. (2000), strong worker flows cancoexist with a stable core
of workers that remain in the same firm throughout the whole period. Figure 11 depicts
the retention rates by main nationalities, defined as the percentage of workers who were
14

Figure 10: Hiring and separation rates of native and immigrant employees in Portugal
0
10
20
30
40
50
60
2003 2004 2005 2006 2007 2008
Per ce
nt
Natives - Hiring rate Natives - Separation rate
Immigrants -Hiring rate Immigrants -Separation rate
(a) Natives and immigrants
-10
0
10
20
30
40
50
60
70
Natives Immigrants EU15 PALOP Cape Verde CEEC Ukraine Brazil China
Per cen
t
Job flow rate Hiring rate Separation rate
(b) By main nationalities, average 2003-2008
Sources:Quadros de Pessoaland authors’ calculations.
Figure 11: Workers employed in the same firm from 2002 to 2008shares as a percentage
0
5
10
15
20
25
30
35
Natives Immigrants EU15 PALOP Cape Verde CEEC Ukraine Brazil China
Per
cen
t
Workers employed in the same firm from 2002 to 2008, as a percentage of total employment in 2002
Workers employed in the same firm from 2002 to 2008, as a percentage of total employment in 2008
Sources:Quadros de Pessoaland authors’ calculations.
employed at the beginning of the period, and remain in the same firm at the end of the
period. It shows that around 30 per cent of natives that were employed in 2002 remained in
the same firm until 2008, but that share decreases sharply to 12.9 per cent for immigrants, not
controlling for other factors that differentiate them. Within immigrants, the retention rate is
the highest for workers from the EU15 and the lowest for workers from China, in line with the
magnitude of worker flows for these immigrant groups. The percentage of immigrants from
the CEEC and Brazil that were still employed by the same employer after 7 years amounts
to 7.8 and 10 per cent, respectively. Given the higher worker flowsof Brazilian employees it
could be expected that the retention rate would be lower for them than for workers from the
15

CEEC. However, from 2002 to 2008, the number of Brazilian employees in Portugal grew
strongly, while workers from the CEEC remained stable and these different trends affect
the comparison of their retention rates. The extent of this influence becomes clearer if the
group of workers that remained in the same firm over the whole period is divided by total
employees in 2008, instead of in 2002. In this case, only 3.8 per cent of Brazilians that are
employed in 2008 were already working in the same firm in 2002,compared to 7.8 per cent
for workers from the CEEC.
Table 4: Geographical location of native and immigrant employees in Portugal, average 2002-2008shares as a percentage
Employment Natives Immigrantsrate of change EU15 PALOP CEEC Brazil China
Cape Verde UkraineAveiro 1.8 7.4 4.2 4.2 1.8 0.6 5.4 6.7 3.1 3.0Braga 2.6 8.9 3.3 4.5 1.5 0.5 3.6 4.6 2.1 2.7Faro 6.0 3.2 11.7 18.6 6.0 7.5 18.0 15.9 9.4 13.1Leiria 3.0 4.5 4.5 5.2 1.8 1.9 7.9 10.2 3.5 2.8Lisboa 3.6 31.7 45.3 34.2 67.5 69.9 32.4 28.6 53.0 37.3Porto 3.2 18.8 9.5 12.2 6.2 4.9 7.1 8.2 8.4 16.9Santarém 2.5 3.5 3.3 2.8 1.5 0.9 5.8 6.8 2.9 4.9Setúbal 2.2 4.6 7.3 3.9 8.8 10.2 6.7 4.9 8.9 7.0Others 3.6 17.4 11.0 14.4 4.8 3.6 13.0 14.1 8.6 12.3Total 3.3 100 100 100 100 100 100 100 100 100
Sources:Quadros de Pessoaland authors’ calculations.Note: The rate of change of employment refers to the annual average rate of change of total employment (natives and immigrants) overthe period 2002-2008, as a percentage.
Table 4 shows the regional distribution of immigrants within the country in comparison with
native workers in the 2002-2008 period. The top 3 districts for each nationality group are
highlighted in Table 4, with Lisboa being the main location for all nationality groups con-
sidered. In the case of immigrants, the main three locationsin Portugal are Lisboa, Faro
and Porto, but Setúbal is also an important location. This regional distribution is differ-
ent from that of natives which are more widespread across thecountry and relatively more
concentrated in the North of the country, with Porto and Braga being major locations for
native employment. Immigrants are relatively more concentrated than natives in the Lisboa
district, a district whose total employment grew above average in this period. The second
major location of immigrant workers, Faro, had also a strongincrease in total employment,
the highest of the districts included in Table 4. Immigrantsfrom the PALOP are heavily
concentrated in the Lisboa and Setúbal districts, especially in the case of Cape Verde (80.1
per cent of immigrant workers from Cape Verde are located in these two districts). Workers
from Brazil are also very concentrated in Lisbon (53 per centof total), with Faro, Setúbal
and Porto appearing also as important locations in this period. Porto is the second major
location for Chinese immigrants, with an above-average share of 16.9 per cent, followed by
16

Faro with 13.1 per cent. Workers from the CEEC are relatively more concentrated in Faro,
with Leiria appearing as the third major district for these workers. Faro is also an important
location for immigrants from the EU15, accounting for 18.6 per cent of total workers from
these countries in the period 2002-2008.
Immigrant employment in Portugal is concentrated in a few sectors, namely construction
and some services activities. In contrast, the share of the manufacturing industry in total
immigrant employment is much lower than that in native employment (15.9 and 28.8 per cent
on average in the 2002-2008 period, respectively) and declined from 2002 to 2008 (Figure
12 and Table 5). The main sector of immigrant employment in Portugal is the construction
sector, accounting for 23.9 per cent of the total employment of immigrants in this period
(11.5 per cent for natives). The construction sector is especially relevant for male immigrants
as 35.5 per cent of them are employed in this sector (18.4 per cent for native males) and for
immigrants of the PALOP and, mostly, the CEEC. The high concentration of immigrants in
the construction sector reflects the fact that recent immigration flows in Portugal were partly
driven by strong demand in this sector. However, the proportion of immigrants employed in
construction declined over the 2002-2008 period, in line with the deceleration of activity in
this sector, but the share of native employment remained virtually stable. This fact points to
a higher sensitivity of immigrants employment to the evolution of activity in this sector.
Figure 12: Main sectors of immigrant employment in Portugal
0
5
10
15
20
25
30
35
2002 2003 2004 2005 2006 2007 2008
Per cen
t o
f to
tal i
mm
igra
nt e
mp
loym
en
t
Manufacturing industry ConstructionWholesale and retail trade Hotels and restaurantsReal estate and business services
(a) Immigrants, shares in total
0
5
10
15
20
25
30
35
2002 2003 2004 2005 2006 2007 2008
Per cen
t o
f to
tal n
ative e
mp
loym
en
t
Manufacturing industry ConstructionWholesale and retail trade Hotels and restaurantsReal estate and business services
(b) Natives, shares in total
Sources:Quadros de Pessoaland authors’ calculations.
In the period 2002-2008, the employment share of the services sector as a whole is very
similar for natives and immigrants, representing almost 60per cent of total in both cases,
and has been increasing over time reflecting the shift to services observed in most advanced
economies since the eighties. However, the breakdown within services is very different for
natives and immigrants in Portugal. Immigrants are especially concentrated in three sub-
sectors: hotels and restaurants, real estate and business services, and wholesale and retail
17

Table 5: Main sectors of activity of native and immigrant employees in Portugal, average 2002-2008shares as a percentage
Natives Immigrants
ISIC code EU15 PALOP CEEC Brazil China Natives Immigrants Natives Immigrants
1+2+5 Agriculture, forestry and fishing 1.6 2.6 1.9 0.6 5.2 1.7 0.3 1.8 2.7 1.3 2.3
10-14 Mining and quarrying 0.5 0.4 0.4 0.2 0.9 0.1 0.0 0.8 0.7 0.1 0.1
15-37 Manufacturing industry 28.8 15.9 20.8 8.9 22.0 10.8 1.0 28.5 17.0 29.1 13.8
15-16 Food products, beverages and tobacco 3.6 2.8 2.2 1.8 3.7 2.8 0.0 3.4 2.3 3.9 3.8
17-19 Textiles, clothing, footwear and leather 8.6 2.4 4.0 0.6 2.4 0.7 0.5 4.4 1.6 14.1 3.9
20-22 Wood, cork and paper 3.1 1.5 1.9 0.9 1.9 1.0 0.1 3.8 1.7 2.2 1.0
23-25 Chemicals, including energy 1.9 1.1 1.6 0.7 1.5 0.8 0.1 2.2 1.2 1.5 0.9
26-28 Minerals and metals 5.1 4.3 4.2 2.3 7.7 2.5 0.0 7.0 5.7 2.7 1.7
29-33 Machinery and equipments 3.0 1.7 3.0 1.2 1.9 1.5 0.1 3.5 2.1 2.2 1.1
34+35 Transport equipment 1.6 1.2 2.5 0.9 1.5 0.9 0.0 1.9 1.3 1.1 0.9
36+37 Other manufacturing 1.8 0.9 1.4 0.5 1.4 0.6 0.2 2.3 1.1 1.3 0.6
40+41 Electricity, gas and water supply 0.6 0.1 0.1 0.1 0.1 0.1 0.0 0.9 0.1 0.2 0.1
45 Construction 11.5 23.9 8.1 29.1 32.3 19.4 0.5 18.4 35.5 2.3 2.2
50-99 Services 57.1 57.1 68.7 61.1 39.5 68.0 98.2 49.6 44.1 67.0 81.5
50-52 Wholesale and retail trade 20.0 13.5 19.7 11.1 9.0 15.8 50.0 19.5 11.7 20.7 17.0
55 Hotels and restaurants 6.1 15.3 11.4 14.6 10.7 23.7 46.0 4.2 8.7 8.7 27.7
60 a 64 Transports and communications 5.9 4.3 5.5 2.5 5.3 4.6 0.2 8.1 5.6 3.0 1.7
65-67 Financial intermediation 3.2 0.8 2.2 1.4 0.1 0.5 0.0 3.2 0.6 3.2 1.1
70-74 Real estate and business services 9.6 15.0 12.9 22.9 10.3 14.7 0.9 9.4 13.7 10.0 17.4
75 Public administration 0.9 0.3 0.4 0.4 0.1 0.2 0.0 0.8 0.2 1.1 0.4
80 Education 1.9 1.1 4.9 0.8 0.3 0.5 0.2 0.8 0.5 3.4 2.2
85 Health and social work 5.8 3.6 7.1 4.6 1.4 3.3 0.1 1.2 0.9 11.9 8.7
90-99 Other services 3.6 3.3 4.6 2.9 2.4 4.6 0.8 2.4 2.2 5.1 5.2
100 100 100 100 100 100 100 100 100 100 100
Males Females
Sources:Quadros de Pessoaland authors’ calculations.Note: ISIC refers to the International Standard IndustrialClassification of All Economic Activities.
trade. The first two sub-sectors represent individually around 15 per cent of total immi-
grant employment in this period, a share much higher than that of natives. Both sub-sectors
recorded also an increase of immigrant employment from 2002to 2008. These two sub-
sectors are particularly significant for female immigrants, with shares in total female immi-
grant employment of 27.7 percent for hotels and restaurants and 17.4 per cent for real estate
and business services in this period. Within the real estateand business services, the ma-
jor sub-sectors of immigrant employment are industrial cleaning and labour recruitment and
provision of personnel, which includes temporary work agencies. This sub-sector employs
an especially high share of immigrants from the PALOP (22.9 per cent on average in the pe-
riod), in particular in cleaning services. Around 15 per cent of immigrants from Brazil also
work in real estate and business services, but particularlyin temporary work agencies. Im-
migrants from China and, to a lesser extent, Brazil are relatively more concentrated in hotels
and restaurants (average shares of 46 per cent and 23.7 per cent, respectively). A significant
percentage of immigrants works in wholesale and retail trade (13.5 per cent compared to
20 per cent for natives in the period 2002-2008) and this share remained almost stable over
this period. Female immigrants are relatively more concentrated in this sub-sector than male
18

immigrants (shares in total of 17 and 11.7 per cent, respectively), while for native workers
the proportions between men and women are similar (around 20per cent). Immigrants from
China are predominantly employed in wholesale and retail trade, accounting for 50 per cent
of total on average in this period. A higher than average share of employment in this sub-
sector is also found for immigrants from the EU15 (19.7 per cent). Workers from the EU15
are also more concentrated in education and health than immigrants from other origins.
Table 6: Education attainment of native and immigrant employees in Portugal, average 2002-2008shares as a percentage
Natives Immigrants
EU15 PALOP CEEC Brazil China
Cape Verde Ukraine
Very low 46.9 44.1 19.5 55.8 71.3 43.8 45.1 37.0 70.0
of which illiterate 1.2 4.1 0.5 4.9 8.7 6.3 6.7 1.7 15.3
Low 21.4 24.2 19.7 21.7 16.4 26.8 26.7 27.9 20.1
Medium 20.2 23.1 29.8 16.7 10.0 23.6 22.6 29.5 7.2
High 11.5 8.7 31.0 5.9 2.3 5.8 5.6 5.7 2.7
100 100 100 100 100 100 100 100 100
Sources:Quadros de Pessoaland authors’ calculations.Note: Very low education level refers to ISCED 0-1 (primary,up to 6 years), low refers to ISCED 2 (lower secondary, up to 9 years),medium refers to ISCED 3-4 (upper-secondary, up to 12 years)and high refers to ISCED 5-6 (tertiary).
Table 6 compares the educational attainment of natives and immigrants in the Portuguese
labour market using the International Standard Classification of Education (ISCED) cate-
gories. The differences between the levels of formal education of natives and immigrants as
a whole are small. The percentage of immigrant workers with very low education levels is
lower than the corresponding figure for native workers (44.1 and 46.9 per cent, respectively),
but the share of illiterates is higher for immigrants. Immigrants with a high education level
(tertiary education) represent also a smaller proportion of total than that of natives, while the
percentage of immigrants with low and medium education levels is higher than that of native
workers. However, these aggregate education levels conceal important differences between
the main immigrant groups. Immigrants from Cape Verde and China stand out as having an
extremely low educational attainment. 71.3 per cent of immigrants from Cape Verde have a
very low education level (primary education or less), with 8.7 per cent of illiterates, and only
2.3 per cent of them have tertiary education in the 2002-2008 period. These education levels
are much lower than in the case of immigrants from other PALOPand are comparable to
those of workers from China, even though the Chinese have a higher percentage of illiterates
(15.3 per cent). The proportion of highly-educated workers is very similar in immigrants
from the PALOP, CEEC and Brazil (between 5.7 and 5.9 per cent of total), but the Brazilians
have a smaller share of individuals with very low education levels and a higher percentage
of workers with medium education. In contrast, the educational attainment of immigrants
from the EU15 is significantly higher than that of all other nationality groups, including the
natives, with more than 30 per cent of them having tertiary education.
19

4 The wages of immigrants in Portugal
The wage-setting procedure in Portugal is mainly determined by three thresholds. First, the
lower limit is defined, at the national level, through the legal mechanism of the minimum
wage. Second, nominal wage cuts in the private sector are forbidden by law (Labour code,
art. 129). Finally, in the context of wage bargaining, the vast majority of the lower limits of
wages for each professional group are defined by sectoral agreements, as firm agreements are
the exception. Hence, there is not an automatic wage indexation mechanism. This framework
is common to both native and immigrant workers.
As expected, the distribution of wages for the total economyshows a mode in wages equal
to, or very close to, the minimum wage. Furthermore, lookingto this distribution one can
see that the concentration of immigrants in lower wages was higher (Figure 13).5 This was
true for both total employees and employees who stayed at least for two consecutive years
in the same firm. As workers who entered or exited a given firm ina given year, either
natives or immigrants, earned lower wages, the concentration in the bottom-end of the wage
distribution was higher for total employees than for stayers.
Figure 13: Distribution of wages in Portugal, 2008
0.00
0.05
0.10
0.15
0.20
300 500 700 900 1100 1300 1500Euros
Natives Immigrants
(a) Total
0.00
0.05
0.10
0.15
0.20
300 500 700 900 1100 1300 1500Euros
Natives Immigrants
(b) Stayers
Sources:Quadros de Pessoaland authors’ calculations.Note: Stayers only include employees who stayed for at leasttwo consecutive years in the same firm.
Not controlling for any differentiating factors, immigrants in Portugal are, on average, paid
below the wages of native workers over the 2002-2008 period (Figure 14). In addition, the
proportion of workers that are paid below the minimum wage issubstantially higher for
immigrants than for natives. In 2002, the average wages of native workers were 18.2 per
cent above the average wages of immigrants, but this wage gapdecreased to 13.3 per cent
in 2008. Having started from lower wage levels, the average growth of wages in the period5The distributions of wages are similar throughout the period analysed. These distributions are available from authorsupon request.
20

2002-2008 was higher for immigrants than natives (annual average change of 4.4 and 3.7 per
cent, respectively).
Figure 14: Wage levels of native and immigrant employees in Portugal
0
5
10
15
20
25
30
35
0
100
200
300
400
500
600
700
800
900
1000
2002 2003 2004 2005 2006 2007 2008
Per
cen
t
Eu
ros
Wage gap Natives Immigrants
Sources:Quadros de Pessoaland authors’ calculations.Note: The percentual wage gap is defined as the difference between the average wages of native and immigrant workers expressed as apercentage of natives wages.
There are also important differences in average wages within immigrant workers in Portugal
(Figure 15). Over the period analysed, the average wage of workers from the EU15 was
almost twice as high as the average wage of natives and immigrants as a whole, growing at
an annual rate of change of 4.6 per cent.6 Immigrants from the PALOP earn less than the
average immigrant but the difference is particularly starkin the case of workers from Cape
Verde, which earn on average about 15 per cent less than the average PALOP worker. In
2002, the average wage of CEEC immigrants was lower than the one of workers from Cape
Verde. However, the wages of CEEC workers grew significantlyfrom 2002 to 2008 (41.4 per
cent over the whole period, i.e., an annual change of 5.9 per cent) (Figure 16). The average
wage of Brazilian workers in 2002 was similar to the average wage of immigrants as a whole.
However, particularly in the last few years, the rate of change of wages of Brazilian workers
was the lowest of all migrant groups considered, being slightly negative in 2008. Chinese
immigrants earn wages significantly lower than other migrant groups, on average, reflecting
their strong concentration in some low-skilled sectors, like wholesale and retail trade, and
hotels and restaurants, and also the extremely high share ofminimum wage earners, which
we will examine in more detail below. Nevertheless, the highpercentage of minimum wage
earners may be one of the reasons why the wages of Chinese workers increased at a higher
pace than total immigrants’ wages in the last two years. Summing up, apart from EU15
workers, the other migrant groups earn lower wages than natives, and the higher average6As wage distributions exhibit a higher concentration in theleft tail, the average wage is higher than the median wage. However, the
results remain qualitatively unchanged if the median was used instead.
21

wage growth of immigrants compared to natives over the period analysed was mainly driven
by developments in the wages of CEEC workers, whose tenure also rose steadily, and, to a
lesser extent, of workers from the EU15.
Figure 15: Wage levels by main nationalities, average 2002-2008
0
200
400
600
800
1000
1200
1400
1600
Natives Immigrants EU15 PALOP Cape Verde CEEC Ukraine Brazil China
Eu
ros
Sources:Quadros de Pessoaland authors’ calculations.
Figure 16: Evolution of average wages by main nationalities
90
100
110
120
130
140
150
2002 2003 2004 2005 2006 2007 2008
Ind
ex 2
00
2=
100
Natives Immigrants CEEC EU15
(a) Cumulative growth
90
100
110
120
130
140
150
2002 2003 2004 2005 2006 2007 2008
Ind
ex 2
00
2=
100
PALOP Cape Verde Brazil China
(b) Cumulative growth
Sources:Quadros de Pessoaland authors’ calculations.
Several factors may contribute to the wage gap between natives and immigrants observed
throughout the 2002-2008 period. This gap is linked with a broad range of variables that can
have an impact on wages, such as age, gender, education, typeof contract, tenure, sector and
region, as we will discuss in further detail below. However,these variables do not seem to
fully explain the observed wage gap between native and immigrant workers. For the whole
sample period, we estimated a simple wage regression including variables controlling for
the age, gender, education, type of contract, tenure, sector and region, and also nationality
22

and time dummies. The results in Table 7 show that the wage gapbetween natives and
immigrants persists even after taking into account these regressors (OECD (2008a) found a
similar result using data for 2005). From about 15 per cent, the average wage gap between
natives and immigrants as a whole remains at 8.5 per cent even after controlling for worker,
firm and match characteristics. Within immigrants, these characteristics account for around
40 and 30 per cent of the negative wage gap for PALOP and CEEC immigrants, respectively.
This percentage is significantly higher in the case of Brazilians (almost 60 per cent) and
Chinese workers (about 70 per cent). About half of the positive gap between the wages of
EU15 and native workers is related with the selected regressors.
Table 7: Log wages of immigrants compared to natives, 2002-2008
Immigrants
EU15 PALOP CEEC Brazil China
Cape Verde Ukraine
Coefficient of the nationality dummy
Without controls -0.149 0.329 -0.176 -0.265 -0.239 -0.251 -0.190 -0.484
With controls -0.085 0.156 -0.106 -0.117 -0.164 -0.179 -0.077 -0.149
Explained gap (% of total gap) 42.9 52.6 39.5 56.0 31.7 28.6 59.3 69.2
Sources:Quadros de Pessoaland authors’ calculations.Note: All regressions include time dummies. The control variables are age, gender, education, region, sector, tenure and type of contract.
Apart from information on tenure, our regression does not control for the duration of stay
of immigrants in Portugal. Among other factors, longer periods of residence are associated
with better language skills and more experience acquired inthe destination country, which
can contribute to partly offset the remaining wage gap between natives and immigrants (see,
for instance, Carneiro et al. (2010)). A more in-depth analysis of the process of economic
assimilation of immigrants in Portugal is an interesting topic for future research.
Worker, firm and match characteristics included in the wage regression presented above ac-
count for around 40 per cent of the overall wage gap between natives and immigrants. In the
following analysis we will further examine some of these variables in more detail. Regarding
the type of contract, results from the regression presentedabove point to the existence of a
3.7 per cent penalty on wages of similar workers but with fixed-term contracts. In the period
2002-2008, the positive wage gap between natives and immigrants is common to workers
with permanent and fixed-term contracts (Figure 17). Considering workers with permanent
contracts, the wage gap between natives and immigrants remained almost stable over this pe-
riod, while the difference in wage levels of natives and immigrants with fixed-term contracts
declined from 2002 to 2008. Moreover, workers with permanent contracts earn higher aver-
age wages than those with fixed-term contracts, both in native and in immigrant employment.
In the period 2002-2008, natives with permanent contract earned approximately 27 per cent
more than natives with fixed-term contract. In the case of immigrants this percentage gap
23
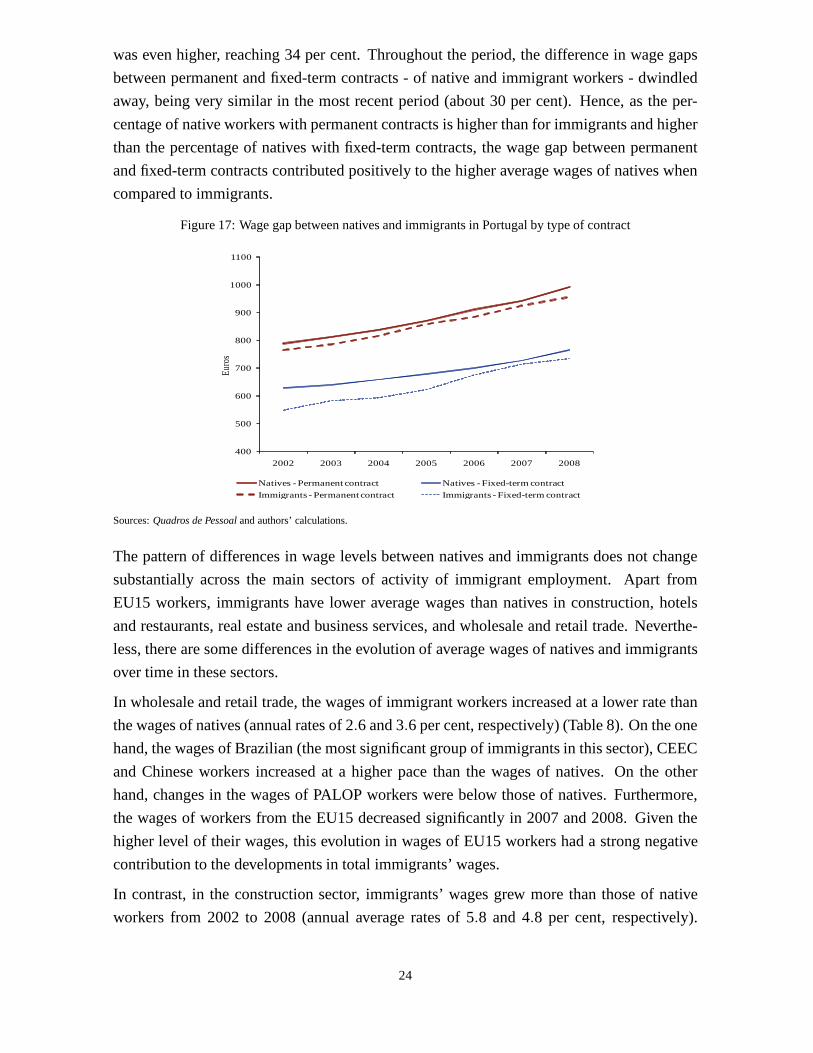
was even higher, reaching 34 per cent. Throughout the period, the difference in wage gaps
between permanent and fixed-term contracts - of native and immigrant workers - dwindled
away, being very similar in the most recent period (about 30 per cent). Hence, as the per-
centage of native workers with permanent contracts is higher than for immigrants and higher
than the percentage of natives with fixed-term contracts, the wage gap between permanent
and fixed-term contracts contributed positively to the higher average wages of natives when
compared to immigrants.
Figure 17: Wage gap between natives and immigrants in Portugal by type of contract
400
500
600
700
800
900
1000
1100
2002 2003 2004 2005 2006 2007 2008
Euro
s
Natives -Permanent contract Natives -Fixed-term contract
Immigrants - Permanent contract Immigrants - Fixed-term contract
Sources:Quadros de Pessoaland authors’ calculations.
The pattern of differences in wage levels between natives and immigrants does not change
substantially across the main sectors of activity of immigrant employment. Apart from
EU15 workers, immigrants have lower average wages than natives in construction, hotels
and restaurants, real estate and business services, and wholesale and retail trade. Neverthe-
less, there are some differences in the evolution of averagewages of natives and immigrants
over time in these sectors.
In wholesale and retail trade, the wages of immigrant workers increased at a lower rate than
the wages of natives (annual rates of 2.6 and 3.6 per cent, respectively) (Table 8). On the one
hand, the wages of Brazilian (the most significant group of immigrants in this sector), CEEC
and Chinese workers increased at a higher pace than the wagesof natives. On the other
hand, changes in the wages of PALOP workers were below those of natives. Furthermore,
the wages of workers from the EU15 decreased significantly in2007 and 2008. Given the
higher level of their wages, this evolution in wages of EU15 workers had a strong negative
contribution to the developments in total immigrants’ wages.
In contrast, in the construction sector, immigrants’ wagesgrew more than those of native
workers from 2002 to 2008 (annual average rates of 5.8 and 4.8 per cent, respectively).
24

Table 8: Evolution of average wages by main nationalities and sectors of activity of immigrant employmentannual rate of change as a percentage, average 2002-2008
Natives ImmigrantsEU15 PALOP CEEC Brazil China
ISIC code Cape Verde Ukraine
45 Construction 4.8 5.8 2.8 4.9 2.9 7.5 7.4 2.7 -6.150-52 Wholesale and retail trade 3.6 2.6 2.4 3.1 3.2 4.7 4.5 4.0 4.2
55 Hotels and restaurants 3.9 3.8 4.2 3.3 3.6 4.7 5.0 4.1 3.770-74 Real estate and business services 2.1 2.1 2.1 1.4 2.8 5.0 5.3 0.6 4.8
Total 3.7 4.4 4.6 3.3 3.1 5.9 6.4 3.0 4.0
Sources:Quadros de Pessoaland authors’ calculations.
Wages from PALOP workers increased almost the same as natives, but the average wages of
CEEC workers - the other dominant group of immigrants in the construction sector - grew
significantly (54.2 per cent in cumulative terms, i.e., an annual rate of changeof 7.5 per
cent). In spite of having started at a similar point in 2002, the wages of workers from Cape
Verde in the construction sector increased by far less than overall PALOP workers, resulting
in a gap in average wage of about 70 euros in 2008.
In the real estate and business services, workers from Cape Verde also earned lower wages,
on average, over this period. Yet, the developments in theirwages were significant, with
an average wage growth higher than for total immigrants and natives working in this sector.
Immigrants from other PALOP had feeble wage developments, as the cumulative average
wage growth of total PALOP workers in this sector was about 4 percentage points below
natives in the period 2002-2008. The average wage of Brazilians increased only by 3.7 per
cent in 6 years, i.e., an annual change of 0.6 per cent, with negative rates of change in 2007
and 2008. So, in spite of the sharp increase in the average wages earned by CEEC workers,
the wages of total immigrants grew virtually the same as those of natives in this sector.
In hotels and restaurants, the wages of immigrants and natives also increased roughly the
same over this period, with an annual average rate of change of around 4 per cent. Wages
of CEEC and Brazilian immigrants grew above average over this period, while the wages
of PALOP workers increased by 3.3 per cent on average each year. Chinese workers in this
sector have a cumulative wage growth close to the average over the period, but show a strong
wage increase in the last two years, in line with the higher incidence of minimum wage
earners in Chinese immigrants.
Indeed, the percentage of minimum wage earners is higher forimmigrants than natives. In
the period from 2002 to 2008, 12.5 per cent of workers reported wages close to the minimum
wage (interval of +/- 10 euros centered on the minimum wage).Over this period, 12.1
per cent of native workers earned the minimum wage, while in the case of immigrants, the
25

proportion of minimum wage earners reached 18.6 per cent, on average. After a period where
it remained fairly stable, the percentage of minimum wage earners grew for natives and, even
more markedly, for immigrant workers in 2007 and 2008, amidst significant increases of the
legal minimum wage of 4.4 and 5.7 per cent, respectively (Figure 18).7
Figure 18: Percentage of workers earning the minimum wage
0
5
10
15
20
25
2002 2003 2004 2005 2006 2007 2008
Per
cen
t
Natives Immigrants
(a) Annual shares
0
10
20
30
40
50
60
70
Natives Immigrants EU15 PALOP Cape Verde CEEC Ukraine Brazil ChinaP
er c
ent
(b) By main nationalities, average 2002-2008
Sources:Quadros de Pessoaland authors’ calculations.Note: Consider as workers earning the minimum wage all thoseworkers whose wage lies in an interval of +/- 10 euros centered on theminimum wage.
Immigrants from the EU15 have the lowest share of minimum wage earners, even lower
than that of natives. In contrast, approximately every two out of three Chinese workers are
reported as earning the minimum wage in this period. Minimumwage earners account for
14.3 per cent of total immigrants from PALOP but that proportionreaches 15.6 per cent if we
consider workers from Cape Verde only. Immigrants from CEECand from Brazil have an
average percentage of minimum wage earners of 20.5 and 22.3 per cent, respectively, over
the period 2002-2008. In the case of immigrants from Brazil that share increased strongly
in the last two years to 28.8 per cent in 2008, while in the case of CEEC it remained mostly
stable around 20 per cent.
The shapes of the distributions of wages across different education levels were broadly sim-
ilar to the distributions for total workers. Again, immigrants tended to be more concentrated
on lower wages. Without controlling for factors other than education, the wage gap between
natives and immigrants was positive, rising steadily from the bottom to the top of the wage
distribution (Figure 19).8 The gap is minimum at the very bottom of the wage distribution.
As pointed out by Carneiro et al. (2010), the existence of a mandatory minimum wage level7From 2002 to 2006 the minimum wage increased by 4.1, 2.5, 2.5, 2.5 and 3 per cent, respectively. Given that a goal of reaching a
500 euros minimum wage by 2011 was set in 2006, the increases of the minimum wage since 2007 have been higher (4.4 per cent in 2007,5.7 per cent in 2008, and 5.6 per cent in 2009 and 2010).
8Information displayed on Figure 19 refers to 2008. The results are qualitatively similar throughout the period analysed and areavailable from the authors upon request.
26

may act as a forceful instrument to limit the wage gap betweennative and immigrant workers
at the bottom-end of the wage distribution.
Figure 19: Wage gap between native and immigrant employees in Portugal, 2008
0
300
600
900
1200
1500
1800
Euro
s
0 10 20 30 40 50 60 70 80 90 100Deciles
ImmigrantsNatives Wage gap
(a) Overall gap
-500
-400
-300
-200
-100
0
100
200
300
400
500
Eu
ros
0 10 20 30 40 50 60 70 80 90 100Deciles
Total Illiterate 4 years 6 years9 years 12 years Tertiary
(b) By education level (years completed)
Sources:Quadros de Pessoaland authors’ calculations.
There are two interesting exceptions to this scenario. First, the wage gap between immigrants
and natives was virtually nil in the case of illiterate workers. Within these workers, Ukraine
and Cape Verde are the most important origin countries. The second refers to the group of
workers in the top-end of the education distribution (tertiary education level), which in the
case of immigrants are mostly from EU15, namely Spain and France. In this case, immi-
grants were more concentrated on both tails of the wage distribution, i.e., very low and very
high wages. In the left tail of the wage distribution the wagegap was again positive, i.e.,
wages of immigrants were lower. Nevertheless, as one moves to the right, the positive wage
gap progressively diminishes, reversing its sign as one approaches the top-end of the wage
distribution. Thus, for example in 2008, immigrant workerswith tertiary education and on
the top 30 per cent of wage distribution were better paid thannative workers with tertiary
education on the top 30 per cent of wage distribution.
Regarding the distribution of wage changes, negative nominal changes almost do not ex-
ist (Figure 20).9 Moreover, there is very high concentration on the zero change, in general
slightly higher in the case of immigrant workers. Between 2003 and 2006 the distribution of
wage changes had a second mode near the expected inflation rate (and bargaining and min-
imum wage reference values), common to both natives and immigrants. In 2007 and 2008,
the distribution of wage changes has three spikes - at zero, at the expected inflation rate
value (and bargaining reference value) and at the rate of change of the minimum wage. The
concentration in the rate of change of the minimum wage is higher for immigrant workers,9Since wage changes were calculated at the individual level,this distribution only includes employees who stayed for atleast two
consecutive years in the same firm.
27

reflecting the higher percentage of immigrants earning the minimum wage. Despite differ-
ences in the relative size of the spikes, the main features ofthe distribution of wage changes
- near absence of negative changes and two- or three-spike distributions - were common to
immigrants across nationalities, education levels and activity sectors.10
Figure 20: Distribution of wage changes in Portugal
0.00
0.05
0.10
0.15
0.20
0.25
0.30
-30 -20 -10 0 10 20 30Per cent
Natives Immigrants
(a) 2003
0.00
0.05
0.10
0.15
0.20
0.25
0.30
-30 -20 -10 0 10 20 30Per cent
Natives Immigrants
(b) 2008
Sources:Quadros de Pessoaland authors’ calculations.
5 Wage rigidity
Wage rigidity (nominal and real) is associated with labour market frictions that prevent the
normal adjustment of wages to labour demand, limiting firms’ability to accommodate dis-
turbances in the demand for their products. As opposed to wage flexibility, a rigid wage
framework may lead to an adjustment that generates unemployment.
Should wage rigidity differ between native and immigrant workers? The predictions from
labour market theories do not all point in the same direction(see Campbell and Kamlani
(1997) for a discussion of the alternative theories for wagerigidity). According to the
insider-outsider theory (Lindbeck and Snower (1988)),insidershave more power to influ-
ence the wage-setting process and tend to have higher wage rigidity. As native workers tend
to have more power in the wage-setting process, this suggests that they could have higher
wage rigidity than immigrant workers. Furthermore, the share of immigrants with permanent
contracts is much smaller than the share of natives. So, the contract theory (see, for example,
Taylor (1979)) also suggests that native workers would havehigher wage rigidity.
In contrast, as discussed in Du Caju et al. (2007), the cost oflosing a job is higher for older
workers and workers with higher tenure. These workers have,therefore, less incentive to10All distributions are available from authors upon request.
28

shirk or quit, even in presence of wage cuts, implying a higher likelihood of a wage cut
for them and, thus, lower wage rigidity, The opposite applies to immigrants, which are, on
average, younger and have lower tenures. So, assessing whether wage rigidity is higher for
immigrant or native workers is ultimately an empirical question.
5.1 Measuring rigidity
Several attempts have been made in order to assess the causesand gauge the consequences of
wage rigidity. One strand of the literature on this topic relies on estimates of rigidity obtained
from macro data (see, for instance, Akerlof et al. (1996) andBlanchard and Galí (2007)).
Alternatively, another strand of the literature tries to exploit the ever increasing availability
of longitudinal databases with extensive information on wages, individuals and firms (see
Card and Hyslop (1996) and Kahn (1997), among others). An example of this micro data
approach is the International Wage Flexibility Project (IWFP). The IWFP methodology for
calculating the wage rigidity measures is based on the analysis of the distributions of wage
changes, obtained from databases with information broken down by individual. Estimations
of downward nominal and real wage rigidity based on individual data and following the
IWFP methodology include, for instance, the works of Dickens et al. (2007), Du Caju et al.
(2007), Duarte (2008) and Messina et al. (2010). According to this methodology, the nominal
rigidity concept is associated with the share of workers whohave nil wage changes and
would see their wages fall in the absence of rigidity. In turn, real rigidity reflects the share of
workers whose wage change is close to expected inflation, butwould be lower in the absence
of rigidity.
In a nutshell, the rigidity measures result from comparing the actual distribution of wage
changes with a notional distribution that tries to reflect a flexible wage scenario. The no-
tional distribution is approximated by a symmetric Weibulldistribution and its parameters
are estimated from moments of the actual distribution assumed not to be affected by wage
rigidity (for example, the 75th percentile). The higher the concentration in the nil wage
change of the actual distribution vis-à-vis the notional distribution, the greater the evidence
in favour of nominal rigidity and, hence, the higher the measure of nominal rigidity calcu-
lated according to the IWFP methodology. Similarly, the higher the concentration of the
actual distribution, compared with the notional distribution, in a wage change close to the
expected inflation, the greater the evidence in favour of real rigidity, and the higher the value
of the measure.
In case any measurement errors are detected, the procedure for calculating the rigidity mea-
sures, developed by the IWFP, tries to purge these errors from the wage change distribution,
by computing a new distribution, known as the “true” distribution, which takes the place of
29

the empirical distribution in the comparison with the notional distribution.11 Moreover, the
calculation procedure of the rigidity measures makes it possible to obtain simultaneously
nominal and real rigidity measures, as well as the referencevalue for the real rigidity.
However, when the reference value is relatively low, close to zero, the best identification
conditions for the two types of rigidity cease to occur, making it more difficult to distinguish
between nominal and real rigidity. Furthermore, if institutional rigidities (e.g. collectively
bargained wages and minimum wages) play a significant role inthe wage-setting process,
distinguishing the different types of rigidity becomes trickier. For example, if the reference
values for collective bargain and minimum wages are similarto the expected inflation rate,
the IWFP real rigidity measure will reflect both (strictly) real and institutional rigidities.
5.2 Rigidity results
Given the QP database described in section 3, a 10 per cent random sample of the employees
was selected for calculating the rigidity measures. Since the IWFP methodology focuses on
wage changes that are not influenced by worker mobility (see Dickens et al. (2007)), this
sample was further restricted to include only the employeeswho worked for at least two
consecutive years in the same firm (stayers) and whose tenureincreased over time.
As mentioned above, the empirical distribution of wage changes shows only a small fraction
of negative nominal changes and a very high concentration onthe nil change, suggesting
resistance to nominal wage declines (nominal rigidity). Furthermore, the existence of a
second mode near the expected inflation rate (and/or the bargaining and minimum wage
reference values) and a smaller concentration in rates immediately below are evidence in
favour of real wage rigidity.12 These results are common to native and immigrant workers.
The hints given by the histograms are confirmed by the resultsof the nominal and real wage
rigidity measures (Figure 21). As expected, the nominal rigidity indicator is high throughout
the period analysed. On average, about 50 per cent of the employees who would have a
nominal wage cut, in the absence of rigidity, have instead nil wage changes. This result not
only is influenced by the legal framework associated with theexisting barriers to nominal
wage cuts, but is also related to the fact that, even in the absence of legal constraints, firms
tend to avoid nominal wage cuts for motivational reasons (see Bewley (1998) and Howitt
(2002)). The results are relatively similar when native andimmigrant workers are analysed
separately. However, throughout the period analysed, the nominal wage rigidity tended to be
slightly higher for immigrants than for natives (5 percentage points higher, on average).
11The detection of measurement errors is based on the analysisof the wage change autocorrelation. Positive changes followed bynegative changes are assumed to be a sign of the existence of measurement errors (for further details, see Dickens et al. (2007)).
12Comparing the empirical distribution with the "true" distribution, one can conclude that the differences between the two are virtuallynil, thus suggesting that measurement errors are limited inQP database.
30

Figure 21: Nominal and real wage rigidity in Portugal
0,0
0,1
0,2
0,3
0,4
0,5
0,6
0,7
0,8
2003 2004 2005 2006 2007 2008 2003-2008
Total Natives Immigrants
(a) Downward nominal wage rigidity
0,0
0,1
0,2
0,3
0,4
0,5
0,6
0,7
0,8
2003 2004 2005 2006 2007 2008 2003-2008
Total Natives Immigrants
(b) Downward real wage rigidity
Sources:Quadros de Pessoaland authors’ calculations.
The real wage rigidity measure shows more irregular developments. Given its definition,
and taking into account the low inflation in Portugal in the period analysed, calculating and
interpreting this measure is naturally more challenging.13 On average, about 18 per cent
of the total workers who would face a decline in their real wages, in a context of wage
flexibility, see their wages increase in line with the expected inflation rate. In the case of
native workers, this percentage is similar, while for immigrants the real wage rigidity was on
average 6 percentage points higher (24 per cent).
Regarding total workers, these results are qualitatively similar to those previously reported in
Banco de Portugal (2004), for a previous period, and in Duarte (2008) for a similar time span.
Even though obtained from an alternative database (Instituto de Informática, Portuguese
social security data-processing office), results in the latter also point to high nominal wage
rigidity and a more irregular evolution of the real wage rigidity measure.
Over the period analysed, the real rigidity measure for total workers steadily increased from
2003 to 2006 and in 2007 and 2008 decreased significantly to about half of the average
value on the previous years. The sharp reduction in the real rigidity measure in the last
two years was common to native and immigrant workers. This decrease reflected to a large
extent the evolution of the minimum wage. In 2007 and 2008, the minimum wage increased
significantly (4.4 and 5.7 per cent, respectively). While in the previous years the minimum
wage grew approximately at the same pace as prices, in 2007 and 2008 the minimum wage
grew well above prices (inflation rate of 2.4 per cent in 2007 and 2.7 per cent in 2008).
So, up to 2006, the real wage rigidity measure combined both (strictly) real and institutional
rigidities, related to collective bargaining and mandatory minimum wages. In the empiri-13To improve identification conditions we imposed a lower bound of 2.5 per cent for expected inflation.
31

cal distribution of wage changes, the share of individuals covered by collective bargaining
and/or earning the minimum wage contributed to reinforce the spike at the expected inflation
rate value (the same as the bargaining and minimum wage reference values). In contrast, in
2007 and 2008, instead of having a two-spike distribution ofwage changes, the distribution
of wage changes has three spikes - at zero, at the expected inflation rate value (and the bar-
gaining reference value) and at the rate of change of the minimum wage. In these years, for
calculating the real wage rigidity measure, the IWFP methodology only takes into account
one of the two non-zero spikes - or at the expected inflation rate value (and the bargaining
reference value) or at the rate of change of the minimum wage.
The developments in the minimum wage induced a break in the series of the real wage
rigidity measure. Consider, for example, the year of 2006, in which the rate of change of the
minimum wage was equal to the inflation rate (3 per cent). In this year, 28 per cent of the
total workers who would face a decline in their real wages, ina context of wage flexibility,
see their wages increase in line with the expected inflation rate (and the bargaining and
minimum wage reference values). Now, for the sake of the argument, assume that in 2007
the proportion of employees who, in the absence of rigidity,would face a decline in their
real wages was the same as in 2006. In practice, within this group of employees, the wage
of some of them would grow 4.4 per cent (of those who earned the minimum wage), while
the wage of the others would grow in line with the inflation rate and the bargaining reference
value (2.4 per cent). Although the proportion of workers whose wage isconditioned by the
existence of (real and institutional) rigidity would be thesame as in 2006, the value of the
real rigidity measure calculated through the IWFP procedure would necessarily be lower,
reflecting the three-spike distribution. Although this example is for the total workers, the
same is also true for native and immigrant workers.
Nevertheless, in both sub-periods (pre- and post-break) the results obtained also suggest
slightly higher values of the real rigidity measure for immigrants. The higher percentage
of fixed-term contracts and minimum wage earners within immigrants makes this group of
workers more prone to institution-related wage rigidity, whether through sector-level wage
setting agreements or the mandatory minimum wage. Regarding the different types of con-
tracts, to better assess this question we use separate samples for permanent and fixed-term
contracts for calculating the measures of wage rigidity. Although differences are small, ex-
cept for immigrants’ nominal wage rigidity (10 percentage points) our results suggest that
downward wage rigidity is always higher in the case of fixed-term contracts (see Figure 22).
Moreover, for both permanent and fixed-term contracts, immigrants’ wages tend to be more
rigid than natives’ wages.
Furthermore, in the case of minimum wage earners, consider the following example. In 2007
and 2008, the real wage rigidity measure only reflected one ofthe two non-zero spikes - the
one which was the most significant, i.e., the one for which thedifference between the notional
32

Figure 22: Nominal and real wage rigidity in Portugal by typeof contractaverage 2003-2008
0,0
0,1
0,2
0,3
0,4
0,5
0,6
0,7
0,8
Permanent contracts Fixed-term contracts
Total Natives Imigrants
(a) Downward nominal wage rigidity
0,0
0,1
0,2
0,3
0,4
0,5
0,6
0,7
0,8
Permanent contracts Fixed-term contracts
Total Natives Imigrants
(b) Downward real wage rigidity
Sources:Quadros de Pessoaland authors’ calculations.
and the empirical distributions was greater. In both years,the focal points implicit in the real
rigidity measures were associated with the rate of change ofthe minimum wage.14 So, in
these circumstances, greater concentration of workers in the minimum wage led to greater
values of the real rigidity measure. Not surprisingly, within immigrants, Chinese workers
have the highest value of the real rigidity measure (Figure 23).15 Apart from China, the re-
sults for other countries of origin are relatively close to each other and to the average value
for immigrants as a whole. Regarding nominal wage rigidity,the heterogeneity among dif-
ferent groups of immigrants is much higher. While the results for immigrants from PALOP
and CEEC are close to the observed for native workers, the measure of nominal wage rigidity
for immigrants from China and EU countries is higher than forimmigrants as a whole and
even higher than for natives. The result obtained for Brazilian workers is virtually the same
as for total immigrants.
When assessing the differences on the results of rigidity measures across sectors, previous
evidence suggested that both nominal and real rigidity tended to be higher in services and
construction than in manufacturing (see Duarte (2008)). Asalready mentioned, immigrants
are highly concentrated on construction and services - namely hotels and restaurants, real
estate and business services, and wholesale and retail trade. So, the higher relative con-
centration of immigrants in these sectors could also contribute to higher overall rigidity for
immigrant workers.
14By restricting the range over which the IWFP routine searches for signs of real wage rigidity one could force the results to reflect theexpected inflation rate spike. We opted against imposing a tight range, based on a priori judgment, letting the routine freely select the mostsignificant non-zero spike.
15Although with higher values, results for the real rigidity measure would not qualitatively change for the period 2003-2006.
33
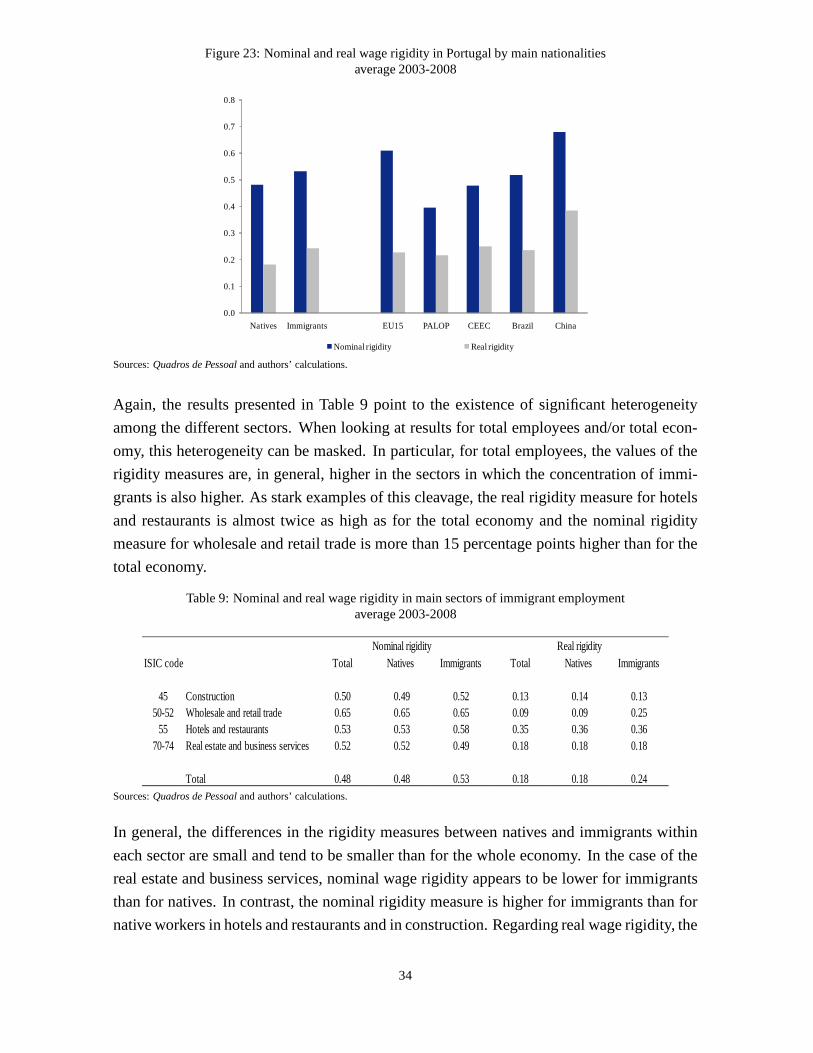
Figure 23: Nominal and real wage rigidity in Portugal by mainnationalitiesaverage 2003-2008
0.0
0.1
0.2
0.3
0.4
0.5
0.6
0.7
0.8
Natives Immigrants EU15 PALOP CEEC Brazil China
Nominal rigidity Real rigidity
Sources:Quadros de Pessoaland authors’ calculations.
Again, the results presented in Table 9 point to the existence of significant heterogeneity
among the different sectors. When looking at results for total employees and/or total econ-
omy, this heterogeneity can be masked. In particular, for total employees, the values of the
rigidity measures are, in general, higher in the sectors in which the concentration of immi-
grants is also higher. As stark examples of this cleavage, the real rigidity measure for hotels
and restaurants is almost twice as high as for the total economy and the nominal rigidity
measure for wholesale and retail trade is more than 15 percentage points higher than for the
total economy.
Table 9: Nominal and real wage rigidity in main sectors of immigrant employmentaverage 2003-2008
ISIC code Total Natives Immigrants Total Natives Immigrants
45 Construction 0.50 0.49 0.52 0.13 0.14 0.1350-52 Wholesale and retail trade 0.65 0.65 0.65 0.09 0.09 0.25
55 Hotels and restaurants 0.53 0.53 0.58 0.35 0.36 0.3670-74 Real estate and business services 0.52 0.52 0.49 0.18 0.18 0.18
Total 0.48 0.48 0.53 0.18 0.18 0.24
Nominal rigidity Real rigidity
Sources:Quadros de Pessoaland authors’ calculations.
In general, the differences in the rigidity measures between natives and immigrants within
each sector are small and tend to be smaller than for the wholeeconomy. In the case of the
real estate and business services, nominal wage rigidity appears to be lower for immigrants
than for natives. In contrast, the nominal rigidity measureis higher for immigrants than for
native workers in hotels and restaurants and in construction. Regarding real wage rigidity, the
34

results between immigrants and natives are very similar with the exception of wholesale and
retail trade. However, the results for this sector should beinterpreted with extreme caution
as the best identification conditions of the focal point for calculating the real rigidity are not
verified.
Hence, the results point to a higher concentration of immigrant workers on construction and
services sectors, which tend to have higher downward wage rigidity. Additionally, according
to Centeno et al. (2008), the services sector has higher worker flows and churning rates than
manufacturing.16 Churning flows can be interpreted as a strategy to improve thequality of
matches and/or to rearrange the workers’ skill mix (see, forexample, Burgess et al. (2000)).
This evidence is consistent with the higher worker rotationrates, higher share of fixed-term
contracts and lower tenure of immigrants than natives. Our results suggest that this positive
relation between worker rotation rates and wage rigidity could be stronger in the case of
immigrant workers.
6 Conclusions
Historically, Portugal has been a country of emigration, but in the late nineties immigration
flows grew strongly driven by high labour demand. A significant share of this new immigra-
tion flows came from Central and Eastern European countries (CEEC), i.e., from countries
with no evident cultural link with Portugal. More recently,there was a very significant in-
crease in the arrivals of immigrants from Brazil. Immigration from China, although growing
strongly in the last decade, still represents a small percentage of total immigrant workers. At
present, three major groups make up the bulk of immigration in Portugal, representing around
75 per cent of total: Brazil, Portuguese speaking countriesin Africa (PALOP) and CEEC.
The increase in immigration flows and the substantial changein its composition makes it
relevant to describe and analyse the characteristics of immigrant workers in Portugal, espe-
cially given that empirical evidence about immigration in the Portuguese labour market is
still relatively scarce.
In this paper, we used a longitudinal matched employer-employee database (Quadros de Pes-
soal) to examine the main characteristics of immigrants in the Portuguese labour market in
the 2002-2008 period. We found substantial differences in labour market outcomes between
native and immigrant workers and within immigrants. Full-time employed immigrants in
Portugal increased by 46.2 per cent in cumulative terms from 2002 to 2008, representing 6.3
per cent of total in 2008. More than half of immigrant workershas a fixed-term contract in
2008, a much higher share than native workers. Immigrant workers in Portugal are slightly
younger than natives and the percentages of females in immigrant employment is lower than16Churning flows or excess worker rotation are defined as the difference between total worker flows and the absolute value of job flows.
35

in native employment. Given the recent nature of most immigrant flows in Portugal and the
relatively high incidence of fixed-term contracts, the tenure of immigrant workers is much
lower than that of natives. In addition, worker rotation rates are higher for immigrants than
for natives. In terms of geographical location within the country, immigrants are more con-
centrated in the Lisboa district than natives, with Faro appearing as the second major location
of immigrant workers. The sectoral distribution of immigrant employment differs markedly
from that of native workers. Immigrant workers in Portugal are mostly concentrated in four
sectors of activity, construction, hotels and restaurants, real estate and business services, and
wholesale and retail trade. The differences in educationalattainment between natives and
immigrants as a whole are not significant, but there are substantial differences between the
main immigrant groups. Immigrants from Cape Verde and Chinastand out by its extremely
low education level, while the educational attainment of immigrants from the other 14 ini-
tial Member-States of European Union (EU15) is significantly higher than that of all other
nationality groups, including the natives.
Similarly to other countries, immigrants in Portugal are, on average, paid below the wages
of native workers over the 2002-2008 period. The differences between native and immigrant
workers in terms of age, gender, education, type of contract, tenure, region and sector, con-
tribute to the positive wage gap between the wages of nativesand immigrants. However,
these variables do not fully explain the observed wage gap inthis period. This average wage
gap decreased throughout the period 2002-2008, as the cumulative growth of wages was
higher for immigrants than natives. This stronger growth was mainly driven by develop-
ments in the wages of CEEC workers, particularly in the construction sector, whose tenure
also rose steadily over the period.
The percentage of native workers with permanent contracts is higher than the percentage of
immigrants, and higher than the percentage of natives with fixed-term contracts. So, given
that wages associated with permanent contracts are on average higher, this wage gap between
permanent and fixed-term contracts contributed positivelyto the gap between average wages
of natives and immigrants. Moreover, the percentage of minimum wage earners is higher for
immigrants than natives. This percentage is particularly high in the case of Chinese workers,
which earn, on average, the lowest wages of all main immigrant groups examined. Across
different education levels, immigrants also tend to be moreconcentrated on lower wages,
with the positive wage gap between natives and immigrants rising steadily from the bottom
to the top of the wage distribution. However, this does not happen in the case of illiterate
workers, whose wage gap between natives and immigrants is virtually nil. Additionally, im-
migrants with tertiary education are more concentrated on both tails of the wage distribution
of workers. In the left tail of the wage distribution the wagegap is again positive, but, as one
moves to the right, the positive wage gap progressively diminishes, reversing its sign as one
approaches the top-end of the wage distribution.
36

Regarding wage changes at the individual level, the main features of the distributions are
common to both natives and immigrants: negative nominal changes almost do not exist;
very high concentration on the nil change; existence of a second mode near the expected
inflation rate (and bargaining reference value); and, from 2007 onwards, a third spike in the
rate of change of the minimum wage. This evidence suggests the existence of both nominal
and real wage rigidity for natives and immigrants, which is confirmed by the results for the
measures of downward wage rigidity, calculated using the IWFP methodology. Given the
specific characteristics of the Portuguese labour market, institutional factors - particularly
mandatory minimum wages and sectoral agreements - play a crucial role in the wage-setting
procedures. In the case of workers with lower tenures and with fixed-term contracts, such as
immigrants, these factors are particularly stringent, inducing higher wage rigidity. Not sur-
prisingly, Chinese workers (with a very high percentage of minimum wage earners) have the
highest value of the real rigidity measure within immigrantworkers. Moreover, immigrants
are very concentrated on construction and services, which are sectors typically with higher
wage rigidity.
37

References
Adsera, A. and Chiswick, B. (2007), ‘Are there gender and country of origin differences in
immigrant labor market outcomes across European destinations?’,Journal of Population
Economics20(3), 495–526.
Akerlof, G. A., Dickens, W. R. and Perry, G. L. (1996), ‘The macroeconomics of low infla-
tion’, Brookings Papers on Economic Activity27(1996-1), 1–76.
Andersson, P. and Wadensjo, E. (2004), Self-employed immigrants in Denmark and Sweden:
A way to economic self-reliance?, IZA Discussion Papers 1130, Institute for the Study of
Labor (IZA).
Baganha, M. I., Marques, J. C. and Góis, P. (2004), The unforeseen wave: migration from
Eastern Europe to Portugal,in M. I. Baganha and M. L. Fonseca, eds, ‘New waves: Mi-
gration from Eastern Europe to Southern Europe’, Luso-American Foundation, chapter 3,
pp. 23–40.
Banco de Portugal (2004), Nominal and real wage rigidity: a microeconomic approach,
Annual Report Box 2.5, Banco de Portugal.
Bewley, T. F. (1998), ‘Why not cut pay?’,European Economic Review42(3-5), 459–490.
Blanchard, O. and Galí, J. (2007), ‘Real wage rigidities andthe new keynesian model’,
Journal of Money, Credit and Banking39(s1), 35–65.
Borjas, G. J. (1986), ‘The self-employment experience of immigrants’,The Journal of Hu-
man Resources21(4), 485–506.
Borjas, G. J. (1994), ‘The economics of immigration’,Journal of Economic Literature
32(4), 1667–1717.
Borjas, G. J. (1999), The economic analysis of immigration,in O. Ashenfelter and D. Card,
eds, ‘Handbook of Labor Economics’, Vol. 3, Elsevier, chapter 28, pp. 1697–1760.
Borjas, G. J. (2003), ‘The labor demand curve is downward sloping: Reexamining the impact
of immigration on the labor market’,The Quarterly Journal of Economics118(4), 1335–
1374.
Burgess, S., Lane, J. and Stevens, D. (2000), ‘Job flows, worker flows, and churning’,Jour-
nal of Labor Economics18(3), 473–502.
Campbell, C. M. and Kamlani, K. S. (1997), ‘The reasons for wage rigidity: Evidence from
a survey of firms’,The Quarterly Journal of Economics112(3), 759–89.
Card, D. (2005), ‘Is the new immigration really so bad?’,Economic Journal115(507), F300–
F323.
38

Card, D. and Hyslop, D. (1996), Does inflation “grease the wheels of the labor market”?,
NBER Working Paper 5538, National Bureau of Economic Research.
Carneiro, A., Fortuna, N. and Varejão, J. (2010), Immigrants at new destinations: How they
fare and why, IZA Discussion Papers 4892, Institute for the Study of Labor (IZA).
Carrington, W. J. and de Lima, P. (1996), ‘The impact of 1970srepatriates from Africa on
the Portuguese labor market’,Industrial and Labor Relations Review49(2), 330–347.
Centeno, M., Machado, C. and Novo, A. (2008), ‘The anatomy ofemployment growth in
Portuguese firms’,Banco de Portugal Economic BulletinSummer, 65–89.
Clark, K. and Drinkwater, S. (2000), ‘Pushed out or pulled in? Self-employment among
ethnic minorities in England and Wales’,Labour Economics7(5), 603–628.
D’Amuri, F., Ottaviano, G. I. and Peri, G. (2010), ‘The labormarket impact of immigration
in Western Germany in the 1990s’,European Economic Review54(4), 550–570.
Dickens, W., Goette, L., Groshen, E., Holden, S., Messina, J., Schweitzer, M., Turunen, J.
and Ward, M. (2007), ‘How wages change: Micro evidence from the international wage
flexibility project’, Journal of Economic Perspectives21(2), 195–214.
Du Caju, P., Fuss, C. and Wintr, L. (2007), Downward wage rigidity for different workers
and firms: An evaluation for Belgium using the IWFP procedure, Working Paper Series
840, European Central Bank.
Duarte, C. (2008), ‘A sectoral perspective on nominal and real wage rigidity in Portugal’,
Banco de Portugal Economic BulletinAutumn, 187–199.
Dustmann, C., Glitz, A. and Vogel, T. (2010), ‘Employment, wages, and the economic cycle:
Differences between immigrants and natives’,European Economic Review54(1), 1–17.
Friedberg, R. M. (2000), ‘You can’t take it with you? Immigrant assimilation and the porta-
bility of human capital’,Journal of Labor Economics18(2), 221–251.
Howitt, P. (2002), ‘Looking inside the labor market: A review article’, Journal of Economic
Literature40(1), 125–138.
Izquierdo, M., Lacuesta, A. and Vegas, R. (2009), ‘Assimilation of immigrants in Spain: A
longitudinal analysis’,Labour Economics16(6), 669–678.
Jean, S., Causa, O., Jiménez, M. and Wanner, I. (2010), ‘Migration and labour market out-
comes in OECD countries’,OECD Journal: Economic Studies2010(1), 1–34.
Kahn, S. (1997), ‘Evidence of nominal wage stickiness from microdata’, American Eco-
nomic Review87(5), 993–1008.
39

Lindbeck, A. and Snower, D. (1988),The Insider-Outsider Theory of Employment and Un-
employment, The MIT Press.
Longhi, S., Nijkamp, P. and Poot, J. (2005), ‘A meta-analytic assessment of the effect of
immigration on wages’,Journal of Economic Surveys19(3), 451–477.
Marques, J. C. and Góis, P. (2007), Ukrainian migration to Portugal. From non-existence to
the top three immigrant groups, Migrationonline.cz mimeo,Multicultural Center Prague.
Messina, J., Duarte, C. F., Izquierdo, M., Caju, P. D. and Hansen, N. L. (2010), ‘The inci-
dence of nominal and real wage rigidity: An individual-based sectoral approach’,Journal
of the European Economic Association8(2-3), 487–496.
OECD (2008a), The labour market integration of immigrants and their children in Portugal,
in ‘Jobs for Immigrants volume 2: Labour market integration inBelgium, France, the
Netherlands and Portugal’, OECD, chapter 5, pp. 269–332.
OECD (2008b), A Profile Of Immigrant Populations In The 21st Century: Data From OECD
Countries, OECD.
Ottaviano, G. I. and Peri, G. (2008), Immigration and national wages: Clarifying the theory
and the empirics, NBER Working Paper 14188, National Bureauof Economic Research.
Parsons, C. R., Skeldon, R., Walmsley, T. L. and Winters, L. A. (2007), Quantifying inter-
national migration: a database of bilateral migrant stocks, Policy Research Working Paper
Series 4165, The World Bank.
Peixoto, J. (2008), ‘Imigração e mercado de trabalho em Portugal: investigação e tendências
recentes’,Migrações(2), 19–46.
Portugal, P. (1999), ‘Employment volatility, employment protection and unemployment’,
Banco de Portugal Economic BulletinDecember, 49–60.
Taylor, J. B. (1979), ‘Staggered wage setting in a macro model’, American Economic Review
69(2), 108–13.
40

Banco de Portugal | Working Papers i
WORKING PAPERS
2008
1/08 THE DETERMINANTS OF PORTUGUESE BANKS’ CAPITAL BUFFERS — Miguel Boucinha
2/08 DO RESERVATION WAGES REALLY DECLINE? SOME INTERNATIONAL EVIDENCE ON THE DETERMINANTS OF RESERVATION WAGES
— John T. Addison, Mário Centeno, Pedro Portugal
3/08 UNEMPLOYMENT BENEFITS AND RESERVATION WAGES: KEY ELASTICITIES FROM A STRIPPED-DOWN JOB SEARCH APPROACH
— John T. Addison, Mário Centeno, Pedro Portugal
4/08 THE EFFECTS OF LOW-COST COUNTRIES ON PORTUGUESE MANUFACTURING IMPORT PRICES — Fátima Cardoso, Paulo Soares Esteves
5/08 WHAT IS BEHIND THE RECENT EVOLUTION OF PORTUGUESE TERMS OF TRADE? — Fátima Cardoso, Paulo Soares Esteves
6/08 EVALUATING JOB SEARCH PROGRAMS FOR OLD AND YOUNG INDIVIDUALS: HETEROGENEOUS IMPACT ON UNEMPLOYMENT DURATION
— Luis Centeno, Mário Centeno, Álvaro A. Novo
7/08 FORECASTING USING TARGETED DIFFUSION INDEXES — Francisco Dias, Maximiano Pinheiro, António Rua
8/08 STATISTICAL ARBITRAGE WITH DEFAULT AND COLLATERAL — José Fajardo, Ana Lacerda
9/08 DETERMINING THE NUMBER OF FACTORS IN APPROXIMATE FACTOR MODELS WITH GLOBAL AND GROUP-SPECIFIC FACTORS
— Francisco Dias, Maximiano Pinheiro, António Rua
10/08 VERTICAL SPECIALIZATION ACROSS THE WORLD: A RELATIVE MEASURE — João Amador, Sónia Cabral
11/08 INTERNATIONAL FRAGMENTATION OF PRODUCTION IN THE PORTUGUESE ECONOMY: WHAT DO DIFFERENT MEASURES TELL US?
— João Amador, Sónia Cabral
12/08 IMPACT OF THE RECENT REFORM OF THE PORTUGUESE PUBLIC EMPLOYEES’ PENSION SYSTEM — Maria Manuel Campos, Manuel Coutinho Pereira
13/08 EMPIRICAL EVIDENCE ON THE BEHAVIOR AND STABILIZING ROLE OF FISCAL AND MONETARY POLICIES IN THE US
— Manuel Coutinho Pereira
14/08 IMPACT ON WELFARE OF COUNTRY HETEROGENEITY IN A CURRENCY UNION — Carla Soares
15/08 WAGE AND PRICE DYNAMICS IN PORTUGAL — Carlos Robalo Marques
16/08 IMPROVING COMPETITION IN THE NON-TRADABLE GOODS AND LABOUR MARKETS: THE PORTUGUESE CASE — Vanda Almeida, Gabriela Castro, Ricardo Mourinho Félix
17/08 PRODUCT AND DESTINATION MIX IN EXPORT MARKETS — João Amador, Luca David Opromolla

Banco de Portugal | Working Papers ii
18/08 FORECASTING INVESTMENT: A FISHING CONTEST USING SURVEY DATA — José Ramos Maria, Sara Serra
19/08 APPROXIMATING AND FORECASTING MACROECONOMIC SIGNALS IN REAL-TIME — João Valle e Azevedo
20/08 A THEORY OF ENTRY AND EXIT INTO EXPORTS MARKETS — Alfonso A. Irarrazabal, Luca David Opromolla
21/08 ON THE UNCERTAINTY AND RISKS OF MACROECONOMIC FORECASTS: COMBINING JUDGEMENTS WITH SAMPLE AND MODEL INFORMATION
— Maximiano Pinheiro, Paulo Soares Esteves
22/08 ANALYSIS OF THE PREDICTORS OF DEFAULT FOR PORTUGUESE FIRMS — Ana I. Lacerda, Russ A. Moro
23/08 INFLATION EXPECTATIONS IN THE EURO AREA: ARE CONSUMERS RATIONAL? — Francisco Dias, Cláudia Duarte, António Rua
2009
1/09 AN ASSESSMENT OF COMPETITION IN THE PORTUGUESE BANKING SYSTEM IN THE 1991-2004 PERIOD — Miguel Boucinha, Nuno Ribeiro
2/09 FINITE SAMPLE PERFORMANCE OF FREQUENCY AND TIME DOMAIN TESTS FOR SEASONAL FRACTIONAL INTEGRATION
— Paulo M. M. Rodrigues, Antonio Rubia, João Valle e Azevedo
3/09 THE MONETARY TRANSMISSION MECHANISM FOR A SMALL OPEN ECONOMY IN A MONETARY UNION — Bernardino Adão
4/09 INTERNATIONAL COMOVEMENT OF STOCK MARKET RETURNS: A WAVELET ANALYSIS — António Rua, Luís C. Nunes
5/09 THE INTEREST RATE PASS-THROUGH OF THE PORTUGUESE BANKING SYSTEM: CHARACTERIZATION AND DETERMINANTS
— Paula Antão
6/09 ELUSIVE COUNTER-CYCLICALITY AND DELIBERATE OPPORTUNISM? FISCAL POLICY FROM PLANS TO FINAL OUTCOMES
— Álvaro M. Pina
7/09 LOCAL IDENTIFICATION IN DSGE MODELS — Nikolay Iskrev
8/09 CREDIT RISK AND CAPITAL REQUIREMENTS FOR THE PORTUGUESE BANKING SYSTEM — Paula Antão, Ana Lacerda
9/09 A SIMPLE FEASIBLE ALTERNATIVE PROCEDURE TO ESTIMATE MODELS WITH HIGH-DIMENSIONAL FIXED EFFECTS
— Paulo Guimarães, Pedro Portugal
10/09 REAL WAGES AND THE BUSINESS CYCLE: ACCOUNTING FOR WORKER AND FIRM HETEROGENEITY — Anabela Carneiro, Paulo Guimarães, Pedro Portugal
11/09 DOUBLE COVERAGE AND DEMAND FOR HEALTH CARE: EVIDENCE FROM QUANTILE REGRESSION — Sara Moreira, Pedro Pita Barros
12/09 THE NUMBER OF BANK RELATIONSHIPS, BORROWING COSTS AND BANK COMPETITION — Diana Bonfi m, Qinglei Dai, Francesco Franco

Banco de Portugal | Working Papers iii
13/09 DYNAMIC FACTOR MODELS WITH JAGGED EDGE PANEL DATA: TAKING ON BOARD THE DYNAMICS OF THE IDIOSYNCRATIC COMPONENTS
— Maximiano Pinheiro, António Rua, Francisco Dias
14/09 BAYESIAN ESTIMATION OF A DSGE MODEL FOR THE PORTUGUESE ECONOMY — Vanda Almeida
15/09 THE DYNAMIC EFFECTS OF SHOCKS TO WAGES AND PRICES IN THE UNITED STATES AND THE EURO AREA — Rita Duarte, Carlos Robalo Marques
16/09 MONEY IS AN EXPERIENCE GOOD: COMPETITION AND TRUST IN THE PRIVATE PROVISION OF MONEY — Ramon Marimon, Juan Pablo Nicolini, Pedro Teles
17/09 MONETARY POLICY AND THE FINANCING OF FIRMS — Fiorella De Fiore, Pedro Teles, Oreste Tristani
18/09 HOW ARE FIRMS’ WAGES AND PRICES LINKED: SURVEY EVIDENCE IN EUROPE — Martine Druant, Silvia Fabiani, Gabor Kezdi, Ana Lamo, Fernando Martins, Roberto Sabbatini
19/09 THE FLEXIBLE FOURIER FORM AND LOCAL GLS DE-TRENDED UNIT ROOT TESTS — Paulo M. M. Rodrigues, A. M. Robert Taylor
20/09 ON LM-TYPE TESTS FOR SEASONAL UNIT ROOTS IN THE PRESENCE OF A BREAK IN TREND — Luis C. Nunes, Paulo M. M. Rodrigues
21/09 A NEW MEASURE OF FISCAL SHOCKS BASED ON BUDGET FORECASTS AND ITS IMPLICATIONS — Manuel Coutinho Pereira
22/09 AN ASSESSMENT OF PORTUGUESE BANKS’ COSTS AND EFFICIENCY — Miguel Boucinha, Nuno Ribeiro, Thomas Weyman-Jones
23/09 ADDING VALUE TO BANK BRANCH PERFORMANCE EVALUATION USING COGNITIVE MAPS AND MCDA: A CASE STUDY
— Fernando A. F. Ferreira, Sérgio P. Santos, Paulo M. M. Rodrigues
24/09 THE CROSS SECTIONAL DYNAMICS OF HETEROGENOUS TRADE MODELS — Alfonso Irarrazabal, Luca David Opromolla
25/09 ARE ATM/POS DATA RELEVANT WHEN NOWCASTING PRIVATE CONSUMPTION? — Paulo Soares Esteves
26/09 BACK TO BASICS: DATA REVISIONS — Fatima Cardoso, Claudia Duarte
27/09 EVIDENCE FROM SURVEYS OF PRICE-SETTING MANAGERS: POLICY LESSONS AND DIRECTIONS FOR ONGOING RESEARCH
— Vítor Gaspar , Andrew Levin, Fernando Martins, Frank Smets
2010
1/10 MEASURING COMOVEMENT IN THE TIME-FREQUENCY SPACE — António Rua
2/10 EXPORTS, IMPORTS AND WAGES: EVIDENCE FROM MATCHED FIRM-WORKER-PRODUCT PANELS — Pedro S. Martins, Luca David Opromolla
3/10 NONSTATIONARY EXTREMES AND THE US BUSINESS CYCLE — Miguel de Carvalho, K. Feridun Turkman, António Rua
Banco de Portugal | Working Papers iv
4/10 EXPECTATIONS-DRIVEN CYCLES IN THE HOUSING MARKET — Luisa Lambertini, Caterina Mendicino, Maria Teresa Punzi
5/10 COUNTERFACTUAL ANALYSIS OF BANK MERGERS — Pedro P. Barros, Diana Bonfi m, Moshe Kim, Nuno C. Martins
6/10 THE EAGLE. A MODEL FOR POLICY ANALYSIS OF MACROECONOMIC INTERDEPENDENCE IN THE EURO AREA — S. Gomes, P. Jacquinot, M. Pisani
7/10 A WAVELET APPROACH FOR FACTOR-AUGMENTED FORECASTING — António Rua
8/10 EXTREMAL DEPENDENCE IN INTERNATIONAL OUTPUT GROWTH: TALES FROM THE TAILS — Miguel de Carvalho, António Rua
9/10 TRACKING THE US BUSINESS CYCLE WITH A SINGULAR SPECTRUM ANALYSIS — Miguel de Carvalho, Paulo C. Rodrigues, António Rua
10/10 A MULTIPLE CRITERIA FRAMEWORK TO EVALUATE BANK BRANCH POTENTIAL ATTRACTIVENESS — Fernando A. F. Ferreira, Ronald W. Spahr, Sérgio P. Santos, Paulo M. M. Rodrigues
11/10 THE EFFECTS OF ADDITIVE OUTLIERS AND MEASUREMENT ERRORS WHEN TESTING FOR STRUCTURAL BREAKS IN VARIANCE
— Paulo M. M. Rodrigues, Antonio Rubia
12/10 CALENDAR EFFECTS IN DAILY ATM WITHDRAWALS — Paulo Soares Esteves, Paulo M. M. Rodrigues
13/10 MARGINAL DISTRIBUTIONS OF RANDOM VECTORS GENERATED BY AFFINE TRANSFORMATIONS OF INDEPENDENT TWO-PIECE NORMAL VARIABLES
— Maximiano Pinheiro
14/10 MONETARY POLICY EFFECTS: EVIDENCE FROM THE PORTUGUESE FLOW OF FUNDS — Isabel Marques Gameiro, João Sousa
15/10 SHORT AND LONG INTEREST RATE TARGETS — Bernardino Adão, Isabel Correia, Pedro Teles
16/10 FISCAL STIMULUS IN A SMALL EURO AREA ECONOMY — Vanda Almeida, Gabriela Castro, Ricardo Mourinho Félix, José Francisco Maria
17/10 FISCAL INSTITUTIONS AND PUBLIC SPENDING VOLATILITY IN EUROPE — Bruno Albuquerque
18/10 GLOBAL POLICY AT THE ZERO LOWER BOUND IN A LARGE-SCALE DSGE MODEL — S. Gomes, P. Jacquinot, R. Mestre, J. Sousa
19/10 LABOR IMMOBILITY AND THE TRANSMISSION MECHANISM OF MONETARY POLICY IN A MONETARY UNION — Bernardino Adão, Isabel Correia
20/10 TAXATION AND GLOBALIZATION — Isabel Correia
21/10 TIME-VARYING FISCAL POLICY IN THE U.S. — Manuel Coutinho Pereira, Artur Silva Lopes
22/10 DETERMINANTS OF SOVEREIGN BOND YIELD SPREADS IN THE EURO AREA IN THE CONTEXT OF THE ECONOMIC AND FINANCIAL CRISIS
— Luciana Barbosa, Sónia Costa

Banco de Portugal | Working Papers v
23/10 FISCAL STIMULUS AND EXIT STRATEGIES IN A SMALL EURO AREA ECONOMY — Vanda Almeida, Gabriela Castro, Ricardo Mourinho Félix, José Francisco Maria
24/10 FORECASTING INFLATION (AND THE BUSINESS CYCLE?) WITH MONETARY AGGREGATES — João Valle e Azevedo, Ana Pereira
25/10 THE SOURCES OF WAGE VARIATION: AN ANALYSIS USING MATCHED EMPLOYER-EMPLOYEE DATA — Sónia Torres,Pedro Portugal, John T.Addison, Paulo Guimarães
26/10 THE RESERVATION WAGE UNEMPLOYMENT DURATION NEXUS — John T. Addison, José A. F. Machado, Pedro Portugal
27/10 BORROWING PATTERNS, BANKRUPTCY AND VOLUNTARY LIQUIDATION — José Mata, António Antunes, Pedro Portugal
28/10 THE INSTABILITY OF JOINT VENTURES: LEARNING FROM OTHERS OR LEARNING TO WORK WITH OTHERS — José Mata, Pedro Portugal
29/10 THE HIDDEN SIDE OF TEMPORARY EMPLOYMENT: FIXED-TERM CONTRACTS AS A SCREENING DEVICE — Pedro Portugal, José Varejão
30/10 TESTING FOR PERSISTENCE CHANGE IN FRACTIONALLY INTEGRATED MODELS: AN APPLICATION TO WORLD INFLATION RATES
— Luis F. Martins, Paulo M. M. Rodrigues
31/10 EMPLOYMENT AND WAGES OF IMMIGRANTS IN PORTUGAL — Sónia Cabral, Cláudia Duarte


