Embed Size (px)
Citation preview

ESTUARINE BIODIVERSITY SPECIALIST STUDY FOR AN EIA
FOR DEEPENING, LENGTHENING AND WIDENING OF
BERTH 203 TO 205, PIER 2, CONTAINER TERMINAL, IN THE
PORT OF DURBAN
Report prepared for Nemai Consulting
October 2012
Prepared for
Nemai Consulting
PO Box 1673
Sunninghill 2157
Johannesburg, South Africa
Tel: (011) 781 1730
Fax: (011) 781 1731
Prepared by
Sean Porter, Barry Clark & Ken Hutchings
8 Steenberg House
Silverwood Close
Tokai 7945
Tel: (021) 7013420
Fax: (086) 542 8711
www.anchorenvironmental.co.za

i
Executive Summary
This study assesses the marine-estuarine ecological impacts of a proposal by Transnet
National Ports Authority (TNPA) to deepen, widen and lengthen Berths 203 to 205 of Pier No 2 in the
Port of Durban, South Africa. These berths are to be expanded 170 m west, 100 m east and 50 m
seaward. Three construction options for the quay walls exist, namely Deck on Pile option, a Sheet
Pile option; and a Caisson option. Each of the three options destroys a similar amount of intertidal
and subtidal habitat. Amounts of open water habitat lost varies between options but this is not
considered significant.
The habitat area potentially affected by the proposed project is located in the central parts
of the harbour, and consists of open water area, subtidal soft sediments and intertidal-sand-flat
habitat at Centre Bank that is zoned for conservation according to the draft Bay of Natal Estuary
Management Plan. The subtidal habitat ranges in depth from 0 to 16 m CDP, and comprises 30 to
70% mud. Intertidal and shallow subtidal habitat at Centre Bank is very different and composed of
less than 5% mud and predominantly fine to medium sands (0.125 - 0.500 mm).
Over 563 marine species have been recorded within the Port of Durban and it is recognised
as being an extremely important nursery area for juvenile fishes, many of which are critically
dependent on estuaries. The intertidal and shallow subtidal sand flats provide particularly important
habitat for fishes, Callianasid prawns and other invertebrates which in turn support large numbers of
waders and other waterbirds. Deeper subtidal areas are dominated by many different species of
Polychaete worm and different fish communities. There are a number of Ramsar Site criteria that
the Bay meets.
The expected impacts include destruction and disturbance of intertidal and subtidal soft
bottom habitat and associated invertebrate and fish communities resulting from the expansion of
the Berths, dredging and the placement of stabilising mattresses on the western, eastern and
southern slopes of Centre Bank and rocky scour protection adjacent to berths. These effects may be
reduced only by strict adherence to a suite of proposed mitigation measures that include
refilling/backfilling and enlarging of the Centre Bank sand flat (via Option 3G) in addition to strict
operating rules pertaining to dredging such that the extent of any turbidity plumes are minimised
and do not exceed specified threshold levels. It is believed that all residual impacts of the proposed
development will be offset with the adoption of Option 3G provided that the artificial extension of
Centre Bank can be done successfully from an ecological perspective. There is however both
uncertainty and risk associated with the artificial creation of sand bank habitat in estuaries as there
is little literature on the subject. Offshore dredge spoils do however recover successfully and are
colonised by organisms relatively quickly. It is therefore expected that this mitigation measure will
be successful with a medium level of certainty. Overall impact significance can therefore be reduced
to low levels A monitoring program to determine the actual impacts of the widening of the Berths on
the biodiversity of Durban Harbour is recommended and described, from pre-construction and into
the operational phase of the Berths. In addition, monitoring of the backfilled part of the Centre Bank
sand bank and the artificially enlarged portion of this sand bank is recommended. Monitoring of
turbidity levels during dredging is also prescribed to ensure that threshold limits are not exceeded.

ii
Table of Contents
1 Introduction ................................................................................................................................ 1
2 Development proposal ............................................................................................................... 1
3 Scope ......................................................................................................................................... 11
4 Concerns raised by I&APs pertinent to this study .................................................................... 12
5 Methods .................................................................................................................................... 16
6 Description of the affected environment ................................................................................. 16
6.1 Habitat types within the Durban Harbour and relevant environmental characteristics. ..... 16
6.2 Overview of the biodiversity in the Port of Durban .............................................................. 21
6.2.1 Overview of the macrofaunal community composition and relative abundance within
the Port of Durban ........................................................................................................................ 23
6.2.2 Overview of the fish fauna in the Port of Durban ......................................................... 27
6.3 Centre Bank habitat and biodiversity .................................................................................... 29
6.4 Dredge channel habitat and biodiversity .............................................................................. 30
6.5 Little Lagoon habitat and biodiversity ................................................................................... 33
7 Potential for RAMSAR Site designation .................................................................................... 39
8 Potential habitat transformation as a result of the proposed development ........................... 41
9 Impact on microalgae, macrofaunal and ichthyofaunal communities ..................................... 46
9.1 Site-specific considerations in the assessment of potential impacts on the biodiversity of
the Port of Durban ................................................................................................................. 46
9.2 Impact description and assessment ...................................................................................... 48
10 Mitigation .................................................................................................................................. 67
11 Monitoring Programme ............................................................................................................ 68
12 References ................................................................................................................................ 69

1
1 Introduction
Transnet National Ports Authority (TNPA) is planning to deepen, widen and lengthen Berths 203 to
205 of Pier No 2 in the Port of Durban, South Africa. The rational is to improve the safety of the
berths as they do not conform to minimum Eurocode 7 Safety Standards. In addition, the efficiency
of the Port will be concomitantly increased.
Nemai Consulting was appointed to conduct the Scoping and Environmental Impact Assessment
(EIA) study, and subsequently subcontracted Anchor Environmental Consultants to conduct a
specialist study on potential impacts of the development on the local estuarine marine ecology of
the Port of Durban.
2 Development proposal
The proposed upgrade of the existing Berths 203 to 205 of Pier No 2 is located in the eThekwini
Municipality in the Port of Durban. The proposed upgrade will include the following:
Westward lengthening of Berth 205 by 170 m;
Eastward lengthening of Berth 203 by 100 m;
Seaward widening of Berths 203, 204 & 205 by 50 m;
Deepening by dredging of the berth channel, approach channel and vessel turning basin;
from the current depth of -12.8 m to -16.5 m Chart Datum Port (CDP);
Offshore disposal of dredge material;
Offshore sand winning for infill material;
Installation of new Ship to Shore cranes and associated infrastructure;
Precasting of beams, storage of sheet piles or construction of caissons at Bayhead Lot 10;
and
Stabilisation of the Centre Bank with subtidal mattress’s
Artificial extension of Centre Bank to mitigate against habitat loss (Development Options 3C
to 3G)
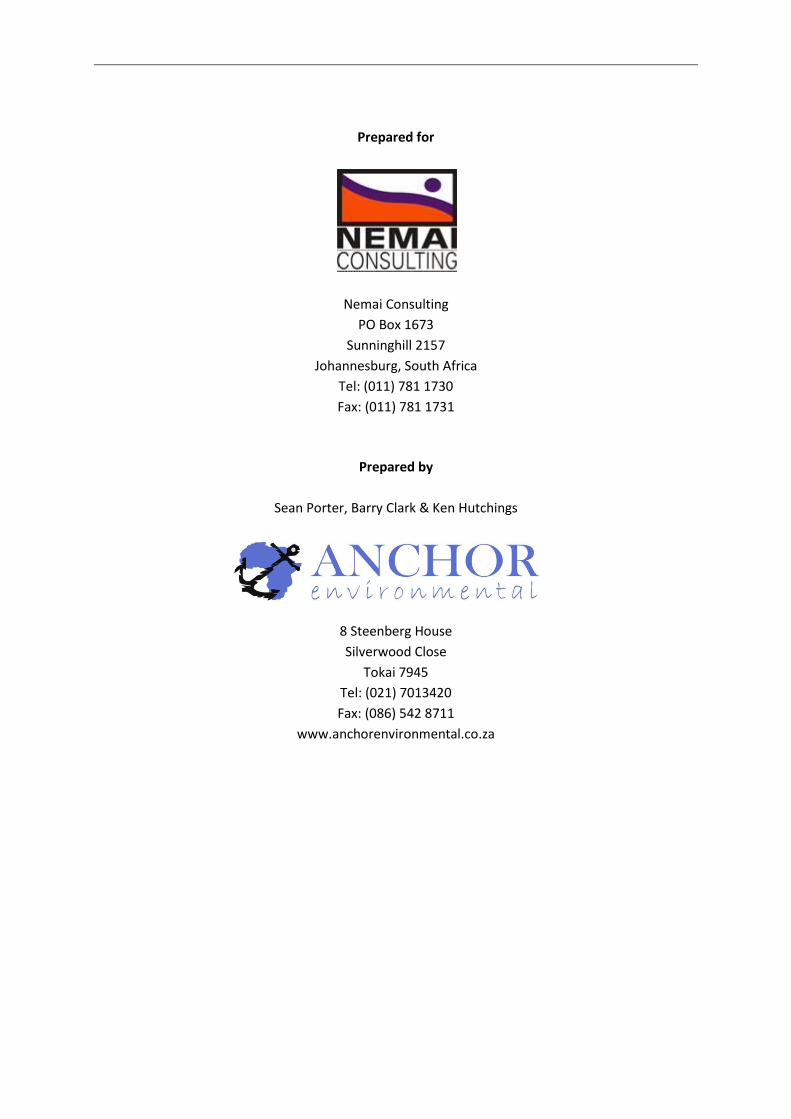
Three technical options will be considered for the berth, namely, a Deck on Pile option, a Sheet Pile
option; and a Caisson option (Figure 1, Figure 2 & Figure 3). The Caisson option may involve further
excavation of the seabed after dredging if clay occurs and not sand in certain parts of the
foundation. Indications are that there are very unfavourable soft clays (Hippo Mud) for the entire
area beneath the footprint of where Berth 205 may be extended (ZAA 2012b). Construction of
crushed stone, sand, rockfill or soil-cement replacement foundation to a minimum total depth of
2.35 m below seabed level is required in order that a minimum Factor of Safety of 2.0 for bearing
capacity is achieved (ZAA 2012b). This could create a localised and temporary enhancement of
turbidity.
The Sheet-pile option will involve driving to bedrock HZM-1180 MD King piles at 2.258 m intervals as
well as AZ-26 section infill panels between these, to an average depth of -35 m CDP and as deep as -
55 CDP at the eastern end of Berth 203 (ZAA 2012b). A barge will be used for this operation before
dredging is conducted. Once the sheet-pile wall is stable then the area in front of it can be dredged

2
deeper. The driving in of the piles and panels is likely to create a localised and temporary
enhancement of turbidity at the construction site.
The Deck-on-pile option will require outer piles spaced at 6.67 m intervals along with inner piles, all
to be driven down to an average depth of -35 CDP. Piles are likely to be driven from a barge or
travelling platform. (ZAA 2012b).
In addition, various incremental development options are proposed to mitigate the loss of sand flat
on Centre Bank during and after construction of the quay walls (Figure 4, Figure 5 & Figure 6) and to
reduce the footprint of the dredge area (Figure 7, Figure 8 & Figure 9). Option 3B (Figure 4) shows
the dredging layout prior to mitigation. Option 3C (Figure 5) then shows how the dredged area of
the Centre Bank sand flat at the western end of Berth 205 could be backfilled up to the quay wall.
Option 3D (Figure 6) includes backfilling of the Centre Bank sand flat up to the western end of the
quay wall as well as infilling along the southern edge of the Centre Bank with dredged material as
compensation for sandbank area lost as a result of the expansion of the existing quay wall. Later
options (i.e. Options 3E to 3G) all progressively reduce the size of the dredge footprint and increase
the artificial southwards extension of the Centre Bank sand flat in an attempt to mitigate against the
loss of sand bank due to the proposed westward extension of Berth 205 into the Centre Bank.
Due to the proposed dredging and deepening of the shipping lanes adjacent to the berths, the
stability of the Centre Bank is now a concern and therefore support mattresses on the western,
southern and eastern sides where the slope is at a gradient of 1:3 have been proposed to mitigate
against slumping and erosion (Figure 10). Mattresses on the western and eastern slopes will be
overlaid onto the surfaces of the slopes of the sand bank and extend from -16.5 m to 0 m CDP
(Figure 10). Mattresses on the southern slopes will only overlie areas of the bank at depths of -16.5
to -12.8 m CDP (Figure 10).
Figure 1. Proposed upgrade of the existing Berths 203 to 205 of Pier No 2 in the Port of Durban - Deck on Pile Quay
Wall option.
3
Figure 2. Proposed upgrade of the existing Berths 203 to 205 of Pier No 2 in the Port of Durban - Sheet Pile Quay Wall
option.
Figure 3. Proposed upgrade of the existing Berths 203 to 205 of Pier No 2 in the Port of Durban - Caisson Quay Wall
option.

4
Figure 4. Option 3B showing the dredge layout relative to the Centre Bank sand flat and Piers 2 and 1.

5
Figure 5. Option 3C showing how the sand flat at the western end of Berth 205 can be in-filled up to the quay wall.

6
Figure 6. Option 3D showing the area in-filled at the western end of Berth 205 and the proposed expansion of the southern edge of the Centre Bank sand flat shown in brown.

7
Figure 7. Option 3E shows the reshaping of the dredged area to reduce its overall extent and increase the size of the proposed expansion of the sand bank (brown area).

8
Figure 8. Option 3F. The shape of the dredged area at Little Lagoon end (i.e west end) is now modified to reduce the risk of affecting Little Lagoon, and also to further increase the size of the proposed extension of the sandbank relative to its size in previous options (i.e. Options 3D-3E).

9
Figure 9. Option 3G. Volume of dredged area further reduced from previous options and the proposed southwards extension of the sandbank increased even more.

10
Figure 10. Option 3G showing areas of the sand bank that will be stabilised with mattresses. Red shading indicates where mattresses will cover the slopes of the sand bank from -16.5 to 0 m CDP and orange shading where mattresses will cover the slopes of the sand back from depths of -16.5 to -12.8 m CDP.

11
3 Scope
The scope of the specialist estuarine ecology study was agreed as follows:
i) A description of the affected environment, identified as the whole of the Durban Bay but
focussing specifically on the dredge channels adjacent to Berth 203-205, the central sand
bank and the area referred to as Little Lagoon, and its importance to all biota aside from
avifauna1, based on available data;
ii) An assessment (using suitable evaluation criteria) of all potential impacts (direct, indirect
and cumulative) on the biodiversity of Durban Bay associated with all project alternatives;
iii) Recommendations for suitable mitigation measures as required;
iv) A statement of the significance of impacts associated with each issue, which will specify
whether or not a pre-determined threshold of significance (i.e. changes in effects to the
environment which would change a significance rating) has been exceeded, and whether
or not the impact presents a potential fatal flaw or not, both before and after application
of impact management actions; and
v) A statement of which of the project alternatives will have the least impact on biodiversity.
1 Note that impacts on birds are addressed in a separate study

12
4 Concerns raised by I&APs pertinent to this study
A number of issues were raised and captured in the Comments and Response Report
prepared as part of the Scoping phase for this study that are relevant to this specialist study. These
are captured in Table 1 below and have been addressed in this report.
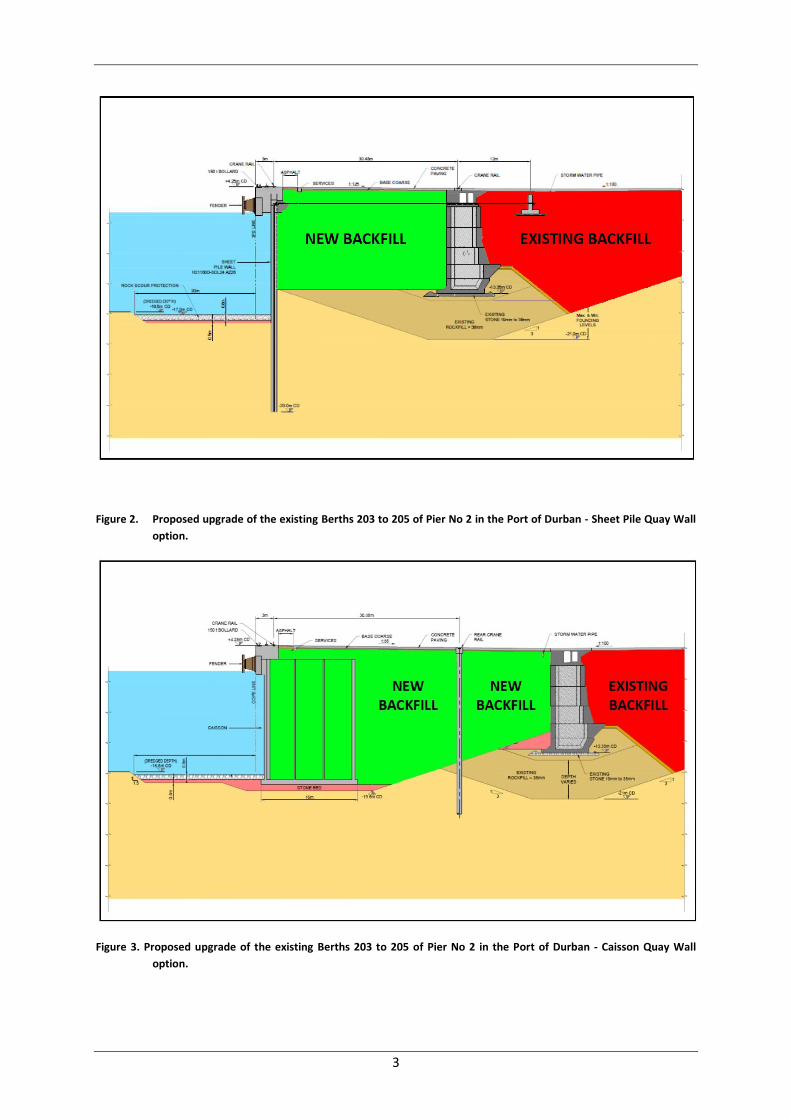
Table 1. Issues raised and during the Scoping phase of this project relevant to this study
COMMENT/QUERY/ISSUE RAISED BY
One of the main impacts that need to be considered is the impact on the Central Sandbank and the Little Lagoon. There is a need to quantify the loss of the Central Sandbank so that this impact can be mitigated.
WESSA
One of the main impacts that need to be considered is the impact on the Central Sandbank and the Bayhead Mangroves.
Bruce Soutar
How will the sandbanks be impacted by the berthing of larger ships. WESSA
The sand beds are “soft habitats” and are the driving force behind the productivity of the Durban Bay Estuary as a marine nursery.
WESSA
Asked for a schematic illustration of the actual boundaries of the dig-out of the central sandbank (i.e. the exact footprint of the impact on the Central Sandbank).
Rory O’Connor
Expressed disagreement with the proposed project due to the impact on the Central Sandbank. Noted that fish spawn on the sandbanks and thus the proposed project will impact on future marine life and the subsistence fisherman who rely on the Central Sandbank.
Michael Padayachee, KZN Subsistence
Fisherman Forum
Asked how fish breeding on the Central Sandbank will be impacted on. Michael Padayachee,
KZN Subsistence Fisherman Forum
Asked if there will be any impact on the current sand stockpile adjacent to the Little Lagoon and Sandbank?
Max Magnussen
Expressed concern that the extension of the Berth into the Central Sandbank will cause the banks of the sandbank to collapse.
Michael Padayachee, KZN Subsistence
Fisherman Forum
What is the extent of the impact on the Central Sandbank and whether the scour protection at Berth 205 will be visible at spring low tide.
Max Magnussen
What is the extent of the impact on the Central Sandbank? Hoosen Bobat
Expressed concern that extending Berth 205 into the Central Sandbank will have impacts on juvenile fish and other marine life and pointed out that it would be better to start 50m inland.
Per Bjorvig
This project is necessary however negative impacts on the Central Sandbank should be mitigated through offsets.
Lindy Delport, Process Pipe
Asked what is the exact extent of the impact on the Central Sandbank? Kamcilla Pillay, Daily
News
Asked what is the exact extent of the impact on the Central Sandbank and how will this impact the ecology of the sandbank?
Patrick Eugene, KZN Subsistence Fisherman
Forum
Expressed concern that the sandbanks are a very sensitive ecological area and should not be tampered with.
Vivienne Venter
The following issues were likely to have a negative impact and would require further assessment: 1. Slope stability of the sandbanks; 2. Increased tug/ship action resulting in additional wave action on the bed and
Coastal Policy and Coastal, Stormwater
and Catchment Management
13
COMMENT/QUERY/ISSUE RAISED BY
slopes of the sand banks; 3. Removal and loss of habitat; and 4. Changes in the tidal prism and erosional impacts on the sandbanks.
Department, eThekwini Metropolitan Municipality
One of the main impacts that need to be considered is the impact on the Little Lagoon.
Carolyn Schwegman: WESSA
Has rehabilitation of the Little Lagoon taken place by Transnet. Bianca Mckelvey:
WESSA
Enquired as whether any offset measures against impacts on the Little Lagoon were being considered.
Sabelo Nkosi: Development Planning,
Environment and Management:
eThekwini Metropolitan Municipality
There does not appear to be enough baseline data related to biophysical monitoring throughout the entire Durban bay system.
WESSA
How will the Durban Bay Estuary Management Plan will be incorporated into the planning process.
WESSA
Expressed concern that Durban Bay has been at a tipping point for a long time and its sustainability is hanging by a thread and that it cannot be viewed as just a harbour. Durban Bay needs to be treated as an ecosystem that provides free goods and services.
Judy Bell
Expressed concern about the potential impacts of the project on the ecological health of the Bay and hence its ability to continue to deliver high value goods and services that are irreplaceable to the region.
Bianca Mckelvey WESSA
Expressed concern that although the footprint of the development may appear to have a proportionally small direct impact on the important habitat of the Bay, the direct impacts on important habitats and the whole ecology of the Bay are far larger than the footprint of the proposed extension, given the various activities than would need to take place beneath the surface water (eg. extensive dredging) and the knock-on impacts these would have. Expressed concern that there may be significant anticipated impacts on the most significant and productive habitats of the Bay, exacerbated by unexpected changes that will have an uncertain impact on the health and resilience of the ecosystem.
Bianca Mckelvey WESSA
It is critical that the potential impacts on the Bay not be viewed in isolation, but rather with the current condition and resilience of the Bay in mind. Some of the potential impacts of the proposed development may not seem highly significant, until the cumulative impacts are taken into consideration.
Bianca Mckelvey WESSA
The following comments were raised: 1. Durban Bay is one of the only three South African estuaries that falls in the Estuarine Bay categories and as a result of the strong marine influence, the system supports more species than almost any other estuary in South Africa. 2. Due to the strong degree of conductivity that occurs in aquatic environments, changes to one of these areas has far reaching regional consequences. 3. There are studies to suggest that Durban Bay is at a threshold where further development could result in ecological collapse. 4. At a local scale, the loss of biodiversity within Durban Bay would severely compromise the long term functioning of the system. 5. Approximately 57% of the Bay has been infilled. In addition, only 4% of the natural shoreline, 14% of the tidal flat area, and 3% of the mangrove areas remain. 6. The impact of the proposed development includes: a. Direct loss of intertidal sandbank; b. Further loss of the intertidal sandbank as a result of erosion due to larger vessels moving through the area; c. Infilling and subsequent loss of water areas; and
Environmental Planning and Climate Protection
Department, eThekwini Metropolitan
Municipality
14
COMMENT/QUERY/ISSUE RAISED BY
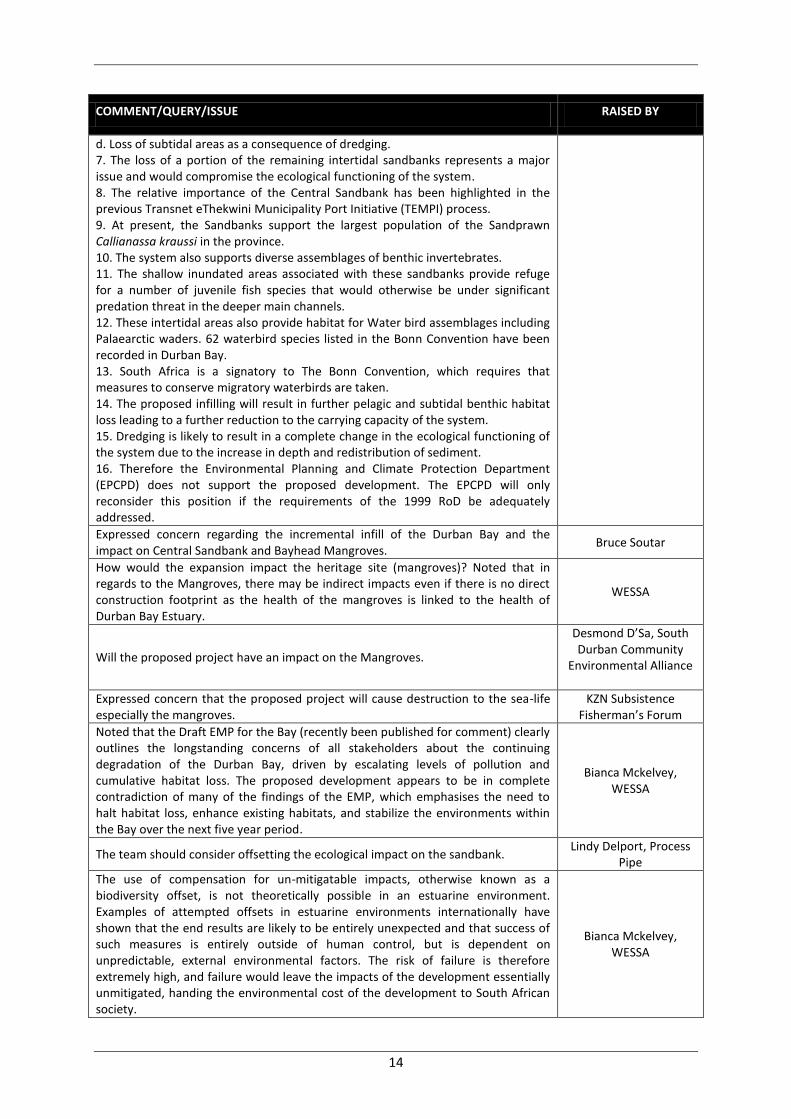
d. Loss of subtidal areas as a consequence of dredging. 7. The loss of a portion of the remaining intertidal sandbanks represents a major issue and would compromise the ecological functioning of the system. 8. The relative importance of the Central Sandbank has been highlighted in the previous Transnet eThekwini Municipality Port Initiative (TEMPI) process. 9. At present, the Sandbanks support the largest population of the Sandprawn Callianassa kraussi in the province. 10. The system also supports diverse assemblages of benthic invertebrates. 11. The shallow inundated areas associated with these sandbanks provide refuge for a number of juvenile fish species that would otherwise be under significant predation threat in the deeper main channels. 12. These intertidal areas also provide habitat for Water bird assemblages including Palaearctic waders. 62 waterbird species listed in the Bonn Convention have been recorded in Durban Bay. 13. South Africa is a signatory to The Bonn Convention, which requires that measures to conserve migratory waterbirds are taken. 14. The proposed infilling will result in further pelagic and subtidal benthic habitat loss leading to a further reduction to the carrying capacity of the system. 15. Dredging is likely to result in a complete change in the ecological functioning of the system due to the increase in depth and redistribution of sediment. 16. Therefore the Environmental Planning and Climate Protection Department (EPCPD) does not support the proposed development. The EPCPD will only reconsider this position if the requirements of the 1999 RoD be adequately addressed.
Expressed concern regarding the incremental infill of the Durban Bay and the impact on Central Sandbank and Bayhead Mangroves.
Bruce Soutar
How would the expansion impact the heritage site (mangroves)? Noted that in regards to the Mangroves, there may be indirect impacts even if there is no direct construction footprint as the health of the mangroves is linked to the health of Durban Bay Estuary.
WESSA
Will the proposed project have an impact on the Mangroves.
Desmond D’Sa, South Durban Community
Environmental Alliance
Expressed concern that the proposed project will cause destruction to the sea-life especially the mangroves.
KZN Subsistence Fisherman’s Forum
Noted that the Draft EMP for the Bay (recently been published for comment) clearly outlines the longstanding concerns of all stakeholders about the continuing degradation of the Durban Bay, driven by escalating levels of pollution and cumulative habitat loss. The proposed development appears to be in complete contradiction of many of the findings of the EMP, which emphasises the need to halt habitat loss, enhance existing habitats, and stabilize the environments within the Bay over the next five year period.
Bianca Mckelvey, WESSA
The team should consider offsetting the ecological impact on the sandbank. Lindy Delport, Process
Pipe
The use of compensation for un-mitigatable impacts, otherwise known as a biodiversity offset, is not theoretically possible in an estuarine environment. Examples of attempted offsets in estuarine environments internationally have shown that the end results are likely to be entirely unexpected and that success of such measures is entirely outside of human control, but is dependent on unpredictable, external environmental factors. The risk of failure is therefore extremely high, and failure would leave the impacts of the development essentially unmitigated, handing the environmental cost of the development to South African society.
Bianca Mckelvey, WESSA

15
COMMENT/QUERY/ISSUE RAISED BY
WESSA are not in favour of the use of offsets in any circumstance, and feel that this should only be considered in truly exceptional circumstances (as described in provincial policy)
Bianca Mckelvey, WESSA
Possible impacts as well as mitigation measures are identified in the EIA Phase. KZN Department of
Water Affairs
Who is the Estuarine Specialist? WESSA
The Specialist studies must consider national conservation goals and targets that have not yet been integrated into provincial systematic conservation planning (for example, the national target of 100% for mangrove communities
Bianca Mckelvey, WESSA
Requested that the results of various specialist studies need to be holistically considered, so that all studies start from the same baseline of information, and results can be properly integrated and thus we were pleased to hear at the Open Day that all specialists will be given the opportunity to meet and discuss preliminary results throughout the assessment process
Bianca Mckelvey, WESSA
Reiterated that the inclusion of impacts upon subsistence use of the Bay into studies on ecological impacts is illogical. Given the significance of impacts to this sector, the impact of the proposed development on subsistence fishing (both on-site and as a result of potential loss of productivity in local fisheries) must be considered in appropriate detail by a suitably qualified specialist
Bianca Mckelvey, WESSA

16
5 Methods
A number of studies have been completed in recent years covering the estuarine biota of the Port of
Durban, including the intertidal and shallow subtidal sand banks (see for example Pillay, 2002; Angel
& Clark, 2008; Newman et al. 2008; Weerts, 2010). These data were used to assess the significance
of potential impacts that the proposed development may have on the biota of the Port of Durban in
the future. Furthermore, spatial data on habitat types relevant to the macrofauna of the Port and
spatial data on the development footprint were analysed using GIS software to determine the scale
of the impacts. Data were projected according to the Latitude Orientated (Transverse Mercator)
coordinate system with 31 degrees latitude set as the central meridian and Hartebeesthoek 94 as
the datum.
6 Description of the affected environment
6.1 Habitat types within the Durban Harbour and relevant
environmental characteristics.
There are a number of habitat types within the Port of Durban that could potentially be affected by
the proposed development (Figure 11). These include:
1. intertidal sand flat habitat (the wetted area between the lowest and highest astronomical
tides),
2. shallow subtidal sand flat habitat (extends from the lowest astronomical tide down to a
depth of -1 m ) including areas such as at Little Lagoon, medium subtidal habitat at the
upper margins of the dredged shipping channels (-1m to -3 m)
3. deep subtidal such as the lower edges of shipping channels and deeper portions channels
from a depth of -3 m to -12.8 m).
In all cases, the habitat area includes the substratum and the overlying water column and are
important for a range of organisms, the most important of which include microalgae (benthic
microalgae and phytoplankton), invertebrates (benthic invertebrates and zooplankton), fish and
birds. Few macroalgae and no rooted plants such as mangroves occur in the area potentially
affected directly or indirectly by the development and are thus not considered in detail here.
Intertidal sand flats in the Port of Durban vary in their elevations, but most of the surface area lies at
heights of between 0 – 1m CDP (CSIR 2012b) (Figure 12). They consist of varying proportions of sand
and mud, with the mud content ranging from 5 to 50% (Figure 13) (Wright, 1996). The intertidal flats
of the Centre Bank, the Fish Wharf and Yacht Basin are largely dominated by sand (80-90%), with
medium and fine grain sands the dominant size class by weight (Wright, 1996; Newman et al. 2008).
The intertidal areas at Bayhead, adjacent to the mangroves, are, by contrast, comprised of
proportionally more mud with a sand fraction of 50-70%. Comparatively little shallow and medium
shallow subtidal areas of the bay remain and most of it has been dredged to -12.8 m (Figure 12). The
majority of these deep subtidal areas of the harbour consist of varying proportions of sand and mud

17
too; however mud content is generally higher, ranging from 10 to 90%. Mud content is highest near
the head of the bay and lowest near the harbour mouth (Figure 13) (Wright, 1996).
Durban Harbour is considered to be highly transformed, with most of the natural habitat destroyed
as a result of dredging operations during the construction of the harbour (Allan et al. 1999). Very
little of the natural habitat remains, and it is estimated that only 14% of the original tidal flats
remain (Allan et al. 1999). These tidal flats have been dredged to depths of approximately 13 m
below sea-level, which is the operational depth of the Port (Weerts, 2010). The mangrove swamp
area has also been severely reduced. Durban Harbour had an extensive mangrove forest of
approximately 200 ha in extent, but 78% of this was physically removed in 1979 when construction
of the harbour began (Ward & Steinke, 1982). These habitats have been replaced with open water
areas and concrete Berths to allow for the safe passage and mooring of large vessels (Figure 14).
Figure 11. Aerial view of the Port of Durban during spring-low tide showing the intertidal sand flats and deeper (mostly)
dredged shipping channels covered by open water.
Currently, intertidal flats in the harbour constitute an area of 144.5 hectares, while the substratum
lying beneath the open waters is the dominant habitat covering an area of 714.6 ha (McInnes et al.
2005). This dominat habitat has been artificalliy created by dredging, and dredge scars are very
evident (Figure 15). The Centre Bank, an intertidal sand bank adjacent to the proposed development
is 83 ha in size and the largest of four sand flats in the port (eThekweni Municipallity 2008). The
Centre Bank is also the most isolated of the sand flats as most of it is situated within the middle of
the harbour and surrounded by water (Figure 11).
Recent physico-chemical data have been collected for the Port of Durban by Newman et al. (2008).
Bottom salinity levels of the harbour waters are homogenous at 35 ppt, despite the input of

18
freshwater at the Bayhead. Bottom water temperatures show little spatial variation and typically
range from 19 to 22°C seasonally. Bottom dissolved oxygen levels are low and approximate 6 mg.L-1
for most of the central area of the harbour but are lower near the Bayhead.
Figure 12. Tidal bank elevations in the Port of Durban (from CSIR 2012b).

19
Figure 13. Proportion of mud comprising the sediments of Durban Harbour (adapted from Wright 1996).

20
Mangroves Tidal flats Open water Dry land/infilled areas
Figure 14. Durban Harbour showing how extensive areas of tidal flat and mangrove swamp that were present in the
1800s have been destroyed and dredged with very little remaining (Modified from Allan et al. 1999).

21
Figure 15. Dredge-scour marks are obvious throughout the main shipping channels and the area adjacent to Pier 2
where Berths 203 to 205 are to be expanded (courtesy ZAA Engineering Projects & Naval Architects).
6.2 Overview of the biodiversity in the Port of Durban
Historical records show that the Port of Durban supported a high diversity of flora and fauna with a
mixture of both tropical and subtropical species. Day and Morgan (1956) were the first to conduct a
comprehensive inventory of the fauna present. They recorded a total of 563 species from various
habitats within the Port area. Forty years later, a similar survey was conducted by Hay et al. (1995),
although it did not consider fauna closely associated with the mangroves. This study found far fewer
species than Day and Morgan (1956), but highlighted the importance of the bay as a nursery area,
and the disappearance of juvenile penaeid prawns, habitat requirements for which were no longer
being met. Differences in the number of species from different taxonomic groups recorded in these
two surveys is presented in Table 2.

22
Table 2. Total number of species, from 19 invertebrate and 1 vertebrate taxonomic group, found within Durban
Harbour. Column A includes species collected during the 1950 and 1952 biological survey (Day & Morgan
1956) and Column B. species collected during the 1991-1992 biological survey (Hay et al 1995).
Taxonomic group A. No. species collected in the 1950-
1952 surveys
B. No. species collected in the 1991-
1992 surveys
Hydrozoa 21
Zoantharia 1
Pennatulacea 1
Nemertea 1
Echiuroidea 1
Sipunculoidea 7
Oligochaeta 1
Polychaeta 75 21
Lamellibranchiata 5
Gatropoda 61 8
Scaphopoda 1
Bivalvia 36
Pycnogonida 1
Cirripedia 9
Copepoda 1
Cumacea 1
Amphipoda 15 4
Tanaidacea 1
Isopoda 12 1
Panaeidacea 2
Anomura 16 2
Macrura 20
Brachyura 66 4
Stomatopoda 2
Tectibranchs 8
Asteroidea 2
Ophiuroidea 3
Echinoidea 5
Holothuroidea 3
Tunicata 15
Pisces 186 39
Total No. species 563 95
Since this time, concern has been growing regarding the poor biological status and loss of estuarine
habitat in the KwaZulu-Natal region, brought on by sedimentation and increasing frequency of
mouth closure. The development of harbours at Richards Bay and Durban have in some way
mitigated this, and now support the largest areas of sheltered intertidal habitat in the province
(Cyrus & Forbes 1996).
23
6.2.1 Overview of the macrofaunal community composition and relative abundance
within the Port of Durban
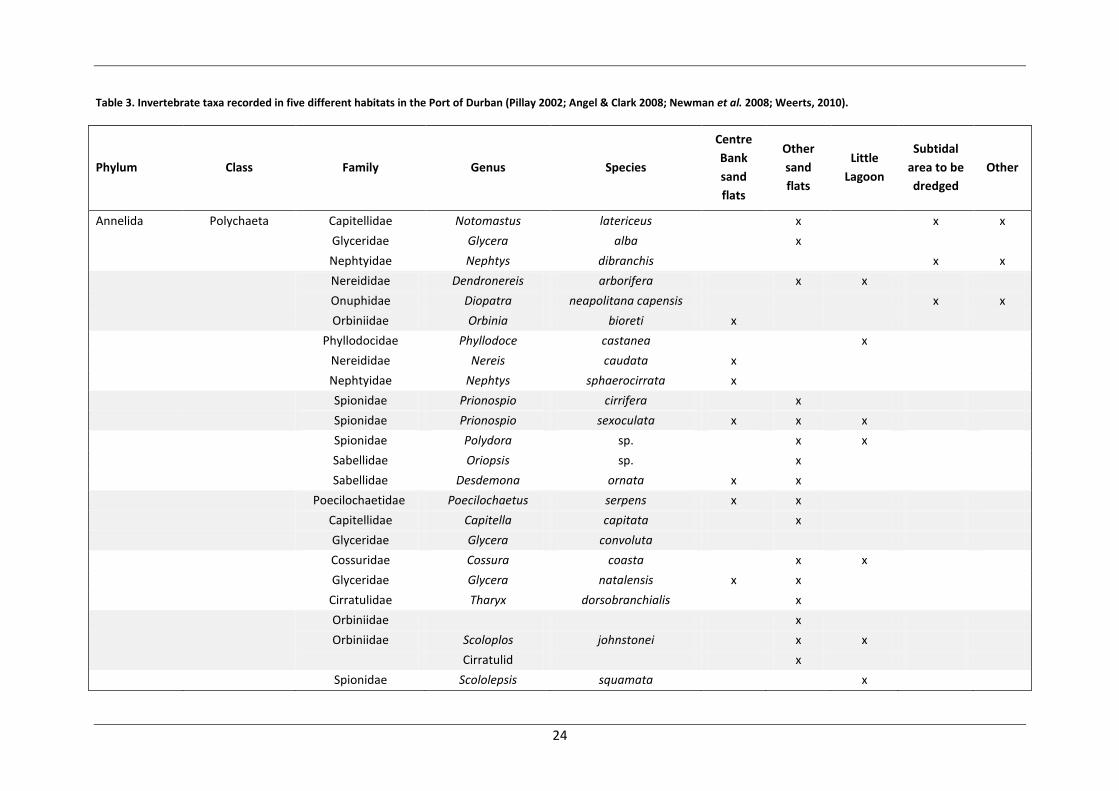
A total of at least 60 taxa (species) have been recorded in the soft-sediment habitats of the Port of
Durban in recent surveys undertaken by Pillay (2002), Angel & Clark (2008), Newman et al. (2008),
and Weerts (2010) (Table 3). Overall, diversity is highest among the Polychaetes with 27 taxa
recorded, followed by the Malacostraca with 18 taxa. Other important classes well represented
include the Gastropods and Bivalves.
In recent times, relatively more sampling has been conducted in sand-flat habitats than in the
deeper subtidal areas of the Bay, partly because the ecological role the sand banks play is recognised
as being disproportionately important. The benthic fauna in the deeply dredged channels is
reportedly depauparate, consisting of a few species of coelenterates, amphipods, isopods,
polychaetes, annelids and crabs (Hay 1993). Results show very low abundance (<50 individuals.m-2)
and low levels of diversity (<6 taxa.m-2) of invertebrates in these areas (Angel & Clark, unpublished
data). This is likely due to the periodic dredging operations required to maintain the ports operating
depth, disturbance caused by ship propellers and the anoxic conditions of the sediments that is a
characteristic of much of the deeper sediments in the harbour (Newman et al. 2008) (Figure 15).
Highest diversity and biomass of invertebrates is undoubtedly attained at the remaining intertidal
and shallow subtidal sand-flat habitats which are not dredged and are comparatively well
oxygenated. Newman et al. (2008) recorded an average of 10 to 12 taxa per square meter,
depending on which sand flat was investigated, while Pillay (2002) recorded 38 taxa at Little Lagoon
alone. Highest diversities appear to be found at this shallow subtidal flat adjacent to the intertidal
areas. Densities of organism at Little Lagoon were high, with a mean density of 2 888 ind.m-2
recorded by Newman et al. (2008), while Pillay (2002) recorded 3 226 individuals of Apseudes
digitalis per square metre and 578 inds.m-2 of Prionospio sexoculata. Average densities are also high
for the intertidal flats, with Centre Bank reportedly having an average density of 902 ind.m-2
(Newman et al. 2008). Furthermore, the intertidal sand flats are well recognised for their abundance
of Callianassid prawns (Callianasa kraussi) (Newman, 2008; Weerts, 2010). Macrofauna residing in
these sand flats ultimately support important assemblages of fishes and birds (Allan et al. 1999;
McInnes et al. 2005; Newman et al. 2008).
24
Table 3. Invertebrate taxa recorded in five different habitats in the Port of Durban (Pillay 2002; Angel & Clark 2008; Newman et al. 2008; Weerts, 2010).
Phylum Class Family Genus Species
Centre
Bank
sand
flats
Other
sand
flats
Little
Lagoon
Subtidal
area to be
dredged
Other
Annelida Polychaeta Capitellidae Notomastus latericeus
x
x x
Glyceridae Glycera alba
x
Nephtyidae Nephtys dibranchis
x x
Nereididae Dendronereis arborifera x x
Onuphidae Diopatra neapolitana capensis x x
Orbiniidae Orbinia bioreti x
Phyllodocidae Phyllodoce castanea
x
Nereididae Nereis caudata x
Nephtyidae Nephtys sphaerocirrata x
Spionidae Prionospio cirrifera x
Spionidae Prionospio sexoculata x x x
Spionidae Polydora sp.
x x
Sabellidae Oriopsis sp.
x
Sabellidae Desdemona ornata x x
Poecilochaetidae Poecilochaetus serpens x x
Capitellidae Capitella capitata x
Glyceridae Glycera convoluta
Cossuridae Cossura coasta
x x
Glyceridae Glycera natalensis x x
Cirratulidae Tharyx dorsobranchialis
x
Orbiniidae x
Orbiniidae Scoloplos johnstonei x x
Cirratulid x
Spionidae Scololepsis squamata
x

25
Phylum Class Family Genus Species
Centre
Bank
sand
flats
Other
sand
flats
Little
Lagoon
Subtidal
area to be
dredged
Other
Annelida Polychaeta Nereididae Ceratonereis erythroensis
x
Sabellidae Megaloma Sp.
x
Eunicidae Marphysa depressa x
Annelida Clitellata Hirudinea sp. x
Mollusca Gastropoda Nassariidae Nassarius kraussianus x x x
Nassariidae Nassarius spp. x x
Terebridae Duplicaria capensis x x
Naticidae Natica qualteriana
x x
Naticidae Polinices tumidus
x x
Solenidae Solen cylindraceus x x x x
Acteocina fusiformis
x
Tellina prismatica x
Mollusca Bivalvia Veneridae Dosinia hepatica x x
Veneridae Eumarcia paupercula x x x
Mytilidae Brachidontes virgiliae x x
Cardiidae Fulvia papyracea
x
Arthropoda Malacostraca Alpheidae Betaeus jucundus x x x
Callianassidae Callianassa kraussi x x x
Goneplacidae Thaumastoplax spiralis
x x
Upogebiidae Upogebia capensis x
x x
Cirolanidae Cirolana c.f. fluviatilis x
x x
Anthuridae Haliophasma sp. x
Leptanthuridae Leptanthura laevigata x
Bodotriidae Iphinoe truncata x
Aoridae Grandiddierella sp. x

26
Phylum Class Family Genus Species
Centre
Bank
sand
flats
Other
sand
flats
Little
Lagoon
Subtidal
area to be
dredged
Other
Arthropoda Malacostraca Parapseudidae Apseudes digitalis
x x
Upogebiidae Upogebia africana x
Anthuridae Cyathura estuaria x
Cirolanidae Cirolana luciae x
Melitidae Melita zeylanica
x
Corophium triaenonyx
x
Aoridae Grandiddierella bonnieroides
x
Camptandriidae Paratylodiplax blephariskios x
Hymenosomatidae Hymenosoma orbiculare x
Arthropoda Branchiopoda Cladocera x x
Sipunculida x
All phyla All classes All families All genera All species 161 24 32 12 12
1. Note that while species richness (number of taxa) at the Centre bank appears lower than other intertidal sand flats in the port this is simply an artefact of the fact that Centre
Bank is considered in isolation here while all the other sand flat areas are lumped together as “Other sand flats”. Centre bank on its own has richer fauna than any other sand
flat site when these are considered in isolation.

27
6.2.2 Overview of the fish fauna in the Port of Durban
The fish fauna in the Port of Durban was considered very diverse in the 1950s when a total of 186
species were recorded by Day & Morgan (1956). The most-common fish species’ recorded during
this time were Terapon jarbua, Mugil cephalus, Lisa dumerilii, Ambassis gymnocephalus and
Leiognathus equula. Several of these species are estuarine dependent and the Bay was found to be a
valuable nursery ground for these fishes. The two most recent surveys have recorded 29 (Angel &
Clark 2008) and 34 species (Newman et al. 2008). They confirmed the findings of previous studies, in
that the majority of fishes in the Bay are estuary dependent (Day & Morgan, 1956; Cyrus & Forbes
1996, Forbes et al. 1996). Similar methods were used between surveys although the effort, timing
and specific localities differed somewhat.
Detailed information on catches was available for surveys undertaken by Angel & Clark (2008) who
collected a total of 696 fish in 19 gill and seine net samples. The most prolific species in terms of
abundance were the Ambassids (29.9%), mainly because of a high catch of bald Glassy Ambassis
gymnocephalus at one of the sites, Leiognathids (10.5%) comprising a sole representative the Slimy
Leiognathus equula, and Mugilids (5 species, 8.2%) consisting mainly of groovy mullet Liza dumerilii.
These three families comprised nearly half the community (48%). The majority of species caught
were similar to those recorded by Hay et al. (1995) and Day & Morgan (1956).
Table 4. Species of fish recorded by Agel & Clark (2008) with an indication of which were also recorded by Hay et al.
(1995) and Day & Morgan (1956).
Genus Species Hay et al. (1995) Day & Morgan (1956)
Ambassis gymnocephalus Y Y
Ambassis natalensis Y Y
Caranx sexfaciatus N Y
Chanos chanos N Y
Crenidens crenidens N Y
Diplodus sargus capensis N Y
Elops machnata Y Y
Favonigobius reichei N N
Gerres rappi Y N
Gerres acinaces Y Y
Gerres filamentosus Y Y
Lactoria cornuta Y Y
Leiognathus equula Y Y
Liza richardsonii N Y
Liza dumerilii Y Y
Liza macrolepsis Y Y
Phtheirichthys lineatus N N
Platycephalus indicus Y Y
Pomadasys commersonnii Y Y
Pomadasys maculatus N N
Pseudorhombus arsius Y Y

28
Genus Species Hay et al. (1995) Day & Morgan (1956)
Rhabdosargus sarba Y Y
Scomberoides lysan N Y
Sillago sihama Y Y
Sphyraena putnamiae N Y
Torquigener balteus N N
Tylosurus crocodilus Y Y
Valamugil buchanani Y Y
Valamugil robustus N Y
A study by Newman et al. (2008) a few months later focusing on the fish communities of the shallow
sand flats found similar results. Three species of Ambassidae (glassies) made up most of the
community (83%), followed by Mugilidae (mullets, six species, 7%) and Gerreidae (pursemouths,
three species, 5%). These three families comprised 95% of the fishes.
Species not necessarily recorded by these two studies but which have been recorded just outside of
Durban Harbour in similar habitat, and are likely to inhabit areas affected by the proposed
development are included in Table 5.
Table 5. Soft bottom demersal fish species recorded in beach seine net catches off Durban Bay (adapted from Beckley
and Fennessey, 1996)
Teleosts Common name
Argyrosomus japonicus Dusky kob
Argyrosomus thorpeii Squaretail kob
Cociella sp. Spotfin flathead
Cynoglossus lida Roughscale tongue sole
Johnius dussumieri Mini-kob
Lithognathus mormyrus Sand steenbras
Otolithes ruber Snapper kob
Paralichthodes algoensis Measels flounder
Paraplagusia bilineata Fringelip tonguefish
Parupeneus macronema Band-dot goatfish
Parupeneus rubescens Blacksaddle goat fish
Platycephalus indicus Bartail flathead
Plotosus lineatus Striped eel catfish
Pomadasys commersonnii Spotted grunter
Pomadasys kaakan Javelin grunter
Pomadasys maculatum Saddle grunter
Pomadasys olivaceum Olive grunter
Pseudorhombus elevatus Ringed flounder
Saurida undosquamis Largescale lizzardfish
Sillago sihama Silver sillago
Umbrina robinsoni Slender bardman
29
Elasmobranchs
Aetobatus narinari Spotted eagleray
Dasyatis chrysonota Blue stingray
Dasyatis kuhlii Blue spotted sting ray
Gymnura natalensis Butterfly ray
Himantura gerrardi Sharpnose stingray
Rhinobatos annulatus Lesser guitarfish
Rhinobatos leucospilus Greyspot guitarfish
Rhyncobatos djiddensis Giant guitarfish
Torpedo sinuspersici Marbled electric ray
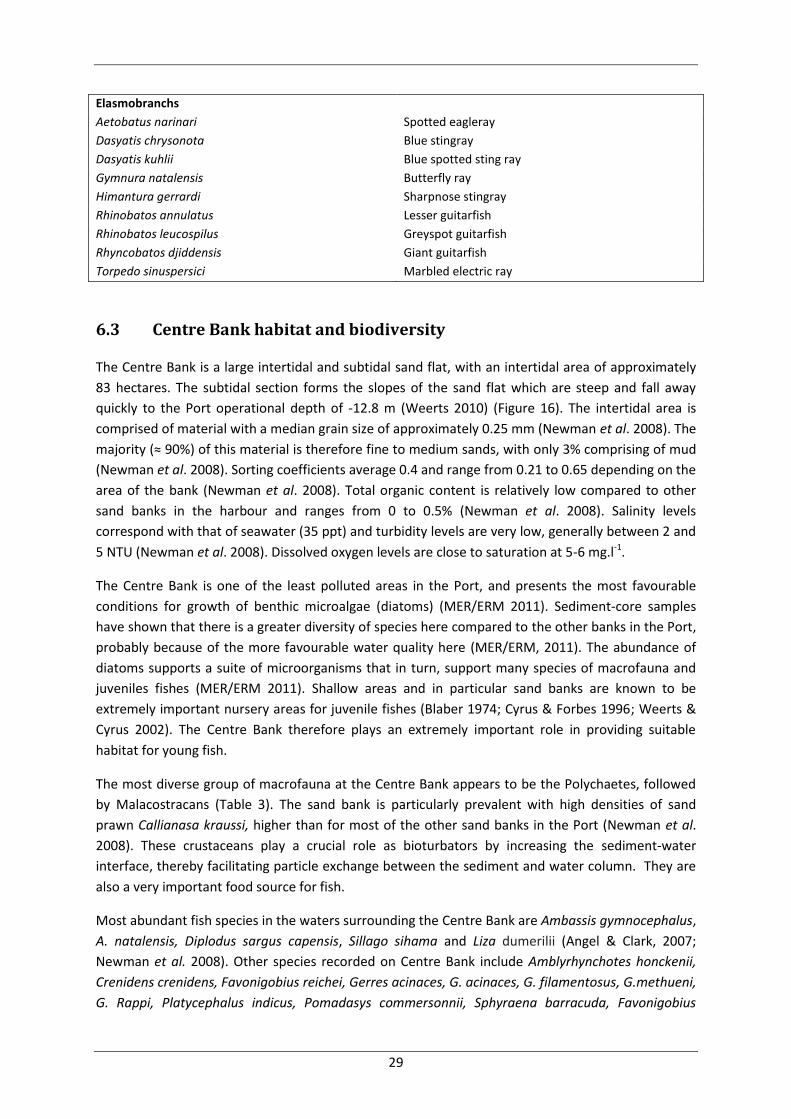
6.3 Centre Bank habitat and biodiversity
The Centre Bank is a large intertidal and subtidal sand flat, with an intertidal area of approximately
83 hectares. The subtidal section forms the slopes of the sand flat which are steep and fall away
quickly to the Port operational depth of -12.8 m (Weerts 2010) (Figure 16). The intertidal area is
comprised of material with a median grain size of approximately 0.25 mm (Newman et al. 2008). The
majority (≈ 90%) of this material is therefore fine to medium sands, with only 3% comprising of mud
(Newman et al. 2008). Sorting coefficients average 0.4 and range from 0.21 to 0.65 depending on the
area of the bank (Newman et al. 2008). Total organic content is relatively low compared to other
sand banks in the harbour and ranges from 0 to 0.5% (Newman et al. 2008). Salinity levels
correspond with that of seawater (35 ppt) and turbidity levels are very low, generally between 2 and
5 NTU (Newman et al. 2008). Dissolved oxygen levels are close to saturation at 5-6 mg.l-1.
The Centre Bank is one of the least polluted areas in the Port, and presents the most favourable
conditions for growth of benthic microalgae (diatoms) (MER/ERM 2011). Sediment-core samples
have shown that there is a greater diversity of species here compared to the other banks in the Port,
probably because of the more favourable water quality here (MER/ERM, 2011). The abundance of
diatoms supports a suite of microorganisms that in turn, support many species of macrofauna and
juveniles fishes (MER/ERM 2011). Shallow areas and in particular sand banks are known to be
extremely important nursery areas for juvenile fishes (Blaber 1974; Cyrus & Forbes 1996; Weerts &
Cyrus 2002). The Centre Bank therefore plays an extremely important role in providing suitable
habitat for young fish.
The most diverse group of macrofauna at the Centre Bank appears to be the Polychaetes, followed
by Malacostracans (Table 3). The sand bank is particularly prevalent with high densities of sand
prawn Callianasa kraussi, higher than for most of the other sand banks in the Port (Newman et al.
2008). These crustaceans play a crucial role as bioturbators by increasing the sediment-water
interface, thereby facilitating particle exchange between the sediment and water column. They are
also a very important food source for fish.
Most abundant fish species in the waters surrounding the Centre Bank are Ambassis gymnocephalus,
A. natalensis, Diplodus sargus capensis, Sillago sihama and Liza dumerilii (Angel & Clark, 2007;
Newman et al. 2008). Other species recorded on Centre Bank include Amblyrhynchotes honckenii,
Crenidens crenidens, Favonigobius reichei, Gerres acinaces, G. acinaces, G. filamentosus, G.methueni,
G. Rappi, Platycephalus indicus, Pomadasys commersonnii, Sphyraena barracuda, Favonigobius

30
reichei, L. richardsonii, Valamugil buchanani, Crenidens crenidens, Platycephalus indicus, Lactoria
cornuta and a yet to be described species of Torquigener.
Figure 16. Tidal bank elevation categories relative to the footprint of Option 3F (from CSIR 2012b).
6.4 Dredge channel habitat and biodiversity
Most of the shipping channels in the Port of Durban have been dredged to a depth of approximately
– 12.8 m. For the purposes of this report characteristics of only the dredge channels in the area
proposed for dredging will be described. Most of the area to be dredged for this project is comprised
of sandy sediment, while mud typically dominates those areas adjacent to the southern side of
Centre Bank and across the channel to the eastern side of Pier No 2 (CSIR, 2012a) (Figure 17). There
is considerable evidence, however, that suggests that these habitats were historically more muddy
than they are today (MER/ERM, 2011). Total organic content of these sediments is strongly
correlated with the proportion of mud, and ranges from 0.4 to 2.6 % (CSIR, 2012a) (Figure 18). It is

31
generally higher than on the Centre Bank. Salinity levels approximate those of seawater (35 ppt) and
bottom turbidity levels are low, generally between 6 and 14 NTU (Newman et al. 2008). Dissolved
oxygen levels are close to saturation at 5-6 mg.l-1 (Newman et al. 2008).
Benthic primary productivity is likely to be relatively low compared with the Centre Bank due to the
attenuation of light by the overlying water column. As a consequence, benthic diatom biomass is
low. The most abundant macrofauna found in the dredge channels are Polychaetes especially
Notomastus latericeus, Orbinia bioreti and Nephtys dibranchis followed by Gastropods particularly
the tick shells Nassarius kraussianus, Duplicaria capensis and Natica qualteriana (Angel & Clark,
2007). A number of species of Decapod are also present including the mud prawn Upogebia
capensis, Thaumastoplax spiralis and Cirolana fluviatilis (Angel & Clark 2007).
The ichthyofaunal community in the dredge channels comprises various species of Mugillids
(Mullets), especially Valamugil buchanani, Liza macrolepsis and L. richardsonii. Other common
species include pursemouths Gerres rappi and G. Acinaces, saddle grunter Pomadasys maculatum,
bartail flathead Platycephalus indicus and two Sparids including Crenidens crenidens and Diplodus
sargus capensis (Angel & Clark, 2007). Species that are more prevalent in the upper reaches of the
water column include the Carangids like needlescaled queenfish Scomberoides lysan and Caranx
sexfasciatus, and other piscivores such as the sawtooth barracuda Sphyraena putnamiae (Angel &
Clark 2007).

32
Figure 17. Spatial distribution of sands and mud in the proposed dredge area (Source: CSIR 2012a).

33
Figure 18. Distribution of the total organic material contained within surface sediments (Source: CSIR 2012a).
6.5 Little Lagoon habitat and biodiversity
The Little Lagoon area comprises predominantly intertidal habitat, but incorporates an important
shallow subtidal area of 19 200 m2 that reaches depths of -1.6 m during spring low tide (Forbes &
Demetriades 2003) (see Figure 16). It is located on the southern end of the Centre Bank sand flat.
The deeper areas of Little Lagoon comprise relatively fine sediments with median particle sizes of 0.1
mm (very fine grained sand according to the Wentworth Scale), while shallower areas that more
exposed to wave action have slightly coarser median grain sizes of 0.2 - 0.3 mm (medium grained
sand) (Forbes & Demetriades 2003). The sediments in this area were found to have relatively high
proportions of organic matter ranging from 2.0 to 6.9 % organic content with an overall mean of
3.4% (Forbes & Demetriades 2003). This is significantly higher than that at intertidal areas of Centre
Bank and the subtidal dredge channels. Water temperatures are typical of shallow parts of
subtropical estuaries and ranged between 18 and 29°C depending on the season (Forbes &
Demetriades 2003). Salinity levels generally correspond to that of sea water (35 ppt) although during

34
high periods of rainfall values as low as 21 ppt have been recorded (Forbes & Demetriades, 2003).
Water clarity is generally considered to be clear with average values of 28 and 14 NTU for summer
and winter respectively. However, values as high as 100 NTU have been recorded for short periods
during windy and turbulent conditions (Forbes & Demetriades 2003). Dissolved oxygen levels are
high (6.9 – 7.7 mg.l-1) (Forbes & Demetriades 2003).
Phytoplankton densities are considered to be low as chlorophyll a values of only 0.06 – 1.3 µg.L-1
were recorded by Forbes & Demetriades (2003) over the course of a two year period. Zooplankton
present in Little Lagoon have been also studied by Forbes & Demetriades (2003), and are numerically
dominated by Copepods, especially Paracalanus crassirostris (Table 6). Other important components
of the zooplankton were larvae of caridean crustaceans.
Table 6. Zooplankton community composition of Little Lagoon recorded by Forbes & Demetriades (2003). Numbers are
average densities per m3 based on 23 replicate samples.
Taxon 2001 2002
Mar June Sept Dec Mar Aug Oct Dec
CNIDARIA
Hydrozoa medusae <1 <1
Calycophora 2 2
CTENOPHORA 1 <1 2
CHAETOGNATHA 5 1
CRUSTACEA
Copepoda 1003 721 595 1185 121 863 425 3300
Ostracoda 2
Cumacea <1 <1
Mysidacea
Mesopodopsis sp. <1 7 1 1 0 1 1 2
Stomatopoda (larvae)
Penaeoidea
Lucifer sp. 1 1
Caridae (larvae) 18 33 33 28 1 7 1
Brachyura
Zoea-type larvae 2 14 20 2 1 3 31 5
Megalopa larvae 1
CHELICERATA
Pycnogonida <1
MOLLUSCA
Bivalvia
Bivalve spat 86 8
CHORDATA
Larvacea 1 6 3 4 4
In terms of benthic macrofauna, intertidal areas are dominated by the sand prawn Callianassa
kraussi and the soldier crab Dotilla fenestrate . In addition to these, shallow subtidal areas are
generally more diverse and a total of 37 taxa have been found in these parts by Forbes &
Demetriades (2003). The community here is dominated numerically by polychaete worms especially
Glycera longipinnis and Prionospio sexoculata, followed by isopods particularly Leptanthura

35
laevigata, Cumaceans and the Molluscs Nassarius kraussianus, Dosinia hepatica and Eumercia
paupercula (see Pillay 2002) (Table 7). Densities of organisms were found to lie between 500 and 2
000 animals per m2, although densities of greater than 10 000 animals per m2 were recorded at some
areas during certain times of the year (Forbes & Demetriades 2003).
At least 36 species of fishes occur in Little Lagoon. The most abundant component (>80%) being the
Glassy Ambassis dussumieri (Table 8) (Forbes & Demetriades 2003). Other species that are notable
here yet occur at considerably lower numbers (<5%), are Glassnose Thryssa vitrirostris, the pouters
Gerres filamentous and G. Acinaces, slimy Leiognathus equulus, groovy mullet Liza dumerilii and the
smelt Sillago sihama. The majority of these species were found to be estuary-dependent and it is
well recognised that Little Lagoon provides extremely valuable nursery habitat for many juvenile
fishes (Cyrus & Forbes 1996; Forbes & Demetriades 2003).

36
Table 7. Average densities (individuals/m2) of macrofauna sampled at various sites (A1-C4) at Little Lagoon. Values are
based on means of three site and six seasonal replicates (after Pillay, 2002).
A1 A2 A3 A4 B1 B2 B3 B4 C1 C2 C3 C4
Polychaeta
Cirratulidae
Unidentified Cirratulid polychaetes 1 1280 173 53 17 85 145 199 0 112 474 28
Phyllodicidae
Phyllodoce castanea 0 7 1 2 1 0 0 4 0 5 1 0
Cossuridae
Cossura coasta 0 228 2 0 2 73 5 0 0 406 39 0
Orbiniidae
Scoloplos johnstonei 2 0 2 2 0 2 0 0 12 3 4 2
Spionidae
Prionospio sexoculata 343 578 356 374 272 304 487 613 229 409 411 330
Polydora sp. 0 0 0 0 0 2 1 0 1 0 0 0
Scololepis squamata 2 7 0 0 0 4 0 0 0 0 0 0
Nereidae
Ceratonereis erythroensis 0 0 0 3 0 5 0 3 0 0 0 0
Dendronereis arborifera 6 5 7 42 3 0 22 64 0 1 0 10
Glyceridae
Glycera sp. 66 44 63 41 70 41 56 82 53 42 61 104
Capitellidae
Unidentified capitellid polychaetes 73 17 2 1 5 3 0 2 16 28 10 0
Sabellidae
Megalomma sp. 0 2 0 0 0 0 0 0 0 0 0 0
Desdemona ornate 44 10 169 505 4 6 137 52 2 25 24 22
Maldanidae
Unidentified Maldanid polychaetes 0 0 1 2 0 0 0 0 0 0 0 0
Eunicidae
Marphysa depressa 0 1 0 0 0 0 0 0 0 0 0 0
Crustacea
Anomura
Upogebia africana 1 0 0 0 0 0 0 0 0 0 1
Callianassa kraussi 36 0 0 5 31 46 0 8 16 5 61 22
Macrura
Betaeus jucundus 0 0 0 0 0 0 0 0 0 0 1 0
Isopoda
Cyathura estuaria 2 1 0 0 0 0 0 0 0 0 0 0
Cirolana luciae 10 0 0 0 6 5 0 0 0 36 2 1
Leptanthura laevigata 74 92 81 375 96 137 140 304 118 60 114 150
Amphipoda
Melita zeylanica 2 0 0 2 0 0 0 1 0 0 0 0
Corophium triaenonyx 0 19 10 0 0 0 1 0 0 0 1 1
Grandidierella bonnieroides 5 2 20 13 3 2 0 7 5 0 5 20
Cumacea
Cumacea 152 28 100 264 126 35 87 170 155 9 106 151
Brachyura
Thaumastoplax spiralis 2 1 0 0 1 3 0 0 2 2 0 2
Paratylodiplax blephariskios 0 24 0 0 0 38 0 0 0 14 0 1
Hymenosoma orbiculare 1 0 0 0 0 0 0 0 0 0 0 0
Tanaidacea
Apseudes digitalis 0 3226 510 301 1 40 1037 13 0 5 124 3
Mollusca
Gastropoda
Nassarius kraussianus 2 58 103 25 2 49 84 57 2 53 24 32
Acteocina fusiformis 0 10 6 5 0 38 10 25 0 3 0 9

37
A1 A2 A3 A4 B1 B2 B3 B4 C1 C2 C3 C4 Bivalvia
Eumarcia paupercula 12 20 55 13 10 14 54 53 6 10 9 24
Solen cylindraceus 0 4 1 2 1 2 5 2 0 1 0 0
Dosinia hepatica 13 26 77 33 22 46 67 37 10 15 22 23
Brachidontes virgiliae 0 35 24 0 0 0 22 11 1 0 0 2
Fulvia papyracea 0 0 2 0 0 1 0 0 0 0 2 0
Tellina prismatica 0 22 9 1 1 14 3 2 0 25 4 0
Sipunculida 2 0 0 0 0 0 0 0 0 0 0 0
Number of species 22 26 23 22 20 25 18 21 15 22 21 21

38
Table 8. Numbers of fish caught in seine and gill nets in the Little Lagoon based on 18 replicates from March 2001 to December
2002. EDC = Estuarine Dependence Category (after Whitfield 1998).
Family
Species
2001 2002
EDC Mar Jun Sep Dec Mar Jul Sep Dec
Ambassidae Ambassis dussumieri Ib 2844 1467 1213 61 7279 425 645 3
Ambassis natalensis Ib 2 5 2 17 2 0 2
Belonidae Strongylura sleiurus III 1
Bothidae Pseudorhombus arsius III 1 3 3
Carangidae Caranx sexfasciatus IIb 7 1 3 1
Caranx juvenile IIb 1 4
Lichia amia IIa 1
Scomberoides tol III 8 7 1 4 15 1 4
Clupeidae Hilsa kelee IIc 4
Engraulidae Thryssa vitrirostris IIa 1 28 2 256 7
Gerreidae Gerres acinaces IIb 4 1 14 30 12 125 2 6
Gerres filamentosus IIb 57 130 54 52 15 2 8 17
Gerres juvenile IIb 1 7 23 1 12
Gerres roppi IIb 1 1
Gobiidae Glossogobius callidus 1
Glossogobius giuris Ib 2 4 1 18 3
Oxyurichtyhs ophthalmonema ? 10 4 3
Haemulidae Pomadasys comersonnii IIa 1 2 7 1 5 5 7
Pomadasys olivaceum 1
Leiognathidae Leiognathus equulus IIc 9 72 8 70 41 13 23 0
Mugilidae Liza alata ? 24
Liza dumerilii IIb 19 19 25 6 11 75 3 14
Liza macrolepsis IIa 2 26 6
Mugil cephalus 2
Myxus capensis IIa 1
Valamugil buchanani IIa 2 2 3 1 1
Valamugil cunnesius IIa 8
Mullet juveniles <40mm 4 3 1 3 1 1
Lutjanidae Lutjanus russelli IIc? 1
Lactoria cornuta III 1 1
Platycephalidae Platycephalus indicus IIc 7 6 3 2 1 2 2 2
Sillaginidae Sillago sihama IIc 82 17 43 23 409 3 8 5
Sparidae Crenidens crenidens III 1 3 1
Rhabdosargus sarba IIa 2 4 1
Rhabdosargus holubi IIa 17 11 6 1 1 2
Sphyraenidae Sphyraena jello IIc? 1 2 5
Tetraopdontidae Amblyrhynchotes honckenii III 4 4 9 4 2 2 2 0
Total species 19 25 17 23 18 17 17 13
Total individuals 3070 1827 1399 348 7820 919 720 73
39
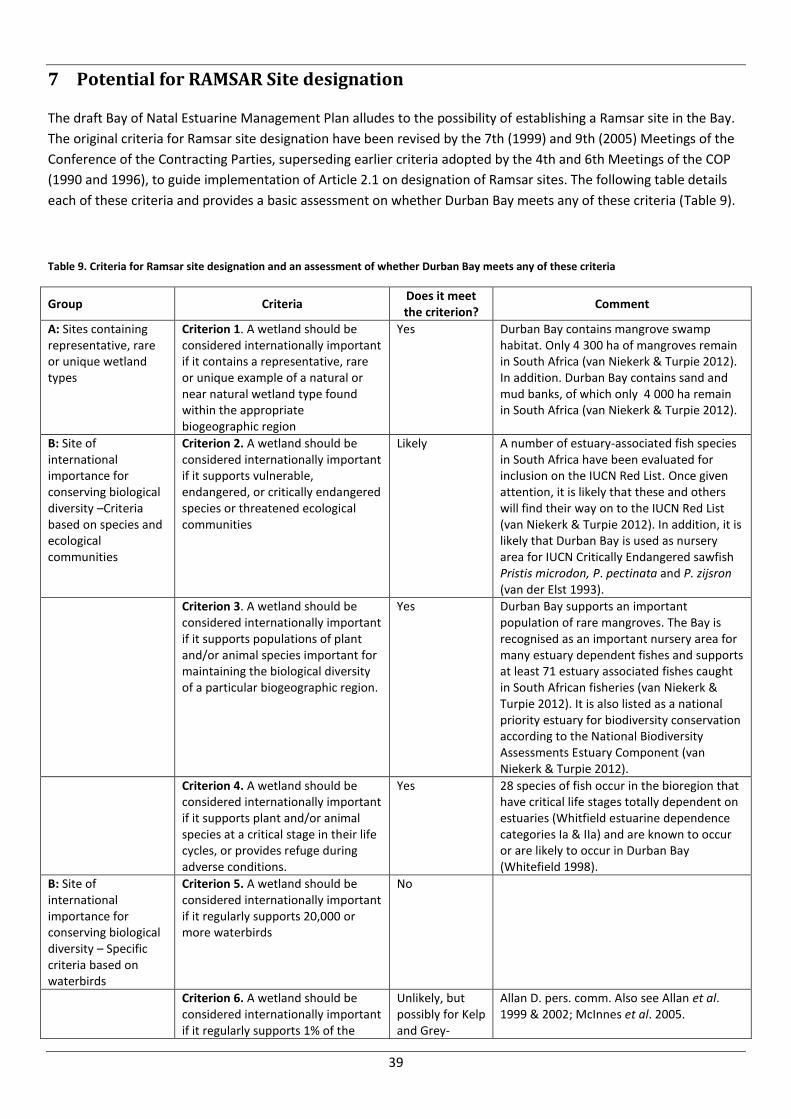
7 Potential for RAMSAR Site designation
The draft Bay of Natal Estuarine Management Plan alludes to the possibility of establishing a Ramsar site in the Bay.
The original criteria for Ramsar site designation have been revised by the 7th (1999) and 9th (2005) Meetings of the
Conference of the Contracting Parties, superseding earlier criteria adopted by the 4th and 6th Meetings of the COP
(1990 and 1996), to guide implementation of Article 2.1 on designation of Ramsar sites. The following table details
each of these criteria and provides a basic assessment on whether Durban Bay meets any of these criteria (Table 9).
Table 9. Criteria for Ramsar site designation and an assessment of whether Durban Bay meets any of these criteria
Group Criteria Does it meet the criterion?
Comment
A: Sites containing representative, rare or unique wetland types
Criterion 1. A wetland should be considered internationally important if it contains a representative, rare or unique example of a natural or near natural wetland type found within the appropriate biogeographic region
Yes Durban Bay contains mangrove swamp habitat. Only 4 300 ha of mangroves remain in South Africa (van Niekerk & Turpie 2012). In addition. Durban Bay contains sand and mud banks, of which only 4 000 ha remain in South Africa (van Niekerk & Turpie 2012).
B: Site of international importance for conserving biological diversity –Criteria based on species and ecological communities
Criterion 2. A wetland should be considered internationally important if it supports vulnerable, endangered, or critically endangered species or threatened ecological communities
Likely A number of estuary-associated fish species in South Africa have been evaluated for inclusion on the IUCN Red List. Once given attention, it is likely that these and others will find their way on to the IUCN Red List (van Niekerk & Turpie 2012). In addition, it is likely that Durban Bay is used as nursery area for IUCN Critically Endangered sawfish Pristis microdon, P. pectinata and P. zijsron (van der Elst 1993).
Criterion 3. A wetland should be considered internationally important if it supports populations of plant and/or animal species important for maintaining the biological diversity of a particular biogeographic region.
Yes Durban Bay supports an important population of rare mangroves. The Bay is recognised as an important nursery area for many estuary dependent fishes and supports at least 71 estuary associated fishes caught in South African fisheries (van Niekerk & Turpie 2012). It is also listed as a national priority estuary for biodiversity conservation according to the National Biodiversity Assessments Estuary Component (van Niekerk & Turpie 2012).
Criterion 4. A wetland should be considered internationally important if it supports plant and/or animal species at a critical stage in their life cycles, or provides refuge during adverse conditions.
Yes 28 species of fish occur in the bioregion that have critical life stages totally dependent on estuaries (Whitfield estuarine dependence categories Ia & IIa) and are known to occur or are likely to occur in Durban Bay (Whitefield 1998).
B: Site of international importance for conserving biological diversity – Specific criteria based on waterbirds
Criterion 5. A wetland should be considered internationally important if it regularly supports 20,000 or more waterbirds
No
Criterion 6. A wetland should be considered internationally important if it regularly supports 1% of the
Unlikely, but possibly for Kelp and Grey-
Allan D. pers. comm. Also see Allan et al. 1999 & 2002; McInnes et al. 2005.
40
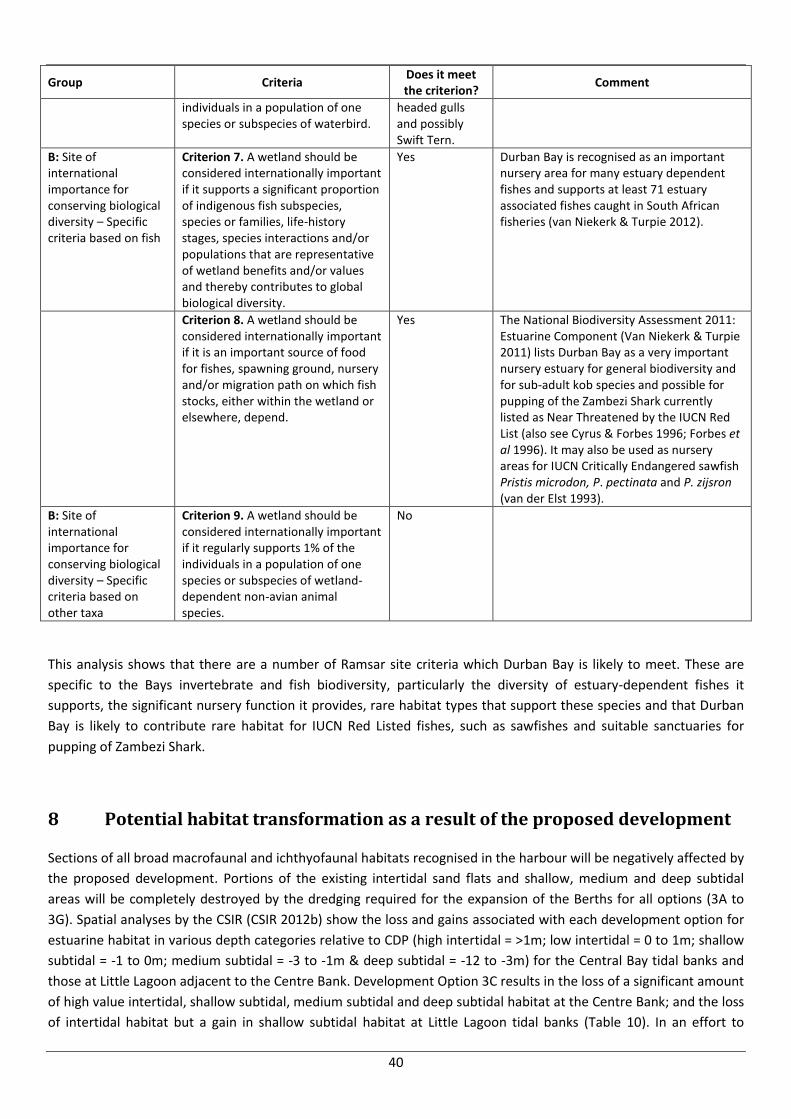
Group Criteria Does it meet the criterion?
Comment
individuals in a population of one species or subspecies of waterbird.
headed gulls and possibly Swift Tern.
B: Site of international importance for conserving biological diversity – Specific criteria based on fish
Criterion 7. A wetland should be considered internationally important if it supports a significant proportion of indigenous fish subspecies, species or families, life-history stages, species interactions and/or populations that are representative of wetland benefits and/or values and thereby contributes to global biological diversity.
Yes Durban Bay is recognised as an important nursery area for many estuary dependent fishes and supports at least 71 estuary associated fishes caught in South African fisheries (van Niekerk & Turpie 2012).
Criterion 8. A wetland should be considered internationally important if it is an important source of food for fishes, spawning ground, nursery and/or migration path on which fish stocks, either within the wetland or elsewhere, depend.
Yes The National Biodiversity Assessment 2011: Estuarine Component (Van Niekerk & Turpie 2011) lists Durban Bay as a very important nursery estuary for general biodiversity and for sub-adult kob species and possible for pupping of the Zambezi Shark currently listed as Near Threatened by the IUCN Red List (also see Cyrus & Forbes 1996; Forbes et al 1996). It may also be used as nursery areas for IUCN Critically Endangered sawfish Pristis microdon, P. pectinata and P. zijsron (van der Elst 1993).
B: Site of international importance for conserving biological diversity – Specific criteria based on other taxa
Criterion 9. A wetland should be considered internationally important if it regularly supports 1% of the individuals in a population of one species or subspecies of wetland-dependent non-avian animal species.
No
This analysis shows that there are a number of Ramsar site criteria which Durban Bay is likely to meet. These are
specific to the Bays invertebrate and fish biodiversity, particularly the diversity of estuary-dependent fishes it
supports, the significant nursery function it provides, rare habitat types that support these species and that Durban
Bay is likely to contribute rare habitat for IUCN Red Listed fishes, such as sawfishes and suitable sanctuaries for
pupping of Zambezi Shark.
8 Potential habitat transformation as a result of the proposed development
Sections of all broad macrofaunal and ichthyofaunal habitats recognised in the harbour will be negatively affected by
the proposed development. Portions of the existing intertidal sand flats and shallow, medium and deep subtidal
areas will be completely destroyed by the dredging required for the expansion of the Berths for all options (3A to
3G). Spatial analyses by the CSIR (CSIR 2012b) show the loss and gains associated with each development option for
estuarine habitat in various depth categories relative to CDP (high intertidal = >1m; low intertidal = 0 to 1m; shallow
subtidal = -1 to 0m; medium subtidal = -3 to -1m & deep subtidal = -12 to -3m) for the Central Bay tidal banks and
those at Little Lagoon adjacent to the Centre Bank. Development Option 3C results in the loss of a significant amount
of high value intertidal, shallow subtidal, medium subtidal and deep subtidal habitat at the Centre Bank; and the loss
of intertidal habitat but a gain in shallow subtidal habitat at Little Lagoon tidal banks (Table 10). In an effort to

41
mitigate these losses, a series of iterative development proposal was explored. Option 3D, the next in the sequence
entails infilling of a certain amount of the existing shipping channel to create artificial sand bank habitat, but this too
results in the loss of a significant amount of intertidal and medium subtidal habitat (Table 11). Option 3E entails
reshaping and reducing the extent of the proposed dredge footprint, such that there is no nett loss of habitat at
Little Lagoon tidal banks, but does, however, result in the loss of significant amounts of medium subtidal and
intertidal habitat at Centre Bank. Option 3F, was then designed to mitigate the loss of medium subtidal habitat and
intertidal habitat by significantly increasing the nett gain of shallow subtidal and intertidal habitat at Centre Bank.
The final option, Option 3G, further enhances Option 3F by increasing the nett gain in intertidal (by 2.12%) and
shallow subtidal habitat (by 30.4% or 4 ha) such that the overall foot print of the development will incorporate a net
gain of 0.04%.
Table 10. Projected changes in tidal habitats for development Option 3C.
Central Bay Tidal Banks
Pre-development
area (m2)
Development footprint area
(m2)
Long-term stable state
area (m2)
Development footprint
change (%)
Long-term stable state change (%)
High Intertidal 48710 31143 30582 -36.1 -37.2
Low Intertidal 1063327 1023682 1008390 -3.7 -5.2
Shallow Subtidal 80752 75484 91332 -6.5 13.1
Medium Subtidal 78222 71931 71941 -8.0 -8.0
Deep Subtidal 394657 357247 357247 -9.5 -9.5
Total 1665669 1559485 1559492 -6.4 -6.4
Little Lagoon Tidal Banks
Pre-development
area (m2)
Development footprint area
(m2)
Long-term stable state
area (m2)
Development footprint
change (%)
Long-term stable state change (%)
High Intertidal 12895 11065 11063 -14.2 -14.2
Low Intertidal 139436 141240 138010 1.3 -1.0
Shallow Subtidal 51360 51376 54611 0.0 6.3
Medium Subtidal 6406 6413 6413 0.1 0.1
Deep Subtidal 17865 17865 17865 0.0 0.0
Total 227962 227960 227963 0.0 0.0
Table 11. Projected changes in tidal habitats for development Option 3D.
Central Bay Tidal Banks
Pre-development
area (m2)
Development footprint area
(m2)
Long-term stable state
area (m2)
Development footprint
change (%)
Long-term stable state change (%)
High Intertidal 48710 31054 30568 -36.2 -37.2
Low Intertidal 1063327 1056349 1040938 -0.7 -2.1
Shallow Subtidal 80752 88570 104409 9.7 29.3
Medium Subtidal 78222 69178 69240 -11.6 -11.5
Deep Subtidal 394657 343460 343598 -13.0 -12.9
Total 1665669 1588611 1588753 -4.6 -4.6
Little Lagoon Tidal Banks
Pre-development
area (m2)
Development footprint area
(m2)
Long-term stable state
area (m2)
Development footprint
change (%)
Long-term stable state change (%)

42
High Intertidal 12895 11154 11063 -13.5 -14.2
Low Intertidal 139436 141174 138010 1.2 -1.0
Shallow Subtidal 51360 51360 54611 0.0 6.3
Medium Subtidal 6406 6406 6413 0.0 0.1
Deep Subtidal 17865 17865 17865 0.0 0.0
Total 227962 227959 227963 0.0 0.0
Table 12. Projected changes in tidal habitats for development Option 3E. Nd means no data.
Central Bay Tidal Banks
Pre-development
area (m2)
Development footprint area
(m2)
Long-term stable state
area (m2)
Development footprint
change (%)
Long-term stable state change (%)
High Intertidal 12895 11154 Nd -33.9 Nd
Low Intertidal 1063327 1068521 Nd 0.5 Nd
Shallow Subtidal 80752 88696 Nd 9.8 Nd
Medium Subtidal 78222 69199 Nd -11.5 Nd
Deep Subtidal 394657 343523 Nd -13 Nd
Total 1665669 1602153 Nd -3.8 Nd
Little Lagoon Tidal Banks
Pre-development
area (m2)
Development footprint area
(m2)
Long-term stable state
area (m2)
Development footprint
change (%)
Long-term stable state change (%)
High Intertidal 12895 11154 Nd 13.5 Nd
Low Intertidal 139436 141174 Nd 1.2 Nd
Shallow Subtidal 51360 51353 Nd 0.0 Nd
Medium Subtidal 6406 6413 Nd 0.1 Nd
Deep Subtidal 17865 17865 Nd 0.0 Nd
Total 227962 227959 Nd 0.0 Nd
Table 13. Projected changes in tidal habitats for development Option 3F. Nd means no data.
Central Bay Tidal Banks
Pre-development
area (m2)
Development footprint area
(m2)
Long-term stable state
area (m2)
Development footprint
change (%)
Long-term stable state change (%)
High Intertidal 48710 32364 Nd -33.6 Nd
Low Intertidal 1063327 1103872 Nd 3.8 Nd
Shallow Subtidal 80752 120882 Nd 49.7 Nd
Medium Subtidal 78222 70229 Nd -10.2 Nd
Deep Subtidal 394657 336274 Nd -14.8 Nd
Total 1665669 1663621 Nd -0.1 Nd
Little Lagoon Tidal Banks
Pre-development
area (m2)
Development footprint area
(m2)
Long-term stable state
area (m2)
Development footprint
change (%)
Long-term stable state change (%)
High Intertidal 12895 11154 Nd 13.5 Nd
Low Intertidal 139436 141162 Nd 1.2 Nd
Shallow Subtidal 51360 51386 Nd 0.0 Nd
Medium Subtidal 6406 6402 Nd -0.1 Nd
Deep Subtidal 17865 17883 Nd 0.1 Nd

43
Total 227962 227985 Nd 0.0 Nd
Table 14. Projected changes in tidal habitats for development Option 3G. Nd means no data.
Central Bay Tidal Banks
Pre-development
area (m2)
Development footprint area
(m2)
Long-term stable state
area (m2)
Development footprint
change (%)
Long-term stable state change (%)
High Intertidal 48710 32364 Nd -33.6 Nd
Low Intertidal 1063327 1106543 Nd 4.1 Nd
Shallow Subtidal 80752 120882 Nd 49.7 Nd
Medium Subtidal 78222 70229 Nd -10.2 Nd
Deep Subtidal 394657 336274 Nd -14.8 Nd
Total 1665669 1666292 Nd 0.04 Nd
Little Lagoon Tidal Banks
Pre-development
area (m2)
Development footprint area
(m2)
Long-term stable state
area (m2)
Development footprint
change (%)
Long-term stable state change (%)
High Intertidal 12895 11154 Nd -13.5 Nd
Low Intertidal 139436 141162 Nd 1.2 Nd
Shallow Subtidal 51360 51386 Nd 0.0 Nd
Medium Subtidal 6406 6402 Nd -0.1 Nd
Deep Subtidal 17865 17883 Nd 0.1 Nd
Total 227962 227985 Nd 0.0 Nd
A relatively large area of deep subtidal habitat will also be transformed. Deep subtidal habitat at a depth of mainly -
12.8 m and covering an area of approximately 130 hectares will be dredged to a depth of -16.5 m (Nemai Consulting
2012). A relatively small portion (2%) of this dredged area, between 2 to 3 ha (depending on which Quay Wall option
is selected), will be further transformed by the deposition of rock for scour protection (Nemai Consulting 2012). This
rock will form a layer approximately 0.5 m deep on the dredged harbour bottom. The area of subtidal habitat so
affected makes up approximately 19% of this habitat type in the harbour. More serious is the loss of intertidal and
shallow subtidal sand-flat habitat due to the dredging that is proposed as a result of enlarging the Berths (see Table
10 to Table 14). This assumes that the outputs from the stable state models of Weerts et al. (2012b) will prevail and
that no more of the sand flat will be lost via erosion after construction. We have reviewed the modelling work
conducted for this study and are indeed confident that this is the case
Also of concern is the loss of shallow subtidal habitat situated on the western, eastern and southern sides of Centre
Bank as a result of the placing of concrete-filled stabilising mattresses on these slopes to act as scour protection. This
habitat is different from the deeper subtidal areas that will be dredged and more important to invertebrates and
fishes, especially juvenile fishes. The placement of mattresses is a measure to ensure that the Centre Bank is not lost
as dredging operations will take place adjacent to the toe of the Centre Bank and there is concern that this may
cause the banks to slump and erode.
Furthermore, concern has been raised that the Bayhead mangroves may be impacted negatively by the proposed
development and operation of the Berths. No impact on the estuarine biodiversity of the mangroves, either direct or
indirect, is expected to occur with a high degree of confidence. A similar conclusion was reached by the CSIR
emanating from their study on long term impacts of the proposed development (CSIR 2012b). The mangroves are

44
sufficiently far away (≈1 km) from the development footprint that they will not be disturbed during the construction
and operational phases.
Figure 19. The Port of Durban showing where dredging is proposed relative to subtidal and intertidal habitats.

45
9 Impact on microalgae, macrofaunal and ichthyofaunal communities
Several perceived impacts have been identified as a result of the expansion of Berth 203-205, associated dredging
activities, scour protection (rocky) and stabilising mattresses. These include:
Loss and disturbance of intertidal habitat and associated benthic microalgae, macrofauna and ichthyofaunal
communities at the Centre Bank caused by dredging activities;
Loss and disturbance of subtidal habitat and associated benthic microalgae, macrofauna and ichthyofaunal
communities as a result of dredging activities, construction of the quay walls, and the installation and
permanent placement of stabilising mattresses on the western, southern and eastern slopes of Centre Bank;
Transformation of subtidal soft sediment habitat adjacent to quay walls to rocky scour protection (i.e large
rocks 50cm in height packed close together)
Loss and disturbance of water column habitat and associated phytoplankton, zooplankton and ichthyofaunal
communities as a result of dredging operations, quay wall construction and the quay walls themselves.
Suspension of fine sediment and increased turbidity at and adjacent to the dredge sites impacting on
primary production, and filter-feeding organisms on the substrate and in the water column in and adjacent
to the dredge area;
Sediment deposition around the dredging site (largely fine sediment rejected from screening and from
hopper overfill);
Resuspension of potentially toxic trace metals and hydrocarbons in dredge sediments from the harbour and
their effects on macrofauna and fish communities in the vicinity of the dredge foot print.
Each of the impacts mentioned above is likely to affect biota associated with the Port of Durban in different ways
and at varying intensities depending on the nature of the affected habitat and the sensitivity of the associated biota.
9.1 Site-specific considerations in the assessment of potential impacts on the
biodiversity of the Port of Durban
Intertidal-sand-flat habitat in the Port of Durban has been reduced to 14% of its original extent (Allan et al. 1999)
and much of it transformed into deeper subtidal areas for shipping. The intertidal sand flats in the Port of Durban
have been recognised as extremely important to the ecological functioning of the Port of Durban (Newman et al.
2008; Weerts 2010). These areas are considered the most important habitats in the Port in need of conservation
(Allan et al. 2005), and have accordingly been zoned for conservation by the Bay of Natal Estuary Management Plan
(ERM/MER 2012). Furthermore, Durban Bay has been included in a subset of estuaries identified in the estuary
component of the South African National Biodiversity Assessment as requiring partial protection in order to provide
for the conservation of estuarine biodiversity in South Africa (Van Niekerk & Turpie 2012). Large populations of sand
prawns are found on these banks, and such large population are not found anywhere else in KwaZulu-Natal, except
possibly in the Kosi estuarine system (Weerts 2010). In addition, the banks represent very important habitat for
juvenile fishes (Day & Morgan 1956; Cyrus & Forbes 1996; Forbes et al. 1996).
McInnes et al. (2005) have stated that based on a four-year study of the avifauna of the Port of Durban, their results
“suggest that potentially half the waterbird population of Durban Harbour could be negatively impacted as a result
of any modification of this area.” This is because the intertidal sand banks play a critical role in providing food in the
form of invertebrates (macrofauna) to many of the bird species. Furthermore, there is a high abundance of juvenile
fish within the Bay, a large proportion of which feed specifically on intertidal invertebrates (Cyrus & Forbes 1996;
Forbes et al. 1996). If the invertebrate-prey is reduced by the reduction of intertidal habitat then this will result in a
decrease in the abundance of juvenile fish which will have a negative effect on piscivorous birds, as densities of this
trophic guild of waterbirds have been correlated with densities of fish (Siegfried 1981; Hockey & Turpie 1999). Many
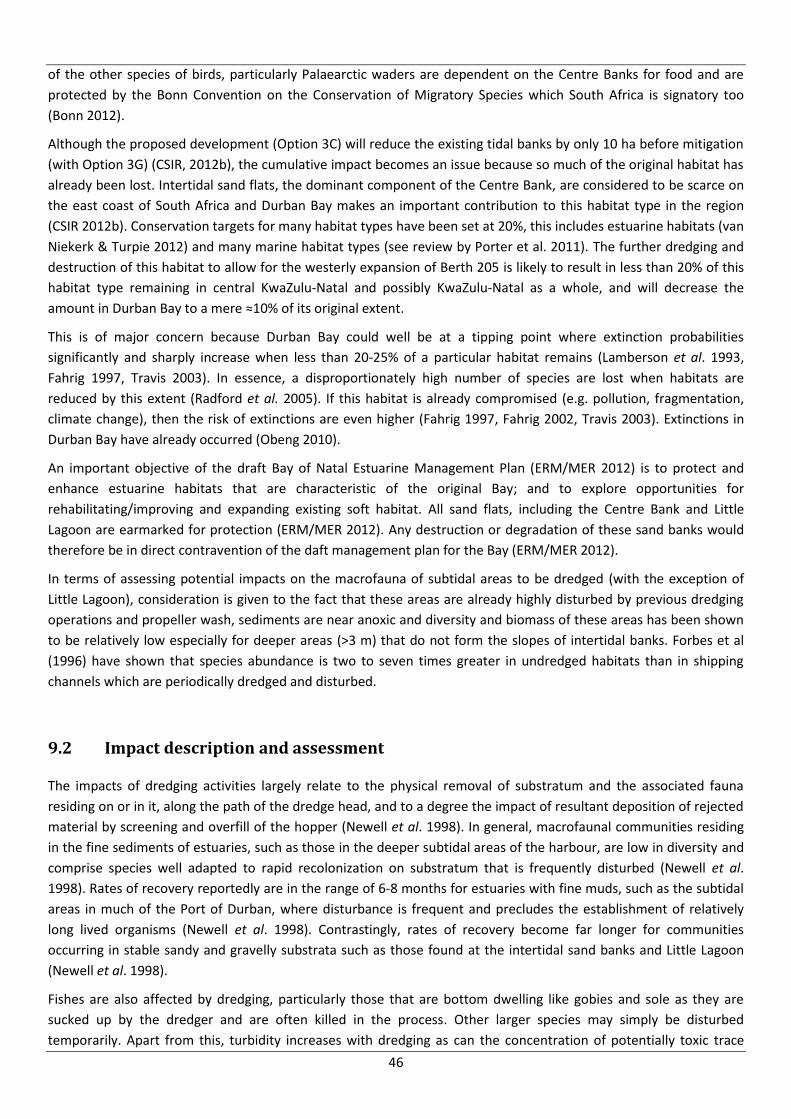
46
of the other species of birds, particularly Palaearctic waders are dependent on the Centre Banks for food and are
protected by the Bonn Convention on the Conservation of Migratory Species which South Africa is signatory too
(Bonn 2012).
Although the proposed development (Option 3C) will reduce the existing tidal banks by only 10 ha before mitigation
(with Option 3G) (CSIR, 2012b), the cumulative impact becomes an issue because so much of the original habitat has
already been lost. Intertidal sand flats, the dominant component of the Centre Bank, are considered to be scarce on
the east coast of South Africa and Durban Bay makes an important contribution to this habitat type in the region
(CSIR 2012b). Conservation targets for many habitat types have been set at 20%, this includes estuarine habitats (van
Niekerk & Turpie 2012) and many marine habitat types (see review by Porter et al. 2011). The further dredging and
destruction of this habitat to allow for the westerly expansion of Berth 205 is likely to result in less than 20% of this
habitat type remaining in central KwaZulu-Natal and possibly KwaZulu-Natal as a whole, and will decrease the
amount in Durban Bay to a mere ≈10% of its original extent.
This is of major concern because Durban Bay could well be at a tipping point where extinction probabilities
significantly and sharply increase when less than 20-25% of a particular habitat remains (Lamberson et al. 1993,
Fahrig 1997, Travis 2003). In essence, a disproportionately high number of species are lost when habitats are
reduced by this extent (Radford et al. 2005). If this habitat is already compromised (e.g. pollution, fragmentation,
climate change), then the risk of extinctions are even higher (Fahrig 1997, Fahrig 2002, Travis 2003). Extinctions in
Durban Bay have already occurred (Obeng 2010).
An important objective of the draft Bay of Natal Estuarine Management Plan (ERM/MER 2012) is to protect and
enhance estuarine habitats that are characteristic of the original Bay; and to explore opportunities for
rehabilitating/improving and expanding existing soft habitat. All sand flats, including the Centre Bank and Little
Lagoon are earmarked for protection (ERM/MER 2012). Any destruction or degradation of these sand banks would
therefore be in direct contravention of the daft management plan for the Bay (ERM/MER 2012).
In terms of assessing potential impacts on the macrofauna of subtidal areas to be dredged (with the exception of
Little Lagoon), consideration is given to the fact that these areas are already highly disturbed by previous dredging
operations and propeller wash, sediments are near anoxic and diversity and biomass of these areas has been shown
to be relatively low especially for deeper areas (>3 m) that do not form the slopes of intertidal banks. Forbes et al
(1996) have shown that species abundance is two to seven times greater in undredged habitats than in shipping
channels which are periodically dredged and disturbed.
9.2 Impact description and assessment
The impacts of dredging activities largely relate to the physical removal of substratum and the associated fauna
residing on or in it, along the path of the dredge head, and to a degree the impact of resultant deposition of rejected
material by screening and overfill of the hopper (Newell et al. 1998). In general, macrofaunal communities residing
in the fine sediments of estuaries, such as those in the deeper subtidal areas of the harbour, are low in diversity and
comprise species well adapted to rapid recolonization on substratum that is frequently disturbed (Newell et al.
1998). Rates of recovery reportedly are in the range of 6-8 months for estuaries with fine muds, such as the subtidal
areas in much of the Port of Durban, where disturbance is frequent and precludes the establishment of relatively
long lived organisms (Newell et al. 1998). Contrastingly, rates of recovery become far longer for communities
occurring in stable sandy and gravelly substrata such as those found at the intertidal sand banks and Little Lagoon
(Newell et al. 1998).
Fishes are also affected by dredging, particularly those that are bottom dwelling like gobies and sole as they are
sucked up by the dredger and are often killed in the process. Other larger species may simply be disturbed
temporarily. Apart from this, turbidity increases with dredging as can the concentration of potentially toxic trace

47
metals and hydrocarbons as they are resuspended by such activities. Most estuarine-associated fishes in KwaZulu-
Natal are well adapted to high levels of turbidity (Blaber, 1981). Few estuaries fall into the clear water categories (<
10 NTU) of Cyrus (1988), with most either semi-turbid (10-50 NTU) or turbid (> 50 NTU). While Durban Harbour is,
for the most part, relatively low in turbidity (≈ 10-15 NTU), values of at least 25 NTU near the bottom are not
uncommon (Newman et al. 2008). Piscivorous fishes in estuaries often rely on visual detection methods for
capturing their prey, and increasing turbidity levels can impact negatively on this. However, piscivorous species are
generally of marine origin and can exit the estuary if turbidity levels become too high or too widespread. Turbidity
generated by the dredging is anticipated to be localised, and fish are able to move to more favourable areas of the
harbour.
Sessile organisms however, particularly those that filter-feed are most likely to be impacted as material suspended
by dredging is likely to be largely inorganic resulting in feeding difficulties. For autotrophic organisms such as
microphytobenthos and phytoplankton, suspended material blocks light, the higher the suspended solids the more
light is attenuated.
Various site specific plume-model simulations have been produced for dredging operations to be conducted as part
of this project by ZAA Engineering Projects & Naval Architecture (ZAA, 2012a). These model simulations cover what
is assumed to be worst case scenario conditions where wind speed, wave height, wave period and direction are
constant at 20 m.s-1, 3 m, 10 s and 146.25° respectively, but natural tidal variations apply. Prevailing wind is
incorporated into the model in the two most-common directions (202.5° and 22.5°) spanning both neap and spring
tide cycles. Four scenarios have therefore been modelled.
Results show that plumes are most widespread during conditions of spring tides and south-westerly winds (202.5°),
and during conditions of neap tides with north-easterly winds (22.5°) (ZAA, 2012a) Figure 22, Figure 23, Figure 24 &
Figure 25). Generally, surface and bottom plumes did not differ much. Maximum suspended sediment
concentrations are modelled to occur at the site of the hopper and remain fairly localised. Peak sediment
concentrations reaching the Centre Bank are predicted to occur during conditions of spring tide and north-easterly
wind (22.5°) at levels of less than 28 mg.L-1 (ZAA 2012a). Levels of suspended sediments were found to closely
correspond at both high and low tides.
Maximum predicted turbidity levels coming into contact with the Centre Bank are therefore slightly higher than the
maximum levels recorded by Newman et al. (2008) near the floor of Durban harbour (≈25 NTU = 21 mg.L-1). Dredging
is therefore likely to cause a maximum of a two-fold increase in suspended sediment levels at Centre Bank.
The affect of these turbidity levels on fish are likely to be low and localised to a relatively small area. Maximum
turbidity levels at Centre Bank are predicted to be 58 NTU (backgroundmax + dredgemax = Total turbidity in NTU). Most
fishes in estuaries of KwaZulu-Natal are semi-turbid water species (Cyrus 1988) and are likely to be unperturbed by
the predicted levels of turbidity. Those that may be negatively affected, such as Pursemouths, can move to other
areas of the harbour as the plume is likely to be localised.
Benthic invertebrates are often more susceptible to the effects of turbidity, particularly those that filter-feed, as
many lack the mobility inherent to fishes and therefore can ingest high levels of inorganic material filtered from the
water resulting in lower growth rates or starvation and mortality. Steffani et al. (2003) have provided guidelines for
concentrations of suspended solids in relation to the risk it poses to marine invertebrates:
Low risk: < 20 mg.L-1
Medium risk: 20-80 mg.L-1
High risk, requiring mitigation: > 80 mg.L-1
Maximum levels of suspended solids in mg.L-1 modelled to reach Centre Bank equal 49 mg.L-1. This puts the dredging
operation within the centre of the medium-risk category, according to Steffani et al. (2003), but still within
acceptable levels for macrofauna and shallow water benthic microalgae. However, levels of suspended solids are
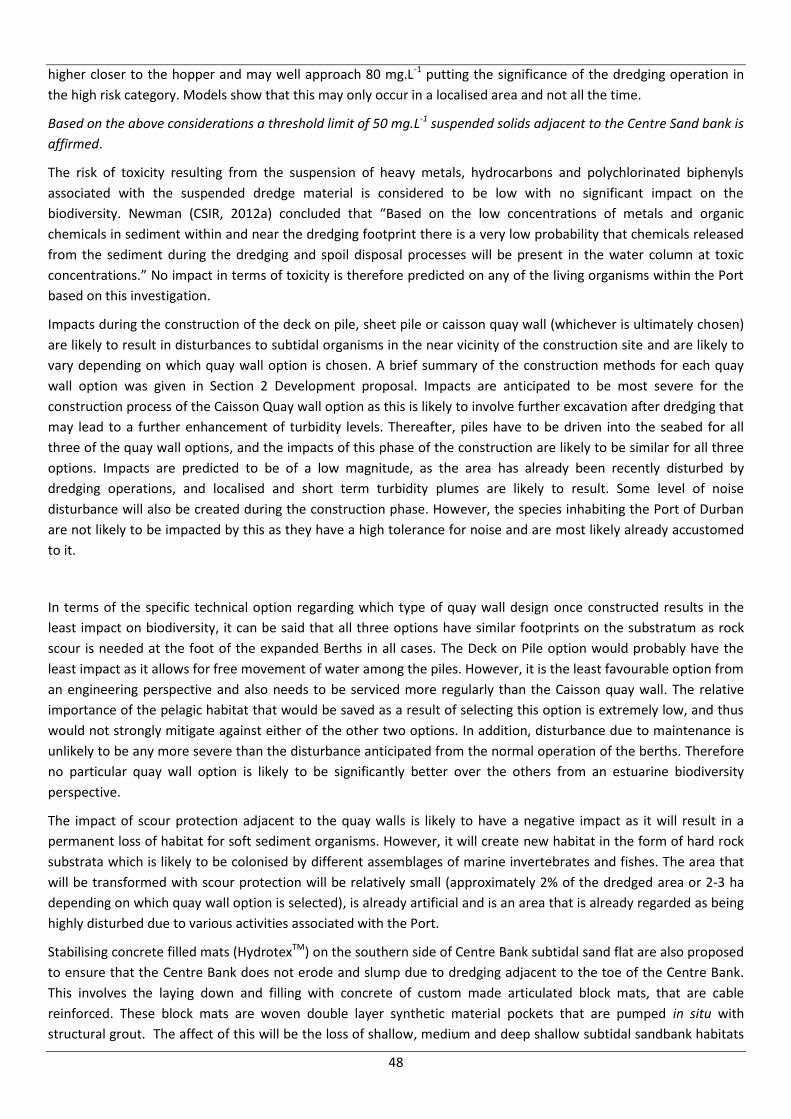
48
higher closer to the hopper and may well approach 80 mg.L-1 putting the significance of the dredging operation in
the high risk category. Models show that this may only occur in a localised area and not all the time.
Based on the above considerations a threshold limit of 50 mg.L-1 suspended solids adjacent to the Centre Sand bank is
affirmed.
The risk of toxicity resulting from the suspension of heavy metals, hydrocarbons and polychlorinated biphenyls
associated with the suspended dredge material is considered to be low with no significant impact on the
biodiversity. Newman (CSIR, 2012a) concluded that “Based on the low concentrations of metals and organic
chemicals in sediment within and near the dredging footprint there is a very low probability that chemicals released
from the sediment during the dredging and spoil disposal processes will be present in the water column at toxic
concentrations.” No impact in terms of toxicity is therefore predicted on any of the living organisms within the Port
based on this investigation.
Impacts during the construction of the deck on pile, sheet pile or caisson quay wall (whichever is ultimately chosen)
are likely to result in disturbances to subtidal organisms in the near vicinity of the construction site and are likely to
vary depending on which quay wall option is chosen. A brief summary of the construction methods for each quay
wall option was given in Section 2 Development proposal. Impacts are anticipated to be most severe for the
construction process of the Caisson Quay wall option as this is likely to involve further excavation after dredging that
may lead to a further enhancement of turbidity levels. Thereafter, piles have to be driven into the seabed for all
three of the quay wall options, and the impacts of this phase of the construction are likely to be similar for all three
options. Impacts are predicted to be of a low magnitude, as the area has already been recently disturbed by
dredging operations, and localised and short term turbidity plumes are likely to result. Some level of noise
disturbance will also be created during the construction phase. However, the species inhabiting the Port of Durban
are not likely to be impacted by this as they have a high tolerance for noise and are most likely already accustomed
to it.
In terms of the specific technical option regarding which type of quay wall design once constructed results in the
least impact on biodiversity, it can be said that all three options have similar footprints on the substratum as rock
scour is needed at the foot of the expanded Berths in all cases. The Deck on Pile option would probably have the
least impact as it allows for free movement of water among the piles. However, it is the least favourable option from
an engineering perspective and also needs to be serviced more regularly than the Caisson quay wall. The relative
importance of the pelagic habitat that would be saved as a result of selecting this option is extremely low, and thus
would not strongly mitigate against either of the other two options. In addition, disturbance due to maintenance is
unlikely to be any more severe than the disturbance anticipated from the normal operation of the berths. Therefore
no particular quay wall option is likely to be significantly better over the others from an estuarine biodiversity
perspective.
The impact of scour protection adjacent to the quay walls is likely to have a negative impact as it will result in a
permanent loss of habitat for soft sediment organisms. However, it will create new habitat in the form of hard rock
substrata which is likely to be colonised by different assemblages of marine invertebrates and fishes. The area that
will be transformed with scour protection will be relatively small (approximately 2% of the dredged area or 2-3 ha
depending on which quay wall option is selected), is already artificial and is an area that is already regarded as being
highly disturbed due to various activities associated with the Port.
Stabilising concrete filled mats (HydrotexTM) on the southern side of Centre Bank subtidal sand flat are also proposed
to ensure that the Centre Bank does not erode and slump due to dredging adjacent to the toe of the Centre Bank.
This involves the laying down and filling with concrete of custom made articulated block mats, that are cable
reinforced. These block mats are woven double layer synthetic material pockets that are pumped in situ with
structural grout. The affect of this will be the loss of shallow, medium and deep shallow subtidal sandbank habitats

49
(0 to 12.8 m below CDP) (ZAA Engineering Projects & Naval Architects, 2012) and the mortality of all invertebrates
living in this part of the sand bank (Figure 10). As the mattresses are permanent, this would lead to a permanent loss
of shallow subtidal sandy habitat and the creation of new artificial habitat different from the natural habitat.
However, with the adoption of Option 3G a net gain of 0.04 % will result despite the stabilising mattresses.
Each envisaged impact resulting from the proposed development during construction (Table 15 to Table 27),
operation (Table 34) and periodic maintenance phases (Table 35) of the new quay were assessed separately, results
of which are presented in the tables below. In addition, impacts expected from the various proposed mitigation
measures are also assessed (Table 28 to Table 33). All of these assessments are summarised in Table 36. A detailed
description of how impacts are assessed is given in Appendix 1.

50
.
Figure 20. Surface-plume model results for conditions of neap tide with a wind direction of 202.5° showing suspended sediment (kg.m-3
).
Figure 21. Bottom-plume model results for conditions of neap tide and with a wind from 202.5° showing suspended sediment (kg.m-3
).

51
Figure 22. Surface-plume model results for conditions of neap tide with wind from a direction of 22.5° showing suspended sediment (kg.m-
3).
Figure 23. Bottom-plume model results for conditions of neap tide and wind from a direction of 22.5° showing suspended sediment (kg.m-
3).

52
Figure 24. Surface-plume model results for conditions of spring tide and wind from 202.5° showing suspended sediment (kg.m-3
).
Figure 25. Bottom-plume model results for conditions of spring tide and wind from 202.5° showing suspended sediment (kg.m-3
).
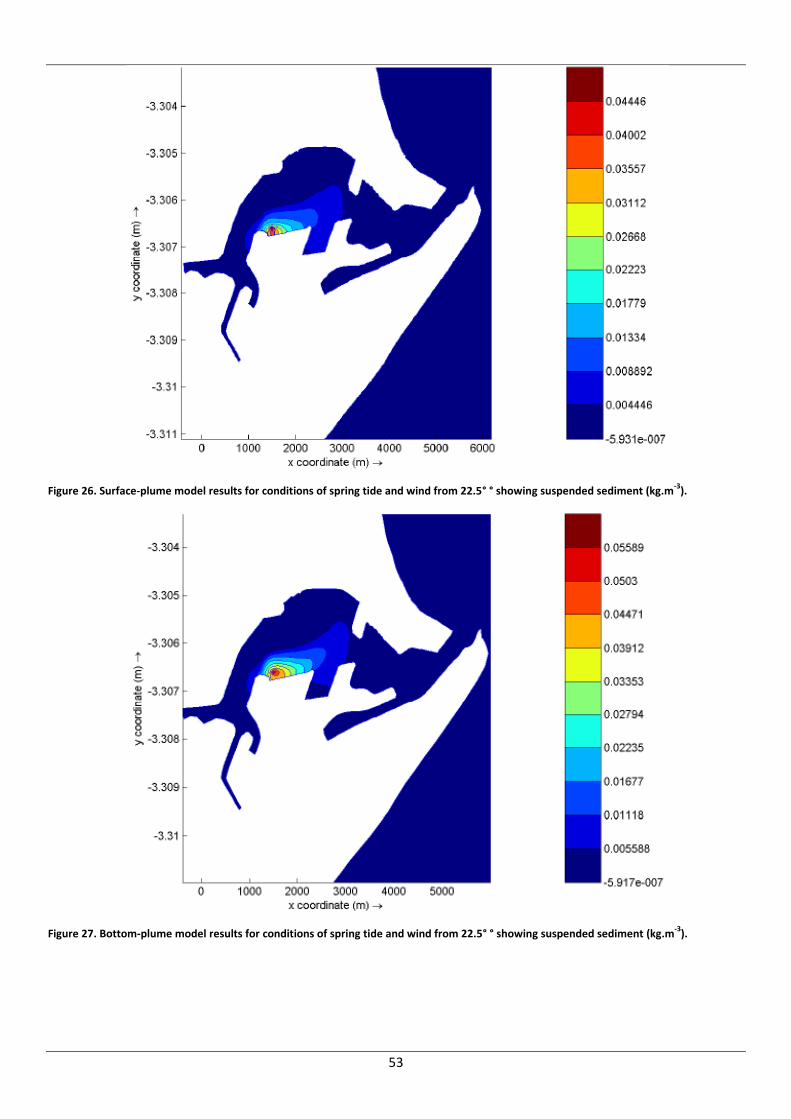
53
Figure 26. Surface-plume model results for conditions of spring tide and wind from 22.5° ° showing suspended sediment (kg.m-3
).
Figure 27. Bottom-plume model results for conditions of spring tide and wind from 22.5° ° showing suspended sediment (kg.m-3
).

54
Table 15. Impact 1: Ecological effects due to the permanent loss of intertidal and shallow subtidal habitats at Centre Bank.
Extent Intensity Duration Consequence Probability Significance Status Confidence
Without mitigation
Local 1
High 3 Long-
term 3 High 7
Definite High -ve High
Essential mitigation measures: Option 3G Optional mitigation measures: Conversion of DCT stockpile into intertidal and shallow habitat
With mitigation
Local 1
Medium 2
Long-term 3
Medium 6 Probable Medium -ve Medium
Table 16. Impact 2: Ecological effects due to the permanent loss of deep subtidal and open water habitats
Extent Intensity Duration Consequence Probability Significance Status Confidence
Without mitigation
Local 1
Medium 2
Long-term 3
Medium 6 Definite Medium -ve High
Essential mitigation measures: Increase the amount of shallow and medium subtidal habitat via Option 3G Optional mitigation measures: Conversion of DCT stockpile into intertidal and shallow habitat
With mitigation
Local 1
Low 1 Long-
term 3 Low 5 Probable Low +ve Medium
Table 17. Impact 3: Ecological effects due to the temporary loss of sediment habitat and associated infauna in dredging footprint
Extent Intensity Duration Consequence Probability Significance Status Confidence
Without mitigation
Local 1
Medium 2
Medium-term 2
Low 5 Definite Low -ve High
Essential mitigation measures: Reduce dredge footprint (Option 3G) Optional mitigation measures:
With mitigation
Local 1
Medium 2
Medium-term 2
Low 5 Definite Low -ve Medium
Table 18. Impact 4: Ecological effects due to the release of contaminants in sediment into the water column caused by dredging to the extent that toxic effects manifest
Extent Intensity Duration Consequence Probability Significance Status Confidence
Without mitigation
Local 1
High 3 Short-term 1
Low 5 Improbable Very low -ve High
Essential mitigation measures: Not applicable Optional mitigation measures:
With mitigation
Not applicable

55
Table 19. Impact 5: Ecological effects due to the release of nutrients in sediment porewater to the extent that microalgae are stimulated to bloom status
Extent Intensity Duration Consequence Probability Significance Status Confidence
Without mitigation
Local 1
Medium 2
Short-term 1
Very low 4 Improbable Insignificant -ve Medium
Essential mitigation measures: Not applicable Optional mitigation measures:
With mitigation
Not applicable
Table 20. Impact 6: Ecological effects due to the reduction in dissolved oxygen concentrations
Extent Intensity Duration Consequence Probability Significance Status Confidence
Without mitigation
Local 1
Medium 2
Short-term 1
Very low 4 Possible Low -ve Medium
Essential mitigation measures: Conduct dredging operations as efficiently as possible and reduce turbidity levels Optional mitigation measures:
With mitigation
Local 1
Low 1 Short-term 1
Very low 3 Possible Low -ve Medium
Table 21. Impact 7: Ecological effects caused by the smothering of subtidal bottom-dwelling organisms due to the settlement of suspended sediment outside the dredging footprint
Extent Intensity Duration Consequence Probability Significance Status Confidence
Without mitigation
Local 1
Medium 2
Short-term 1
Very low 4 Probable Very low -ve Medium
Essential mitigation measures: i) Continuous monitoring should be undertaken of turbidity levels during the dredge operations. Data from the
turbidity monitoring instruments should be available in real time to the person coordinating dredging activities. Dredging operations should be halted immediately if turbidity levels exceed a threshold level of 50 mg.L
-1 (see Porter et al. 2012) at any of the monitoring stations and should not recommence until levels have
declined below this level.
ii) If turbidity frequently exceeds threshold levels at the monitoring stations adjacent to the central sand bank and/or in Little Lagoon during dredging operations, use of ‘Silt Curtains’ at the burrow pit may be necessary. The lower end of the ‘skirt’ must be allowed to rest upon the seafloor, and the top of the ‘skirt’ must be above the water surface.
iii) Another option to reduce turbidity is to choke the dredge hopper overflow with a fully automated system. In this scenario, a computerized process controller ensures dynamic adjustment of the valve in the overflow funnel which chokes the flow in such a way that a constant fluid level in the hopper is maintained and, as a result, no air is taken down with the suspension leaving the hopper. This generally results in a significant decrease in turbidity.
iv) The time period over which the dredging operation is to take place should be minimised, to avoid the daily re-suspension of sediments.
Optional mitigation measures:

56
With mitigation
Local 1
Low 1 Short-term 1
Very low 3 Possible Insignificant -ve Medium
Table 22. Impact 8: Ecological effects of increased suspended solids concentrations on filter feeding organisms
Extent Intensity Duration Consequence Probability Significance Status Confidence
Without mitigation
Local 1
Medium 2
Short-term 1
Very low 4 Probable Very low -ve Medium
Essential mitigation measures: i) Continuous monitoring should be undertaken of turbidity levels during the dredge operations. Data from the
turbidity monitoring instruments should be available in real time to the person coordinating dredging activities. Dredging operations should be halted immediately if turbidity levels exceed a threshold level of 50 mg.L
-1 (see Porter et al. 2012) at any of the monitoring stations and should not recommence until levels
have declined below this level.
ii) If turbidity frequently exceeds threshold levels at the monitoring stations adjacent to the central sand bank and/or in Little Lagoon during dredging operations, use of ‘Silt Curtains’ at the burrow pit may be necessary. The lower end of the ‘skirt’ must be allowed to rest upon the seafloor, and the top of the ‘skirt’ must be above the water surface.
iii) Another option to reduce turbidity is to choke the dredge hopper overflow with a fully automated system. In this scenario, a computerized process controller ensures dynamic adjustment of the valve in the overflow funnel which chokes the flow in such a way that a constant fluid level in the hopper is maintained and, as a result, no air is taken down with the suspension leaving the hopper. This generally results in a significant decrease in turbidity.
iv) The time period over which the dredging operation is to take place should be minimised, to avoid the daily re-suspension of sediments.
Optional mitigation measures:
With mitigation
Local 1
Low 1 Short-term 1
Very low 3 Possible Insignificant -ve Medium
Table 23. Impact 9: Ecological effects of increased suspended solids concentrations and turbidity on benthic microalgae
Extent Intensity Duration Consequence Probability Significance Status Confidence
Without mitigation
Local 1
Medium 2
Short-term 1
Very low 4 Probable Very low -ve Medium
Essential mitigation measures: i) Continuous monitoring should be undertaken of turbidity levels during the dredge operations. Data from the
turbidity monitoring instruments should be available in real time to the person coordinating dredging activities. Dredging operations should be halted immediately if turbidity levels exceed a threshold level of 50 mg.L
-1 (see Porter et al. 2012) at any of the monitoring stations and should not recommence until levels
have declined below this level.
ii) If turbidity frequently exceeds threshold levels at the monitoring stations adjacent to the central sand bank

57
and/or in Little Lagoon during dredging operations, use of ‘Silt Curtains’ at the burrow pit may be necessary. The lower end of the ‘skirt’ must be allowed to rest upon the seafloor, and the top of the ‘skirt’ must be above the water surface.
iii) Another option to reduce turbidity is to choke the dredge hopper overflow with a fully automated system. In this scenario, a computerized process controller ensures dynamic adjustment of the valve in the overflow funnel which chokes the flow in such a way that a constant fluid level in the hopper is maintained and, as a result, no air is taken down with the suspension leaving the hopper. This generally results in a significant decrease in turbidity.
iv) The time period over which the dredging operation is to take place should be minimised, to avoid the daily re-suspension of sediments.
Optional mitigation measures:
With mitigation
Local 1
Low 1 Short-term 1
Very low 3 Possible Insignificant -ve Medium
Table 24. Impact 10: Ecological effects of increased suspended solids concentrations and turbidity on water column primary production
Extent Intensity Duration Consequence Probability Significance Status Confidence
Without mitigation
Local 1
Medium 2
Short-term 1
Very low 4 Probable Very low -ve Medium
Essential mitigation measures: i) Continuous monitoring should be undertaken of turbidity levels during the dredge operations. Data from the
turbidity monitoring instruments should be available in real time to the person coordinating dredging activities. Dredging operations should be halted immediately if turbidity levels exceed a threshold level of 50 mg.L
-1 (see Porter et al. 2012) at any of the monitoring stations and should not recommence until levels
have declined below this level.
ii) If turbidity frequently exceeds threshold levels at the monitoring stations adjacent to the central sand bank and/or in Little Lagoon during dredging operations, use of ‘Silt Curtains’ at the burrow pit may be necessary. The lower end of the ‘skirt’ must be allowed to rest upon the seafloor, and the top of the ‘skirt’ must be above the water surface.
iii) Another option to reduce turbidity is to choke the dredge hopper overflow with a fully automated system. In this scenario, a computerized process controller ensures dynamic adjustment of the valve in the overflow funnel which chokes the flow in such a way that a constant fluid level in the hopper is maintained and, as a result, no air is taken down with the suspension leaving the hopper. This generally results in a significant decrease in turbidity.
iv) The time period over which the dredging operation is to take place should be minimised, to avoid the daily re-suspension of sediments.
Optional mitigation measures:
With mitigation
Local 1
Low 1 Short-term 1
Very low 3 Possible Insignificant -ve Medium
Table 25. Impact 11: Ecological effects of increased suspended solids concentrations and turbidity on pelagic organisms

58
Extent Intensity Duration Consequence Probability Significance Status Confidence
Without mitigation
Local 1
Low 1 Short-term 1
Very low 3 Probable Very low -ve Medium
Essential mitigation measures: i) Continuous monitoring should be undertaken of turbidity levels during the dredge operations. Data from the
turbidity monitoring instruments should be available in real time to the person coordinating dredging activities. Dredging operations should be halted immediately if turbidity levels exceed a threshold level of 50 mg.L
-1 (see Porter et al. 2012) at any of the monitoring stations and should not recommence until levels
have declined below this level.
ii) If turbidity frequently exceeds threshold levels at the monitoring stations adjacent to the central sand bank and/or in Little Lagoon during dredging operations, use of ‘Silt Curtains’ at the burrow pit may be necessary. The lower end of the ‘skirt’ must be allowed to rest upon the seafloor, and the top of the ‘skirt’ must be above the water surface.
iii) Another option to reduce turbidity is to choke the dredge hopper overflow with a fully automated system. In this scenario, a computerized process controller ensures dynamic adjustment of the valve in the overflow funnel which chokes the flow in such a way that a constant fluid level in the hopper is maintained and, as a result, no air is taken down with the suspension leaving the hopper. This generally results in a significant decrease in turbidity.
iv) The time period over which the dredging operation is to take place should be minimised, to avoid the daily re-suspension of sediments.
Optional mitigation measures:
With mitigation
Local 1
Low 1 Short-term 1
Very low 3 Possible Insignificant -ve Medium
Table 26. Impact 12: Ecological effects of smothering of deep subtidal sediment due to rocky scour protection adjacent to quay walls
Extent Intensity Duration Consequence Probability Significance Status Confidence
Without mitigation
Local 1
Low 1 Long-
term 3 Low 5
Definite Low -ve High
Essential mitigation measures: Increase shallow and medium subtidal habitats (i.e. Option 3G) Optional mitigation measures:
With mitigation
Local 1
Low 1 Long-
term 3 Low 5
Possible Very low -ve High
Table 27. Impact 13: Ecological effects of habitat transformation due to rocky scour protection adjacent to quay walls
Extent Intensity Duration Consequence Probability Significance Status Confidence
Without mitigation
Local 1
Low 1 Long-
term 3 Low 5
Definite Low -ve High
Essential mitigation measures: Increase shallow and medium subtidal habitats (i.e. Option 3G) Optional mitigation measures:
With Local Low 1 Long- Low 5 Possible Very low -ve High

59
mitigation 1 term 3
Table 28. Impact 14: Ecological effects of smothering of habitat due to scour protection mattresses on Centre Bank shallow subtidal sand banks.
Extent Intensity Duration Consequence Probability Significance Status Confidence
Without mitigation
Local 1
Medium 2
Long-term 3
Medium 6 Definite Medium -ve Medium
Essential mitigation measures: Increase shallow and medium subtidal habitats (i.e. Option 3G) Optional mitigation measures:
With mitigation
Local 1
Low 1 Long-
term 3 Low 5
Possible Very low -ve Medium
Table 29. Impact 15: Ecological effects of smothering of habitat due to scour protection mattresses on Centre Bank deep subtidal sand banks.
Extent Intensity Duration Consequence Probability Significance Status Confidence
Without mitigation
Local 1
Low 1 Long-
term 3 Low 5
Definite Low -ve Medium
Essential mitigation measures: Increase shallow and medium subtidal habitats (i.e. Option 3G) Optional mitigation measures:
With mitigation
Local 1
Low 1 Long-
term 3 Low 5
Possible Very low -ve Medium
Table 30. Impact 16: Ecological effects of habitat transformation due to scour protection mattresses on Centre Bank shallow subtidal sand banks
Extent Intensity Duration Consequence Probability Significance Status Confidence
Without mitigation
Local 1
Medium 2
Long-term 3
Medium 6 Definite Medium -ve Medium
Essential mitigation measures: Not applicable Optional mitigation measures:
With mitigation
Not applicable
Table 31. Impact 17: Ecological effects of habitat transformation due to scour protection mattresses on Centre Bank deep subtidal sand banks
Extent Intensity Duration Consequence Probability Significance Status Confidence
Without mitigation
Local 1
Low 1 Long-
term 3 Low 5
Definite Low -ve Medium
Essential mitigation measures: Not applicable Optional mitigation measures:
With mitigation
Not applicable
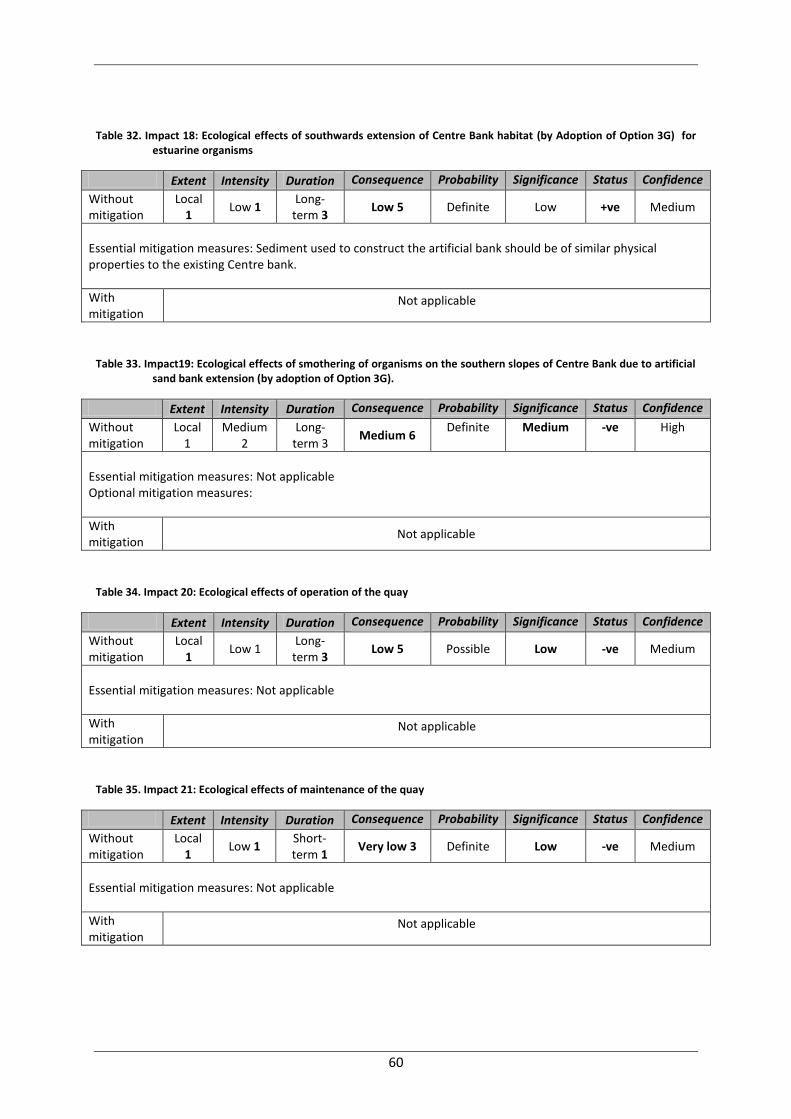
60
Table 32. Impact 18: Ecological effects of southwards extension of Centre Bank habitat (by Adoption of Option 3G) for estuarine organisms
Extent Intensity Duration Consequence Probability Significance Status Confidence
Without mitigation
Local 1
Low 1 Long-
term 3 Low 5 Definite Low +ve Medium
Essential mitigation measures: Sediment used to construct the artificial bank should be of similar physical properties to the existing Centre bank.
With mitigation
Not applicable
Table 33. Impact19: Ecological effects of smothering of organisms on the southern slopes of Centre Bank due to artificial sand bank extension (by adoption of Option 3G).
Extent Intensity Duration Consequence Probability Significance Status Confidence
Without mitigation
Local 1
Medium 2
Long-term 3
Medium 6 Definite Medium -ve High
Essential mitigation measures: Not applicable Optional mitigation measures:
With mitigation
Not applicable
Table 34. Impact 20: Ecological effects of operation of the quay
Extent Intensity Duration Consequence Probability Significance Status Confidence
Without mitigation
Local 1
Low 1 Long-
term 3 Low 5 Possible Low -ve Medium
Essential mitigation measures: Not applicable
With mitigation
Not applicable
Table 35. Impact 21: Ecological effects of maintenance of the quay
Extent Intensity Duration Consequence Probability Significance Status Confidence
Without mitigation
Local 1
Low 1 Short-term 1
Very low 3 Definite Low -ve Medium
Essential mitigation measures: Not applicable
With mitigation
Not applicable

61
Table 36. Summary of potential impacts as a result of the proposed development.
Source
of
impact
Impact identified Consequence Probability Significance Status Confidence
Imp
acts
ass
oci
ated
wit
h d
red
gin
g an
d q
uay
co
nst
ruct
ion
& e
xpan
sio
n in
Du
rban
Har
bo
ur
Impact 1: Ecological effects due to the permanent loss
of intertidal and shallow subtidal habitats at Centre
Bank.
High Definite High -ve High
With Mitigation Medium Probable Medium -ve Medium
Impact 2: Ecological effects due to the permanent loss
of deep subtidal and open water habitats
Medium Definite Medium -ve High
With Mitigation Low Probable Low +ve Medium
Impact 3: Ecological effects due to the temporary loss
of sediment habitat and associated infauna in
dredging footprint
Low Definite Low -ve High
With Mitigation Low Definite Low -ve Medium
Impact 4: Ecological effects due to the release of
contaminants in sediment into the water column
caused by dredging to the extent that toxic effects
manifest
Low Improbable Very low -ve High
With Mitigation Not applicable
Impact 5: Ecological effects due to the release of
nutrients in sediment porewater to the extent that
microalgae are stimulated to bloom status
Very low Improbable
Insignificant -ve Medium

62
Source
of
impact
Impact identified Consequence Probability Significance Status Confidence
With Mitigation Not applicable
Impact 6: Ecological effects due to the reduction in
dissolved oxygen concentrations
Very low Possible Low -ve Medium
With Mitigation Very low Possible Low -ve Medium
Impact 7: Ecological effects caused by the smothering
of subtidal bottom-dwelling organisms due to the
settlement of suspended sediment outside the
dredging footprint
Very low Probable Very low -ve Medium
With Mitigation Very low Possible Insignificant -ve Medium
Impact 8: Ecological effects of increased suspended
solids concentrations on filter feeding organisms
Very low Probable Very low -ve Medium
With Mitigation Very low Possible Insignificant -ve Medium
Impact 9: Ecological effects of increased suspended
solids concentrations and turbidity on benthic
microalgae
Very low Probable Very low -ve Medium
With Mitigation Very low Possible Insignificant -ve Medium
Impact 10: Ecological effects of increased suspended
solids concentrations and turbidity on water column
primary production
Very low Probable Very low -ve Medium
With Mitigation Very low Possible Insignificant -ve Medium
Impact 11: Ecological effects of increased suspended solids concentrations and turbidity on pelagic
Very low Probable Very low -ve Medium

63
Source
of
impact
Impact identified Consequence Probability Significance Status Confidence
organisms
With Mitigation Very low Probable Very low -ve Medium
Impact 12: Ecological effects of smothering of deep subtidal sediment due to rocky scour protection adjacent to quay walls
Low Definite Low -ve High
With Mitigation Low Possible Very low -ve High
Impact 13: Ecological effects of habitat transformation due to rocky scour protection adjacent to quay walls
Low Definite Low -ve High
With Mitigation Low Possible Very low -ve High
Impact 14: Ecological effects of smothering of habitat
due to scour protection mattresses on Centre Bank
shallow subtidal sand banks.
Medium Definite Medium -ve Medium
With Mitigation Low Possible Very low -ve Medium
Impact 15: Ecological effects of smothering of habitat
due to scour protection mattresses on Centre Bank
deep subtidal sand banks.
Low Definite Low -ve Medium
With Mitigation Low Possible Very low -ve Medium
Impact 16: Ecological effects of habitat transformation
due to scour protection mattresses on Centre Bank
shallow subtidal sand banks
Medium Definite Medium -ve Medium

64
Source
of
impact
Impact identified Consequence Probability Significance Status Confidence
With Mitigation Not applicable
Mit
igat
ion
Impact 17: Ecological effects of habitat transformation
due to scour protection mattresses on Centre Bank
deep subtidal sand banks
Low Definite Low -ve Medium
With Mitigation Not applicable
Impact 18: Ecological effects of southwards extension
of Centre Bank habitat (by adoption of Option 3G) by
0.04 % for estuarine organisms
Low Definite Low +ve Medium
With Mitigation Not applicable
Impact 19: Ecological effects of smothering of
organisms on the southern slopes of Centre Bank due
to artificial sand bank creation (by adoption of Option
3G)
Medium Definite Medium -ve High
With Mitigation Not applicable
Op
erat
ion
&
mai
nte
nan
ce o
f q
uay
Impact 20: Ecological effects of operation of the quay Low Possible Low -ve Medium
With Mitigation Not applicable
Impact 21: Ecological effects of maintenance of the quay
Very low Definite Low -ve Medium
With Mitigation Not applicable

65
10 Mitigation
Measures required to mitigate impacts on estuarine organisms of Durban Bay have largely been built
into the project design in the form of additional development options (Options 3C-G). These
mitigation measures were identified during the project design phase as a result of interactions
between specialists on the EIA team, the project engineers (ZAA) and the developer (Transnet). The
various development options represent incremental changes in the project design developed in an
effort to mitigate loss of intertidal habitat from the Centre Bank. The target for these mitigation
measures was zero nett loss of intertidal and shallow subtidal habitat and was considered to have
been achieved under development option 3G. The decision to artificially extend Centre Bank,
however, should not be taken lightly. There is uncertainty and risk that the new sand flat will not be
fully colonised or function as successfully as the original sand flat. The worst case scenario is that it
could do more harm than good because, assuming that the artificial bank does not function
ecologically, by extending it the southern slopes of the current productive Centre Bank are
effectively smothered at the same time. The likelihood of success to a large extent will depend on
the characteristics of the sediment used for construction and its stability and erosion resistance. The
artificial portion of Centre Bank should be of the same (or similar) grain size composition as the
existing Centre Bank area.
Literature on the colonisation of artificial sand banks in estuaries is limited. There is however
information on the impacts and colonisation of offshore dredge spoil. Studies in the OSPAR maritime
area (North-East Atlantic) indicate recovery rates for species richness, abundance and diversity to
range from 3 months to 2 years (Bolam et al. 2006; Stronkhorst et al. 2003; Bolam & Whomersley
2005; Van Dalfsen & Lewis 2006). It is assumed that a similar time period for full colonisation of the
artificial habitat will be required in this case as well.
It is also important to recognise that the extension of Centre Bank provides an opportunity for proof
of concept provided colonisation of the newly created habitat is properly monitored after it is
established. If the development is successful then this could be used in other areas of the Bay for
purposes of restoration.
Additional mitigation measures not incorporated in the project design options to be implemented
during the construction and operational phase of the project considered essential for effectively
mitigating impacts identified in this study include the following:
1. Continuous monitoring should be undertaken of turbidity levels during the dredge
operations, and data from such monitoring work should be available in real time to the
person coordinating dredging activities. Dredging operations should be halted immediately
if turbidity levels exceed a threshold level of 50 mg.L-1 at any of the designated monitoring
stations and should not recommence until levels have declined below this point.
2. If turbidity frequently exceeds threshold levels at the monitoring stations adjacent to the
central sand bank and/or in Little Lagoon during dredging operations, ‘Silt Curtains’ at the
burrow pit should be used to mitigate this. The lower end of the ‘skirt’ must be allowed to
rest upon the seafloor, and the top of the ‘skirt’ must be above the water surface.
3. Turbidity should be minimised by choking the dredge hopper overflow with a fully
automated system. In this scenario, a computerized process controller ensures dynamic
adjustment of the valve in the overflow funnel which chokes the flow in such a way that a

66
constant fluid level in the hopper is maintained and, as a result, no air is taken down with
the suspension leaving the hopper.
4. The time period over which the dredging operation is to take place should be kept as short
as possible, to avoid the daily re-suspension of sediments.
5. Sediment used to construct the artificial bank should be of similar physical properties to the
existing Centre Bank.
6. As far as possible construct the artificial extension of Centre Bank during winter when
migrant waders are absent.
Additional, optional mitigation measures are proposed as follows:
1. Keep the dredge hopper stationary during dredge operations.
2. Undertake construction work as quickly as possible to minimise the time period of
disturbance.
3. Conversion of DCT stockpile into intertidal and shallow habitat
11 Monitoring Programme
The aim of the biodiversity monitoring programme is to assess the impact and effectiveness of the
proposed mitigation measures, and the rate or recovery and recolonisation of the affected areas
once dredged. These data will be invaluable for assessing the effectiveness of the offsets proposed
in this study and their potential use in future where habitat replacement (offsets) may be required
again in the future.
Key activities to be undertaken as part of this monitoring programme include the following:
(i) Monitor real-time turbidity levels adjacent to Centre Bank during dredging operations
such that if threshold levels are reached then dredging can be momentarily halted and/or
mitigation measures activated if threshold levels are exceeded on an ongoing basis.
(ii) Undertake baseline surveys of the composition, abundance and biomass of macrofauna
and fish communities in the intertidal area of the central sand bank immediately prior to
the commencement of the dredging operations and use these data along with
corresponding data from the post construction period to assess potential impacts and
rates of recovery of biotic communities in areas potentially affected by the dredging
activities and rates of colonisation in the newly in-filled areas at the western end of Pier 2
and along the southern edge of the central bank. Sampling should be conducted on at
least two occasions prior to the initiation of the dredging activities, immediately after
completion of the dredging, and at six monthly intervals for a period of three years
following this date.

67
12 References
Allan, D.G., Sinclair, J.C. & Rossouw, J. 1999. The waterbirds of Durban Harbour: current status and
historical trends. Durban Museum Novitates 24: 1-21.
Angel, A. & Clark, B.M. 2008. Port of Durban ballast water, flora and fauna survey. Anchor
Environmental Consultants.
Beckley, L. E. & Fennessy, S. T. 1996. The beach seine fishery off Durban, KwaZulu Natal. South
African Journal of Zoology 31: 186-192.
Blaber, S.J.M. 1974. Field studies of the diet of Rhabdosargus holubi (Pisces: Teleostei: Sparidae).
Journal of Zoology (London) 173: 407-417.
Blaber, S.J.M. 1981. The zoogeographical affinities of estuarine fishes in south-east Africa. South
African Journal of Marine Science 77: 305-307.
Bolam, S.G., Schratzberger, M. and Whomersley, P. (2006). Macro- and meiofaunal recolonization of dredged
material used for habitat enhancement: Temporal patterns in community development. Marine
Pollution Bulletin 52: 1746-1755.
Bolam, S.G. & Whomersley, P. (2005). Development of macrofaunal communities on dredged
material used for mudflat enhancement: a comparison of three beneficial use schemes after
one year. Marine Pollution Bulletin 50: 40-47.
Bonn 2012. Bonn Convention or the Convention of Migratory Species. United Nations Environmental
Program. http://www.cms.int/about/intro.htm Accessed: 10 July 2012.
Caplat, C., Texier, H., Barillier, D., Lelievre, C. 2005. Heavy metals mobility in harbour contaminated
sediments: the case of Port-en-Bessin. Marine Pollution Bulletin 50: 504-511.
Cyrus, D.P. 1988. Turbidity and other physical factors in Natal estuarine systems. Journal of the
Limnological Society of Southern Africa 14: 60-71.
Cyrus, D.P. and Forbes, A.T. 1996. Preliminary results on the role of KwaZulu-Natal harbours as
nursery grounds for juveniles of selected marine organisms which utilise estuaries. South
African Journal of Wildlife Research 26: 26-33.
Day, J.H and Morgans J.F.C., (1956). The ecology of South African estuaries. Part 7. The Biology of
Durban Harbour. Annals of the Natal Museum 13(30): 259‐312.
ERM/MER. 2012. Bay of Natal Estuarine Management Plan Report prepared for eThekwini
Municipality, Transnet National Ports Authority and the Department of Agriculture,
Environmental Affairs and Rural Development.
EThekweni Municipallity, 2008. EThekweni Municipallity systematic conservation plan land class
layer.
Fahrig, L. 1997. Relative effects of habitat loss and fragmentation on population extinction. The
Jounral of Wildlife Managment 61: 603-610.
Fahrig, L. 2002. Effect of habitat fragmentation on the extinction threshold: a synthesis. Ecological
Applications 12: 346-353.

68
Forbes, A.T., Demetriades, N.T. & Cyrus, D.P. 1996. Biological significance of harbours as coastal
habitats in KwaZulu-Natal, South Africa. Aquatic Conservation: Marine and Freshwater
Ecosystems 6: 331-341.
Hay D.G, Forbes A.T, Cyrus D.P., (1995). The biological status of the ports of Natal and their role as
alternative nursery grounds for juveniles of marine organisms normally occurring in
estuaries. In: Hay D.G., Breen C.M., (eds). Disturbance and evolution as factors influencing
the structure and functioning of estuaries. Investigational report for the Institute of Natural
Resources of South Africa, Pietermaritzburg, IR107: 80‐96.
Lamberson, R.H., McKelvey, K., Noon, B.R. & Voss, C. 1992. Reserve design for territorial species: the
effects of patch size and spacing on the viability of the northern spotted owl. Conservation
Biology 6: 505-512.
McInnes, A.M., Allan, D.G. & Malan, G. 2005. Key sites for the conservation of waterbirds (Aves) in
Durban Harbour, South Africa.
Nemai Consulting. 2012. Deepening, lengthening and widening of Berth 203 to 205, Pier 2, container
terminal, Port of Durban. Scoping Report.
Newell, R.C., Seiderer, L.J. & Hitchcock, D.R. 1998. The impact of dredging works in coastal waters: a
review of the sensitivity to disturbasnce and subsequent recovery of biological resources on
the sea bed. Oceanography and Marine Biology: and Annual Review 36: 127-178.
CSIR. 2012a. Deepening, lengthening and widening of Berths 203 to 205 in the Port of Durban:
Sediment quality within and near the dredging footprint. CSIR Report
CSIR/NRE/ECOS/ER/2012/0034/A.
CSIR. 2012b. Deepening, lengthening and widening of Berths 203 to 205, Pier 2, Container Terminal,
Port of Durban: Potential long term impacts to sandbank habitat, water and sediment
quality. CSIR Report Number: CSIR/NRE/ECOS/ER/2012/0038/B.
Newman, B., Weerts, S., Porter, S. & Mackay, F. 2008. Specialist studies for Transnet capital
expansion program, Durban Harbour. Ecosystems Competency, Council for Scientific and
Industrial Research.
Obeng, A.M.D. 2010. The impact of harbour and associated activities on the water quality of the
Durban Bay and their effects on indwelling ecosystems. MSc thesis, University of KwaZulu-
Natal.
Pillay, D. 2002. The macrobenthos of the Little Lagoon, Durban Harbour. MSc thesis, University of
Natal.
Porter, S.N., Sink, K.J. Holness, S. & Lombard, A. 2011. Review to support the development of marine
biodiversity targets for South Africa. South African National Biodiversity Institute.
Radford, J.Q., Bennett, A.F. & Cheers, G.J. 2005. Landscape-level thresholds of habitat cover for
woodland-dependent birds. Biological Conservation 124: 317-337.
SKM. 2011. Sinclair Knight and Merz. Port Hedland outer harbour development: water quality
thresholds. SKM & BHP Billiton. WV03716-MV-RP-0029.
69
Sprovieri, M., Luisa Feo, M., Prevedello, L., Salvagio Manta, D., Sammartino, S., Tamburrino, S. &
Marsella, E. 2007. Meavy metals, polycyclic aromatic hydrocarbons and polychlorinated
biphenyls in surface sediments of the Naples harbour (southern Italy). Chemosphere 67: 998-
1009.
Steffani, N., Pulfrich, A. Carter, R. & Lane, S. 2003. Environmental impact assessment for the
expansion of the container terminal stacking area at the Port of Cape Town – Marine
ecological aspects. Draft report by Pisces Environmental Services, R Carter Specialist
Consultant, and Sue Lane and Associates.
Stronkhorst, J., Ariese, F., van Hattum, B., Postma, J.F., de Kluijver, M., Den Besten, P.J., Bergman,
M.J.N., Daan, R., Murk, A.J. and Vethaak, A.D. 2003. Environmental impact and recovery at
two dumping sites for dredged material in the North Sea. Environmental Pollution 124: 17-
31.
Travis, J.M.J. 2003. Climate change and habitat destruction: a deadly anthropogenic cocktail.
Proceedings of the Royal Society 270: 467-473.
Van Dalfsen, J.A. & Lewis, W.E. 2006. Ecologisch herstel Verdiepte Loswal (in Dutch). TNO rapport
2006-DH-R0312/B, 41 pp. Den Helder, The Netherlands.
Van Niekerk, L. & Turpie, J.K. (Eds.). 2012. South African National Biodiversity Assessment 2011:
Technical Report. Vol. 3. Estuary Component. CSIR Report Number
CSIR/NRE/ECOS/ER/2011/0045/B. Council for Scientific and Industrial Research,
Stellenbosch.
Ward, C. J. & Steinke, T. D. (1982). A note on the distribution and approximate areas of mangroves in
South Africa. South African Journal of Botany 1: 51-53.
Weerts, S.P. 2010. Elevation and bathymetric survey of the Port of Durban sandbanks post entrance-
widening, with a desktop assessment of potential ecological implications. CSIR Report
CSIR/NRE/CO/IR/2010/0074/C, Durban.
Weerts, S. & Cyrus, D. 2002. Occurence of young and small-sized fishes in different habitats within a
subtropical South African estuary and adjacent harbour. Marine and Freshwater Research
53: 447-456.
Whitfield, A.K. 1998. Biology and ecology of fishes in southern African estuaries. Ichthyological
Monographs of the J.L.B. Smith Institute of Ichthyology 2: pp.223.
Wright, C.I. 1996. Pilot study of surface sediment distribution within Durban Harbour. Council for
Geoscience. IR 1996-0039.
ZAA, 2012a. ZAA Engineering Projects and Naval Architecture (Pty) Ltd. Dredging turbidity and
physical impact study. Transnet Soc Ltd. Feasibility study (Fel 3) for the deepening of berths
203 to 205 Port of Durban.
ZAA, 2012b. ZAA Engineering Projects and Naval Architecture (Pty) Ltd. Assessment of alternative
design options. Transnet Soc Ltd. Feasibility study (Fel 3) for the deepening of berths 203 to
205 Port of Durban.

70
Appendix 1: Impact Rating Methodology
The significance of all potential impacts that would result from the proposed project is determined
in order to assist decision-makers. The significance rating of impacts is considered by decision-
makers, as shown below.
· INSIGNIFICANT: the potential impact is negligible and will not have an influence on the decision
regarding the proposed activity.
· VERY LOW: the potential impact is very small and should not have any meaningful influence on
the decision regarding the proposed activity.
· LOW: the potential impact may not have any meaningful influence on the decision regarding
the proposed activity.
· MEDIUM: the potential impact should influence the decision regarding the proposed activity.
· HIGH: the potential impact will affect a decision regarding the proposed activity.
· VERY HIGH: The proposed activity should only be approved under special circumstances.
The significance of an impact is defined as a combination of the consequence of the impact
occurring and the probability that the impact will occur. The significance of each identified impact2
was thus rated according to the methodology set out below:
Step 1 – Determine the consequence rating for the impact by determining the score for each of the
three criteria (A-C) listed below and then adding them. The rationale for assigning a specific rating,
and comments on the degree to which the impact may cause irreplaceable loss of resources and be
irreversible, must be included in the narrative accompanying the impact rating:
Rating Definition of Rating Score
A. Extent – the area over which the impact will be experienced
Local Confined to project or study area or part thereof (e.g. limits of
the concession area)
1
Regional The region (e.g. the whole of Namaqualand coast) 2
(Inter) national Significantly beyond Saldanha Bay and adjacent land areas 3
B. Intensity – the magnitude of the impact in relation to the sensitivity of the receiving environment, taking into
account the degree to which the impact may cause irreplaceable loss of resources
Low Site-specific and wider natural and/or social functions and processes are negligibly
altered
1
Medium Site-specific and wider natural and/or social functions and processes continue albeit in
a modified way
2
High Site-specific and wider natural and/or social functions or processes are severely altered 3
C. Duration – the time frame for which the impact will be experienced and its reversibility
Short-term Up to 2 years 1
Medium-term 2 to 15 years 2
Long-term More than 15 years (state whether impact is irreversible) 3
The combined score of these three criteria corresponds to a Consequence Rating, as follows:
Combined Score (A+B+C) 3 – 4 5 6 7 8 – 9
Consequence Rating Very low Low Medium High Very high
2 This does not apply to minor impacts which can be logically grouped into a single assessment.

71
Example 1:
Extent Intensity Duration Consequence
Regional 2
Medium 2
Long-term 3
High
7
Step 2 – Assess the probability of the impact occurring according to the following definitions:
Probability– the likelihood of the impact occurring
Improbable < 40% chance of occurring
Possible 40% - 70% chance of occurring
Probable > 70% - 90% chance of occurring
Definite > 90% chance of occurring
Example 2:
Extent Intensity Duration Consequence Probability
Regional 2
Medium 2
Long-term 3
High
7
Probable
Step 3 – Determine the overall significance of the impact as a combination of the consequence and
probability ratings, as set out below:
Probability
Improbable Possible Probable Definite
Co
nse
qu
en
ce Very Low INSIGNIFICANT INSIGNIFICANT VERY LOW VERY LOW
Low VERY LOW VERY LOW LOW LOW
Medium LOW LOW MEDIUM MEDIUM
High MEDIUM MEDIUM HIGH HIGH
Very High HIGH HIGH VERY HIGH VERY HIGH
Example 3:
Extent Intensity Duration Consequence Probability Significance
Regional 2
Medium 2
Long-term 3
High
7
Probable
HIGH
Step 4 – Note the status of the impact (i.e. will the effect of the impact be negative or positive?)
Example 4:
Extent Intensity Duration Consequence Probability Significance Status
Regional 2
Medium 2
Long-term 3
High
7
Probable
HIGH
– ve

72
Step 5 – State the level of confidence in the assessment of the impact (high, medium or low).
Depending on the data available, a higher level of confidence may be attached to the assessment of
some impacts than others. For example, if the assessment is based on extrapolated data, this may
reduce the confidence level to low, noting that further groundtruthing is required to improve this.
Example 5:
Extent Intensity Duration Consequence Probability Significance Status Confidence
Regional 2
Medium 2
Long-term 3
High
7
Probable
HIGH
– ve
High
Step 6 – Identify and describe practical mitigation and optimisation measures that can be
implemented effectively to reduce or enhance the significance of the impact. Mitigation and
optimisation measures must be described as either:
Essential: must be implemented and are non negotiable; and
Optional: must be shown to have been considered and sound reasons provided by the
proponent if not implemented.
Essential mitigation and optimisation measures must be inserted into the completed impact
assessment table. The impact should be re-assessed with mitigation, by following Steps 1-5 again to
demonstrate how the extent, intensity, duration and/or probability change after implementation of
the proposed mitigation measures.
Example 6: A completed impact assessment table
Extent Intensity Duration Consequence Probability Significance Status Confidence
Without mitigation
Regional 2
Medium 2
Long-term
3
High
7
Probable
HIGH
– ve
High
Essential mitigation measures:
xxxxx
xxxxx
With mitigation
Local 1
Low 1
Long-term
3
Low
5 Improbable VERY LOW – ve High
Step 7 – Prepare a summary table of all impact significance ratings as follows:
Impact Consequence Probability Significance Status Confidence
Impact 1: XXXX Medium Improbable LOW –ve High
With Mitigation Low Improbable VERY LOW High
Impact 2: XXXX Very Low Definite VERY LOW –ve Medium
With Mitigation:
Not applicable

73
Indicate whether the proposed development alternatives are environmentally suitable or unsuitable
in terms of the respective impacts assessed by the relevant specialist and the environmentally
preferred alternative.