Embed Size (px)
Citation preview

International Research Journal of Biological Sciences ___________________________________ ISSN 2278-3202
Vol. 4(12), 14-21, December (2015) Int. Res. J. Biological Sci.
International Science Congress Association 14
Estimation of Tropical deforestation and Prediction of Biotic pressure zone
for effective Forest management in Eastern Ghats of India
Balaguru B1*, Nagamurugan N
2, Kumaraguru A
3, Soosairaj S
4 and Brinda T
3
1Centre for Biodiversity Informatics, Department of Botany, Jamal Mohamed College, Tiruchirappalli, Tamil Nadu, 620 020, INDIA 2Department of Botany, Government Arts College, Melur, Madurai, Tamil Nadu, 625 106 INDIA
3Biodiversity Conservation Foundation, Tiruchirappalli, Tamil Nadu 620 021, INDIA 4Department of Botany, St. Joseph’s College, Tiruchirappalli, Tamil Nadu 620 002, India
Available online at: www.isca.in, www.isca.me Received 6th October 2015, revised 23rd October 2015, accepted 21st November 2015
Abstract
The tropical habitats, one of the most species rich and diversified formations on earth, face extensive loss of forest cover due
to anthropogenic pressures. Precise inventory and monitoring using remote sensing and GIS, to estimate and monitor these
anthropogenic factors is the need of the hour. This study comparatively analyses the specific forest habitats on Shervarayan
hills, Eastern ghats of Tamil Nadu India for its forest cover changes due to anthropogenic pressures that have occurred in a
decade (1999 to 2009). Buffer zones are generated for road network, villages and overlaid on vegetation type map. Based on
their significant influences, the vegetation communities that are prone (risk zones) to the anthropogenic activities are
accessed. It is reported that around 4358 ha. of dense forest and 7243 ha. of open forest area are severely degraded. While
on the other hand there is an increase of 6670 ha. of scrub area. Similarly deforestation rate is high in buffer zones
comprising roads (250 m) and foot paths (100 m) respectively. It is also reported that 7143 ha. is under low risk zone
followed by Moderate risk (421 ha.) and high risk zones (1034 ha.). The study provides us with ideal and concrete
information on deforestation and also gives inputs for better management of forest resources under anthropogenic pressure
in future.
Keywords: Tropical forests, vegetation, deforestation, impact analysis, biotic pressure, GIS, remote sensing, conservation management.
Introduction
Loss of biodiversity in the tropics and its effect on the global
climate and human lifestyles is an established fact1-3
.
Understanding and mitigating the impact of ever increasing
population and rising global economic activity in the tropical
forests are one of the great challenges currently faced by the
biologists, conservationists and policy makers4. The tropical
forests are currently disappearing at an overall rate of between
0.8 to 2.0% per year5. The loss of the natural forest and
habitat6-8
especially due to anthropogenic pressures9-11
has led to
their fragmentation12,13
in the tropical countries. The ensuing
fragmentation of the forest stands may eventually accelerate the
extinction of the local plant/animal species14,15
in the future. In
Asia and Pacific region, the human population heavily depends
on the fuel wood to meet its energy needs, and the only major
sources are the natural forests and consequently are one of the
major contributors to forest degradation16.
To avert the possible loss, the creation of protected areas is
believed to be a key strategy to combat deforestation and curtail
loss of terrestrial biodiversity17
. Even after decades of
establishment of thousands of protected areas covering millions
of hectares, there is inconsistent assessment of deforestation
rates inside and outside these protected areas. Various
conservation strategies to contain these ecological disasters have
been implemented and monitored worldwide18
to a positive
extent, yet the efficiency and success of these measures towards
wholesome protection vary and fall short of such expected
results, thus demanding a more efficient strategy/policy base,
and in some cases extending worldwide. Therefore best
alternate would be to obtain precise information about the
spatial distribution of virgin forest (area extent) stands and at the
same time assess its rate of deforestation using Geographical
Information System (GIS) .This would be followed by
estimating the impacts of habitat destruction and fragmentation
of biological diversity19-21
in the deforestation prone zones.
In India, the dense forest cover of 46.55 million hectares from
the total forest cover of 71.03 million hectares in 1972-73 has
now drastically reduced to 36.71 million hectares from the total
cover of 63.34 million hectares in 1993-9522
. It has estimated
the annual forest cover loss in India to be 2,708 km2/year
23 and
the extent of loss also includes the forest stand of the Eastern
Ghats. The forests of the Eastern Ghats having lower altitudes
(300-1700msl) than the Western Ghats are ecologically more
diverse than that on the Western Ghats, but for unknown
reasons neglected in spite of its ecological status. Comparatively
the human and livestock influences on the forest cover are more
rampart than the Western Ghats resulting in a heightened rate of

International Research Journal of Biological Sciences ________________________________________________ ISSN 2278-3202
Vol. 4(12), 14-21, December (2015) Int. Res. J. Biological Sci.
International Science Congress Association 15
deforestation. This present study analyses the extent of
deforestation and livelihood influences.
The influence of various biotic pressures exerted on the forest
cover/stand estimates the zones of biotic pressure spatially. The
study also investigates the deforestation risk prone vegetation
communities, by employing GIS tools.
Methodology
Study Area: The Shervarayan hills occupying an area of 469.9
km2, forms a part of the Eastern Ghats of Tamil Nadu and are
located in the northern part of Salem district, South India. The
hills lie between latitude 11° 43′ 00″ to 12° 00′ 00″ N and
longitudes of 78° 00′ 00″ to 78° 22′ 30″ E (figure-1). Red loamy
soil and lateritic and archaean crystalline rocks like
amphibolites, leptinites, garnetiferous granites and charnockites
are characteristic of these areas. Bauxite and Magnesite are the
chief mineral resources in the Shervarayan hills. There are 71
villages administered by Yercaud (67 villages) and Omalur (4
villages) taluks of Salem district. The hill has 49% of its area
under forest and rest of the area (51%) is build up land
(especially in the Plateau) region. The estate owners had
encroached into the adjoining virgin forests on the plateau to
make way for the coffee plantation. The rest of the plateau is
covered by agricultural fields, which are mainly owned by the
native tribal population. The remnant forest stands i.e. on the
outer slopes and the fragmented pockets on the plateau are
protected (Reserved Forests i.e. RFs) by the Indian Government
and administrated by Salem Forest Division.
Analysis of Forest type/Density and forest cover changes:
For assessing the changes in the forest cover, IRS 1C, P6 FCC
digital data of 1999 and 2009 were used respectively. Optimum
care was taken to have a common area on the resulting data set.
The IRS LISS III digital data was geometrically corrected using
GCP (Ground Control Points) collected from the SOI (Survey of
India) topomaps and GPS (Global Positioning System) readings
collected from the field and further, the images were
radiometrically enhanced using histogram equalization tool,
available in ERDAS imagine 8.5 software. The rectified and
enhanced digital data were interpreted for forest cover type and
crown density (>40% dense, 10-40% open, <10% scrub). The
classification was done based on onscreen visual interpretation
of the False Color Composites (FCC) displayed on the computer
screen at the scale of 1:50,000 for forest crown density24
. The
reserved forest boundaries are extracted/digitized from the
topomaps and drafted on the displayed FCC.
Figure-1
Study area location Map – Shervarayan Hills

International Research Journal of Biological Sciences ________________________________________________ ISSN 2278-3202
Vol. 4(12), 14-21, December (2015) Int. Res. J. Biological Sci.
International Science Congress Association 16
The forest cover maps pertaining to the years 1999 and 2009
were crosschecked for any eventual spatial boundary errors and
promptly rectified. The uniformity in attribute classes was
maintained to ensure accuracy i.e. to minimize any probable
factors of error if any. Later, these 2009 forest density maps
were overlaid on forest density map of 1999 and the resulting
forest cover changes were demarcated based on the respective
forest classes. These changes thus identified were assigned the
forest classes as for 2009 and the final forest cover changes
extracted to produce a new map.
Impact of Anthropogenic pressures on forest cover change:
The area of road network (metalled, unmetalled and footpath)
and villages were extracted from the SOI maps to generate
village and road network buffer zones which were used to
analyze the influence of biotic pressure on the surrounding
forest cover i.e. to determine the likelihood impact of the
proximity of roads, villages on the adjacent natural forest and
the changes they inducted to the forest cover. Buffer zones and
quantification of the forest cover changes were carried out using
ERDAS imagine 8.5 software, which manage both raster and
vector data. The buffering was designed based on potential
approaches to the adjacent forest stands i.e road networks, foot
path or village area. Likewise roads have many footpaths on
their fringes transversing into the forest up to 1000m. These
footpaths normally connect a hill village to the foothills and are
extensively used for transportation of agricultural goods by the
hill tribes as they are short cuts whereas the roads are circuitous.
The major footpaths have many crisscrossing branches
interconnected on the entire hill stretch hence; the study restricts
itself to a buffer of 200m on such major paths. Nevertheless the
complex network of footpaths (generally) gives a picture of
potential vulnerability of the forest cover owing to
anthropogenic pressures. Initially a data layer with buffer zones
of 250, 500, 750 and 1000 m were generated running parallel to
road network (metalled and unmetalled). Secondly, another data
layer was generated which consisted of the buffer zones (100m
and 200m) on the surrounding footpaths arising from the road
network. Finally, third data layers comprising the buffer zones
(500, 1000 and 1500 m) around village boundaries were
demarcated for these data layers to quantify the forest cover
changes for each buffer zone.
Vegetation communities Assessment: Vegetation type map
(1999) of the Shervaryan hills25
is used which covers nearly half
of the hill area i.e. 49.50% (ca 23261 ha.) under the category of
reserved forests comprising about six major forest types i.e.
evergreen, semi-evergreen, riparian, dry mixed deciduous,
southern thorn scrub and evergreen scrub (figure-2). This is
followed by villages with 17917 ha. (38%) and forest plantation
with 5813 ha. (12%).
The importance of the vegetation types is weighed and
classified, based on the influence of the biotic regimes. The
vegetation types, which are affected by the roads, villages and
footpaths, were identified by superimposition of the respective
vegetation maps and the vegetation classes were regrouped
according to their weight classes. Overlaying of these maps on
one another yielded deforestation ranges i.e., probable high,
moderate and low risk areas, which were later cross checked by
ground truthing for accuracy assessment.
Results and Discussion
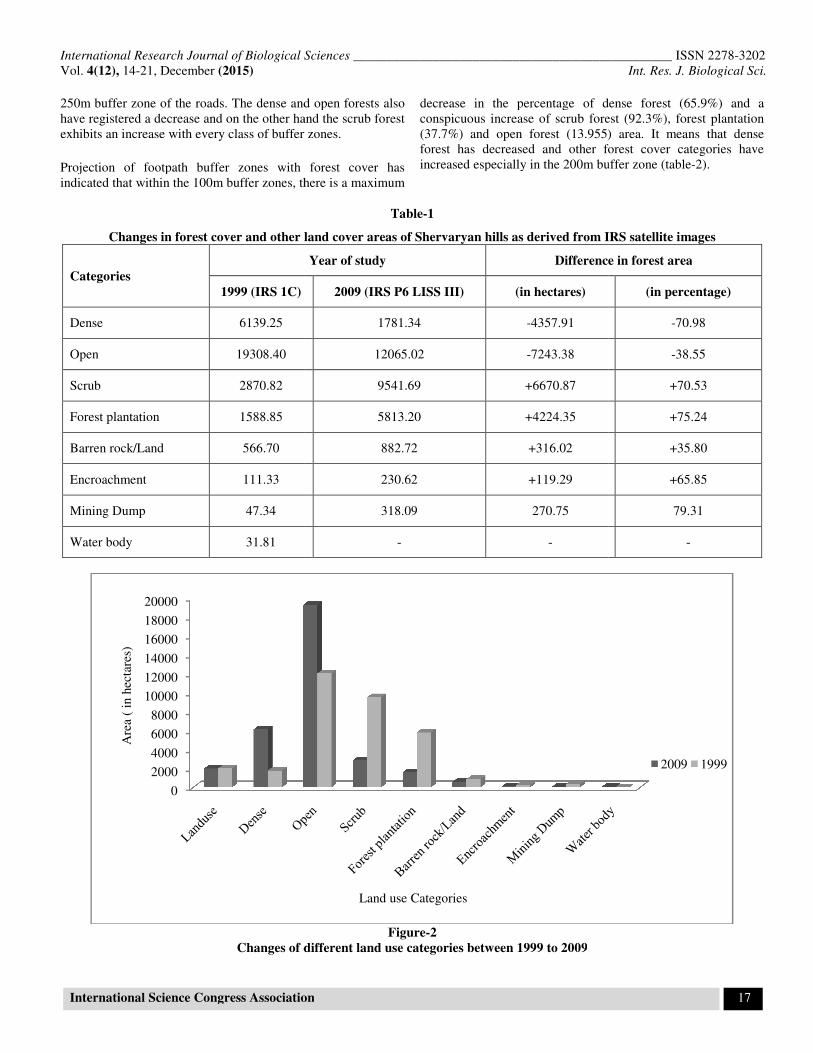
Forest density and land cover change: There were 103
polygons (1999) initially drafted using IRS 1C LISS III, which
eventually increased to 125 polygons (2009) while
juxtapositioning with IRS P6 LISS III data. It is a clear
indication of increased forest fragmentation in the respective
classes. Based on the percentage of the crown cover, categories
such as dense, open, scrub and forest plantation were delineated
along with the themes like villages, barren rock/land,
encroachment and water bodies. Dramatic negative changes are
observed in dense and open forest area (figure-3, table-1). The
dense forest cover shows a loss of 70.98%, predictably the open
forest too depicts the same trend with a loss of 38.55%. The area
under scrub forest has summarily expanded to 70.53%. This
trend reflects the ensuing loss in deciduous forest covers, and
the eventual gain in the scrub forest cover. This is an indication
of severe degradation of the hilly terrain over the decades (20
years in the case). Added to this factor, there has been a steady
encroachment into the forest which amount to 65.85% (119.29
ha.), an illegal encroachments of the coffee estates into the
adjacent forest land. The area classified as barren land has also
increased by 35.8% (316.20ha.).
To arrest the trends of deforestation, the forest department has
tried to reduce the loss by introducing effective strategies with
plantations. As a result, there is an addition of 4224.35 ha.
(70.24%) to the pre-existing plantations. An area of water body
as seen in 1999, which had been used for irrigation, has now
been covered with forest plantation (2009), which could be
attributed to the eventual drying up of the water source over the
years. The forest conversion factor has to a great extent affected
the local ecology as mentioned above. Around 4356 ha. of dense
forests have been converted into open forest and of which 48 ha.
has been encroached upon by the surrounding coffee estates.
The dense forest has also been converted to scrub forest
(161.45ha.) due to indiscriminate felling of trees and thus
claimed by the fast intruding scrublands. In some areas, open
forest too is further degraded by the invasive species such as
Lantana camera, Eupatorium divergens (20 ha.). Yet there is a
small positive change ie. an increase in the open forest area due
to the forest plantation (3824 ha. which includes 487 ha. of the
scrub forest). However it is also noticed that open forest areas
also include the sun exposed lands (ca.316ha.) due to severe soil
erosion.
Impact analysis- Road network buffer on forest cover: The
major road network buffer zone data layer, which is overlaid on
the forest cover map, depicts areas of dense and open forests.
They show a decline of 61.1% and 67% respectively within
International Research Journal of Biological Sciences _
Vol. 4(12), 14-21, December (2015)
International Science Congress Association
250m buffer zone of the roads. The dense and open forests also
have registered a decrease and on the other hand the scrub forest
exhibits an increase with every class of buffer zones.
Projection of footpath buffer zones with forest cover has
indicated that within the 100m buffer zones, there is a maximum
Changes in forest cover and other land cover areas of Shervaryan hills as derived from IRS satellite images
Categories
1999 (IRS 1C)
Dense 6139.25
Open 19308.40
Scrub 2870.82
Forest plantation 1588.85
Barren rock/Land 566.70
Encroachment 111.33
Mining Dump 47.34
Water body 31.81
Changes of different land use categories between 1999 to 2009
0
2000
4000
6000
8000
10000
12000
14000
16000
18000
20000
Are
a (
in h
ecta
res)
Sciences ________________________________________________
International Science Congress Association
250m buffer zone of the roads. The dense and open forests also
e and on the other hand the scrub forest
exhibits an increase with every class of buffer zones.
Projection of footpath buffer zones with forest cover has
indicated that within the 100m buffer zones, there is a maximum
decrease in the percentage of dense
conspicuous increase of scrub forest (92.3%), forest plantation
(37.7%) and open forest (13.955) area. It means that dense
forest has decreased and other forest cover categories have
increased especially in the 200m buffer zone (table
Table-1
Changes in forest cover and other land cover areas of Shervaryan hills as derived from IRS satellite images
Year of study Difference in forest area
2009 (IRS P6 LISS III) (in hectares)
1781.34 -4357.91
12065.02 -7243.38
9541.69 +6670.87
5813.20 +4224.35
882.72 +316.02
230.62 +119.29
318.09 270.75
- -
Figure-2
Changes of different land use categories between 1999 to 2009
Land use Categories
____________ ISSN 2278-3202
Int. Res. J. Biological Sci.
17
decrease in the percentage of dense forest (65.9%) and a
conspicuous increase of scrub forest (92.3%), forest plantation
(37.7%) and open forest (13.955) area. It means that dense
forest has decreased and other forest cover categories have
increased especially in the 200m buffer zone (table-2).
Changes in forest cover and other land cover areas of Shervaryan hills as derived from IRS satellite images
Difference in forest area
(in percentage)
-70.98
-38.55
+70.53
+75.24
+35.80
+65.85
79.31
-
2009 1999

International Research Journal of Biological Sciences ________________________________________________ ISSN 2278-3202
Vol. 4(12), 14-21, December (2015) Int. Res. J. Biological Sci.
International Science Congress Association 18
Impact analysis-Village buffer on forest cover: Coincident
data were generated to correlate the changes in forest cover in
Shervarayan hills pertaining to the buffer zones of villages
(including the coffee estates). The area of forest cover loss has
increased in 1500m buffer zone (75.27%) and decreased in
1000m (64.06%) and 500m (56.88%) buffers respectively
(table-3 and 4). In contrast, scrub and forest plantations have
shown an increase in all the buffer categories. Reforestation
efforts by the forest dwellers i.e., the tribal villagers have added
significantly to the spread of manmade forest cover, which is a
positive approach and can be effectively and encouragingly
emulated to the remaining scrub lands in future. As discussed
before there remains the instance of rampart encroachment,
which falls under the 500m buffer zone, is a problem needing
intervention by the government. In general, much of the dense
forest has been degraded and converted into open forest and
extending even into the scrub lands. This invariably point out
the only known reason i.e., an easy access created by network of
roads and other pathways.
Table-2
Influence of villages on forest cover changes
Forest
cover/
year
Area by buffer zone (in hectares)
500 m 750 m 1500 m
1999 2009 Changes in% 1999 2009 Changes
in% 1999 2009
Changes
in%
Dense 2194.86 946.33 -56.88 1837.00 660.03 -64.07 707.76 174.97 -75.28
Open 3260.48 3721.72 +12.93 4151.15 3666.06 -11.68 2974.20 1526.86 +48.66
Scrub 47.71 461.24 +89.65 190.86 1017.91 +81.25 278.33 1383.72 +79.88
Forest
plantation 182.90 556.67 +67.14 254.48 1089.48 +75.65 222.67 1097.43 +79.91
Table-3
Influence of roads on forest cover changes
Forest
cover/year
Area by road buffer zone (in hectares)
250 m 500 m 750 m 1000 m
1999 2009 *C in
% 1999 2009 C in% 1999 2009 C in% 1999 2009 C in%
Dense 429.43 167.0 -61.11 381.71 174.95 -54.16 310.14 191.06 -38.39 349.91 246.53 -29.54
Open 1288.29 413.52 -67.91 898.62 373.76 -58.41 707.76 373.76 -47.19 874.76 469.19 -46.36
Scrub 71.57 477.14 +85 71.57 198.81 +64 95.429 79.52 -16.67 127.24 119.29 -6.21
Forest
plantation 230.62 962.24 +76.03 151.09 755.48 +79.96 127.44 596.43 +78.63 103.38 620.29 +83.26
* C = Changes in percentage
Table-4
Influence of footpath on forest cover changes
Forest cover
Area by buffer zone (in hectares)
100 m 200 m
1999 2009 % of changes 1999 2009 % of changes
Dense 461.2390 157.0960 - 65.94 214.715 63.6192 - 70.37
Open 493.0490 572.5730 + 13.88 182.358 254.477 + 28.34
Scrub 15.9048 206.7620 + 92.37 16.452 79.509 + 79.30
Forest plantation 55.6668 89.4288 + 37.75 7.952 23.872 + 66.69

International Research Journal of Biological Sciences ________________________________________________ ISSN 2278-3202
Vol. 4(12), 14-21, December (2015) Int. Res. J. Biological Sci.
International Science Congress Association 19
Figure-3
Forest Cover Changes over a period
Deforestation critical risk zones: The analysis of the
anthropogenic pressure exerted on forest types shows that an
area of about 1033.81 ha. of the vegetation communities have
high risk of potential degradation, 421.477 ha. of moderate risk
and 7143 ha. with low risk (figure-4). Having defined features at
risk and perhaps the causes of these circumstances, our attention
turns to using this information to formulate new strategies for
protection of these reserved forests. Identification of potential
deforestation risk zones will help in their protection from
occurrences of further degradation. A distinction must be drawn
between threat and priority, for conservation action and priority
setting, which may embrace oth er factors in addition to threat.
There is a need for some balance to be stuck between strategies
for preventing those features which are apparently more secure
at present from becoming less so 26.

International Research Journal of Biological Sciences ________________________________________________ ISSN 2278-3202
Vol. 4(12), 14-21, December (2015) Int. Res. J. Biological Sci.
International Science Congress Association 20
Figure-4
Vegetation Community Risk Zone
Conclusion
The present study is in confirmation to the fact that the forest
cover is getting depleted at alarming rate, endangering the
habitat because of severe human exploits. The government
sponsored forest plantation has been successful to some extent
in restoring the green cover in some of the degraded area on the
fringes of the Shervarayan hills. Still most of the forest sites are
constantly under threat from severe human pressure and are
degrading alarmingly endangering the habitat and ecosystem as
a whole. Humans have effected great negative changes in the
distribution and composition of plant communities and also
have contributed to the altered habitat types. Road network
opens timber extraction routes and causes further deforestation.
The forests vulnerable to human exploitation provides the base
information for developing new strategies for sustainability and
conservation. Conservation of forest from further degradation
should advocate an alternate approach to protected area
management that would integrate forest conservation with social
development. Deforestation has to be discouraged by
formulating tribal security and people oriented joint
management schemes. One such sustainable approach; Agro
forestry has the potentialities to solve specific land-use
problems and sustain the people with fuel and fodder
requirements. Moreover, agroforestry is more suited to poor
farmers, who have fewer or no prospects of adopting high cost
technologies. The systematic plantation, exclusively for raising
high density, short rotation fuel wood or energy plantation can

International Research Journal of Biological Sciences ________________________________________________ ISSN 2278-3202
Vol. 4(12), 14-21, December (2015) Int. Res. J. Biological Sci.
International Science Congress Association 21
be a viable strategy to reduce the anthropogenic pressure on the
natural forests. Thus by adopting this approach, both the forest
and the community dependent on the forests are effectively
benefited.
References
1. Hamilton A.C., Deforestation in Uganda Nairobi, Kenya;
The African Wildlife Society, Oxford university press
(1984)
2. WhitmoreT.C. and Sayer J.A., Tropical deforestation and
species extinction, Switzerland’s, Chapman and Hall,
world conservation Union, Gland and London (1992)
3. Fearnside P.M., Saving tropical forests as a global
warming countermeasure: An issue that divides the
environmental movement, Ecological Economics, 39(2),
167-184 (2001)
4. Wright J.S., Tropical forests in a changing environment,
Trends in Ecology and Evolution 20(10), 553-560 (2005)
5. May R.M, Stumpf M.P.H., Species area relations in
tropical forests, Science, 290, 2084-2086 (2000)
6. Freedom B., Environmental ecology; the impacts of
pollution and other stresses on ecosystem structure and
function, Academic press, San Diego (1989)
7. Pimm S.L. and Gilpin M.E., Theoretical issues in
conservation biology In perspectives in ecological theory
eds. Roughgarden J., May. R.M., Levin, S.A., 287-305,
Princeton University Press, Princeton (1989)
8. Parrotta J.A. and Knowles O.H., Restoring tropical
forests on land mined for bauxite examples for the
Brazilian Amazon, Ecological Engineering, 17(2-3),
219-239 (2001)
9. Brown R.I., State of the world 1985. A world Watch
Institute reports on progress toward a sustainable society.
WW. Norton, New York, USA., (1984)
10. Wilson E.O., (ed) Biodiversity, National Academy Press,
Washington, DC (1988)
11. Salami A.T., Vegetation modification and man-induced
environmental change in rural southwestern Nigeria,
Agriculture, Ecosystems and Environment ,70 (2-3),159-
167 (1998)
12. Turner I.M. and Corlett R.T., The conservation value of
small, isolated fragments of lowland tropical rain forest,
Trends in Ecology and Evolution, 11(8), 330-333 (1996)
13. Pant D.N., Roy P.S., Semwal D.P. and Nalthani V.,
Impact of coal mining on land cover using remote
sensing techniques. A case study in part of Jaintia hills,
Meghalaya, 317-323, In: Proceedings of ISRS National
Symposium on Remote Sensing Applications for Natural
Resources Retrospective and Perspective, Bangalore
(1999)
14. Lovejoy T.E., Species leave the ark one by one in the
preservation of species. In. Norton, B.G ed., 13-37,
Princeton University Press, Princeton (1986)
15. Vermeij G.J., The biology of human cased extinction, in
the preservation of species, Norgon, B.G, ed., 28-49,
Princeton University Press, Princeton (1986)
16. Global Environment outlook (GEO), Past, present and
future perspectives. UNEP and Earth scan Publication
Ltd. London, UK and sterling VA,USA (2002)
17. Hunter J.R., Is Costa Rica truly conservation-minded?
Conservation Biology, 8, 592-595 (1994)
18. Fuller O.D. and Chowdhury R.R., Monitoring and
modeling tropical deforestation: Introduction to the
special issue, Singapore Journal of Tropical Geography,
27, 1-3 (2006)
19. Harris L.D., The fragmented forest; Island Biogeography
theory and the preservation of biotic diversity, University
of Chicago press, Chicago (1984)
20. Laurance W.F., Ferreira L.V., Rankin-de Merona J.M.
and Laurance S.G., Rainforest fragmentation and the
dynamics of Amazonian tree communities, Ecology, 79,
2032-2040 (1998)
21. Chirello A.G., Effects of fragmentation of the Atlantic
forest on mammal communities in South-Eastern Brazil,
Biological Conservation, 89, 71-82 (1999)
22. Ranganath B.K., Roy P.S., Dutt C.B.S. and Diwakar
P.G., Use of Modern Technologies and Information
Systems for Sustainable Forest Management, Status
report, ISRO, DOS, Bangalore, India (2000)
23. Hartshom G.S., Tropical forests, In: Encyclopedia of
Biodiversity, Simon Asher Levin (ed.), 701-710,
Academic Press, California (2001)
24. Integrated Mission for Sustainable Development (IMSD),
Technical Guidelines, National Remote Sensing Agency,
Hyderabad, India (1995)
25. Balaguru B., John Britto S., Nagamurugan N, Soosairaj
S., Natarajan D., Ravipaul S. and Arockiasamy D.I.,
Vegetation mapping and its slope characteristics in a hill
ecosystem- A case study from Shervarayan hills, Eastern
Ghats using Remote Sensing and GIS, Current Science,
85(5), 656-653 (2003)
26. Gaston K.J., Pressey R.L. and Margules C.R..,
Persistence and vulnerability: retaining biodiversity in
the landscape and in protected areas, J. Biosci., 27, 361-
384 (2002)