Embed Size (px)
Citation preview

Estimation of the ion acceleration from Ganymede polar region by
the Galileo spacecraft observation
ガリレオ探査機の観測に基づく
ガニメデ極域のイオン加速の推定
1
Symposium on Planetary Science 2014/02/20
Shinya Watanabe1, Yuto Katoh1, Atsushi Kumamoto1, Takayuki Ono1
1 Department of Geophysics, Graduate School of Science, Tohoku University
No. 5

1. Introduction
• Ganymede : The only moon that has the intrinsic magnetic field.
Ganymede is always located in the big Jovian magnetosphere. → It creates mini-magnetosphere.
Fig.1. Schema of relationship of Jupiter – Ganymede. [Johnson, 2004] 2
The orbital radius 14.97 RJ
The orbital period (= The rotation period )
7.15 days
Radius 2631 km ( = 1RG)
Jupiter
Ganymede
Corotational plasma flow

Ganymede’s magnetosphere
• Jupiter … north to south Ganymede … south to north
•MHD simulation of Ganymede’s magnetosphere which indicates size and figure.
•
– Jovian field line (Jupiter - Jupiter)
– Open field line (Jupiter - Ganymede) (high latitude)
– Closed field line (Ganymede - Ganymede) (low latitude)
The plasma environment is expected to be different in each region.
3
2RG
Fig.2. MHD simulation of Ganymede’s magnetosphere. [Jia et al., 2009]
Definition of the coordinates

Ion outflow from Ganymede
4
Ganymede encounter
Jovian plasma sheet
PLS(Plasma Subsystem) measurements
Maxwellian fits
➯ The cold plasma are H+ flowing outward.
density : 100 cm-3, speed : 50 km/s
➯ An alternative analysis as an outflow ions are O+.
density : 200 cm-3, speed : 18 km/s
The outflowing cold ions are most reasonably identified as O+.
The process of this ion outflow is still unknown. Fig.3. G02 PLS observation [Frank et al., 1997]
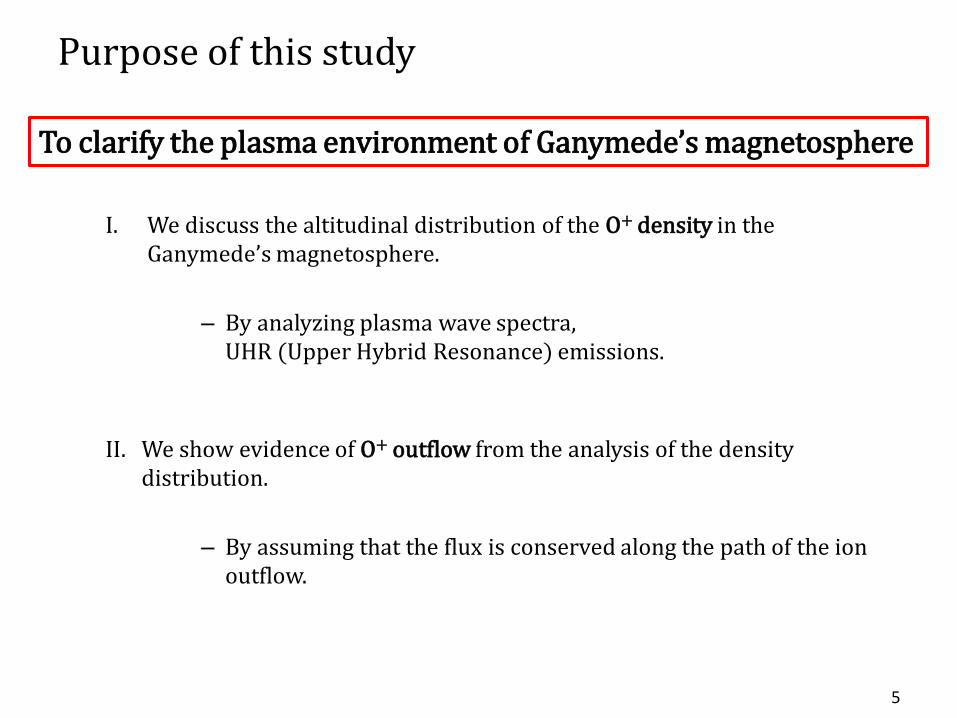
Purpose of this study
I. We discuss the altitudinal distribution of the O+ density in the Ganymede’s magnetosphere.
– By analyzing plasma wave spectra, UHR (Upper Hybrid Resonance) emissions.
II. We show evidence of O+ outflow from the analysis of the density distribution.
– By assuming that the flux is conserved along the path of the ion outflow.
5
To clarify the plasma environment of Ganymede’s magnetosphere

2. Instruments •
– PWS (Plasma Wave Subsystem)
• Frequency range
Electric field … 5.62 Hz ~ 5.65 MHz Magnetic field … 5.62 HZ ~ 160 kHz (cf. fce is 5kHz ~ 20 kHz near Ganymede)
• Time resolution … 18.67 sec
•
6
Fig.4. Galileo spacecraft [Gurnett et al., 1992]
G01 1996/06/27 06:29:07 838 (6, -79, -79)
G02 1996/09/06 18:59:34 264 (17, -73, -85)
G07 1997/04/05 07:09:58 3105 (-3, 84, -76)
G08 1997/05/07 15:56:09 1606 (-11, 11, -77)
G28 2000/05/20 10:10:10 900 (-7, 78, -76)
G29 2000/12/28 08:25:30 2320 (-9, -83, -79)
Table 1. Information of Galileo’s encounters with Ganymede. [Kivelson, Khurana and Volwerk, 2002]
We analyzed 4 encounters (G01, G02, G07, G29) because the spectra are clear enough to analyze.

fce
3. Analysis
•
fUHR … identified from the spectra
fce … computed from the magnetic
field strength
•
7
[cm-3]
[Hz] [V2/m2・Hz]
CA
Fig. 5. (upper) Electric field’s frequency–time spectrogram of G01 orbit. (lower) Zoomed spectrogram of the upper figure with plot of each frequencies. (red … fUHR, black … fpe, orange … fz-cutoff)
fpe
ne
[Hz] [V2/m2・Hz]
𝑓𝑈𝐻𝑅2 = 𝑓𝑐𝑒
2 + 𝑓𝑝𝑒2
𝑛𝑒 =4𝜋2𝑚𝑒𝜀0
𝑒2𝑓𝑝𝑒
2
𝑓𝑧, 𝑐𝑢𝑡𝑜𝑓𝑓 = −𝑓𝑐𝑒
2+
𝑓𝑐𝑒
2
2
+ 𝑓𝑝𝑒2
fUHR, fce
CA
G01 and G02 have been analyzed by Gurnett et al [1996].

8
2RG
Fig. 7. (left) Galileo spacecraft’s orbit. (right) MHD simulation of Ganymede magnetosphere. [Jia et al., 2009]
Fig. 6. The electron density as a function of the radial distance. (I RG = 2631 km)
G01 G02 G07 G29
Red Blue Orange Pink
All orbits are downstream open field line region.
Electron density profile
What physical mechanism determines this density profile?
Flow
Flow
⦿Flow

4. Discussion
[e.g. Ogawa et al., 2009]
They have presented ions upflow in the Earth’s topside polar ionosphere.
The total flux seemed to be conserved. (Fig.)
ni r S r v r = const. (1)
ni : ion density S : cross section of the flux v : outflow speed r : distance from the planet
It is expected that the Ganymede’s polar ion outflow flux seemed to be conserved as the case of the Earth.
We discuss the O+ outflow from this analogy and density distribution.
(electron density ≃ O+ density)
9
Flux conservation
Fig. 8. Blue line is the O+ upward number flux. Thick dashed line is constant flux Thin dashed line is the constant flux line from outside the cusp.

Flux conservation
1. fitting of density distribution by non-linear least-squares method. (Fig. 9.)
2. setting of the cross section
3. setting of the const. of Eq. (1) ni RG S RG v RG = const.
4. velocity variation : v r =const.
ni r S r
5. energy variation : E(r) = mv(r)2/2 10
surface density background density (asymptote of the curve)
output
ni r = A ×RG
B
rB+ 5
ni r = 285 ×RG
5.98
r5.98+ 5 (2)
S ∝ r2 … radial diffusion S ∝ r3 … conservation of magnetic flux density
v(RG) : thermal velocity of O+ ionization energy (8914 m/s - 13.6 eV [Schunk and Nugy]) S(RG) = 1/ v(RG) ⇔ S(RG) × v(RG) = 1 n(RG) : substitute r = RG into Eq. (2)
fitting
285
5
Fig.9. Ion density fitting result. Black line indicate the Eq. (2).
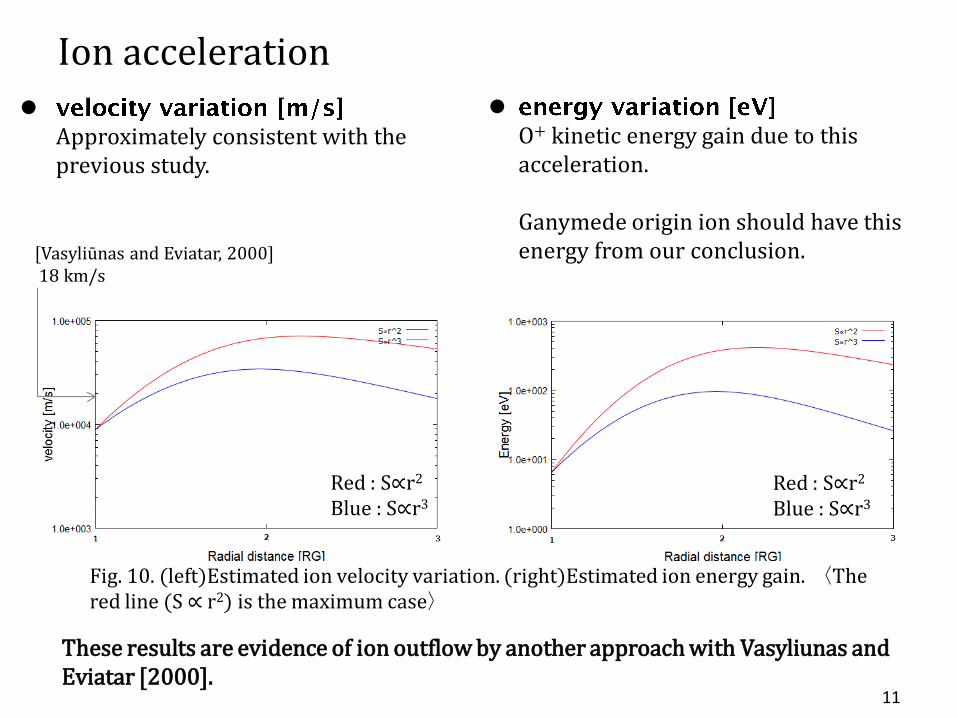
Ion acceleration
Approximately consistent with the previous study.
11
O+ kinetic energy gain due to this acceleration. Ganymede origin ion should have this energy from our conclusion.
Red : S∝r2
Blue : S∝r3
These results are evidence of ion outflow by another approach with Vasyliunas and Eviatar [2000].
[Vasyliūnas and Eviatar, 2000] 18 km/s
Red : S∝r2
Blue : S∝r3
Fig. 10. (left)Estimated ion velocity variation. (right)Estimated ion energy gain. 〈The red line (S ∝ r2) is the maximum case〉

5. Conclusion and Summary I. We have analyzed plasma density distribution.
plasma wave spectra → UHR frequency → electron density (electron density ≃ O+ density) We have analyzed four Ganymede encounters including those on orbits G01 and G02 which have been analyzed in the previous study.
II. We have shown the evidence of ion outflow under the assumption that the flux is conserved along the path of the ion outflow. This result is consistent with the previous study which suggested the outflow O+ velocity is 18 km/s from observations of the Galileo PLS instrument [Vasyliūnas and Eviatar, 2000]
We think the most reasonable process is centrifugal acceleration.
12
What physical mechanism determine this density profile?
What physical process make O+ accelerate?

Future work Test particle simulation about centrifugal acceleration.
Because of smaller radii at such as Ganymede and Mercury, these effects are more pronounced than at Earth. We are developing the simulation code so as to discuss the outflow process quantitatively.
𝑑𝒗||
𝑑𝑡= 𝒗𝐸 ∙
𝜕𝒃
𝜕𝑡+ 𝑣||
𝜕𝒃
𝜕𝑠+ 𝒗𝐸 ∙ 𝜵𝒃 −
𝜇
𝑚
𝜕𝐵
𝜕𝑠
Other candidate mechanisms which cause this acceleration have to be considered.
other possibilities
• dragged by escaping photoelectrons [Khazanov et al., 1997]
• perpendicular heating through wave-particle interactions [Lundin et al., 1990] etc.
13
curvature of E×B drift path curvature of B
Fig. 11. Model ion (Na+) trajectory and the acceleration variations at Mercury. [Delcourt et al., 2002]

References
– Delcourt D. C. et al., ‘Centrifugal acceleration of ions near Mercury’ Geophys. Res. Let., vol. 29, No. 12, 2002
– Frank et al., ‘Outflow of hydrogen ions from Ganymede’ Geophys. Res. Let., vol. 24, No. 17, Pages 2151 – 2154, 1997
– Gurnett D. A. et al., ‘The Galileo plasma wave investigation’ Space Sci. Rev. 60:341-355, 1992
– Gurnett et al., ‘Evidence for a magnetosphere at Ganymede from plasma-wave observations by the Galileo spacecraft’ Let. to Nature, vol. 384, 1996
– Jia X. et al. 'Properties of Ganymede’s magnetosphere inferred from improved three-dimensional MHD simulations‘ J. Geophys. Res., vol. 114, A09209, doi:10.1029/2009JA014375, 2009
– Johnson T. V. ‘A look at the Galilean satellites after the Galileo mission’ American Institute of Physics, S-0031-9228-0404-060-8, 2004
– Kivelson M.G., Khurana K. K. and Volwerk M, ‘The permanent and Inductive Magnetic Moments of Ganymede’ Icarus 157, 507 – 522 (2002), doi:10.1006/icar.2002.6834
– Ogawa et al., ‘On the source of the polar wind in the polar topside ionosphere: First results from the EISCAT Svalbard radar’ Geophys. Res. Let., vol. 36, doi: 10.1029/2009GL041501, 2009
– Schunk R. W. and Nagy A. F., ‘Ionospheres - Physics, Plasma Physics, and Chemistry’ Cambridge Atmospheric and Space Science Series, 2000
– Vasyliūnas and Eviatar ‘Outflow of ions from Ganymede: A reinterpretation’ Geophys. Res. Let. vol. 27, No. 9, Pages 1347 – 1349, 2000
14

References
– Delcourt D. C. et al., ‘Centrifugal acceleration of ions near Mercury’ Geophys. Res. Let., vol. 29, No. 12, 2002
– Eviatar A. et al., ‘The ionosphere of Ganymede’ Planetary and Space Science, 49, 2001, 327-336
– Gurnett D. A. et al., ‘The Galileo plasma wave investigation’ Space Sci. Rev. 60:341-355, 1992
– Jia X. et al. 'Properties of Ganymede’s magnetosphere inferred from improved three-dimensional MHD simulations‘ J. Geophys. Res., vol. 114, A09209, doi:10.1029/2009JA014375, 2009
– Johnson T. V. ‘A look at the Galilean satellites after the Galileo mission’ American Institute of Physics, S-0031-9228-0404-060-8, 2004
– Kivelson M.G., Khurana K. K. and Volwerk M, ‘The permanent and Inductive Magnetic Moments of Ganymede’ Icarus 157, 507 – 522 (2002), doi:10.1006/icar.2002.6834
– Luhman J. G. and Friesen L. M., ‘a simple model of the magnetosphere’ J. Geophys. Res., vol. 84, No. A8, 1979
– Northrop T. G., ‘The guiding center approxiamtion to charged particle motion’ Annals of Physics, 15 : 79-101, 1961
– Northrop T. G., ‘Adiabatic charged-particle motion’ Reviews of Geophysics, vol. 1, No.3 ,1963
– Schunk R. W. and Nagy A. F., ‘Ionospheres - Physics, Plasma Physics, and Chemistry’ Cambridge Atmospheric and Space Science Series, 2000
– Tsyganenko N. A., ‘A magnetospheric magnetic field model with a warped tail current sheet’ Planet. Space Sci., vol. 37, No. 1, pp. 5-20, 1989
– Volland H., ‘A model of the magnetospheric electric convection field’ J. Geophys. Res., vol. 83, No. A6, 1978
15


![[Solar System] the Dancing Girl of Ganymede - Leigh Brackett](https://img.dokumen.tips/doc/110x75/55cf94d9550346f57ba4d4db/solar-system-the-dancing-girl-of-ganymede-leigh-brackett.jpg)


