Embed Size (px)
Citation preview

ESTIMATION OF SUPERPLASTICIZER DOSAGE TO
ACHIEVE DESIRED WORKABILITY OF CEMENT
MORTAR
A Synopsis submitted to Gujarat Technological University
in
Civil Engineering
by
Parth Kirtikumar Thaker
Enrollment No.: 119997106011
under supervision of
Dr. Narendra K. Arora
GUJARAT TECHNOLOGICAL UNIVERSITY
AHMEDABAD

Table of Contents 1. Title of research work ........................................................................................................................... 3
2. Abstract ................................................................................................................................................. 3
3. Brief description on the state of art of research topic ......................................................................... 4
3.1. Literature review related tothe flow characteristic of cement paste and mortar ....................... 4
3.2. Literature review related to aggregate shape characteristicsassessment techniques ................. 6
3.3. Literature review summary ........................................................................................................... 7
3.4. Research questions ....................................................................................................................... 7
4. Objectiveand scope of research work .................................................................................................. 7
5. Research Methodology ......................................................................................................................... 8
5.1. Phase I Characterization of aggregate grading, shape and size .................................................... 8
5.2. Phase II Selection of superplasticizer i.e. Compatibility study .................................................... 10
5.2.1. Marsh cone test for cement paste ...................................................................................... 10
5.2.2. Mini slump test for cement paste ....................................................................................... 10
5.3. Phase-III Cement mortar workability study ................................................................................ 10
5.4. Phase IVStatistical analysis of test results .................................................................................. 11
5.5. Phase VPrediction model for superplasticizer dosage to obtain desired workability ................ 12
6. Experimental programme ................................................................................................................... 12
6.1. Surface area measurement by digital image analysis (DIA) ........................................................ 12
6.2. Compatibility and workability measurement study .................................................................... 12
7. Brief results ......................................................................................................................................... 14
8. Achievements with respect to objectives ........................................................................................... 18
9. Conclusions ......................................................................................................................................... 18
10. Future scope ................................................................................................................................... 19
11. References ...................................................................................................................................... 19
12. Publications ..................................................................................................................................... 21
Annexure-I ................................................................................................................................................... 22
2

1. Title of research work “Estimation of superplasticizer dosage to achieve desired workability of cement mortar”
2. Abstract In recent years, construction industry has changed significantly and demand for greater
speed of construction has arisen. At present, concrete is not just a material which comprises of
cement, water, and aggregate, most concrete also incorporates chemical or mineral admixtures.
Concrete properties in fresh state particularly workability; is very much dependent on fresh
properties of cement paste phase and mortar phase therefore significant research efforts are put in
to understand fresh properties of cement paste and mortar. A complete understanding of mortar
or concrete workability, therefore, must include a thorough understanding of the cement paste
that holds and binds the fine aggregate, and mortar that holds the coarse aggregate.
Workability of cement mortar and dosage of superplasticizer are affected by various
parameters such as water cement ratio, grading of fine aggregate, shape of aggregate, surface
characteristic, and volume of aggregate. Therefore,to resolve the problems encountered in
development of desired workable mortar, it is necessary to estimate dosage of
superplasticizer.Estimation of superplasticizer dosage for desired workability can result in time
saving, efforts and materials for testing, and overall human efforts in conducting trials.
A variation in the characteristic of cement and type and dosage of superplasticizer creates
compatibility issues.Marsh cone test and mini slump test are performed to study the behavior of
superplasticizedcement paste.
In this research, an experimental investigation methodology is designed to study the
effect of water cement ratio, dosage of superplasticizer, and characteristics of fine aggregate on
flow behavior of cement mortar.
For each water cement ratio, optimum dosage of superplasticizer (ODS) has found
out.Six different dosages of superplasticizer were taken to study the effect of superplasticizer on
cement mortar workability i.e. 0% ODS (without superplasticizer), 0.25% ODS, 0.50% ODS,
0.75% ODS, 1.0% ODS, 1.25% ODS.
To study the effect of fine aggregate characteristics on flow behaviour of cement mortar
five different fractions of fine aggregate (4.75mm to 2.36mm, 2.36mm to 1.18mm, 1.18mm to
0.60mm, 0.60mm to 0.30mm and 0.30mm to 0.15mm) and four different zones of fine
3
aggregate(zone-I, zone-II, zone-III, zone-IV) as per Bureau of Indian Standard Specifications IS:
383-1970 were used in the present research work. Flow behavior of cement mortar was studied
using modified mini flow-table test.
Flow characteristic is affected by the introduction of aggregate in cement paste which is
mainly governed by volume, grading, shape, and surface characteristics of aggregate.The
influence of characteristics of fine aggregate such as volume, grading, shape, and surface
characteristics of aggregatewere considered in terms of surface area of fine aggregate. Digital
image analysis technique was used to determine surface area of fine aggregate.
Statistical analysis is carried out using SPSS software to develop correlation amongst
superplasticizer dosage, flow behavior of cement mortar, water cement ratio, and surface area of
fine aggregate. Finally, a proposed methodology to estimate the superplasticizer dosage for
desired workability of cement mortar was developed.It is recommended that using the same
approach, a model can be developed for concrete to estimation superplasticizer dosage for
desired workability of concrete.
3. Brief description on the state of art of research topic Fresh properties of cement paste and mortar such as workability, flowability, and
cohesiveness governs the concrete characteristics. Therefore, measurement of fresh properties of
cement paste and mortar is the area of the interest to many researchers.A complete understanding
of mortar workability, therefore, must include a thorough understanding of the cement paste that
holds and bind the aggregate.Literature related to (i) the flow characteristics of cement paste and
mortar, and (ii) aggregate surface characteristicswere reviewed.
3.1. Literature review related tothe flow characteristic of cement paste and mortar
Literature indicates that various test methods were developed to measure workability of
cement paste, mortar and concrete. Many researchers have given classification of workability
tests based on the principle of measurement. Tattersall (1991) has divided workability
measurement tests in three classes as shown in Figure 1.
4

Figure 1 Classification of workability test by Tattersall
Hackley and Ferraris (2001) have classified workability tests in four categories as per flow
behaviour such as confined flow test, free flow test, vibrating flow tests, and rotational
rheometers and suggested various workability measurement testsdepending on type of mix.
Agullo et al. (1999) have studied the fluidity ofsuperplasticizedcement paste using Marsh
cone test.Test results have shown that for all cases there was a super-plasticizer saturation dosage
beyond which no significant increase in fluidity takes place.Marsh cone test, mini spread test,
and rheometer were used to understand flow behaviour of superplasticized cement paste by
Jayashree and Gettu (2008). Their study indicates that all three tests shows same trend with
change in superplasticizerdosage. Bouvet et al (2010) have performed Mini slump flow test and
Marsh cone tests. Authors have developed a numerical approach to reproduce the global flow
behavior.
SakirErdogdu (2000) carried out experimental study on the compatibility of
superplasticizer with three cements having different composition.The study indicates that
compressive strength of concrete depends on composition of cement and superplasticizer
compatibility rather than the amount of superplasticizer used.Jayasree et al. (2011) have
summarized state of art on cement and superplasticizers interaction and discussed test methods to
find the effectiveness of superplasticizers.
Chandra and Björnström (2002) used mini flow table test to study theinfluence of cement
and superplasticizers type and dosage on the fluidity of cement mortars.Harini et al. (2012)
investigated effects of size and type of fine aggregates on flowability of mortarwith use of mini
Workability measurement classes by Tattersall (1991)
Class-I Qualitative Class-II Quantitative Empirical Class-III Quantitative Fundamental
Workability, Flowability, Pumpability, Finishability, etc.
Slump, Compacting factor, Flow table spread, Vebe Time,
etc.
Viscocity, Mobility, Fluidity, Yield value, etc.
5
flow table test.Test results indicate thatflowability of mortar was greatly affected by size and
shape characteristicsof aggregate.Haach et al. (2011) have studied the influence of aggregate
grading and water cement ratio on workability and hardened properties of mortars. Test results
illustrate that sand grading affects the consistency of the mix and cement mortar produced from
fine sand requiresa higher amount of water.
3.2. Literature review related to aggregate shape characteristicsassessment techniques
Literature shows that particle shape and size influences the consistency of mix
significantly. Galloway (1994) has defined the shape of aggregate by sphericity, form and
roundness. Hudson (1999) has suggested that form of a particle which is also known as shape
factor is used to differentiate between particles which have same sphericity. Apart from
sphericity and form, there are two common terms elongation index and flakiness index, which
are used to define physical properties of aggregate. IS-2386 (Part-I)-1963 (reaffirmed-1999) has
given the method for determination of flakiness index and elongation index.
McCaveI.N., and Syvitski J.P.M. (1991) have given concise review of various principles
and measurement techniques. In general, four techniques for analyzing particle characteristics
are: sieve analysis, fluid sedimentation method, laser diffraction spectroscopy, and digital image
analysis. Amongst all four tests, sieve test is the most popular test to measure size characteristics
in the field. Assessment of shape characteristic and other parameters which can affect mix
properties is not possible with sieve test.
According to Rauch A.et al, (1999), fluid sedimentation and laser diffraction technique
are used to analyze a certain particle size range (finer particles). Major limitation of thesetwo
methods is that it measures the particle size in terms of equivalent diameter of sphere which
gives output such as volume and specific surface area of particle considering particle as a sphere.
Kemeny et al. (1993), Ferniund (1998), and Kuo et al. (1996; 1998), have analyzed earth
materials through digital image analysis. According to Maerz (2004), Digital image analysis is a
quick technique to obtain characteristic of aggregate and real time quality control is possible with
it. Digital image analysis is also useful to investigate shape properties of natural and crushed
aggregate. The correlation between shape characteristic of aggregate and concrete compressive
strength was carried out by RýzaPolat et al. (2013).Generally two dimensional images were
captured and analyzed to obtain characteristics of aggregate. It is difficult to perform three
6
dimensional analyses with this technique. Typically, digital image analysis helps to find area
fraction rather than volume fraction.
Selection of suitable method for measurement depends on various parameters such as an
estimated range of particle size, solubility, ease of handling, flowability, cost, specific
requirements and time.
3.3. Literature review summary Literature study revealed following aspects of the selection of workability measurement test,
effects of superplasticizer and its dosage on workability of cement paste and mortar,particle
shape characteristic assessment techniques.
a) Selection of a test method to measure workability is based on mix characteristic. Test
methods for very low workability mix and high workability mix are different.
b) Superplasticizer interacts with cement only and remains neutral towards aggregate (if
they are inert). However, workability of cement paste reduces with the introduction of
aggregate which is mainly governed by volume, grading, shape, and surface
characteristics of aggregate.
c) Significant research effort are put-in to understand the flow characteristics of self-
consolidated mortar/concrete,but very less citations are available on estimation of
superplasticizer dosage for intermediate/medium workability.
3.4. Research questions Based on above study, following research questions are formed:
1. Since shape, size and surface characteristics plays major role in governing workability
and are mainly described in qualitative terms, Can a system be designed and developed
which can measure these characteristics in quantitative terms?
2. Usually number of trials are required to fix superplasticizer’s dosage to achieve desired
workability, is it possible to develop a superplasicizer dosage prediction model for
desired workability to reduce trials?
4. Objectiveand scope of research work The workability of cement paste reduces by introducing aggregate in it as discussed in
literature review summary. Cement mortar is preparedby adding fine aggregate into paste and
7

concrete is produced by further addition of coarse aggregate. Since the action of aggregate
remains same, present work is limited to study of mortar which can be extended to concrete later.
Base on the above research questions following objective is aimed at,
To develop a prediction model for the dosage of superplasticizer to obtain desired
workability of mortar. This relationship will be useful to reduce the trials to achieve
desired workability of mortar.
To identify major parameters which affects the wokability of mortar, and to obtain a relationship
between them which will be achieved by;
i. Study the effect of water cement ratio and superplasticizer dosage on workability of the cement paste and cement mortar.
ii. Study the effect of surface area of aggregate on the workability of cement mortar.
iii. To develop a methodology to estimate the superplasticizer dosage for desired workability.
5. Research Methodology For achieving objective of the research, it is proposed to carry out experimental work, to
develop an analytical modelbased on statistical analysis of test results and to validate the
proposedmodel. Research methodology consists of following five phases.
Phase I Characterization of aggregate grading, shape and size i.e. analysis of particle
characteristic
Phase II Selection of superplasticizer i.e. Compatibility study
Phase III Cement mortar workability study
Phase IV Statistical analysis of test results
Phase V Prediction model for superplasticizer dosage to obtain desired workability
5.1. Phase I Characterization of aggregate grading, shape and size A given sand sample has large variation in particle size, shape, volume, and surface
characteristics. Hence, characterization method should be able to cover entire range of sand
fractions i.e. 150 micron to 4.75mm. Shape, size, volume and surface characteristics can be
clubbed in single parameter i.e. surface area of particle. There is a definite relationship between
8

two dimensional (2D) and three dimensional (3D) surface areas of regular shape particles. On the
same line, in present study, it is assumed that definite relationship exists between 2D surface area
of randomly oriented particle and their 3D surface area. Digital image analysis (DIA) techniqueis
selected to cover entire range of sand particles and determine 2D surface area of given
particles.Digital image analysis is a process to gather information regarding characteristic of
particle through computer programming.It is vital to capture aggregate image with proper
lighting and background for digital image analysis. Each particle boundary is obtained by digital
image analyzer programs. These programs are design to sense boundary of particle though
tracing outline, pixel counting or line scanning. Digital image analysis gives useful data and
information of shape characteristics of particle apart from its size.
Various fractions of the fine aggregate weresegregatedas per IS-383:1970 (reaffirmed-
2002) for digital image analysis. Figure 2 shows particles of various fractions of fine aggregate.
4.75 to 2.36 mm 2.36 to 1.18mm 1.18 to 0.60mm 0.60 to 0.30mm 0.30 to 0.15mm
Figure 2 various fractions of fine aggregate
Methodology adopted for determination of surface area of given sample is described as
under.
Step 1. Select thirty particles randomly from each fractions
Step 2. Determine surface area of thirty particles by DIA
Step 3. Calculate average surface area of each particle
Step 4. Determine weight of n number of particles from sample
Step 5. Calculate average weight of each particle
To get average surface area of given sand sample, following steps are to be followed
Step 1. Carry out sieve analysis to divide in requisite fractions
Step 2. Weight of given fraction is determined
Step 3. Determine the number of particles in given fraction as the average weight of one
particle of that fraction is known
9

Step 4. Determine total surface area of given fraction by multiplying average surface area
of one particle of that fraction and number of particles
Step 5. Sum the average surface areas of all the fractions
5.2. Phase II Selection of superplasticizer i.e. Compatibility study A variation in the characteristic of cement and type and dosage of superplasticizer creates
compatibility issues.Therefore, it is advisable to select an appropriate type of admixture.Marsh
cone test and mini slump test were performed to establish the compatibility.
5.2.1. Marsh cone test for cement paste The marsh cone test was performed to know the relative fluidity of cement paste. A
dosage, after which there is a no significant increase in fluidity of cement paste, is called
optimum dosage of superplasticizer (ODS).
5.2.2. Mini slump test for cement paste Kantro (1980) has developed mini slump test to understand flow behaviour of cement
paste. A mini slump cone, with height = 57 mm, bottom diameter = 38 mm and top diameter =
19 mmis filled by cement paste. The mini slump cone is lifted after one minute. Two diagonals
and two medians average are recorded as average flow diameter (AFD). Optimum dosage of
superplasticizer is considered from following two parameters. First parameter is maximum
spread of the cement paste without bleeding and second parameter is 170 ± 10mm average flow
diameter (NanthagopalanandSanthanam,2008).
Marsh cone test is found to be less sensitive beyond certain workability range and
cohesiveness of paste cannot be judged by the test. Therefore, mini slump test is used to find the
optimum dosage of superplasticizer for entire study.If optimum dosage of superplasticizer is not
in the range prescribed by manufacturer then it is considered as incompatible.
5.3. Phase-III Cement mortar workability study Workability of cement mortar can be determined by various tests. Workability of cement
mortar can be determined by various tests. A pilot study was carried out to judge their suitability
andmodified mini flow table test was selected (Domone, 2006). In this test, a truncated cone of
height= 50mm, bottom diameter =100mm and top diameter =70mm is used. Cement mortar is
filled and a truncated cone is lifted gently and15 jolts in 15 seconds are applied. The fluidity of
10
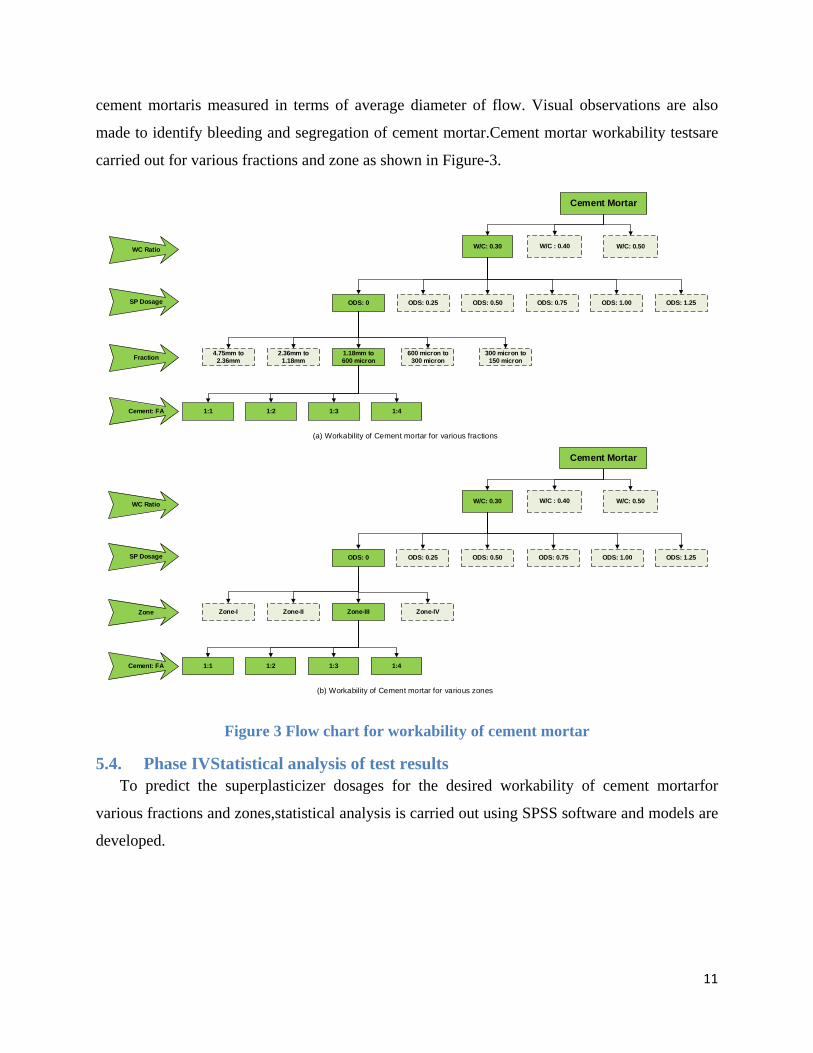
cement mortaris measured in terms of average diameter of flow. Visual observations are also
made to identify bleeding and segregation of cement mortar.Cement mortar workability testsare
carried out for various fractions and zone as shown in Figure-3.
Figure 3 Flow chart for workability of cement mortar
5.4. Phase IVStatistical analysis of test results To predict the superplasticizer dosages for the desired workability of cement mortarfor
various fractions and zones,statistical analysis is carried out using SPSS software and models are
developed.
W/C: 0.30 W/C : 0.40 W/C: 0.50
Cement Mortar
ODS: 0 ODS: 0.25 ODS: 0.50 ODS: 0.75
Zone-I Zone-II Zone-III Zone-IV
1:2 1:3 1:41:1Cement: FA
Zone
SP Dosage
WC Ratio
(b) Workability of Cement mortar for various zones
W/C: 0.30 W/C : 0.40 W/C: 0.50
Cement Mortar
ODS: 0 ODS: 0.25 ODS: 0.50 ODS: 0.75
4.75mm to 2.36mm
2.36mm to 1.18mm
1.18mm to 600 micron
600 micron to 300 micron
1:2 1:3 1:41:1Cement: FA
Fraction
SP Dosage
WC Ratio
(a) Workability of Cement mortar for various fractions
300 micron to 150 micron
ODS: 1.00
ODS: 1.00
ODS: 1.25
ODS: 1.25
11
5.5. Phase VPrediction model for superplasticizer dosage to obtain desired workability
Based on studyand statistical analysis of test results, amethodology is proposed to estimate
superplasticizer dosage for desired workability of cement mortar.
6. Experimental programme Experimental programme is consist of surface area measurement, compatibility study and
cement mortar workability.
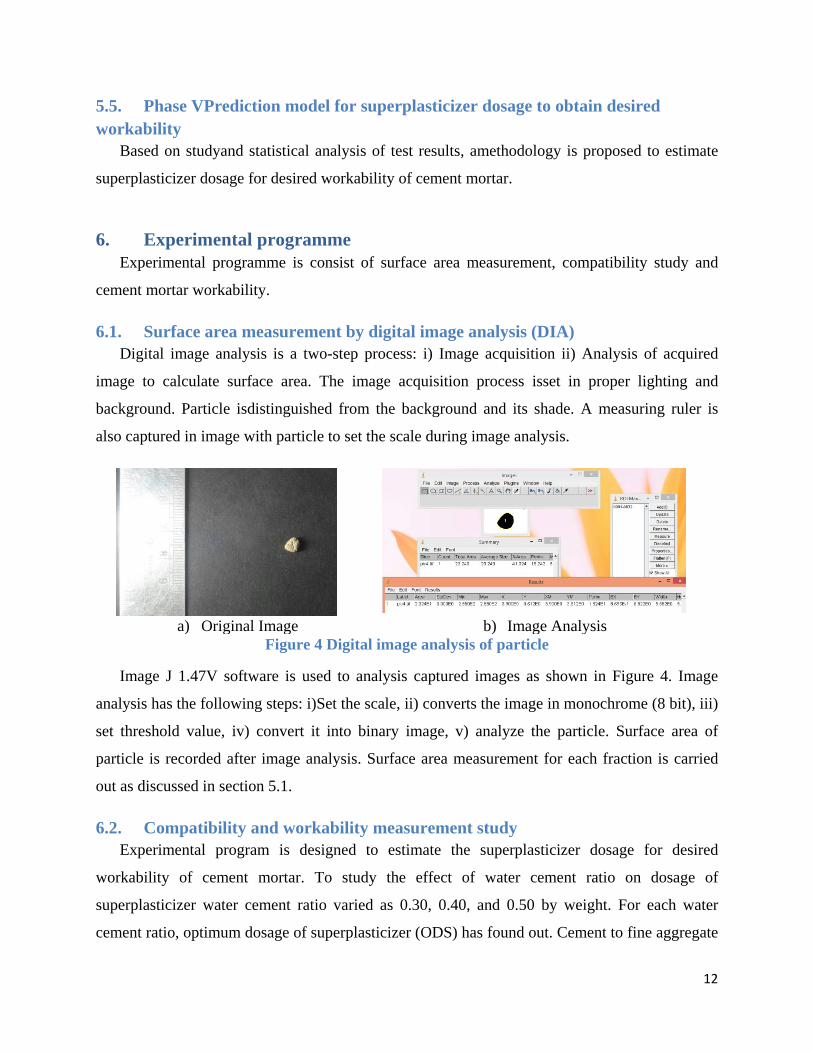
6.1. Surface area measurement by digital image analysis (DIA) Digital image analysis is a two-step process: i) Image acquisition ii) Analysis of acquired
image to calculate surface area. The image acquisition process isset in proper lighting and
background. Particle isdistinguished from the background and its shade. A measuring ruler is
also captured in image with particle to set the scale during image analysis.
a) Original Image b) Image Analysis
Figure 4 Digital image analysis of particle
Image J 1.47V software is used to analysis captured images as shown in Figure 4. Image
analysis has the following steps: i)Set the scale, ii) converts the image in monochrome (8 bit), iii)
set threshold value, iv) convert it into binary image, v) analyze the particle. Surface area of
particle is recorded after image analysis. Surface area measurement for each fraction is carried
out as discussed in section 5.1.
6.2. Compatibility and workability measurement study Experimental program is designed to estimate the superplasticizer dosage for desired
workability of cement mortar. To study the effect of water cement ratio on dosage of
superplasticizer water cement ratio varied as 0.30, 0.40, and 0.50 by weight. For each water
cement ratio, optimum dosage of superplasticizer (ODS) has found out. Cement to fine aggregate
12
proportions varied as 1:1, 1:2, 1:3, and 1:4. Six different dosages of superplasticizer are taken to
study the effect of superplasticizer on cement mortar workability i.e. 0% ODS (without
superplasticizer), 0.25% ODS, 0.50% ODS, 0.75% ODS, 1.0% ODS, and 1.25% ODS. To study
the effect of surface area of fine aggregate on workability and dosage of superplasticizer five
different fractions and four different zones are prepared.First of all, segregation of different size
of particles with help of sievingis carried out to get five different fractions of fine aggregate.
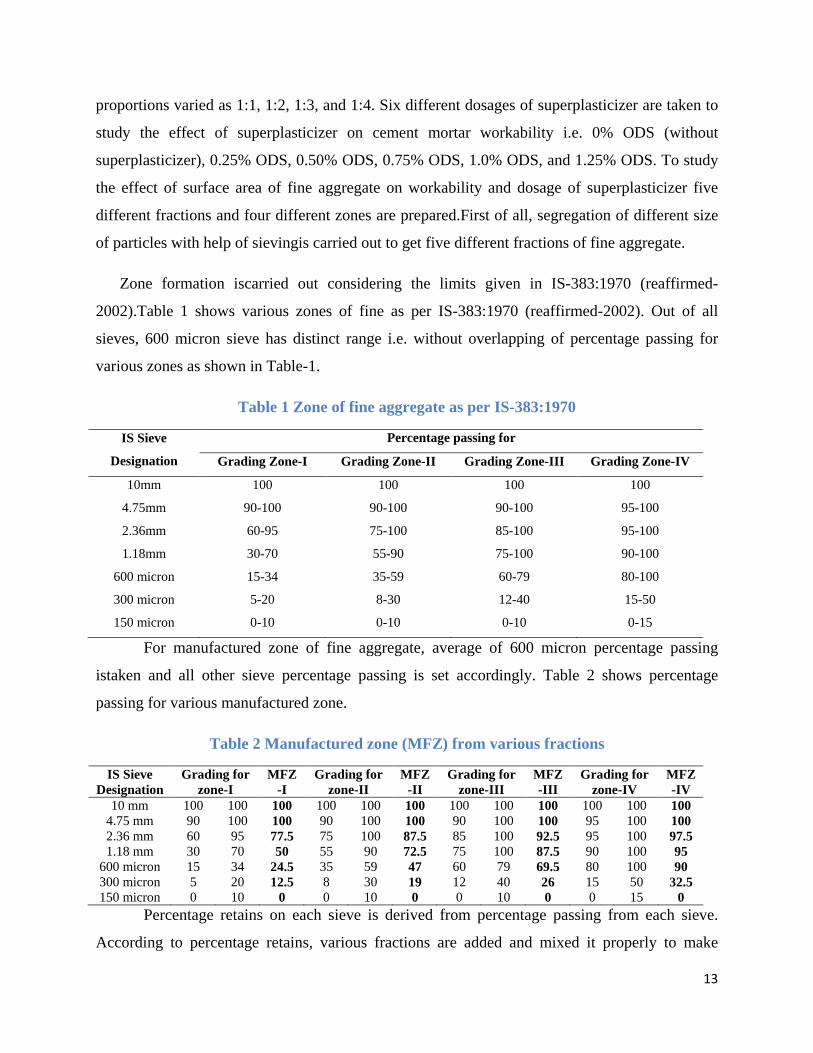
Zone formation iscarried out considering the limits given in IS-383:1970 (reaffirmed-
2002).Table 1 shows various zones of fine as per IS-383:1970 (reaffirmed-2002). Out of all
sieves, 600 micron sieve has distinct range i.e. without overlapping of percentage passing for
various zones as shown in Table-1.
Table 1 Zone of fine aggregate as per IS-383:1970
IS Sieve
Designation
Percentage passing for
Grading Zone-I Grading Zone-II Grading Zone-III Grading Zone-IV
10mm 100 100 100 100
4.75mm 90-100 90-100 90-100 95-100
2.36mm 60-95 75-100 85-100 95-100
1.18mm 30-70 55-90 75-100 90-100
600 micron 15-34 35-59 60-79 80-100
300 micron 5-20 8-30 12-40 15-50
150 micron 0-10 0-10 0-10 0-15
For manufactured zone of fine aggregate, average of 600 micron percentage passing
istaken and all other sieve percentage passing is set accordingly. Table 2 shows percentage
passing for various manufactured zone.
Table 2 Manufactured zone (MFZ) from various fractions
IS Sieve Designation
Grading for zone-I
MFZ-I
Grading for zone-II
MFZ-II
Grading for zone-III
MFZ-III
Grading for zone-IV
MFZ-IV
10 mm 100 100 100 100 100 100 100 100 100 100 100 100 4.75 mm 90 100 100 90 100 100 90 100 100 95 100 100 2.36 mm 60 95 77.5 75 100 87.5 85 100 92.5 95 100 97.5 1.18 mm 30 70 50 55 90 72.5 75 100 87.5 90 100 95
600 micron 15 34 24.5 35 59 47 60 79 69.5 80 100 90 300 micron 5 20 12.5 8 30 19 12 40 26 15 50 32.5 150 micron 0 10 0 0 10 0 0 10 0 0 15 0
Percentage retains on each sieve is derived from percentage passing from each sieve.
According to percentage retains, various fractions are added and mixed it properly to make
13
various zones.Hobart mixture is used to prepare cement paste and mortar.Modified mini flow
table test is performed to measure workability of cement mortar with different water cement
ratio, cement fine aggregate proportions, and superplasticizer dosages.Total 648 tests are
performed to get the relation between the water cement ratio, dosage of superlasticizer, surface
area and workability of mortar.
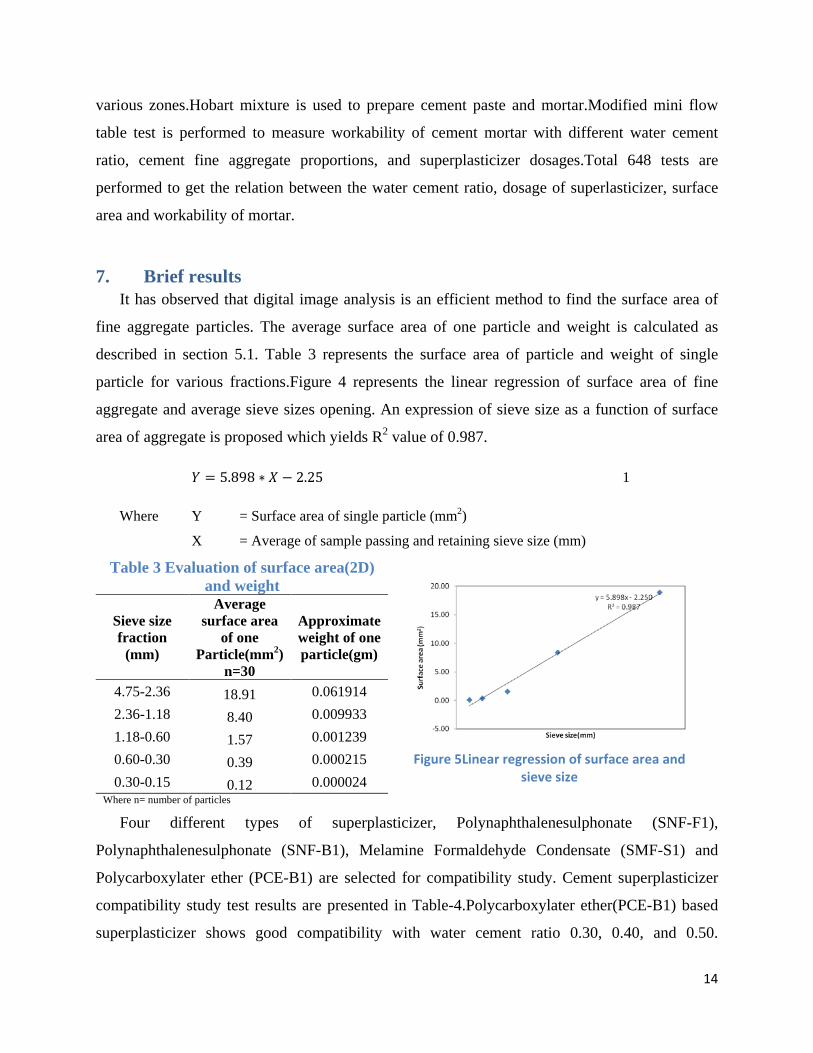
7. Brief results It has observed that digital image analysis is an efficient method to find the surface area of
fine aggregate particles. The average surface area of one particle and weight is calculated as
described in section 5.1. Table 3 represents the surface area of particle and weight of single
particle for various fractions.Figure 4 represents the linear regression of surface area of fine
aggregate and average sieve sizes opening. An expression of sieve size as a function of surface
area of aggregate is proposed which yields R2 value of 0.987.
𝑌𝑌 = 5.898 ∗ 𝑋𝑋 − 2.25 1
Where Y = Surface area of single particle (mm2)
X = Average of sample passing and retaining sieve size (mm)
Table 3 Evaluation of surface area(2D) and weight
Sieve size fraction
(mm)
Average surface area
of one Particle(mm2)
n=30
Approximate weight of one particle(gm)
4.75-2.36 18.91 0.061914 2.36-1.18 8.40 0.009933 1.18-0.60 1.57 0.001239 0.60-0.30 0.39 0.000215 0.30-0.15 0.12 0.000024
Where n= number of particles
Figure 5Linear regression of surface area and
sieve size
Four different types of superplasticizer, Polynaphthalenesulphonate (SNF-F1),
Polynaphthalenesulphonate (SNF-B1), Melamine Formaldehyde Condensate (SMF-S1) and
Polycarboxylater ether (PCE-B1) are selected for compatibility study. Cement superplasticizer
compatibility study test results are presented in Table-4.Polycarboxylater ether(PCE-B1) based
superplasticizer shows good compatibility with water cement ratio 0.30, 0.40, and 0.50.
14

Optimum dosage of superplasticizer (ODS) for water cement ratio 0.30, 0.40 and 0.50 are 1.25%,
1% and 0.75% of weight of cement respectively.
Table 4 Cement superplasticizer compatibility study
Designation Chemical type
Optimum Dosage of Superplasticizer
(%)
w/c=0.3 w/c=0.4 w/c=0.5
SNF-F1 Polynaphalenesulphonate * 1.75 1.5
SNF-B1 Polynaphalenesulphonate * 1 1
SMF-S1 Melamine Formaldehyde Condensate 2.75 1.25 1
PCE-B1 Polycarboxylater ether 1.25 1 0.75
* indicates more than 5% superplasticizer dosage- Incompatible
Figure 6 and 7 represents the average flow diameter (a spread of cement mortar) against
the surface area of fine aggregate for different superplasticizer dosages. It has seen from figure 6
and 7 that, the average flow diameter decreases with an increase in surface area of fine
aggregate.
F1 (4.75 to 2.36mm), w/c=0.30 F1 (4.75 to 2.36mm), w/c=0.40 F1 (4.75 to 2.36mm), w/c=0.50
F2 (2.36 to 1.18mm), w/c=0.30 F2 (2.36 to 1.18mm), w/c=0.40 F2 (2.36 to 1.18mm), w/c=0.50
F3 (1.18 to 0.60mm), w/c=0.30 F3 (1.18 to 0.60mm), w/c=0.40 F3 (1.18 to 0.60mm), w/c=0.50
0
100
200
300
400
1.0 1.1 1.2 1.3 1.4 1.5 1.6 1.7 1.8
AFD
(mm
)
Surface area (mm2)
x 100000
Without SP(0ODS) 0.25ODS 0.5ODS
0.75ODS 1ODS 1.25ODS
050
100150200250300350
1.0 1.1 1.2 1.3 1.4 1.5 1.6 1.7 1.8
AFD
(mm
)
Surface area (mm2)
x 100000
Without SP(0ODS) 0.25ODS 0.5ODS
0.75ODS 1ODS 1.25ODS
050
100150200250300350
1.0 1.1 1.2 1.3 1.4 1.5 1.6 1.7 1.8
AFD
(mm
)
Surface area (mm2)
x 100000
Without SP(0ODS) 0.25ODS 0.5ODS
0.75ODS 1ODS 1.25ODS
0
100
200
300
400
2.5 3.0 3.5 4.0 4.5 5.0
AFD
(mm
)
Surface area (mm2)
x 100000
Without SP(0ODS) 0.25ODS 0.5ODS
0.75ODS 1ODS 1.25ODS
0
100
200
300
400
2.5 3.0 3.5 4.0 4.5 5.0
AFD
(mm
)
Surface area (mm2)
x 100000
Without SP(0ODS) 0.25ODS 0.5ODS
0.75ODS 1ODS 1.25ODS
0
100
200
300
400
2.5 3.0 3.5 4.0 4.5 5.0
AFD
(mm
)
Surface area (mm2)
x 100000
Without SP(0ODS) 0.25ODS 0.5ODS
0.75ODS 1ODS 1.25ODS
050
100150200250300350
4.0 4.5 5.0 5.5 6.0 6.5 7.0 7.5
AFD
(mm
)
Surface area (mm2)
x 100000
Without SP(0ODS) 0.25ODS 0.5ODS
0.75ODS 1ODS 1.25ODS
0
100
200
300
400
4.0 4.5 5.0 5.5 6.0 6.5 7.0 7.5
AFD
(mm
)
Surface area (mm2)
x 100000
Without SP(0ODS) 0.25ODS 0.5ODS
0.75ODS 1ODS 1.25ODS
0
100
200
300
400
4.0 4.5 5.0 5.5 6.0 6.5 7.0 7.5
AFD
(mm
)
Surface area (mm2)
x 100000
Without SP(0ODS) 0.25ODS 0.5ODS
0.75ODS 1ODS 1.25ODS
15

F4 (0.60 to 0.30mm), w/c=0.30 F4 (0.60 to 0.30mm), w/c=0.40 F4 (0.60 to 0.30mm), w/c=0.50
F5 (0.30 to 0.15mm), w/c=0.30 F5 (0.30 to 0.15mm), w/c=0.40 F5 (0.30 to 0.15mm), w/c=0.50
Figure 6Workability of cement mortar for different fractions
Zone 1, w/c=0.30 Zone 1, w/c=0.40 Zone 1, w/c=0.50
Zone 2, w/c=0.30 Zone 2, w/c=0.40 Zone 2, w/c=0.50
Zone 3, w/c=0.30 Zone 3, w/c=0.40 Zone 3, w/c=0.50
Zone 4, w/c=0.30 Zone 4, w/c=0.40 Zone 4, w/c=0.50
Figure 7 Workability of cement mortar for different zones
050
100150200250300350
6.0 7.0 8.0 9.0 10.0 11.0
AFD
(mm
)
Surface area (mm2)
x 100000
Without SP(0ODS) 0.25ODS 0.5ODS
0.75ODS 1ODS 1.25ODS
0
100
200
300
400
6.0 7.0 8.0 9.0 10.0 11.0
AFD
(mm
)
Surface area (mm2)
x 100000
Without SP(0ODS) 0.25ODS 0.5ODS
0.75ODS 1ODS 1.25ODS
0
100
200
300
400
6.0 7.0 8.0 9.0 10.0 11.0
AFD
(mm
)
Surface area (mm2)
x 100000
Without SP(0ODS) 0.25ODS 0.5ODS
0.75ODS 1ODS 1.25ODS
050
100150200250300350
18 20 22 24 26 28 30
AFD
(mm
)
Surface area (mm2)
x 100000
Without SP(0ODS) 0.25ODS 0.5ODS
0.75ODS 1ODS 1.25ODS
0
100
200
300
400
18 20 22 24 26 28 30AF
D (m
m)
Surface area (mm2)
x 100000
Without SP(0ODS) 0.25ODS 0.5ODS
0.75ODS 1ODS 1.25ODS
0
100
200
300
400
18 20 22 24 26 28 30
AFD
(mm
)
Surface area (mm2)
x 100000
Without SP(0ODS) 0.25ODS 0.5ODS
0.75ODS 1ODS 1.25ODS
0
100
200
300
400
5 5.5 6 6.5 7 7.5 8 8.5 9
AFD
(mm
)
Surface area (mm2)
x 100000
Without SP(0ODS) 0.25ODS 0.5ODS
0.75ODS 1ODS 1.25ODS
0
100
200
300
400
5 5.5 6 6.5 7 7.5 8 8.5 9
AFD
(mm
)
Surface area (mm2)
x 100000
Without SP(0ODS) 0.25ODS 0.5ODS
0.75ODS 1ODS 1.25ODS
0
100
200
300
400
5 5.5 6 6.5 7 7.5 8 8.5 9
AFD
(mm
)
Surface area (mm2)
x 100000
Without SP(0ODS) 0.25ODS 0.5ODS
0.75ODS 1ODS 1.25ODS
0
100
200
300
400
6.5 7.5 8.5 9.5 10.5 11.5
AFD
(mm
)
Surface area (mm2)
x 100000
Without SP(0ODS) 0.25ODS 0.5ODS
0.75ODS 1ODS 1.25ODS
0
100
200
300
400
6.5 7.5 8.5 9.5 10.5 11.5
AFD
(mm
)
Surface area (mm2)
x 100000
Without SP(0ODS) 0.25ODS 0.5ODS
0.75ODS 1ODS 1.25ODS
0
100
200
300
400
6.5 7.5 8.5 9.5 10.5 11.5
AFD
(mm
)
Surface area (mm2)
x 100000
Without SP(0ODS) 0.25ODS 0.5ODS
0.75ODS 1ODS 1.25ODS
0
100
200
300
400
8 9 10 11 12 13 14
AFD
(mm
)
Surface area (mm2)
x 100000
Without SP(0ODS) 0.25ODS 0.5ODS
0.75ODS 1ODS 1.25ODS
0
100
200
300
400
8 9 10 11 12 13 14
AFD
(mm
)
Surface area (mm2)
x 100000
Without SP(0ODS) 0.25ODS 0.5ODS
0.75ODS 1ODS 1.25ODS
0
100
200
300
400
8 9 10 11 12 13 14
AFD
(mm
)
Surface area (mm2)
x 100000
Without SP(0ODS) 0.25ODS 0.5ODS
0.75ODS 1ODS 1.25ODS
050
100150200250300350
10 11 12 13 14 15 16 17
AFD
(mm
)
Surface area (mm2)
x 100000
Without SP(0ODS) 0.25ODS 0.50 ODS
0.75ODS 1ODS 1.25ODS
0
100
200
300
400
9.5 10.5 11.5 12.5 13.5 14.5 15.5 16.5
AFD
(mm
)
Surface area (mm2)
x 100000
Without SP(0ODS) 0.25ODS 0.50 ODS
0.75ODS 1ODS 1.25ODS
0
100
200
300
400
9.5 10.5 11.5 12.5 13.5 14.5 15.5 16.5
AFD
(mm
)
Surface area (mm2)
x 100000
Without SP(0ODS) 0.25ODS 0.50 ODS
0.75ODS 1ODS 1.25ODS
16

Increase in superplasticizer dosages improves the cement mortar workability. However, as
expected and reiterating past research observations, there is no significant increase in cement
mortar workability for superplasticizer dosage more than optimum dosage i.e. 1.25 % ODS. Test
results indicate entire workability range from stiff to workable to flow to segregation depends
upon various parameters such as water cement ratio, dosage of superplasticizer and cement to
aggregate ratio.
Linear regression models is carried out to get relationship between superplasticizer dosage
(u, %), water cement ratio (u1, unit less), surface area of fine aggregate (u2, mm2), and average
flow diameter of cement mortar (u3, mm) for each fraction and zones. Total nine models were
developed which are presented in Table 5.
Table 5Summary of models
Model Equations R2 p value F1(4.75 to 2.36mm) u = -0.383+(-4.435*u1)+(1.26E-05*u2)+ (4.40E-03*u3) 0.89 1.85E-08
F2(2.36 to 1.18mm) u = -0.362+(-5.134*u1)+(5.26E-06*u2)+ (4.92E-03*u3) 0.88 7.56E-10
F3(1.18 to 0.60mm) u = -0.316+(-4.929*u1)+(3.29E-06*u2)+ (5.03E-03*u3) 0.84 1.57E-08
F4 (0.60 to 0.30mm) u = -0.476+(-4.559*u1)+(2.32E-06*u2)+ (5.29E-03*u3) 0.84 3.28E-08
F5(0.30 to 0.15mm) u = -1.159+(-5.742*u1)+(1.33E-06*u2)+ (6.53E-03*u3) 0.87 4.90E-08
Zone Z1 u = -0.641+(-4.088*u1)+(2.98E-06*u2)+ (3.73E-03*u3) 0.72 4.17E-08
ZoneZ2 u = -0.433+(-4.455*u1)+(2.28E-06*u2)+ (3.80E-03*u3) 0.65 7.45E-07
ZoneZ3 u = -0.37+(-4.216*u1)+(1.76E-06*u2)+ (3.89E-03*u3) 0.72 6.21E-08
ZoneZ4 u = -0.749+(-4.871*u1)+(1.82E-06*u2)+ (5.64E-03*u3) 0.81 1.98E-08
It isobserved that expression of superplasticizer dosage as a function of a constant, water
cement ratio, surface area of fine aggregate and average flow diameter is reliable as the R2 is
very high and p is low (p <0.05) for all the nine models.
17

A proposed methodology to estimate superplasticizer dosage for desired workability is
shown in annexure I and validated by fine aggregate samples collected from different parts of
Gujarat state.
8. Achievements with respect to objectives Research work resulted in following towards research objectives:
a) Digital image analysis set up is designed and developed to measure surface area
of fine aggregate particles.
b) A method to calculate the surface area from sieve analysis of fine aggregate
sample is proposed, incorporating the relationship between weight and surface
area particles for various fractions.
c) A methodology to estimate the superplasticizer dosage for desired workability of
cement mortar was developed and validated as shown in annexure I.
9. Conclusions Research was aimed at finding out a methodology to estimate the superplasticizer dosage and
reduce the trials for measuring workability of cement mortar. From experimental results, the
following conclusions can be drawn:
1. The mini-slump test is a good indicator of relative fluidity of superplasticized cement
paste.It is found to be a better test compared to marsh cone test appropriate test to find
optimum dosage of superplasticizer as marsh cone test becomes less sensitive beyond
certain workability range.
2. Digital image analysis method has a potential to estimate size and shape characteristics of
aggregate rapidly and accurately. Two dimensional (2D) image analyses of aggregate
gives a broad idea of aggregate quality compare to procedure suggested in Indian
standards. In general, a camera and a computer are required for two dimensional (2D)
image analysis techniques. Hence can be established easily in laboratory without much
expenditure.
3. In present work, a methodology is proposed to determine surface area of given sand
fraction. For sand sample used in present study, surface area calculated by digital image
18

analysis for each fraction conforms to linear relationship with average sieve sizes
opening. Correlation of surface area to the average square size opening of sieve yielded
R2 values of 0.987.
Y = 5.898 ∗ X − 2.25
Where Y = Surface area of single particle (mm2)
X = Average of sample passing and retaining sieve size (mm)
The formation of river sand is more or less same i.e. by abrasion and rolling with flow of
water hence this relationship does not vary much provided the mineral composition is not
varying significantly. Therefore in the absent of experimental data of given sample,
present equation can be used in estimating surface area.
4. Fractions F1, F2, F3, F4, F5, and Zones Z1, Z2, Z3, Z4shows good correlation of water
cement ratio, workability of mortar, surface area of fine aggregate to the dosage of
superplasticizer.
5. A proposed methodology to estimate superplasticizer dosage for desired workability was
suggested and validated by fine aggregate samples collected from different parts of
Gujarat state.
10. Future scope It is recommended that using the same approach, a model can be developed for concrete
to estimation superplasticizer dosage for desired workability of concrete.
11. References 1. Agullo, L., Toralles-Carbonari, B., Gettu, R., &Aguado, A. (1999). Fluidity of cement pastes with mineral
admixtures and superplasticizer—a study based on the Marsh cone test. Materials and Structures, 32(7),
479-485.
2. Bouvet, A., Ghorbel, E., &Bennacer, R. (2010). The mini-conical slump flow test: Analysis and numerical
study. Cement and concrete research, 40(10), 1517-1523.
3. Chandra, S., &Björnström, J. (2002). Influence of cement and superplasticizers type and dosage on the
fluidity of cement mortars—Part I. Cement and Concrete Research, 32(10), 1605-1611.
4. Domone, P. (2006). Mortar tests for self-consolidating concrete. Concrete international, 28(4), 39-45.
19
5. Erdoǧdu, Ş. (2000). Compatibility of superplasticizers with cements different in composition. Cement and
concrete research, 30(5), 767-773.
6. Fernlund, J. M. (1998). The effect of particle form on sieve analysis: a test by image analysis. Engineering
Geology, 50(1), 111-124.
7. Galloway, J. E. (1994). Grading, Shape, and Surface Properties. ASTM special technical publication, 169,
401-410.
8. Haach, V. G., Vasconcelos, G., &Lourenço, P. B. (2011). Influence of aggregates grading and
water/cement ratio in workability and hardened properties of mortars. Construction and Building Materials,
25(6), 2980-2987.
9. Hackley, V. A., & Ferraris, C. F. (2001). The use of nomenclature in dispersion science and technology
(Vol. 960, No. 3). US Department of Commerce, Technology Administration, National Institute of
Standards and Technology.
10. Harini, M., Shaalini, G., &Dhinakaran, G. (2012). Effect of size and type of fine aggregates on flowability
of mortar. KSCE Journal of Civil Engineering, 16(1), 163-168.
11. Hudson, B. (1999). Modification to the fine aggregate angularity test. In Proceedings, Seventh Annual
International Center for Aggregates Research Symposium, Austin, TX.
12. IS 2386(I), Indian standard methods of test for aggregates for concrete, Part-I: particle size and shape, The
Bureau of Indian Standards, New Delhi, 12th reprint, 1999.
13. IS: 12269—1987, Specifications for 53 grade ordinary Portland cement, Bureau of Indian Standards, New
Delhi, India
14. IS: 383-1970, Specifications for Coarse and Fine Aggregates from Natural Sources for Concrete, Bureau of
Indian Standards, New Delhi, India.
15. Jayasree, C., &Gettu, R. (2008). Experimental study of the flow behaviour of superplasticized cement
paste. Materials and structures, 41(9), 1581-1593.
16. Jayasree, C., Santhanam, M., &Gettu, R. (2011). Cement-superplasticiser compatibility—Issues and
challenges. Indian Concrete Journal, 85(7), 48.
17. Kemeny, J. M., Devgan, A., Hagaman, R. M., & Wu, X. (1993). Analysis of rock fragmentation using
digital image processing. Journal of Geotechnical Engineering, 119(7), 1144-1160.
18. Kuo, C. Y., Frost, J., Lai, J., & Wang, L. (1996). Three-dimensional image analysis of aggregate particles
from orthogonal projections. Transportation Research Record: Journal of the Transportation Research
Board, (1526), 98-103.
19. Kuo, C. Y., Rollings, R. S., & Lynch, L. N. (1998). Morphological study of coarse aggregates using image
analysis. Journal of materials in civil engineering, 10(3), 135-142.
20. Maerz, N. H. (2004). Technical and computational aspects of the measurement of aggregate shape by
digital image analysis. Journal of Computing in Civil Engineering, 18(1), 10-18.
21. McCave, I. N., &Syvitski, J. P. (1991). Principles and methods of geological particle size analysis.
Principles, methods and application of particle size analysis, 3-21.
20
22. Nanthagopalan, P., &Santhanam, M. (2008). A new approach to optimisation of paste composition in self-
compacting concrete. Indian concrete journal, 82(11), 11-18.
23. Rauch, A., Hass, C., & Kim, H. (1999, April). State of the art in aggregate classification: review of
aggregate gradation technologies. In Proceedings of the 7th Annual International Center for Aggregates
Research Symposium, University of Texas at Austin, April (pp. 19-21).
24. RýzaPolat, MehrzadMohabbiYadollahi, A. E. S. and S. A. (2013). The correlation between aggregate shape
and compressive strength of concrete: digital image processing approach. International Journal of Structural
and Civil Engineering Research, Vol. 2, No, 62–80.
25. Tattersall, G.H. (1991). Workability and Quality Control of Concrete. London: E&FN Spon
12. Publications
1. Selection of Test Method to Quantify Workability of Cement Paste and Mortar for Very Low Workable to High Workable, International Journal of Engineering Sciences & Research Technology, ISSN:2277-9655, vol. 4, no. 12, pp. 854-860, 2015.
2. Critical Review of Aggregate Shape Characteristic Assessment Techniques, UKIERIConcrete Congress, Concrete Research Driving Profit and Sustainability, pp. 1041-1054, 2-5 November 2015
3. State of Art for Determining Morphology Of Aggregate, National Conference on Recent Advances in Civil and Structural Engineering (RACSE-’14), ISBN: 978-81-927554-1-0, vol. 1, pp.56–64, 25-26 April 2014.
4. Correlating Workability of Superplasticised Paste, Mortar and Concrete-Present Scenario,UKIERI Concrete Congress, Innovation in Concrete Construction, pp. 425–439, 5-8 March 2013
5. State of Art Paper: Investigation of Workability of Cement Paste, Cement Mortar And Concrete by Various Methods, International Journal of Advanced Engineering Research and Studies, ISSN:2249-8974, vol. II, Issue I, pp. 16-23, Oct.-Dec.,2012
21
Annexure-I
22

Given Data:
Workability : Average flow diameter (spread),
Water cement ratio, Superplasticizer: Type and
brand, Proportion of cement and fine aggregate,
Cement: Ordinary Portland Cement
Compatibility Study of
Cement Superplasticizer
Change cement or
superplasticizer
Rejected
Accepted
Sieve analysis of fine aggregate
sample
Proposed Methodology Flow Chart for Prediction of Superplasticizer Dosage for Desired
Workability
Determination of surface area of fine
aggregate
Select approach
Sample preparation and
Image acquisition
Approach-1
Use surface area and
weight relationship for
various fractions
suggested by authors
Image analysis to
determine surface area
of particles
Calculation of average
surface area of particle
Approach-2
Calculation of number of
particles contented in
given weight
Calculation of average
weight of particle
Determine surface area of fine
aggregate based on sieve analysis
and surface area and weight
relationship
Derive relationship
between surface area
and weight for each
fractions
Behavior study of cement mortar at
maximum dosage of superplasticizer
Is mix workable?Stiff Mix or Segregation
No
Select the equation according to
zone of fine aggregate
Change water
content, SP or
adjust gradation
Use Lower Dosage of SP
(till segregation is stopped)
Stiff
mix
Segregation Yes
Predict the dosage of
superplasticizer (SP) for desired
workability of cement mortar
Methodology to Determination of Surface
Area of Given Sample by Approach1
Step 1. Select thirty particles randomly from
each fractions
Step 2. Determine surface area of thirty
particles by DIA
Step 3. Calculate average surface area of each
particle
Step 4. Determine weight of n number of
particles from sample
Step 5. Calculate average weight of each
particle
To get average surface area of given sand
sample, following steps are to be followed
Step 1. Carry out sieve analysis to divide in
requisite fractions
Step 2. Weight of given fraction is determined
Step 3. Determine the number of particles in
given fraction as the average weight of one
particle of that fraction is known
Step 4. Determine total surface area of given
fraction by multiplying average surface area of
one particle of that fraction and number of
particles
Step 5. Sum the average surface areas of all the
fractions
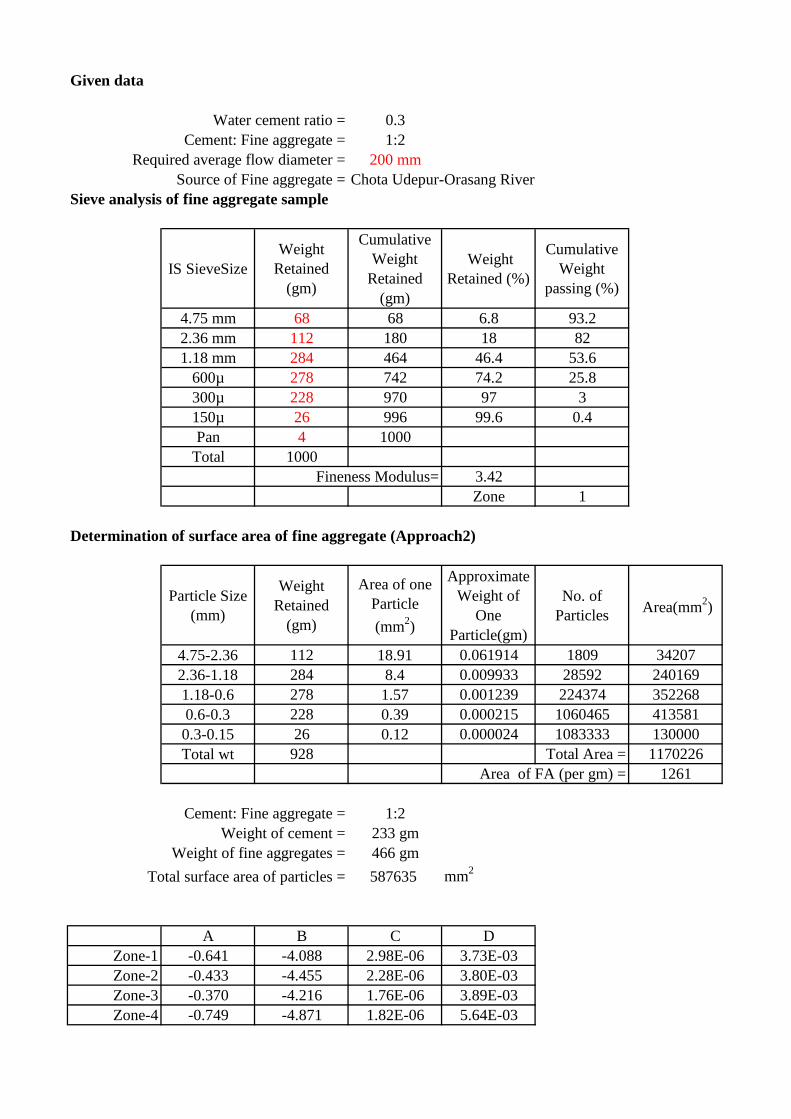
Given data
Water cement ratio = 0.3 1:1Cement: Fine aggregate = 1:2 1:2
Required average flow diameter = 200 mm 1:3Source of Fine aggregate = Chota Udepur-Orasang River 1:4
Sieve analysis of fine aggregate sample
IS SieveSize Weight
Retained (gm)
Cumulative Weight
Retained (gm)
Weight Retained (%)
Cumulative Weight
passing (%)
4.75 mm 68 68 6.8 93.22.36 mm 112 180 18 821.18 mm 284 464 46.4 53.6
600µ 278 742 74.2 25.8300µ 228 970 97 3150µ 26 996 99.6 0.4Pan 4 1000
Total 1000Fineness Modulus= 3.42
Zone 1
Determination of surface area of fine aggregate (Approach2)
Particle Size (mm)
Weight Retained
(gm)
Area of one Particle (mm2)
Approximate Weight of
One Particle(gm)
No. of Particles Area(mm2)
4.75-2.36 112 18.91 0.061914 1809 342072.36-1.18 284 8.4 0.009933 28592 2401691.18-0.6 278 1.57 0.001239 224374 3522680.6-0.3 228 0.39 0.000215 1060465 4135810.3-0.15 26 0.12 0.000024 1083333 130000Total wt 928 Total Area = 1170226
Area of FA (per gm) = 1261
Cement: Fine aggregate = 1:2Weight of cement = 233 gm
Weight of fine aggregates = 466 gmTotal surface area of particles = 587635 mm2
A B C DZone-1 -0.641 -4.088 2.98E-06 3.73E-03Zone-2 -0.433 -4.455 2.28E-06 3.80E-03Zone-3 -0.370 -4.216 1.76E-06 3.89E-03Zone-4 -0.749 -4.871 1.82E-06 5.64E-03

SP (%) = A+(B*wc ratio)+(C*surface area of particles)+(D*Average flow diameter)
Where A = -0.64B = -4.09C = 2.98E-06D = 3.73E-03
SP (%)= -0.64+(-4.09*0.3)+(0.00000298*587635)+(0.00373*200) SP (%)= 0.63
Weight of cement = 233 gmWeight of SP = 1.47 gm
Avg. Flow Diameter
(mm)
Required Avg. Flow Diameter
(mm)
Variation (%)
205.8 201.72 209.42 204.74 205.42 200 2.64
Prediction of dosage of superplasticizer (SP) for desired workability of cement mortar
Flow diameter (mm)