Embed Size (px)
Citation preview
ORIGINAL PAPER
Estimation of population density of European pine martenin central Italy using camera trapping
Emiliano Manzo & Paola Bartolommei &J. Marcus Rowcliffe & Roberto Cozzolino
Received: 14 February 2011 /Accepted: 27 July 2011 /Published online: 7 September 2011# Mammal Research Institute, Polish Academy of Sciences, Białowieża, Poland 2012
Abstract Evaluating presence and abundance of smallcarnivores is essential for their conservation. In Italy, there isscarce information on European pine marten distribution, andno data are published on its abundance. Camera traps havebeen widely used to estimate population density applyingcapture–recapture models for species in which individualrecognition is possible. Here we estimate the abundance ofEuropean pine martens in central Italy using camera trappingand a model that allows the estimation of population densitywithout the need for individual recognition Rowcliffe et al.(Anim Conserv 11:185–186, 2008). Camera trapping wasalso used to evaluate habitat use patterns by martens. Fifteencamera traps were deployed in 90 placements for 15 dayseach, for a total of 1,334 camera days. Pine martens werecaptured in 24% of camera trap placements with a mean trapsuccess rate of 0.33 photographs per camera placement.Estimated pine marten population density in the study areawas 0.34 individuals km−2. Marten trap rate was not stronglyassociated with any habitat type, although there were trendstowards lower probability of records at locations with highcoverage of cultivated fields and higher probability ofrecords at locations with high coverage of human-madewoodland. The results suggest that pine martens in this area
are not confined to wooded habitat. To our knowledge, thisstudy is the first application of the Rowcliffe et al. (AnimConserv 11:185–186, 2008) method to a wild carnivorepopulation and, furthermore, the first estimation of populationdensity of pine martens in Italy.
Keywords Abundance estimation . Camera traps . Densityestimation .Martes martes . Habitat use
Introduction
Evaluating small carnivore presence and abundance isessential for their conservation and management. In theabsence of reliable data on these topics, it is impossible todraw conclusions regarding population status, habitat require-ments and anthropogenic impacts (Williams et al. 2002).
The European pine marten Martes martes is widelydistributed in Europe, but data on abundance and distributionof this species are scarce, with just a few studies conductedin local populations (e.g. in Switzerland, Marchesi 1989; inPoland, Zalewski et al. 2004). In Italy, the species is presentin forested areas of the peninsula, with a distribution that
Acta Theriol (2012) 57:165–172DOI 10.1007/s13364-011-0055-8
appears to be very fragmented (Genovesi and De Marinis2003). However, within Italy, there is little information onpine marten distribution, and no data are published on itsabundance. This lack of information stems from thedifficulties arising in monitoring this elusive species.
The choice of method to estimate the abundance of aspecies depends on the goal of the study, the etho-ecologicalcharacteristic of the species, the habitats of the study area andon the budget and the personnel involved in the study (Silveiraet al. 2003; Gompper et al. 2006). Camera trapping is
Communicated by: Dries Kuijper
E. Manzo (*) : P. Bartolommei :R. CozzolinoEthoikos, Convento dell’Osservanza,53030 Radicondoli, Siena, Italye-mail: [email protected]
J. M. RowcliffeInstitute of Zoology, Zoological Society of London,Regent’s Park,London NW1 4RY, UK
increasingly being employed in the monitoring of rare andelusive species (e.g. Carbone et al. 2001; Wallace et al. 2003;Jackson et al. 2006; Kelly and Holub 2008; Rowcliffe andCarbone 2008; Tobler et al. 2008), including mustelids(Zielinski et al. 1995; González-Esteban et al. 2004;Bartolommei et al. 2008). Camera trapping implies relativelylow costs (Cutler and Swann 1999), involves minimalenvironmental disturbance (Silveira et al. 2003), is non-invasive and is applicable in a wide range of habitat andclimate conditions where other field methods are likely tofail (O'Brien et al. 2003; Silveira et al. 2003).
This method has been widely used to estimate popula-tion density applying capture–recapture models for speciesin which individual recognition is possible, e.g. tiger(Panthera tigris, Karanth and Nichols 1998), jaguar(Panthera onca, Wallace et al. 2003), ocelot (Leoparduspardalis, Trolle and Kéry 2003). When individuals cannotbe distinguished from photographs, a potential applicationof camera trapping is to interpret the trap rate (photographsper unit time) as an index of population abundance (e.g.Carbone et al. 2001). The problem with this approach isthat factors other than abundance influence the trap rate,potentially confounding this interpretation. However, re-cently Rowcliffe et al. (2008) developed a method forestimating animal density using camera traps without theneed for individual recognition, based on modellingrandom encounters between animals and cameras, account-ing for all variables affecting trap rate. This method hasbeen tested in a wild forest ungulate, Harvey's duiker(Cephalophus harveyi), by Rovero and Marshall (2009),who found that the random encounter model (REM) gavehigher estimated abundance than transect survey estimatesin the same area. However, the degree of overestimation bythe random encounter approach, or conversely underesti-mation by transects, remains unclear, and further field testsof the approach are needed.
As well as providing information on abundance, cameratrapping also allows the collection of additional informationon species behaviour, population structure, distribution andhabitat use (Di Bitetti et al. 2006; Varma et al. 2006). The pinemarten can be found primarily in well-structured deciduousand coniferous forests (Delibes 1983; Buskirk 1992), but insouthern Europe, this mustelid seems to show greatecological plasticity, its presence having been reported incoppices, the Mediterranean maquis and cultivated land withforest fragments (De Marinis and Massetti 1993; Pittiglio1996). Nonetheless, pine martens strongly avoid openhabitats (Storch et al. 1990; Brainerd and Rolstad 2002)and are believed to need a minimum woodland area tosurvive, about 2 km2 for the temperate zone (Zalewski andJedrzejewski 2006).
The aims of this study were, first, to estimate the abundanceof European pine martens in central Italy using the random
encounter model of Rowcliffe et al. (2008) and to assesswhether this estimate is within the range of densitiespreviously reported for this species. Second, we aimed toobtain more information on the habitat use patterns of pinemartens in central Italy using camera trapping.
Materials and methods
Study area
This study was carried out in La Selva Forest (43°13′ N,11°4′ E), located 45 km from Siena, in central Italy. Thestudy area covers 18 km2, mainly consisting of deciduousforest of the middle European or sub-Mediterranean zone,with slight anthropic alterations. The major vegetation typesin La Selva are oak forest dominated by Quercus cerris,planted and self-sown exotic forest dominated by coniferplantation, evergreen oak matorrall and cultivated areas.There are also small anthropic areas, small lakes andreservoirs. The altitude ranges from 350 to 700 masl. Theclimate is Mediterranean, with warm dry summers and coolwet winters. Mean monthly temperature is about 23°C insummer and about 4°C in winter, with average annual rainfallof about 750–1,600 mm per year (D.R.E.Am. s.c 1993).
Among the competitors and predators of pine martens,other meso-mammals are stone marten (Martes foina) as afood competitor (Powell and Zielinski 1983) and fox(Vulpes vulpes) as both predator and food competitor(Lindström et al. 1995). During the sampling period,hunting was officially closed. Illegal hunting occurredoccasionally.
Sampling
To detect martens, we used 15 Cuddebuck Capture 3.0camera traps, providing 3-megapixel fully automatic digitalcameras with flash and 2 GB SD card, linked to passiveinfrared heat and motion detectors. We set all cameras torecord date and time when triggered. Cameras were placedon trees at a height of approximately 0–50 cm above theground using cords and were locked with chains andpadlocks to prevent theft. Cameras were not baited (Rowcliffeet al. 2008).
Following Karanth and Nichols (2002), we divided thearea into six 3-km2 units and deployed the 15 cameras for15 days within each unit between 2 March and 2 June 2009,giving a total of 90 placements and a maximum possibletotal of 1,350 camera days. According to Rowcliffe et al.(2008), the trapping period was relatively brief and was notcoincident to the mating season (Genovesi and De Marinis2003) nor to periods of high anthropic disturbance (e.g.hunting). This choice was made to meet closure assumption
166 Acta Theriol (2012) 57:165–172
as far as possible, thus minimizing animal movement (dueto mating and dispersal), mortality and displacementsrelated to human disturbance.
To determine spacing between cameras, the density ofplacements was calculated as the ratio between the number ofcamera positions (90) and the size of the entire study area(18 km2), and the inverse of the square root of this was usedto give an approximate distance between placements(0.44 km). We then set placements out on the study site,drawn on a digital map of the habitats based on an aerialphoto (1:50,000, CGR 2001) and from a vegetation map(1:15,000, 1997). Six main habitat types were recognised: (1)oak woodland (67.5%)—Q. cerris and Quercus pubescens—with abundant scrub cover; (2) scrub (7.2%)—mainly Rubussp., blackthorn Prunus spinosa and hawthorn Crataegusmonogyna, constituting hedges between fields and alongroads or covering uncultivated fields; (3) human-madewoodland (11%)—plantations dominated by Pinus sp. andCastanea sativa; (4) cultivated fields (13.3%)—mainlysowed with cereals (mostly wheat) and legumes (mostlybroad beans); (5) anthropic areas (0.7%)—areas usually oroccasionally occupied by humans and (6) artificial lakes(0.3%)—small artificial lakes used for irrigation. In each unitarea cameras were positioned following a stratified proce-dure. First the area of every habitat type inside each unit wascalculated, and the number of placements in each habitattype (excluding lakes) was then allocated proportionally tohabitat area. Camera positions were initially localizedrandomly inside each habitat type, using a georeferred aerialphoto (UTM-WGS 84), respecting the distance betweencameras necessary to obtain maximum coverage area. Thenthe points were downloaded into GPS for positioning infield. When camera positions previously chosen were notsuitable for the right location in the field, we tried to find thenearest suitable camera location, maintaining 0.44 kmspacing between cameras stations. We defined an unsuitableposition as a location where vertical structure (e.g. tree orwooded pole) was absent for fixing camera at 50 cm aboveground. All new locations were recorded in the field usingGPS and again downloaded onto the digital map.
Cameras were set to take pictures 24 h per day, and thedelay period between photographs was set at 5 min. Thiswaiting period provides a balance between maintainingcontinuous sampling and avoiding multiple records from asingle effective contact, repeatedly triggering the trap whilecrossing the detection zone (Henschel and Ray 2003). Thecameras were checked first the day after placement to verifythat all cameras were properly working and then every7 days to download photos and replace batteries. When,occasionally, batteries ran flat before they had been replaced,the time of the last exposure was determined from thedownloaded photographs and the gap in sampling periodremoved before analysis. To verify if the number of marten
pictures was related to time of day, the 24-h period wasdivided into 6-h time intervals (0400–1000, 1000–1600,1600–2200 and 2200–0400 hours) and the number of picturesobtained in each interval was calculated.
In order to test whether the occurrence or frequency ofmarten pictures were related to habitat types around thecameras, buffers of 200 and 50 m radius were built aroundeach camera position and the percentage coverage of habitattypes in each buffer was calculated. We chose buffers of 200 mradius (approximately half the distance between cameras) inorder to illustrate the influence of habitat at a large scale andbuffers of 50 m radius to illustrate finer scale habitatassociations. Camera positions and habitat data were analysedusing the software ArcGIS 9.2 ® (ESRI) along with itsextensions animal Movement (Hooge and Eichenlaub 2000),Home Range (Rodgers and Carr 2002) and XTool (DeLaune2003).
Data analysis
In order to convert camera-trapping rates to density ofpine marten, we used the equation D ¼ y
t � pvr 2þqð Þ from
Rowcliffe et al. (2008), where y is the number of photorecords and t is the total camera deployment time. The sensordetection zone parameters of cameras (detection distance rand detection arc θ) were measured with a series of trials inwhich the camera was approached, at varying speeds andfrom different directions, by a leashed domestic cat, similarin body mass to a pine marten. To calculate r, the cat wasmoved towards the camera, starting from a distance of 15 muntil the sensor detected the animal (30 trials). Detectiondistance averaged 8 m. To calculate arc θ, the cat was movedperpendicularly at a distance of 8 m to the camera (20 trials)to define the boundaries of the detection zone. Detection arcwas estimated as 0.175 radians. Although we have radio-tracked pine martens in our study area, fixes were taken onlydaily giving us no information on the daily distance moved.We therefore used Zalewski and colleagues' (2004) estimateof day range, v, for pine martens in Poland. Fourteen radio-collared pine martens were tracked in Białowieża NationalPark for a period of 70 continuous sessions of 24 h, takingfixes every 15 min (Zalewski et al. 2004). The daily sum ofstraight line distances between consecutive locations wasthen scaled up by a factor of 2.2, which the authors found todescribe the relationship between true distance moved fromsnow tracking and apparent distance moved between 15-mininterval fixes (Zalewski et al. 2004). Day range (v) averaged12 km day−1. The pine marten is a solitary mammal (Powell2001), thus we assume a group size (g) of 1. A confidenceinterval for marten population density was calculated bynonparametric bootstrapping (Rowcliffe et al. 2008). Analyseswere performed using the software R 2.9.1 (R DevelopmentCore Team 2009).
Acta Theriol (2012) 57:165–172 167
Chi-squared tests were used to verify whether thenumber of pictures differed significantly between the 15-day survey periods allocated to each sampling unit orbetween 6-h time intervals. The relationship between thefrequency of marten pictures and the habitat types presentin the buffer was defined by Spearman correlation analysis.The occurrence of marten pictures (presence/absence) wascorrelated with the habitat types present around the camerasby binary logistic regression (Tabachnick and Fidell 2001).The contribution of each variable to the model was testedusing the Wald test. We calculated Nagelkerke R2 as agoodness-of-fit measure, and departure from the logisticmodel was assessed through the Hosmer–Lemeshow test onthe model (Tabachnick and Fidell 2001). The independenceof covariates (percentage of habitat types) was tested byPearson correlation. All probabilities were two-tailed, andthe null hypothesis was rejected with alpha=0.05. Theseanalyses were carried out using the software SPSS 16.0®(SPSS Inc. 2008, USA).
Results
Between March and June 2009, a total of 38 pine marten'spictures were obtained in the study area. Only photos withthe entire animals were considered to ensure a clear speciesrecognition, eight photographs for which the species recog-nition was uncertain were discarded from the database.Thirty pictures of pine martens were used for the analysis.The total number of trap days was 1334. The mean rate oftrap success was 0.33 photographs per camera placement(SD=0.67; min=0, max=3). Pine martens were captured inall of the six sampling units and in 22 of the 90 camera trapplacements (24.44%).
Estimated pine marten population density in La SelvaForest was 0.34 km−2 (CI 95%, 0.21–0.47). The rate oftrapping success did not differ significantly between thesampling units monitored in each 15-day survey period(χ2=9.22, df=5, P=0.101; Table 1).
The number of pictures differed significantly with time ofday (χ2=27.33, df=3, P=0.001). The number of picturesobtained was fewer than expected (7.5) for 0400–1000 and
1000–1600 hours time periods (n=2 and n=1, respectively),approximately as expected during the 1600–2200 hoursperiod (n=8) and much more abundant than expected during2200–0400 hours period (n=19). This indicates that martensat this study site are primarily but not exclusively nocturnal.
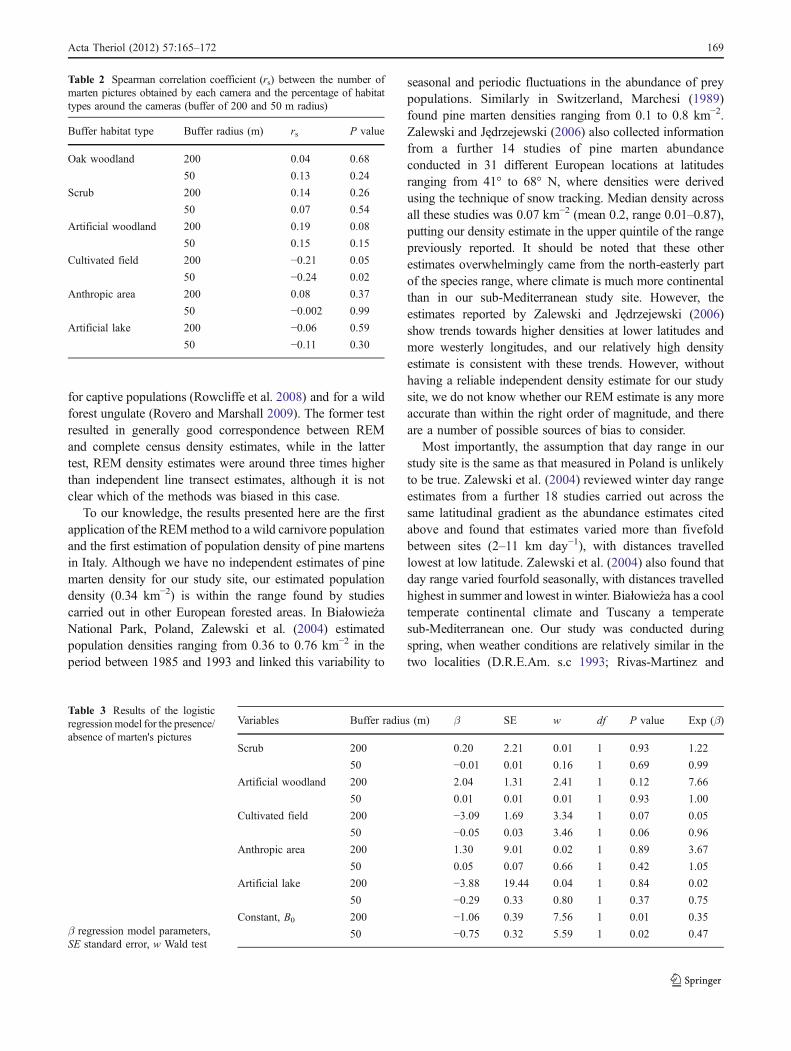
A weak negative association was found between thenumber of marten pictures and the coverage of cultivatedfields for both buffer sizes (200 and 50 m radius, Table 2).For 200-m radius buffers, a weak positive association wasfound between the number of marten pictures and theartificial (coniferous) woodland, although this trend was notsignificant (Table 2).
Tests for independence of habitat covariates show similarresults for both buffer sizes. Coverage of oak woodland wasnegatively correlated with scrub (200 m radius: r=−0.26,P≤0.05; 50 m radius: r=−0.50, P≤0.01), with human-madewoodland (200 m radius: r=−0.45, P≤0.001; 50 m radius:r=−0.55, P≤0.001) and with cultivated field (200 m radius:r=−0.66, P≤0.001; 50 m radius: r=−0.47, P≤0.001), butassociations between other habitats were weak. To excluderelated covariates from the binary logistic model analysis,we did not consider oak woodland in habitat associations.
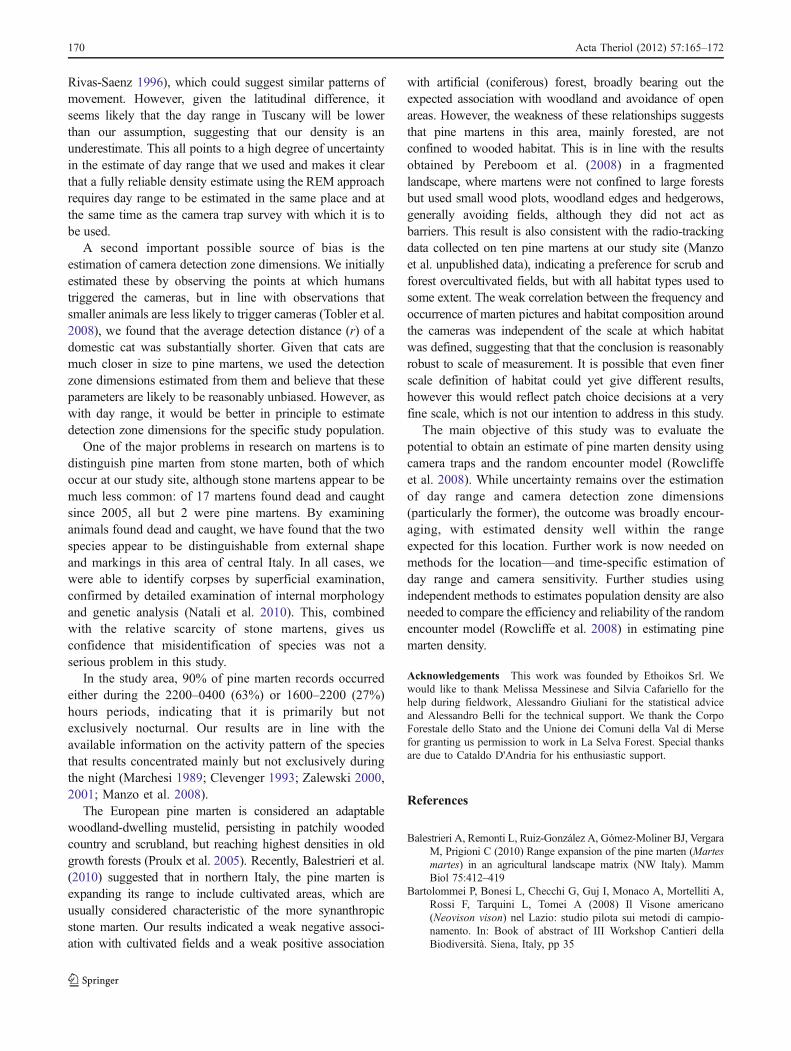
For both coarser and finer habitat scales, no significantcorrelation was found between presence/absence of martenpictures and habitat types around the camera. However, forboth buffer sizes, there were trends towards lower proba-bility of records at locations with high coverage ofcultivated fields, whereas only for 200-m radius buffers, ahigher probability of records at locations with highcoverage of human-made woodland was found (Table 3).The Hosmer–Lemeshow test showed that predicted andobserved probabilities fitted at an acceptable level (χ2=2.83, df=5, P=0.73), although the model explained little ofthe variation in the data (R2=0.16).
Discussion
Our results show how the estimation of pine martenpopulation density is possible using the REM (Rowcliffeet al. 2008) applied to camera-trapping data. This methodhas so far been tested against independent density estimates
Sampling unit Survey period Trap days N of marten pictures Pictures per 100 days
A March 2 to 17 220 5 2.3
B March 17 to April 1 221 10 4.5
C April 1 to 16 219 3 1.4
D April 16 to May 1 224 5 2.2
E May 1 to 16 225 6 2.7
F May 16 to June 1 225 1 0.4
Table 1 A comparison of martentrapping rates between sequen-tially surveyed sampling units
168 Acta Theriol (2012) 57:165–172
for captive populations (Rowcliffe et al. 2008) and for a wildforest ungulate (Rovero and Marshall 2009). The former testresulted in generally good correspondence between REMand complete census density estimates, while in the lattertest, REM density estimates were around three times higherthan independent line transect estimates, although it is notclear which of the methods was biased in this case.
To our knowledge, the results presented here are the firstapplication of the REMmethod to a wild carnivore populationand the first estimation of population density of pine martensin Italy. Although we have no independent estimates of pinemarten density for our study site, our estimated populationdensity (0.34 km−2) is within the range found by studiescarried out in other European forested areas. In BiałowieżaNational Park, Poland, Zalewski et al. (2004) estimatedpopulation densities ranging from 0.36 to 0.76 km−2 in theperiod between 1985 and 1993 and linked this variability to
seasonal and periodic fluctuations in the abundance of preypopulations. Similarly in Switzerland, Marchesi (1989)found pine marten densities ranging from 0.1 to 0.8 km−2.Zalewski and Jędrzejewski (2006) also collected informationfrom a further 14 studies of pine marten abundanceconducted in 31 different European locations at latitudesranging from 41° to 68° N, where densities were derivedusing the technique of snow tracking. Median density acrossall these studies was 0.07 km−2 (mean 0.2, range 0.01–0.87),putting our density estimate in the upper quintile of the rangepreviously reported. It should be noted that these otherestimates overwhelmingly came from the north-easterly partof the species range, where climate is much more continentalthan in our sub-Mediterranean study site. However, theestimates reported by Zalewski and Jędrzejewski (2006)show trends towards higher densities at lower latitudes andmore westerly longitudes, and our relatively high densityestimate is consistent with these trends. However, withouthaving a reliable independent density estimate for our studysite, we do not know whether our REM estimate is any moreaccurate than within the right order of magnitude, and thereare a number of possible sources of bias to consider.
Most importantly, the assumption that day range in ourstudy site is the same as that measured in Poland is unlikelyto be true. Zalewski et al. (2004) reviewed winter day rangeestimates from a further 18 studies carried out across thesame latitudinal gradient as the abundance estimates citedabove and found that estimates varied more than fivefoldbetween sites (2–11 km day−1), with distances travelledlowest at low latitude. Zalewski et al. (2004) also found thatday range varied fourfold seasonally, with distances travelledhighest in summer and lowest in winter. Białowieża has a cooltemperate continental climate and Tuscany a temperatesub-Mediterranean one. Our study was conducted duringspring, when weather conditions are relatively similar in thetwo localities (D.R.E.Am. s.c 1993; Rivas-Martinez and
Table 2 Spearman correlation coefficient (rs) between the number ofmarten pictures obtained by each camera and the percentage of habitattypes around the cameras (buffer of 200 and 50 m radius)
Buffer habitat type Buffer radius (m) rs P value
Oak woodland 200 0.04 0.68
50 0.13 0.24
Scrub 200 0.14 0.26
50 0.07 0.54
Artificial woodland 200 0.19 0.08
50 0.15 0.15
Cultivated field 200 −0.21 0.05
50 −0.24 0.02
Anthropic area 200 0.08 0.37
50 −0.002 0.99
Artificial lake 200 −0.06 0.59
50 −0.11 0.30
Variables Buffer radius (m) β SE w df P value Exp (β)
Scrub 200 0.20 2.21 0.01 1 0.93 1.22
50 −0.01 0.01 0.16 1 0.69 0.99
Artificial woodland 200 2.04 1.31 2.41 1 0.12 7.66
50 0.01 0.01 0.01 1 0.93 1.00
Cultivated field 200 −3.09 1.69 3.34 1 0.07 0.05
50 −0.05 0.03 3.46 1 0.06 0.96
Anthropic area 200 1.30 9.01 0.02 1 0.89 3.67
50 0.05 0.07 0.66 1 0.42 1.05
Artificial lake 200 −3.88 19.44 0.04 1 0.84 0.02
50 −0.29 0.33 0.80 1 0.37 0.75
Constant, B0 200 −1.06 0.39 7.56 1 0.01 0.35
50 −0.75 0.32 5.59 1 0.02 0.47
Table 3 Results of the logisticregressionmodel for the presence/absence of marten's pictures
β regression model parameters,SE standard error, w Wald test
Acta Theriol (2012) 57:165–172 169
Rivas-Saenz 1996), which could suggest similar patterns ofmovement. However, given the latitudinal difference, itseems likely that the day range in Tuscany will be lowerthan our assumption, suggesting that our density is anunderestimate. This all points to a high degree of uncertaintyin the estimate of day range that we used and makes it clearthat a fully reliable density estimate using the REM approachrequires day range to be estimated in the same place and atthe same time as the camera trap survey with which it is tobe used.
A second important possible source of bias is theestimation of camera detection zone dimensions. We initiallyestimated these by observing the points at which humanstriggered the cameras, but in line with observations thatsmaller animals are less likely to trigger cameras (Tobler et al.2008), we found that the average detection distance (r) of adomestic cat was substantially shorter. Given that cats aremuch closer in size to pine martens, we used the detectionzone dimensions estimated from them and believe that theseparameters are likely to be reasonably unbiased. However, aswith day range, it would be better in principle to estimatedetection zone dimensions for the specific study population.
One of the major problems in research on martens is todistinguish pine marten from stone marten, both of whichoccur at our study site, although stone martens appear to bemuch less common: of 17 martens found dead and caughtsince 2005, all but 2 were pine martens. By examininganimals found dead and caught, we have found that the twospecies appear to be distinguishable from external shapeand markings in this area of central Italy. In all cases, wewere able to identify corpses by superficial examination,confirmed by detailed examination of internal morphologyand genetic analysis (Natali et al. 2010). This, combinedwith the relative scarcity of stone martens, gives usconfidence that misidentification of species was not aserious problem in this study.
In the study area, 90% of pine marten records occurredeither during the 2200–0400 (63%) or 1600–2200 (27%)hours periods, indicating that it is primarily but notexclusively nocturnal. Our results are in line with theavailable information on the activity pattern of the speciesthat results concentrated mainly but not exclusively duringthe night (Marchesi 1989; Clevenger 1993; Zalewski 2000,2001; Manzo et al. 2008).
The European pine marten is considered an adaptablewoodland-dwelling mustelid, persisting in patchily woodedcountry and scrubland, but reaching highest densities in oldgrowth forests (Proulx et al. 2005). Recently, Balestrieri et al.(2010) suggested that in northern Italy, the pine marten isexpanding its range to include cultivated areas, which areusually considered characteristic of the more synanthropicstone marten. Our results indicated a weak negative associ-ation with cultivated fields and a weak positive association
with artificial (coniferous) forest, broadly bearing out theexpected association with woodland and avoidance of openareas. However, the weakness of these relationships suggeststhat pine martens in this area, mainly forested, are notconfined to wooded habitat. This is in line with the resultsobtained by Pereboom et al. (2008) in a fragmentedlandscape, where martens were not confined to large forestsbut used small wood plots, woodland edges and hedgerows,generally avoiding fields, although they did not act asbarriers. This result is also consistent with the radio-trackingdata collected on ten pine martens at our study site (Manzoet al. unpublished data), indicating a preference for scrub andforest overcultivated fields, but with all habitat types used tosome extent. The weak correlation between the frequency andoccurrence of marten pictures and habitat composition aroundthe cameras was independent of the scale at which habitatwas defined, suggesting that that the conclusion is reasonablyrobust to scale of measurement. It is possible that even finerscale definition of habitat could yet give different results,however this would reflect patch choice decisions at a veryfine scale, which is not our intention to address in this study.
The main objective of this study was to evaluate thepotential to obtain an estimate of pine marten density usingcamera traps and the random encounter model (Rowcliffeet al. 2008). While uncertainty remains over the estimationof day range and camera detection zone dimensions(particularly the former), the outcome was broadly encour-aging, with estimated density well within the rangeexpected for this location. Further work is now needed onmethods for the location—and time-specific estimation ofday range and camera sensitivity. Further studies usingindependent methods to estimates population density are alsoneeded to compare the efficiency and reliability of the randomencounter model (Rowcliffe et al. 2008) in estimating pinemarten density.
Acknowledgements This work was founded by Ethoikos Srl. Wewould like to thank Melissa Messinese and Silvia Cafariello for thehelp during fieldwork, Alessandro Giuliani for the statistical adviceand Alessandro Belli for the technical support. We thank the CorpoForestale dello Stato and the Unione dei Comuni della Val di Mersefor granting us permission to work in La Selva Forest. Special thanksare due to Cataldo D'Andria for his enthusiastic support.
References
Balestrieri A, Remonti L, Ruiz-González A, Gómez-Moliner BJ, VergaraM, Prigioni C (2010) Range expansion of the pine marten (Martesmartes) in an agricultural landscape matrix (NW Italy). MammBiol 75:412–419
Bartolommei P, Bonesi L, Checchi G, Guj I, Monaco A, Mortelliti A,Rossi F, Tarquini L, Tomei A (2008) Il Visone americano(Neovison vison) nel Lazio: studio pilota sui metodi di campio-namento. In: Book of abstract of III Workshop Cantieri dellaBiodiversità. Siena, Italy, pp 35
170 Acta Theriol (2012) 57:165–172
Brainerd SM, Rolstad J (2002) Habitat selection by Eurasian pinemartens Martes martes in managed forests of Southern borealScandinavia. Wildl Biol 8:289–297
Buskirk SW (1992) Conserving circumboreal forests for martens andfishers. Conserv Biol 6:318–320
Carbone C, Christie S, Coulson T, Franklin N, Ginsberg JR, Griffiths M,Holden J, Kawanishi K, Kinnaird MF, Laidlaw R, Lynam A,Macdonald DW, Martyr D, McDougal C, Nath L, Obrien T,Seidensticker J, Smith DJL, Sunquist M, Tilson R, Wan ShahruddinWN (2001) The use of photographic rates to estimate densities oftigers and other cryptic mammals. Anim Conserv 4:75–79
Clevenger A (1993) Pine marten comparative feeding ecology in anisland and mainland population of Spain. Z Saugetierk 58:212–224
Cutler TL, Swann DE (1999) Using remote photography in wildlifeecology: a review. Wildl Soc Bull 27:571–581
D.R.E.Am. s.c. (1993) Piano di gestione dei complessi forestaliregionali “La Selva” e “Le Carline”. Report for the RadicondoliMunicipality, Siena, Italy, pp 15–17
De Marinis AM, Massetti M (1993) Pine marten Martes martes on theisland of Elba. Small Carniv Conserv IUCN 8:13
DeLaune MG (2003) XTools ArcView Extension (Version 15/09/2003).http://arcscripts.esri.com/details.asp?dbid=11526. Accessed 3 June2009
Delibes M (1983) Interspecific competition and the habitat of thestone marten Martes foina (Erxleben 1777). Eur Acta Zool Fenn174:229–231
R Development Core Team (2009) R: A language and environment forstatistical computing. R Foundation for Statistical Computing,Vienna, Austria. ISBN 3-900051-07-0, URL http://www.R-project.org.
Di Bitetti MS, Paviolo A, De Angelo C (2006) Density, habitat useand activity patterns of ocelots Leopardus pardalis in the Atlanticforest of Misiones, Argentina. J Zool 270:153–163
Genovesi P, De Marinis AM (2003) Martes martes. In: Boitani L, LovariS, Vigna Taglianti A (eds) Fauna d'Italia Vol. XXXVIII, MammaliaIII, Carnivora-Artiodactyla. Calderini, Bologna, pp 104–113
Gompper ME, Kays RW, Ray JC, LaPoint SD, Bogan DA, Cryan JA(2006) A comparison of non-invasive techniques to surveycarnivore communities in Northeastern North America. WildlSoc Bull 34:1142–1151
González-Esteban J, Villate I, Irizar I (2004) Assessing camera trapsfor surveying the European mink, Mustela lutreola (Linnaeus,1761), distribution. Eur J Wildl Res 50:33–36
Henschel P, Ray J (2003) Leopards in African rainforests: survey andmonitoring techniques. WCS Global Carnivore Program. WildlConserv Soc, New York
Hooge PN, Eichenlaub B (2000) Animal movement extension toArcview. ver. 2.0. Alaska Science Center—Biological ScienceOffice, US Geological Survey, Anchorage
Jackson RM, Roe JD, Wangchuk R, Hunter DO (2006) Estimatingsnow leopard abundance using photographic identification andcapture-recapture techniques. Wildl Soc Bull 34:772–781
Karanth KU, Nichols JD (1998) Estimation of tiger densities in Indiausing photographic captures and recaptures. Ecology 79:2852–2862
Karanth KU, Nichols JD (2002) Monitoring tigers and their prey: amanual for researchers, managers and conservationists in tropicalAsia. Centre for wildlife studies, Bangalore
Kelly MJ, Holub EL (2008) Camera trapping of carnivores: trapsuccess among camera types and across species, and habitatselection by species, on Salt Pond Mountain, Giles County,Virginia. Northeast Nat 15:249–262
Lindström ER, Brainerd SM, Helldin JO, Overskaug K (1995) Pinemarten–red fox interactions: a case of intraguild predation? AnnZool Fenn 32:123–130
Manzo E, Bartolommei P, Cozzolino R, Gentile G, Magrini C (2008)Activity patterns of the Pine marten (Martes martes) in a
Mediterranean woodland: evaluation of preliminary data. In: Bookof Abstract of 26thMustelid Colloquium. Budapest, Hungary, pp 43
Marchesi P (1989) Écologie et comportemant de la martre (Martesmartes L.) dans le Jura Suisse. PhD thesis, Université deNeuchâtel. Neuchâtel
Natali C, Banchi E, Ciofi C, Manzo E, Bartolommei P, Cozzolino R(2010) Characterization of 13 polymorphic microsatellite loci inthe European pine marten Martes martes. Conserv Genet Resour2:397–399
O'Brien TG, Kinnaird MF, Wibisono HT (2003) Crouching tigers,hidden prey: Sumatran tiger and prey populations in a tropicalforest landscape. Anim Conserv 6:131–139
PereboomV,MergeyM, Villerette N, Helder R, Gerard JF, Lode T (2008)Movement patterns, habitat selection, and corridor use of a typicalwoodland-dweller species, the European pine marten (Martesmartes), in fragmented landscape. Can J Zool 86:983–991
Pittiglio C (1996) Analisi comparativa di uso e selezione dell'habitatdella faina e della martora in condizioni di simpatria. Masterthesis, Università degli Studi di Roma La Sapienza, Rome
Powell RA (2001) Weasel and skunk families. In: Macdonald D (ed)The new encyclopaedia of mammals. Oxford University Press,Oxford, pp 106–107
Powell RA, Zielinski WJ (1983) Competition and coexistence inmustelid communities. Acta Zool Fenn 174:223–227
Proulx G, Aubry K, Birks J, Buskirk S, Fortin C, Frost H, Krohn W,Mayo L, Monakhov V, Payer D, Saeki M, Santos-ReisM,Weir R,Zielinski W (2005) World distribution and status of the genusMartes in 2000. In: Harrison DJ, Fuller AK, Proulx G (eds)Martens and fishers (Martes) in human-altered environments: aninternational perspective. Springer, New York, pp 22–76
Rivas-Martinez S, Rivas-Saenz S (1996–2009) Worldwide BioclimaticClassification System. Phytosociological Research Center, Spain.http://www.globalbioclimatics.org. Accessed 25 May 2011
Rodgers AR, Carr AP (2002) Home range extension (HRE) forArcView GIS. Ontario Ministry of Natural Resources' Centre forNorthern Forest Ecosystem Research, Thunder Bay. http://www.blueskytelemetry.co.uk/downloads.asp. Accessed 1 Feb 2009
Rovero F, Marshall AR (2009) Camera trapping photographic rate as anindex of density in forest ungulates. J Appl Ecol 46:1011–1017
Rowcliffe JM, Carbone C (2008) Surveys using camera traps: are welooking to a brighter future? Anim Conserv 11:185–186
Rowcliffe JM, Field J, Turvey ST, Carbone C (2008) Estimatinganimal density using camera traps without the need for individualrecognition. J Appl Ecol 45:1228–1236
Silveira L, Jacomo ATA, Diniz-Filho JAF (2003) Camera trap, linetransect census and track surveys: a comparative evaluation. BiolConserv 114:351–355
Storch I, Lindström ER, de Jounge J (1990) Diet and habitat selectionof the pine marten in relation to competition with the red fox.Acta Theriol 35:311–320
Tabachnick BG, Fidell LS (2001) Using multivariate statistics, 4thedn. Allyn and Bacon, London
Tobler MW, Carrillo-Percastegui SE, Leite Pitman R, Mares R, PowellG (2008) Further notes on the analysis of mammal inventory datacollected with camera traps. Anim Conserv 11:187–189
Trolle M, Kéry M (2003) Estimation of ocelot density in the Pantanalusing capture–recapture analysis of camera-trapping data. JMammal 84:607–614
Varma S, Pittet A, Jamadagni HS (2006) Experimenting usage of camera-traps for population dynamics study of the Asian elephant Elephasmaximus in Southern India. Curr Sci (Bangalore) 91:324–331
Wallace RB, Gomez H, Ayala G, Espinoza F (2003) Camera trappingfor jaguar (Panthera onca) in the Tuichi Valley. J Neotr Mammal(Bolivia) 10:133–139
Williams BK, Nichols JD, Conroy MJ (2002) Analisys and managementof animal populations. Academic Press, London
Acta Theriol (2012) 57:165–172 171

Zalewski A (2000) Factors affecting the duration of activity by pinemartens (Martes martes) in the Białowieza National Park,Poland. J Zool 251:439–447
Zalewski A (2001) Seasonal and sexual variation in diel activityrhythms of pine marten Martes martes in the Białowieza NationalPark (Poland). Acta Theriol 46:295–304
Zalewski A, JedrzejewskiW (2006) Spatial organisation and dynamics ofthe pine marten Martes martes population in Białowieza Forest
compared with other European woodlands. Ecography 29:31–43
Zalewski A, Jedrzejewski W, Jedrzejewska B (2004) Mobility andhome range use by pine martens (Martes martes) in a Polishprimeval forest. Ecoscience 11:113–122
Zielinski WJ, Kucera TE, Barrett RH (1995) Current distribution ofthe fisher,Martes pennati, in California. Calif Fish Game 81:104–112
172 Acta Theriol (2012) 57:165–172