Embed Size (px)
Citation preview
Even-texturedpore space
500 mm
Even-texturedcarbonate cement
Carbonatecement
500 mm
QAd4360(a)x
7100
7200
7300
3
Sequence L1
HFS L2.0,Sequence L2
1 2 3 4
ARFN0 100
30 0Depth(ft)
0
1000 0.1
1000 0.130
GR (API)
Core porosity(%)
Wireline logporosity
(%)
Core permeability(md)
Rock-fabricpermeability
(md)
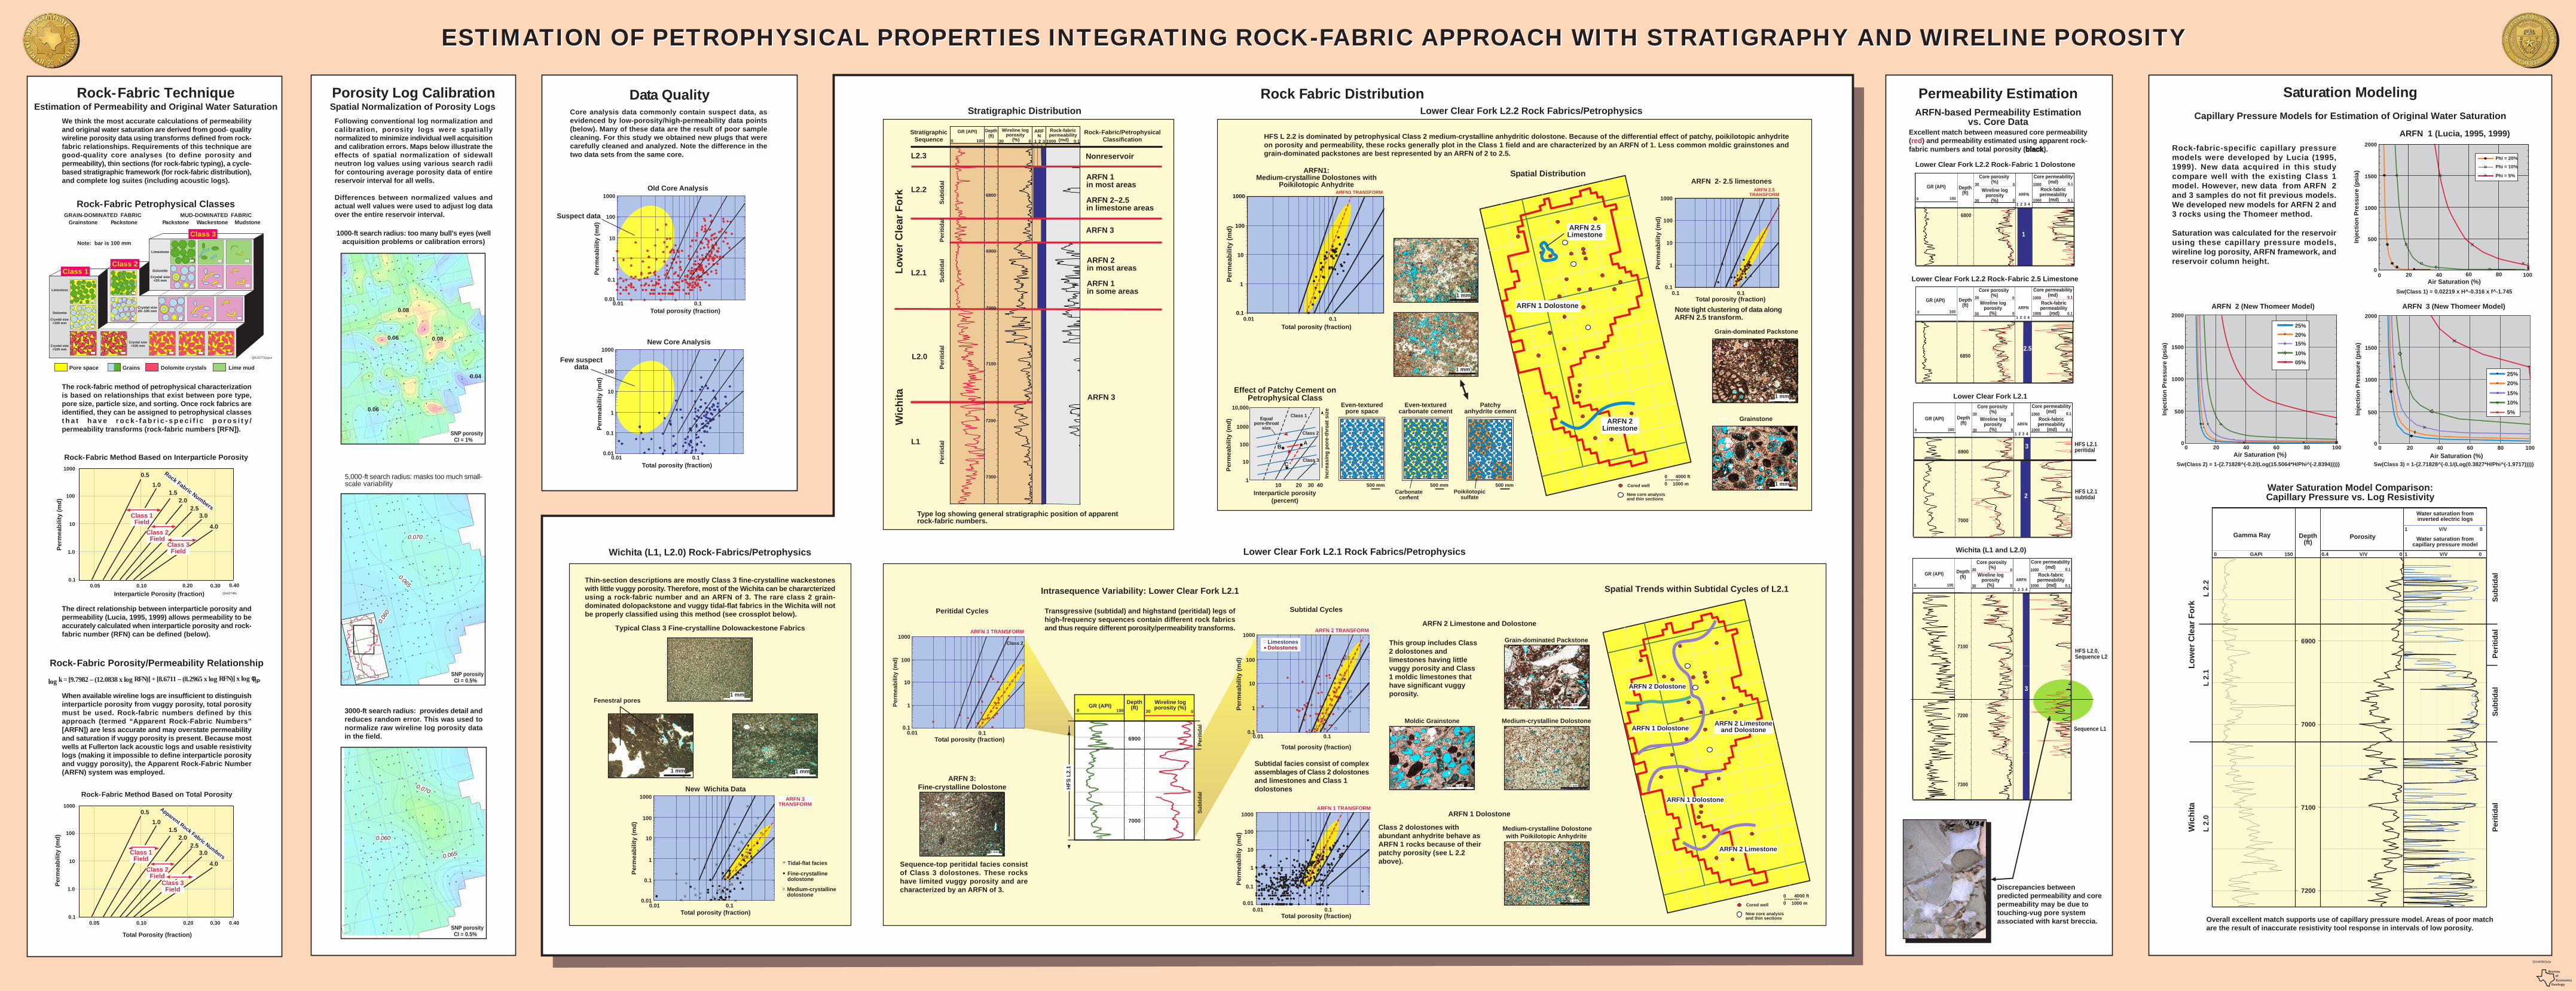
Excellent match between measured core permeability(red) and permeability estimated using apparent rock-fabric numbers and total porosity (black).
Capillary Pressure Models for Estimation of Original Water Saturation
Discrepancies betweenpredicted permeability and corepermeability may be due totouching-vug pore systemassociated with karst breccia.
Rock-fabric-specific capillary pressuremodels were developed by Lucia (1995,1999). New data acquired in this studycompare well with the existing Class 1model. However, new data from ARFN 2and 3 samples do not fit previous models.We developed new models for ARFN 2 and3 rocks using the Thomeer method.
Saturation was calculated for the reservoirusing these capillary pressure models,wireline log porosity, ARFN framework, andreservoir column height.
Overall excellent match supports use of capillary pressure model. Areas of poor matchare the result of inaccurate resistivity tool response in intervals of low porosity.
When available wireline logs are insufficient to distinguishinterparticle porosity from vuggy porosity, total porositymust be used. Rock-fabric numbers defined by thisapproach (termed “Apparent Rock-Fabric Numbers”[ARFN]) are less accurate and may overstate permeabilityand saturation if vuggy porosity is present. Because mostwells at Fullerton lack acoustic logs and usable resistivitylogs (making it impossible to define interparticle porosityand vuggy porosity), the Apparent Rock-Fabric Number(ARFN) system was employed.
We think the most accurate calculations of permeabilityand original water saturation are derived from good- qualitywireline porosity data using transforms defined from rock-fabric relationships. Requirements of this technique aregood-quality core analyses (to define porosity andpermeability), thin sections (for rock-fabric typing), a cycle-based stratigraphic framework (for rock-fabric distribution),and complete log suites (including acoustic logs).
Rock-Fabric Technique
Water Saturation Model Comparison:Capillary Pressure vs. Log Resistivity
Lower Clear Fork L2.2 Rock Fabrics/Petrophysics
Lower Clear Fork L2.1 Rock Fabrics/Petrophysics
Saturation ModelingPermeability Estimation
ESTIMATION OF PETROPHYSICAL PROPERTIES INTEGRATING ROCK-FABRIC APPROACH WITH STRATIGRAPHY AND WIRELINE POROSITY
Porosity Log Calibration Rock Fabric Distribution
Following conventional log normalization andcalibration, porosity logs were spatiallynormalized to minimize individual well acquisitionand calibration errors. Maps below illustrate theeffects of spatial normalization of sidewallneutron log values using various search radiifor contouring average porosity data of entirereservoir interval for all wells.
Differences between normalized values andactual well values were used to adjust log dataover the entire reservoir interval.
ARFN-based Permeability Estimationvs. Core Data
Stratigraphic DistributionData Quality
Spatial Normalization of Porosity Logs
The rock-fabric method of petrophysical characterizationis based on relationships that exist between pore type,pore size, particle size, and sorting. Once rock fabrics areidentified, they can be assigned to petrophysical classest h a t h a v e r o c k - f a b r i c - s p e c i f i c p o r o s i t y /permeability transforms (rock-fabric numbers [RFN]).
The direct relationship between interparticle porosity andpermeability (Lucia, 1995, 1999) allows permeability to beaccurately calculated when interparticle porosity and rock-fabric number (RFN) can be defined (below).
Core analysis data commonly contain suspect data, asevidenced by low-porosity/high-permeability data points(below). Many of these data are the result of poor samplecleaning. For this study we obtained new plugs that werecarefully cleaned and analyzed. Note the difference in thetwo data sets from the same core.
3000-ft search radius: provides detail andreduces random error. This was used tonormalize raw wireline log porosity datain the field.
5,000-ft search radius: masks too much small-scale variability
1000-ft search radius: too many bull’s eyes (wellacquisition problems or calibration errors)
Rock-Fabric Method Based on Total Porosity
log k = [9.7982 – (12.0838 x log RFN)] + [8.6711 – (8.2965 x log RFN)] x log φIP
Rock-Fabric Porosity/Permeability Relationship
0.05 0.10 0.20 0.30 0.400.1
1.0
10
100
1000
Interparticle Porosity (fraction)
1.0
2.0
3.0
QAd2746c
Perm
eabi
lity
(md)
Class 3Field
Class 1Field
0.5
1.5
2.5
4.0
Rock Fabric Numbers
Class 2Field
Rock-Fabric Method Based on Interparticle Porosity 0.01
0.1
1
10
100
1000
0.01 0.1
Perm
eabi
lity
(md)
Total porosity (fraction)
Few suspectdata
New Core Analysis
0.01
0.1
1
10
100
1000
0.01 0.1Total porosity (fraction)
Perm
eabi
lity
(md)
Suspect data
Old Core Analysis
Estimation of Permeability and Original Water Saturation
0.08
0.08
0.06
0.06
0.04
CI = 1%SNP porosity
0 4000 ft0 1000 m
UNIVERSITY LANDS BLOCK 13
PSL BLOCK A-48
PSL BLOCK A-37
PSL BLOCK A-31
PSL BLOCK A-26
Clear Fork Unit
PSL BLOCK A-47
PSL BLOCK A-32
0.070
0.065
0 . 06 0
CI = 0.5%SNP porosity
0.065
0.060
0.070
CI = 0.5%SNP porosity
Nonreservoir
ARFN
GR (API)
0 100
Depth(ft)
Wireline logporosity
(%)30 0
Rock-fabricpermeability
(md)1000 0.1
L
ower
Cle
ar F
ork
Wic
hita
1 2 3
L2.3
L2.2
L2.1
Rock-Fabric/PetrophysicalClassification
StratigraphicSequence
L1
L2.0
6800
6900
7100
7200
7300
ARFN 3
ARFN 1in most areas
ARFN 2–2.5in limestone areas
ARFN 3
ARFN 2in most areas
ARFN 1in some areas
7000
Type log showing general stratigraphic position of apparentrock-fabric numbers.
Subt
idal
Perit
idal
Subt
idal
Perit
idal
Perit
idal
HFS L 2.2 is dominated by petrophysical Class 2 medium-crystalline anhydritic dolostone. Because of the differential effect of patchy, poikilotopic anhydriteon porosity and permeability, these rocks generally plot in the Class 1 field and are characterized by an ARFN of 1. Less common moldic grainstones andgrain-dominated packstones are best represented by an ARFN of 2 to 2.5.
1 mm
Grain-dominated Packstone
ARFN1:Medium-crystalline Dolostones with
Poikilotopic Anhydrite ARFN 2- 2.5 limestones
Note tight clustering of data alongARFN 2.5 transform.
Grainstone
Total porosity (fraction)0.1 0.1
Perm
eabi
lity
(md)
0.1
1
10
100
1000ARFN 2.5
TRANSFORM
Spatial Distribution
Perm
eabi
lity
(md)
Total porosity (fraction)
ARFN1 TRANSFORM
0.1
1
10
100
1000
0.01 0.1
Cored well
New core analysisand thin sections
ARFN 2Limestone
ARFN 1 Dolostone
ARFN 2.5Limestone
1 mm
1 mm
1 mm0 4000 ft
1000 m0
Lower Clear Fork L2.2 Rock-Fabric 1 Dolostone
6800
1
GR (API)
Core porosity(%)
Wireline logporosity
(%)
Core permeability(md)
Rock-fabricpermeability
(md)1 2 3 4
ARFN0 100
30 0Depth(ft)
0
1000 0.1
1000 0.130
Lower Clear Fork L2.1
Wichita (L1 and L2.0)
Lower Clear Fork L2.2 Rock-Fabric 2.5 Limestone
68502.5
GR (API)
Core porosity(%)
Wireline logporosity
(%)
Core permeability(md)
Rock-fabricpermeability
(md)1 2 3 4
ARFN0 100
30 0Depth(ft)
0
1000 0.1
1000 0.130
6900
7000
HFS L2.1peritidal
HFS L2.1subtidal
3
2
1 2 3 4
ARFN0 100
30 0Depth
(ft)0
1000 0.1
1000 0.130
GR (API)
Core porosity(%)
Wireline logporosity
(%)
Core permeability(md)
Rock-fabricpermeability
(md)
ARFN 3TRANSFORM
0.01
0.1
1
10
100
1000
0.01 0.1Total porosity (fraction)
Perm
eabi
lity
(md)
Tidal-flat facies
Fine-crystallinedolostone
Medium-crystallinedolostone
New Wichita Data
Typical Class 3 Fine-crystalline Dolowackestone Fabrics
Thin-section descriptions are mostly Class 3 fine-crystalline wackestoneswith little vuggy porosity. Therefore, most of the Wichita can be chararcterizedusing a rock-fabric number and an ARFN of 3. The rare class 2 grain-dominated dolopackstone and vuggy tidal-flat fabrics in the Wichita will notbe properly classified using this method (see crossplot below).
Wichita (L1, L2.0) Rock-Fabrics/Petrophysics
Fenestral pores
1 mm1 mm
1 mm
Total porosity (fraction)
0.1
Subtidal Cycles
Intrasequence Variability: Lower Clear Fork L2.1 Spatial Trends within Subtidal Cycles of L2.1
ARFN 2 Limestone and Dolostone
ARFN 1 Dolostone
ARFN 2 Dolostone
ARFN 1 Dolostone
ARFN 2 Limestone
ARFN 2 Limestoneand Dolostone
Grain-dominated Packstone
Medium-crystalline Dolostone
1 mm
Medium-crystalline Dolostonewith Poikilotopic Anhydrite
Moldic Grainstone
Subtidal facies consist of complexassemblages of Class 2 dolostonesand limestones and Class 1dolostones
ARFN 3:Fine-crystalline Dolostone
Sequence-top peritidal facies consistof Class 3 dolostones. These rockshave limited vuggy porosity and arecharacterized by an ARFN of 3.
Transgressive (subtidal) and highstand (peritidal) legs ofhigh-frequency sequences contain different rock fabricsand thus require different porosity/permeability transforms.
Class 2 dolostones withabundant anhydrite behave asARFN 1 rocks because of theirpatchy porosity (see L 2.2above).
ARFN 1 Dolostone
This group includes Class2 dolostones andlimestones having littlevuggy porosity and Class1 moldic limestones thathave significant vuggyporosity.
Peritidal Cycles
LimestonesDolostones
HFS
L2.
1
GR (API)0 100
Depth(ft)
Wireline logporosity (%)
030
6900
7000
Perit
idal
Subt
idal
ARFN 1 TRANSFORM
Perm
eabi
lity
(md)
0.01
0.1
1
10
100
1000
0.01 0.1Total porosity (fraction)
ARFN 2 TRANSFORM
0.1
1
10
100
1000
0.01
Perm
eabi
lity
(md)
Class 2
0.1
1
10
100
1000
Total porosity (fraction)
Perm
eabi
lity
(md)
0.01 0.1
ARFN 3 TRANSFORM
1 mm
1 mm1 mm
1 mm
1 mm
0
500
1000
1500
2000
0 20 40 60 80 100
25%20%15%
10%05%
Inje
ctio
n Pr
essu
re (p
sia)
Air Saturation (%)
ARFN 2 (New Thomeer Model)
Sw(Class 2) = 1-{2.71828^(-0.2/(Log(15.5064*H/Phi^(-2.8394))))}
Gamma Ray
GAPI0 150
6900
7000
7100
7200
Depth(ft)
Porosity
V/V0.4 V/V1 0
Water saturation frominverted electric logs
V/V1 0
0
Water saturation fromcapillary pressure model
Wic
hita
Perit
idal
Low
er C
lear
For
k
Perit
idal
Subt
idal
L 2.
0
Subt
idal
L 2.
1L
2.2
Pore space Grains Dolomite crystals
Rock-Fabric Petrophysical Classes
Wackestone
Note: bar is 100 mm
Crystal size>100 mm
Dolomite
Crystal size<100 mm
Crystal size>100 mm
Limestone
Limestone
Crystal size20–100 mm
Dolomite
Crystal size<20 mm
PackstoneGrainstone Packstone MudstoneMUD-DOMINATED FABRICGRAIN-DOMINATED FABRIC
QA15772(a)cx
Class 1Class 2
Class 3
Effect of Patchy Cement onPetrophysical Class
Interparticle porosity(percent)
AB
10,000
1000
100
10
110 20 30 40
Perm
eabi
lity
(md)
Class 1
Class 2
Class 3
Equalpore-throat
size
Incr
easi
ng p
ore-
thro
at s
ize
C
Lime mud
ESTIMATION OF PETROPHYSICAL PROPERTIES INTEGRATING ROCK-FABRIC APPROACH WITH STRATIGRAPHY AND WIRELINE POROSITY
Poikilotopicsulfate
Patchyanhydrite cement
500 mm
Sw(Class 1) = 0.02219 x H^-0.316 x f^-1.745
0
500
1000
1500
2000
0 20 40 60 80 100
Phi = 20%
Phi = 10%
Phi = 5%
Inje
ctio
n Pr
essu
re (p
sia)
Air Saturation (%)
ARFN 1 (Lucia, 1995, 1999)
0
500
1000
1500
2000
0 20 40 60 80 100
Inje
ctio
n Pr
essu
re (p
sia)
Air Saturation (%)Sw(Class 3) = 1-{2.71828^(-0.1/(Log(0.3827*H/Phi^(-1.9717))))}
ARFN 3 (New Thomeer Model)
25%20%
15%10%
5%
0.05 0.10 0.20 0.30 0.400.1
1.0
10
100
1000
Total Porosity (fraction)
1.0
2.0
3.0
Perm
eabi
lity
(md)
Class 3Field
Class 1Field
0.5
1.5
2.5
4.0Class 2
Field
Apparent Rock Fabric Numbers
BureauofEconomic
Geology
Cored well
New core analysisand thin sections
0 4000 ft1000 m0


![Petrophysical Analysis Of Reservoir Rock Of Kadanwari Gas [Autosaved]](https://img.dokumen.tips/doc/110x75/58ae7f291a28abea4f8b5e23/petrophysical-analysis-of-reservoir-rock-of-kadanwari-gas-autosaved.jpg)