Embed Size (px)
Citation preview

ESTIMATION OF GAS HOLDUP, DIAMETER AND APPARENT DENSITY OF MINERALIZED BUBBLES IN INDUSTRIAL FLOTATION COLUMNS
J B YIANATOS A R LEVY
DEPARTMENT OF CHEMICAL ENGINEERING UNIVERSITY SANTA MARIA, CHILE

ESTIMATION OF GAS HOLDUP, DIAMETER AND APPARENT
DENSITY OF MINERALIZED BUBBLES IN INDUSTRIAL
FLOTATION COLUMNS
J.B. Yianatos and A.R. Levy
Department of Chemical Engineering University Santa Maria
Valparaiso, 110-V Chile
ABSTRACT
Gas holdup was estimated from pressure difference measurements in two
industrial flotation columns. The impact the apparent bubble density has upon gas
holdup was quantified. Apparent density of the bubble-particle aggregate was
evaluated as a function of the mineral drop back from the froth. At 1.5 cm/s
superficial gas velocity, it was found the gas holdup can increase up to 30% by
increasing the apparent bubble density.
Mean diameter of mineralized bubbles was estimated assuming the system
behaves as a perfect countercurrent bubble-slurry flow. Under these conditions
bubble diameter increases slightly by increasing the apparent bubble density (up to
0.15 g/mL). Furthermore, an extension of the ideal bubbly flow model was
developed to consider slurry and gas recirculation in large size columns. This new
approach showed that in large columns the actual mean bubble diameter can be 40-
80% higher than predicted using the ideal bubbly model.
1
1. INTRODUCTION
Knowledge of the flow regime and gas holdup is important to estimate the
particle and liquid residence time, because the achievable recovery depends strongly
on these factors. Moreover, the rate of pruticle collection is a function of gas rate
and bubble diameter, both of which affect gas holdup. Thus, the knowledge of the
actual gas holdup and bubble size in the collection zone is presently considered a
key aspect in the study of new control stTategies for flotation columns.
Bubble column hydrodynamics has been largely studied in the field of analysis
and reactor design (Shah, Y.T., 1982), particularly the case of gas-liquid in
cocurrent or liquid in batch. In general, however, these works are not applicables to
flotation columns for different reasons:
a) the flotation column operates in countercurrent
b) small bubbles (0.5-2.0 mm) are required, typically generated by gas spargers in
the presence of frother
c) superficial gas velocities are relatively low (1-3 crn/s)
d) presence of solids, specially bubble-particles aggregates, significantly affects the
hydrodynamic of the system
Consequently, it is necessary to develop new correlations to evaluate flotation
columns hydrodynamic for diagnostic, design, control and optimization purposes.
In this sense, the hindered settling equations of Masliyah (1979) have been
adapted (Yianatos, J.B., 1988a) to correlate mean bubble size, gas holdup and
mean liquid and gas velocities in countercurrent liquid-bubble swarms. This
approach has proven adequate to predict mean bubble size, from gas holdup
measurements, in small diameter columns (less than O.lm) using superficial gas
velocities less than 3 crn/s, as used in industrial columns. Under these conditions,
Joshi (1980) has shown that liquid recirculation does not occurs.
2

In flotation, soljd particles partition between the liquid phase (i.e., are in
suspension) and the gas phase (i.e., are attached to the bubble surface). The
presence of solids will cause changes in bubble rise velocity and consequently gas
holdup. This is a situation pertinent to flotation but one difficult to explore
experimentally. Thus, using the same approach aforementioned, the effect of
bubble loading upon gas holdup and bubble size was addressed theoretically
(Yianatos, J.B., 1988a).
Apparent density and mean bubble diameter are useful to estimate bubble
coverage with solids (%) and its carrying capacity, a critical parameter used to
design column circuits for fine particle processing (Espinosa, R.G., 1988a, 1988b,
1989).
It is expected, however, that increasing the column diameter up to industrial
sizes (e.g. 1-3m in diameter) the slurry and gas recirculation will increase,
associated with larger dispersion coefficients, and probably with an increase in
average bubble size and variance in bubble size distribution (larger than average
bubble rise at velocities higher than the average promoting recirculation). Under
these conditions the estimation of an average bubble size based upon the relative
velocity between the net bubble and slurry flowrates becomes unrealistic.
In this work the estimation of the mean diameter of mineralized bubbles, in large
size columns, will be addressed considering liquid recirculation and gas
recirculation.
2. METHOD
2.2 Background
In gas-liquid systems in which there is a net flow of both phases, the relative
3
velocity Us is defined as,
[2.1]
where + refers to countercurrent and - to co current gas-liquid flow. All the
parameters on the right-hand side are readily measured, consequently Us can be
determined.
Masliyah (1979) derived a general expression for relative particle to fluid
velocity for hindered settling of spherical particles in a multispecies system. Bubble
and rigid spheres in water have virtually equivalent drag coefficients up to a bubble
Reynolds number (Re) of approximately 500. Thus, for Re less than 500, an
analogous expression for bubbles can be written (Yianatos, lB., 1988a),
2 m-2 _ g o db(1-eg) [Pa-Psusp]
Us - 0.687 18IlsL[1+ 0.15Reb] [2.2]
where
[2.3]
Ill" re" d "P '" p p [2.4]
and
P susp = PSL(l-eg)+Pa· eg [2.5]
(see nomenclature for definition of symbols)
4

Equations [2.1] to [2.5] are adequate to describe liquid-gas countercurrent system
(Yianatos, J.B., 1988a), where the following assumptions are valid.
a) small superficial gas velocities (1-3 cm/s)
b) normal distribution of bubble sizes, variance (± 20%)
c) small average bubble size (0.5-2.0 mm)
d) no liquid circulation (this is reasonable for column diameters less than 0.1 m).
2.2 Gas Holdup Measurement in Industrial Columns
Consider the column system illustrated in Figure 1. ~p can be measured using
pressure transducers, differential pressure transmitters, or water manometers (Finch
and Dobby, 1989). The water manometers require a slight downward flow of fresh
water to prevent slurry penetration. PSL is defined as the average slurry density and
Pa is the apparent density of the bubble-particle aggregates between the two
pressure measurement points.
Assuming the dynamic component of the pressure is negligible, the following
equations can be derived in order to estimate the actual gas holdup.
water manometers,
differential pressure transmitters,
tg = PSL - Pw(~P/gL) PSL - Pa
[2.6]
[2.7]
5

2.3 Average Density of Bubble-Particle Aggregates in the Collection Zone of
Industrial Columns
Figure 2 shows a diagram considering the interaction between the collection zone
and the froth zone in a flotation column. According to Falutsu and Dobby (1989),
drop back is the fraction of solids entering the froth that are rejected back into the
collection zone. Here, the fractional drop back is represented by r.
The apparent density of mineralized bubbles (Pa) arriving at the froth zone can
be related to the solids flowrate reporting to conc.entrate C, the drop back r, the
superficial gas velocity J g' and the column cross-sectional area Ac.
P _ C a - (1 - r) J g Ac [2.8]
2.4 Estimation of Mean Diameter of Mineralized Bubbles in Industrial Flotation
Columns
The estimation of average bubble diameter in the collection zone of a large size
column needs to consider two perfomance parameters, slurry recirculation and gas
recirculation.
Slurry recirculation can be accounted using the method suggested by Yianatos,
J.B., (1986).When a slurry is descending countercurrent to a bubble swarm in the
ideal bubbly regime, the interstitial slurry is split in two fractions (a) the flux drifted
upward in the wake of the bubble, JSLd and (b) the flux down (JSL + JsLd). Small
bubbles, particularly those having rise velocity lower than interstitial slurry
velocity, will be entrained downward.
6
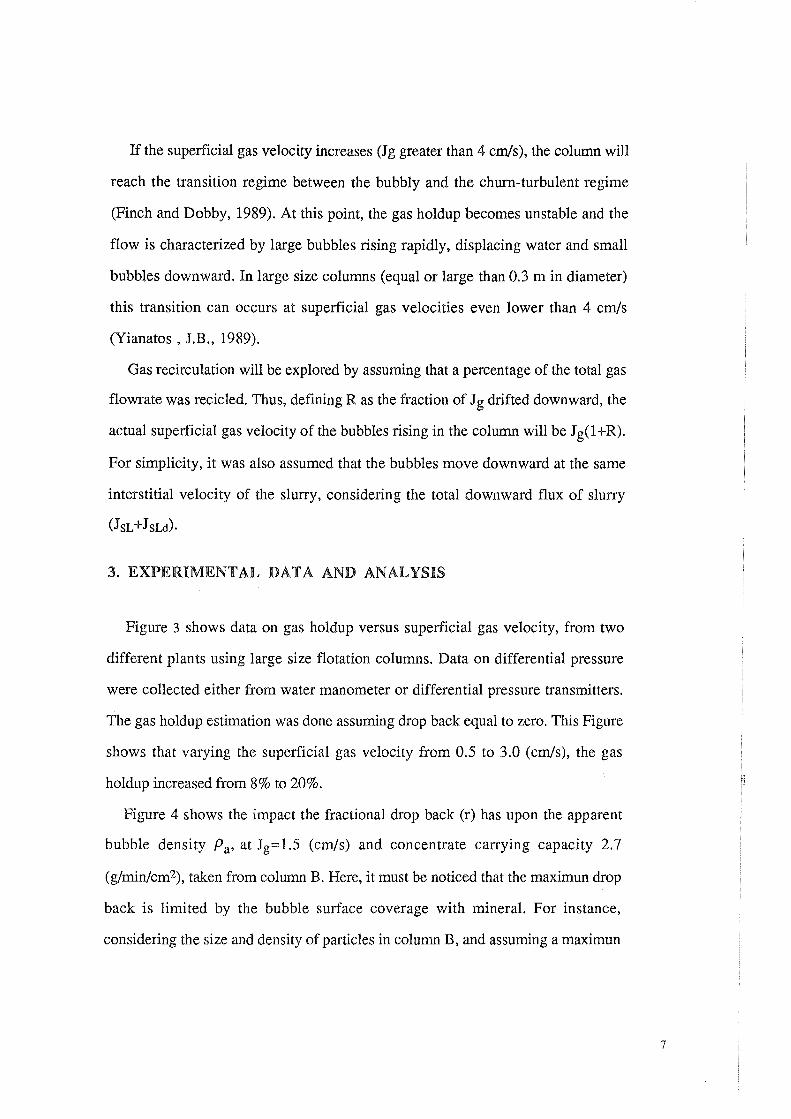
If the superficial gas velocity increases (Jg greater than 4 cm/s), the column will
reach the transition regime between the bubbly and the chum-turbulent regime
(Finch and Dobby, 1989). At this point, the gas holdup becomes unstable and the
flow is characterized by large bubbles rising rapidly, displacing water and small
bubbles downward. In large size columns (equal or large than 0.3 m in diameter)
this transition can occurs at superficial gas velocities even lower than 4 cm/s
(Yianatos , J.B., 1989).
Gas recirculation will be explored by assuming that a percentage of the total gas
flowrate was recicled. Thus, defining R as the fraction of J g drifted downward, the
actual superficial gas velocity of the bubbles rising in the column will be J g(1 +R).
For simplicity, it was also assumed that the bubbles move downward at the same
interstitial velocity of the slurry, considering the total downward flux of slurry
(JSL +JSLd)·
3. EXPERIMENTAL DATA AND ANALYSIS
Figure 3 shows data on gas holdup versus superficial gas velocity, from two
different plants using large size flotation columns. Data on differential pressure
were collected either from water manometer or differential pressure transmitters.
The gas holdup estimation was done assuming drop back equal to zero. This Figure
shows that varying the superficial gas velocity from 0.5 to 3.0 (cm/s), the gas
holdup increased from 8% to 20%.
Figure 4 shows the impact the fractional drop back (r) has upon the apparent
bubble density Pa, at Jg=1.5 (cm/s) and concentrate carrying capacity 2.7
(g/min/cm2), taken from column B. Here, it must be noticed that the maximun drop
back is limited by the bubble surface coverage with mineral. For instance,
considering the size and density of particles in column B, and assuming a maximun
7

bubble coverage ~<50% (G.J. Jameson, personal communication), the maximun
drop back will be around 80-90%. Thus, the expected apparent bubble density
should be less than 0.4 (g/mL). The following analysis will be limited to this range.
Figure 5 shows the estimated gas holdup versus apparent bubble density, for a
constant pressure difference reading and Jg=1.5 (cm/s). In this case, a change in
apparent bubble density from 0 to 0.27 (g/mL), r = 89%, implies an increase from
15% to 20% in gas holdup. In large size columns, a drop back of 80-90%.can be
expected. Thus, the effect of the corresponding increase in apparent bubble density
is significant and should be taken into account.
Figure 6 shows the effect of slurry re circulation upon the estimated mean bubble
diameter. For the ideal case of no slurry recirculation, the bubble size increases
slightly by increasing the apparent bubble density. The same effect is more
significant if slurry recirculation is considered. For the range of interest, the
increase in bubble diameter due to this effect varied between 30-45%.
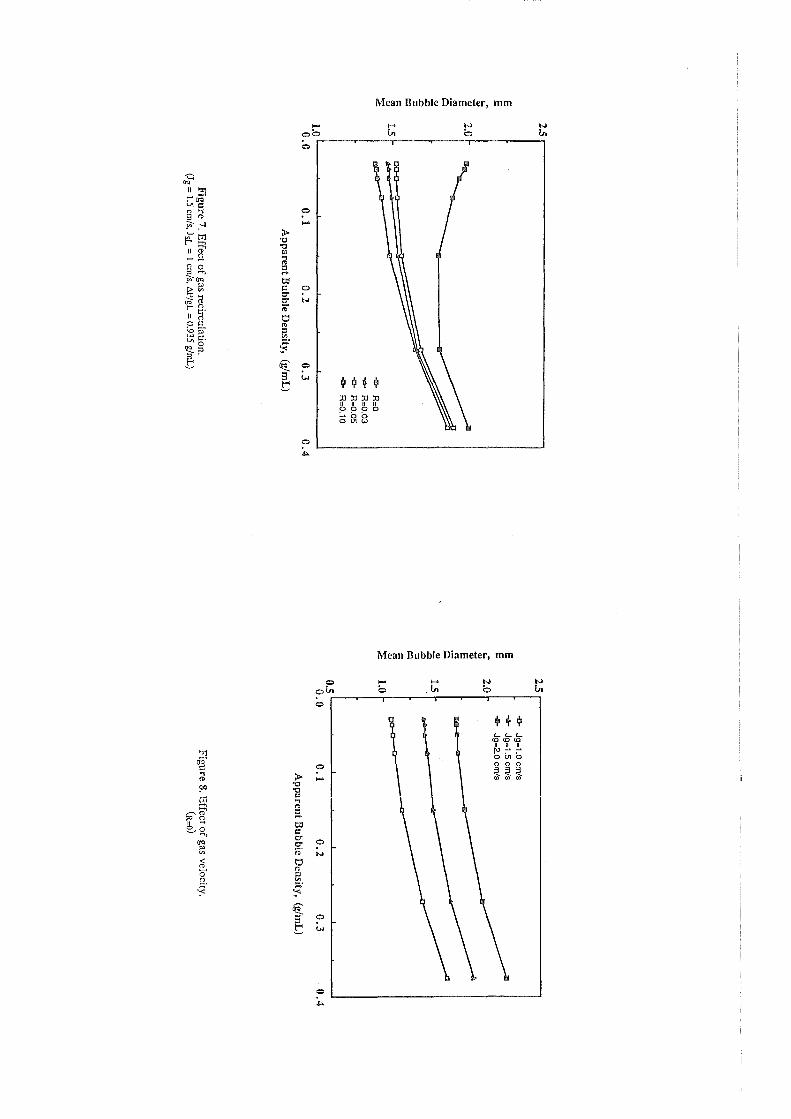
Figure 7 shows the effect of slurry recirculation upon the estimated mean bubble
diameter. Gas recirculation is represented as the fraction (R) of the gas rate drifted
downward by the slurry. The effect of R is particularly significant for low apparent
bubble densities (less than 0.15 g/mL) , and decreases by increasing the bubble
density. Physically, at small apparent bubble densities, R can not be larger than
0.1, because the fraction of the total gas holdup occupied by the recic1ed gas
approachs 50%. At larger apparent bubble densities, it is possible to reach values of
R greater than 0.1.
Figure 8 shows the effect of superficial gas velocity upon mean bubble diameter.
This effect is significant for the whole range of apparent bubble density. For
instance, a change from 1 to 2 (cm/s) in superficial gas velocity will increase the
mean bubble diameter in 30% approximately.
8

4. DISCUSSION
4.1 Estimation of the R value in a Gas-Liquid System
A rough estimation of R, using cumulative bubble frequency curves (%
undersize), measured by photographs (Pal and Masliyah, 1989; Dobby, G.S.,
1988) in columns of diameter equal or less to 0.1 m, showed the gas recirculation
was less than 5%. This value, however, should increase for larger column
diameters, and for highly loaded bubbles in flotation columns.
4.2 Estimation of the Average Density of Mineralized Bubbles
From industrial data on concentrate mass flowrates C (g/s) and superficial gas
velocities Jg (cm/s), the minimum apparent bubble density can be stated. If the
assumption of zero drop back (100% froth zone recovery) was true, the apparent
bubble density would be small and does not affect bubble size significantly.
However, Falutsu and Dobby (1989) measured drop back of 20-60% in a
laboratory column; Yianatos, J.B., (1988b) estimated 5-50% drop back, from
measurements of grade and percentage solid profiles in the froth zone of two
industrial columns (0.46 and 0.91m, in diameter). It is expected in large size
columns, 2-3m in diameter, the drop back can be as high as 80-90%. Thus, bubble
loading needs to be considered in bubble size estimation, as well as the increase in
gas holdup may have to be considered in siurry residence time calculations, and/or
to account for changes in the kinetics of the collection zone.
Loaded bubbles will exhibit a larger bubble diameter compared with unloaded
bubbles which can be allowed for similar conditions in the bubbly flow model.
9
Another aspect to be considered is that small bubbles have larger residence times
and become more loaded than larger ones. This effect will also benefit recirculation
of small bubbles.
4.3 Comments on the Use of Microbubbles at Industrial Scale
Unloaded single microbubbles (0.1-0.2 mm) have terminal rise velocities 1-2
cm/s (Clift, R., 1978). Because of the hinder effect of the bubble swarm, as well as
the high loading of the bubble-particle aggregates (small bubbles have larger
residence time), the actual rise velocity of bubbles in the swarm can be less than a
half (i.e. 0.5-1.0 cm/s). Now, flotation columns at industrial scale operate at 1.0-
2.0 cm/s interstitial downward velocity of slurry. Thus, the small bubbles will have
a net downward velocity and will report to tailings. The problem is minor for fine
particles with low density (e.g. fine coal), which causes less increase in the
apparent bubble density. A way to operate the column with microbubbles would be
to decrease the feed volumetric flowrate and, to maintain the column capacity the
feed % solids should be increased. However, there is a maximun because the
consequent increase in slurry density and viscosity have opposing effects and
probably will produce a net decrease on the rise velocity of bubbles. It seems, that
unless the improvement the microbubbles produce in collection kinetics and
carrying capacity be significantly large, the capacity of the column will decrease.
4.4 Static Observation of Bubble Size Distribution
Only static bubble size distributions has been observed from photographs of the
bubbles zone in two-phase systems. Using this direct measurement, or pressure
measurements (the case of industrial flotation columns), a static mean bubble size
can be estimated. This average bubble size, however, does not correspond to the
10

mean bubble size of the total gas flowrate arriving at the froth. Larger bubbles
rising at higher interstitial velocities contribute with a minor frecuency in a static
observation. Otherwise, this kind of measurement will always underestimate the
actual average bubble diameter of the gas flowrate.
5. CONCLUSIONS
a Estimated gas holdup from two industrial flotation columns, assuming no drop
back (r = 0), varied from 5% to 20%, for superficial gas velocities 0.5-3.0 cm/so At
J g= 1.5 cm/s and considering an expected drop back ( r = 0.9 ), the estimated gas
holdup increased by 30%.
- The increase in mineral drop back, up to r = 0.6, slightly increases the apparent
bubble density. Higher drop backs from 0.6 to 0.9 result in a sharp increase in
apparent bubble density and gas holdup.
- The estimated mean bubble diameter increased slightly by increasing the apparent
bubble density up to 0.15 (g/mL). For higher apparent bubble densities (drop backs
0.8-0.95) the estimated bubble size increased significantly.
- The effect of slurry recirculation increased in 25-30% the estimated mean bubble
diameter, at J g = 1.5 cm/s, with respect to the estimation using the ideal
countercurrent model.
- The effect of gas recirculation ( R ) on estimated bubble diameter was significant.
At low apparent bubble densities ( Pa < 0.1 g/mL), variations of R from 0 to a
maximum of 0.1 increased the bubble diameter by 30-43%. At higher apparent
11

bubble densities the maximum R value can be larger, but the impact on mean bubble
diameter decreases.
- In summary, corrections for slurry recirculation and gas recirculation can increase
the estimation of mean bubble diameter by 40-80%, if compared with predictions
from the ideal countercurrent bubble-slurry model.
- A static estimation of the mean bubble diameter, from both photographs and
pressure difference measurements, will always underestimate the actual average
bubble size of the gas flowrate arriving at the froth.
ACKNOWLEDGEMENT
Funding for column flotation research from FONDECYT-Chile (project
#190/89) and Santa Maria University (project #89/27) is acknowledge. Discussion
with R. Espinosa-Gomez is also gratefully acknowledge. The assistance provided
by Juan Godoy, who typed this manuscript and prepared the diagrams, is greatly
appreciated.
NOMENCLATURE
column cross-sectional area, cm2
C solids reporting to concentrate, g/s
db mean bubble diameter, cm
dp particle size, Ilm
g gravitational acceleration, cm/s2
h height of water level in manometer, cm
J g superficial gas velocity, cm/s
12
J SL superficial slurry or liquid velocity, crn/s
J SLd superficial velocity of liquid or slurry drifted by bubble swann, crn/s
L distance between pressure taps on a column, cm
m parameter in eq. [2.2]
~P pressure difference, g/crn/s2
R fraction of gas rate drifted downward
r fractional drop back
Us relative velocity between bubbles and slurry, crn/s
W solids arriving at the froth, g/s
Greek Symbols
£g fractional gas holdup
o fractional bubble coverage with minerals
~SL slurry or liquid viscosity, g/crn/s
1t pi number
Pa apparent bubble density, or density of the bubble-particle aggregate, g/rnL
Pp particle density, g/rnL
PSusp suspension density inside the column, g/rnL
PSL slurry or liquid density, g/mL
Pw water density, g/mL
REFERENCES
Clift, R., Grace, J.R. and Weber, M.E. (1978). In Bubble, Drops and Particles,
Chap 7, Academic Press, New York.
13
Dobby, G.S., Yianatos, J.B. and Finch, J.A. (1988). Estimation of bubble
diameter in flotation columns from drift flux analysis. Canadian Metallurgical
Quarterly, 27(2), pp 85-90.
Espinosa, R.G., Yianatos, J.B., Finch, J.A. and Johnson, N.W. (1988a).
Carrying capacity limitations in flotation columns. In Column Flotation 88', ed
K.V.S. Sastry, chap 15, pp 143-148. S.M;.E. Inc., Colorado, D.S.A.
Espinosa, R.G., Finch, J.A., Yianatos, J.B. and Dobby, G.S. (1988b). Flotation
column carrying capacity: particle size and density effects. Minerals Engineering, 1
(1), pp 77-79.
Espinosa, R.G., Johnson, N.W., Pease, J.D. and Munro, P.D. (1989). The
commissioning of the fIrst three flotation columns at Mount Isa Mines Limited. 28th
Conf. of Metal1. of CIM. Halifax, Canada, August 20-24.
Falutsu, M. and Dobby, G.S. (1989). Direct measurement of froth drop back and
collection zone recovery in a laboratory flotation column. Submitted to Minerals
Engineering.
Finch, J.A. and Dobby, G.S.(1989). In Column Flotation, chap 2, Pergamon
Press, London, in press.
Joshi, lB. (1980). Axial mixing in multiphase contactors: A unified correlation.
Trans. Instn. Chem. Engrs., 55, pp 155.
Masliyah, J. (1979). Hindered settling in a multi-species particle system. Chemical
Engineering Science, 34, pp 1166-1168.
Pal, R. and Masliyah, J. (1989). Flow characterization of a flotation column. Can.
J. Chem. Enz .. in press.
Shah, Y.T., Kelkar, B.G., Godbole, S.P. and Deckwer, W.D. (1982). Design
parameters estimations for bubble column reactors. A.I.Ch.E. J., 28(3), pp 353-
379.
Yianatos, lB., Finch, lA. and Laplante, A.R. (1986). Apparent hindered settling
in a gas-liquid-solid countercurrent column. lnt. J. Miner. Process., 18, pp 155-
165.
14
Yianatos, J.B., Finch, J.A., Dobby, O.S. and Xu, M. (1988a).Bubble size
estimation in a bubble swann. Journal of Colloid and Interface Science, 126 (1), pp
37-44.
Yianatos, J.B., Finch, J.A, and Laplante, AR. (1988b). Selectivity in column
flotation froths. Int. 1. Miner. Process., 23, pp 279-292.
Yianatos, J.B., Marchese, M.M., Hutchinson, S. and Wiles, RJ. (1989).
Characterization of gas sparging media in the flotation column. 28th Conf. of
Metall. of CIM. Halifax, Canada, August 20-24.
15

DIF
FE
RE
NT
IAL
PR
ES
SU
RE
TR
AN
SM
ITT
ER
SL
UR
RY
G
AS
'~~9:
~~:.~~-R.; ~ . ~ la
( "J-\ "'(~.!..; ·~.-o
~rf~~. • "V
'I 1oiI~.
~~.;.~("~
···.··.·G
. "
CO
LL
EC
TIO
N
ZO
NE
SL
UR
RY
G
AS
t ~ 1 L
j W
AT
ER
MA
NO
ME
TE
R
Fig
ure 1. P
ressure measurem
ents in flotation columns.
CO
NC
EN
TR
AT
E
C
FR
OT
H
ZO
NE
1&
DR
OP
B
AC
K
Wr
W
CO
LL
EC
TIO
N
FE
ED
iF
ZO
NE
~
TA
ILIN
GS
Figure 2. Interaction betw
een collection and froth zones in flotation columns.

0.30 I
III C
olumn A
c
Colum
n 8 0.25
Q.
::l ."
,
'0
0.20 ::t:
'" !l
!l ..
c::J ta:D:Ja
~
IQ !l
a a ;; O'~r
11
" r9~
aiictJa a
~
III ca
!9 .::
mill u ..
..
11 III
11 ...
0.10 ~
I III
0.05 ~ III
0.00 0.0
0
.5
1.0
1
.5
2.0
2
.5
3.0
3
.5
Superficial G
as Velocity,
(cm/s)
Figure 3. G
as holdup versus superficial gas velocity in two large size colum
n. (assum
ing drop back, r = 0)
1.0
~
0.8 ... .;i '-' .. cc
0.6 Q
. 0 ... Q
;; 0.4
~
~ '-'
.. ... ~ 0.2
0.0 U_
--'-
--"
_J
..._-'-
--'-
---"
_J
....--'-
-.L
..---'-
"---'-......
0.0
0
.1l
0.2
0
.3
0.4
0
.5
0.6
0
.7
Apparent B
ubble Density, (g/m
L)
Figure 4. F
ractional drop back versus density of bubble-particle aggregate.
(concentrate carrying capacity = 2.7 g/m
in/cm2, 19 =
1.5 cm/s)

Co
=
"C
"0
== '" '" \.:) -; I:: .2 <:i '" ... ""
0.30
0.25
0.20
0.15
0.10
0.05
0.00 L
' --,_.L-~---'_~-L.--,_.L--,----l'--~-L.--,_...l.--,----J
0.0
0
0.0
5
0.1
0
0.1
5
0.2
0
0.2
5
0.3
0
0.3
5
0.4
0
Apparent B
ubble Density,
(g1mL
)
Fig
ure 5. G
as Holdup versus apparent bubble density.
(J g= 1.5 cm
/s, M'/g
L =
0.935 glm
d
E
2.5ri -------------------------~
... N
o Recicle
-0-
With R
ecicls
E
2.0 .: ... <:i E
'" Q ... :c ,Q
=
Q ~
'" ... ::;
1.5 ~
.~~----.---------~.-~ m
m11l
11 !Ill
1.0
0.5 L
! _
_ "-_
--l.. _
__
....o-_
---'L
...-_
-'-_
_ ...l.-
_---" _
_ ...J
0.0
0
.1
0.2
0
.3
0.4
Apparent B
ubble Density, (g1m
L)
Figure 6. E
ffect of S
lurry Recirculation.
(Jg =
1.5 cm/s, JSL
= 1.0 cm
/s, M'/g
L =
0.935 glmL
, R=O
)
25
,.--------------------------------.
5 5 .: '" ~
2.0
'" ~ '" :c .Q
:::l ~
C
gj 1
5
::; -G
o
R=
o
-.Iio-R
=0
.03
-0
-R
=O
.05 ...
R=
O.10
1.0 .... ' -
-'-
---'-
---'-
----'-
---'-
----'-
--"'-
-----'
0.0
0
.1
0.2
0
.3
0.4
Apparent B
ubble Density, (g/m
L)
Figure 7. E
ffect of gas recirculation.
(Jg = 1.5 cm
/s, JsL =
I cm/s, M
'/gL
= 0.935 g/m
L)
5 5 .: '" .. 5 '" ~ '" :c .Q
:: ~
c '" "-' ::;
25
I -0
-Jg
= 1.0 cm
/s -.Iio-
Jg=
1.5 cm/s
... Jg
=2
.0 cm
/s 2.0
--~'
15
1 ~
I ~
1.0
0.5'-' __
__
~ _
_ ~ _
__
_ ~ _
__
_ ~ _
_ ~ _
__
_ ~ _
__
_ ~ _
_ _
J
0.0
0
.1
0.2
0
.3
Apparent B
ubble Density,
(g/mL
)
Figure 8. E
ffect of gas velocity.
(R=O)
0.4


![Informational Holdup and Performance Persistence …faculty.haas.berkeley.edu/vissing/rfs_hlvj.pdf[12:00 29/7/2013 RFS-hht046.tex] Page: 1 1–51 Informational Holdup and Performance](https://img.dokumen.tips/doc/110x75/5e97e46e3fd609406356b3b9/informational-holdup-and-performance-persistence-1200-2972013-rfs-hht046tex.jpg)