Embed Size (px)
Citation preview

The Pakistan Development ReviewVol. XXVII, No. I (Spring 1988)
Estimation of Elasticities of Substitutionfor CESand YES Production Functions using
Firm-levelData for Food-processingIndustries in Pakistan
GEORGEE. BAITESEand SOHAILJ. MALIK*
Analyses involving CES and VES production functions indicate that theconstant-returns-to-scale CES model is an adequate representation of large-scalefirms in the wheat-flour milling, rice husking, sugar refining and edible-oil proces-sing industries in Pakistan. The hypothesis that these four food-processing indus-tries have the same elasticities of substitution is not rejected. The pooled elasticityestimate for the food-processing industries is significantly different from zero, butnot significantly different from one
1. INTRODUCTION
A recent study by Battese and Malik (1986b) has shown that there are con-siderably greater labour-capital substitution possibilities in most of the major indus-tries in Pakistan at the aggregatelevel than earlier studies had shown e.g. Kazi et al.
(1976) and Kemal (1978). However, the study highlighted the need for analysesata more disaggregatelevel,using firm-leveldata.
The elasticity of substitution parameter is generally estimated in availableliterature using a Constant Elasticity of Substitution (CES) production function.However,this is restrictive and theoretically, there is no justification for the elasticityof substitution to be a constant. A number of function forms are available that
permit the estimation of a Variable Etasticity of Substitution (VES).This study attempts to estimate the elasticity of substitution using disaggregate
firm-level data for both CES and VES type production functions. Careful statistical
*The authors are Senior Lecturer, Department of Econometrics, University of NewEngland (Australia), and Research Economist, Pakistan Institute of Development Economics,Islamabad, respectively. This paper is based on a part of the Ph.D. thesis of Dr Malik submittedto the Department of Econometrics, University of New England, Australia. The authors aregrateful to Professors Ajit Dasgupta, William Griffiths and Clem TisdeU for valuable commentsand to Mrs Val Boland and Mr M. Afsar Khan for careful typing uf the manuscript. The authorsare also grateful to the anonymous referees of this Review for their useful comments on thispaper. The authors alone are, however, responsible for any remaining errors.
60 G. E. Battese and S. J. MalikElosticities of Substitution 61
testing is undertaken to determine the adequacy of the particular type of productionfunction to explain the underlying data.
The difficulties associated with estimation of elasticities of substitution, using
aggregative data for firms within specified asset-size categories, are discussed inBattese and Malik (1986a & 1986b). In order to identify and estimate the elasticityof substitution for CES and YES production functions, defmed in terms of firm-leveldata, it is necessary that values of inputs of production be the same for firms withinspecified categories. Further, there is a problem associated with the interpretationof an elasticity of substitution for a product that is defined in a highly aggregativeform. For example, the aggregatetwo-digit-Ievelindustry, Food, consists of twenty-eight quite diverse components, such as meat preparation, ice cream, fish canning,vegetable and fruit carming,bakery products and salt refining. An aggregateestimatefor its elasticity of substitution does not necessarilyimply that the elasticities for allof the component industries are the same. Moreover,giventhe heterogeneous natureof the products involved, it is quite possible that the aggregateelasticity of substitu-tion measures, not only the substitution of labour for capital to produce a givenhomogeneous product, but also the substitution of one product for another.
The above discussion suggests the desirability of estimating elasticities ofsubstitution for well-defmed products using firm-level data. This paper presentsestimates of elasticities of substitution based upon data obtained from a survey oflarge-scalefirms in the wheat flour milling, rice husking, sugar refining and edible oilprocessing industries in Pakistan. These four industries are responsiole for nearlyninety percent of the value added in the aggregate two-digit-Ievelindustry, Food,based upon Government of Pakistan (1983). The output of the firms in each ofthese industries is fairly homogeneous, although rice husking and edible oil pro-cessing produce a wider variety of products and by-products than flour milling andsugar refining. Rice husking produces a range of different qua)ity rice with theoutput composed of varying proportions of fine, broken and powdered rice and bran,while edible.oil processing produces cottonseed, rapeseed and mustard and sesamumoils, cakes and meal. Flour milling produces a fairly standard quality of flour andbran, while sugar refming produces only white sugar and molasses.
(b) twenty-five percent of the firms in a particular category if theirnumber wasmore than forty.
(a) all firms in a particular three-digit-levelcategory if their number wasless than forty; or
There were sixty-eight firms in the flour milling, rice husking, sugar refining andedible oil processing industries. Firms with these four industries are estimated tocomprise about six percent of the total number of large-scalefirms covered by theCensus of ManufacturingIndustries. The percentages of sample firms within the fourfood-processing industries were 25.0,30.9, 16.2 and 27.9 for flour milling, rice husk-ing, sugar refming and edible oil processing, respectively. For the 1976-77 Census ofmanufacturing Industries, the percentages of food-processingfirms within these fourfood-processing industries were 39.9,2.2, 11.2 and 46.6, respectively: Governmentof Pakistan (1982, p. 1). While there may have been changesin the relative percent-ages of firms within the different food-processing industries, between the 1976-77Census and the 1980-81 Survey, the significant differences between the two sets ofpercentages are likely to be due to the criteria by which the sample firms wereselected. It is also noted that information supplied to the census is voluntary and thenumber of firms reported therein does not necessarily represent the true proportionsof firms in the total population. For example, it was reported that in the 1976-77Census only sixty-five percent of the total number of large-scalefirms on the censuslists actually completed the census: Government of Pakistan (1982, p. ix).
In the 1980-81 Survey, information was obtained on the value of output,value of input, changes in stocks, employment costs and the number of personsemployed. Of the sixty-eight firms within the four food-processing industries, twofirms reported data showing that value added was negative and four firms reportedemployment costs that were greater than value added. Since this situation couldarise only in the very short-run or have resulted from reporting, or recording errors,these six firms are omitted from our analyses. Data on the book value of differenttypes of capital equipment were obtained for only forty-two of these firms becausethe remaining firms did not complete the questions on capital assets in the survey.Summary statistics for selected variablesare presented in Table 1.1
For the seventeen fums in rice husking, the sample mean wage rate, Rs 5,410and the sample mean value added, Rs 836,000, are the lowest among the fourindustries considered. For the eleven sample firms in sugar refining the sample meanof value added, Rs.80,600,000, is the highest. The overall sample mean of the wagerate is Rs 11,280, the highest being in edible oil processing, Rs 17,230. The samplemean of employment is highest in sugar refming and its coefficient of variation issignificantly lower than those for the other three industries. The coefficients ofvariation for the wage rate and the number of persons employed are much lower insugar refming and flour millingthan for rice husking and edible oil processing.
2. DATAON FOOD-PROCESSINGFIRMS
During 1980-81, a survey was conducted of large-scalefums within manufac-turing industries in Pakistan. From the list of large-scale firms available for theCensus of Manufacturing Industries, firms were selected in this survey according tothe followingcriteria:
1Thefirm-level data on the variables cannot be presented for reasons of confidentiality.

62
-Q.)
~E-<
~ca ,-....-. '" 0'" .- en 8> p......~ '" Q.) .0 u ~ -0 '-< -"1
i:Q 0 g:;'-'
~~~~...
~~
..0;::....
'- "00 en Q.)
s::: >.Q.) 0 0.D en ....S p..;:s ~ sz ~
E~~..c::.
.S!...
~~~~...
<2,'":;:c.;::.~~~{5:;:~"J~
t~]1::j'":;:~~~
]-~
"0Q.) ,-...
'0 .S :g EQ.) ~ '" 8
b.Q Q.) ....'" '" ;:s Q.)t73~cab>
G. E. Battese and S. J. Malik
,-...v-V") -v. .-:.- -'-'
I"--,-.... 0\1"---N '-'
,-...00\C"1C"'!
00 '-'
N~ 8
1
,-...'" - N~ 8. C"1~Q.)- 0 Nt?JIC2 -'-'~'-'
"0 ,-...~8"00'" .~ &Cd,-,>
....Q.)
.D en
§ '0 .Ez u..
Q....en;:s
"0s:::-
,-...I"-- \0000t"-;,(V),- -'-'
V")-
b.Qr::
:=1
~....
5Ll;
,-...\ON\0 V")C!. -.- N'-'
I"-- ,-.... N
~~
,-...N\OC"1-1
OS
,-...- M~(")V") M'-'
,-...\OMM\O0000'-'
I"---
b.Q]~Q.)u
i:z
,-...-00M 000\\0.,;.r;0\ 00'-'
~,-...V") V")\ON- M. '-'-
-N V")N -08,
,-...00\0C"1C"1- M- '-'
,-...ON~. ~0 I"--00 V")
'-'
--
.i!;:;~~gp
tI.)
, ,-...V") I"-- V") V")\00 0-V") \0 V") \0.,; 00 0:: 00..oN NV")'-' '-'
M ,
1
0'-'". v . MV 00 V 00N M N VM '-' M '-'
,
1
,-...I"-- V V") 0-- NN
0 S OS
,-...M N
1
00 ,-...C"'!C"'! C"'!-.qI"-- 0 - I"---- -'-''-'
, ,-...00 V") I"--NV M 8 N0), oq. . <"'!,00 I"-- M I"--V") 0\ M\O'-' '-'
0\-
b.Q.SenenQ.)U0....~
a
N\0
b.Qr::.~Q.)g~"000
u..
T
Q)
0:aQ)'"I':ojbOI':'s!;::;Q).....ojgp'"oB'I': ~;!2 .;'" I':
'.E I':~ Q)'~>, u '"0 '1: Q)- ::;PooBO"e I': >,Q)=Q)
~ 's ~§ ~ ;;<I>o..c:Por= ...
"0 ~ .52 ...~e :§.~::;.= i'iI': ~ ::;Q) '" 0"-Se,g... '"£1::'1:"'oo§'~ ~ p..~ I': Po"" '" '"
. v - Q)~t;--S.S::8 .n '"'(;j... . ~.~ I': 00 Q)Q) Q) Q) ~
'" e -S ~"8 ~ e '"-8"5.00£I': e <!:::E~ ~ ~.~~ $3 .5 >:PoE$3jeQ).t'.-~..c: 0 t)... Q) Q)Q) '" ... Po~ '" '" i'ii'i] ~ .....
i'i oS ~ i'i..c: ::; oj .-= u - j:I~ a.~.g[.~ ~.5I':Q) bO.- ... I': I':i'i e 0 .~:;~;g8Jf~-8 2Q) Q) Q) Po
..c:..c:..c::;:E-q !-< 0- N '";.;~
~
E/JJsticities of Substitution 63
3. ANALYSESINVOLVINGCESPRODUCTIONFUNCTIONS
We first assume that for the observations on individual firms the stochastic
constant-returns-to-scale CESproduction function [cf. Arrow, et al. (1961)] ,
'Yf oKI-P+(1-15)LI-Pj-IIP eUI,
applies, where Y., KI and L. represent value added, book.value of capital equipmentI I
and total number of persons employed for the ith sample firm; 'Y,0 and P are theefficiency, distribution and substitution parameters; and the random errors, U1,
U2, . . ., Un, are assumed to be independently and identically distributed as normalrandom variables with means zero and variances, a~, and n represents the number ofsample firms involved.2
Given the assumption of perfect competition in the factor and productmarkets, the elasticity of substitution for the CES production function (1),a = (1+p)-1 , can be estimated from the indirect form:
YI (1)= i = 1, 2, . . ., n,
log (Y./L.) = (30+ (31log WI + U.,I I I
i=I,2,...,n, (2)
where wI denotes the wage for labourers in the ith firm; and (31=(1+p)-I. Theleast-squares estimator for (31in the indirect form (2) is the minimum-variance, un.biased estimator for the elasticity of substitution.
The indirect form (2) of the CES production function is specified for each of
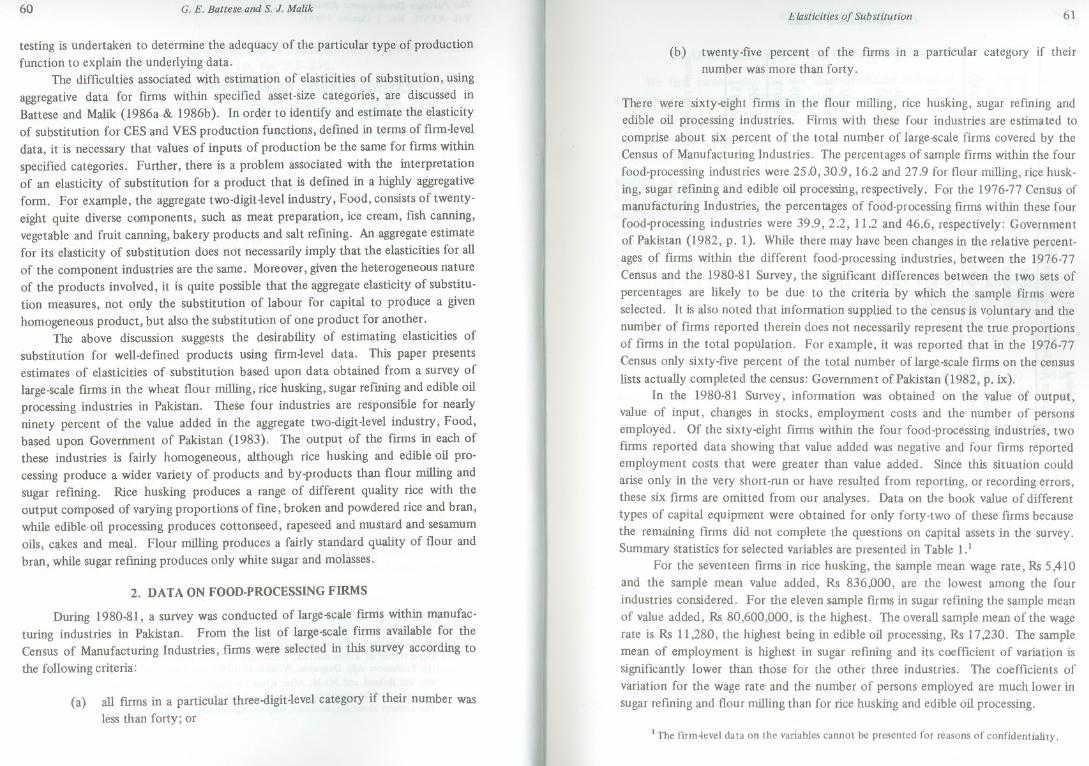
the four different food-processing industries being considered. The numbers ofsample firms involved in each industry, the coefficients of determination (R2) forthe regression analyses involved and the estimated elasticities of substitution a,repre-sented in Table 2. The coefficients of determination for flour milling and sugarrefining are very low and the estimated elasticities are not significantly different fromzero. However, for rice husking and oil processing, the coefficients of determinationare moderately large and the estimated elasticities are significantly different fromzero. Further, the estimated elasticities for all four food-processing industries arenot significantly different from one. This implies that the Cobb-Douglasproductionfunction is likely to be a reasonable model for these food-processingindustries.
2For the sake of simplicity we assume that there are only two factors of production,homogeneous, capital and labour. We postpone the analysis of intermediate inputs in the pro-duction structure to a later study. Moreover, while accepting the simultaneity problem associa-ted with using endogenous variables on the right-hand side in the estimating forms of theequations used, simultaneous equations estimation was not undertaken because of reasons ofsimplicity and non-availability of relevant data.
64 G. E. Battese and S. J. MalikElasticities of Substitution 65
Table 2
Estimated Elasticities of Substitution for Food-processing Industries, under theAssumptions of the Constant-Returns-to-Scale CES Production Function
Suppose that the stochastic variable-returns-to-scaleCES production function[cf. Brown and de Cani (1962)] ,
Industry
Flour Milling
Number of Firms R2 ElasticityY =
ir{8Kj-P + (1-8) Lj-Pj vip eUj
i = 1,2, . . ., n, (3)
15 0.112 1.57
(1.23)applies, where, in addition to the parameters and assumptions defined for the CESmodel, v is the homogeneity parameter. A possible indirect form for the CESproduction function (3), based upon the assumption of perfect competition in thefactor and product markets is givenby.Rice Husking 17 0.682 0.97**
(0.17)
Sugar Refining 11log (Y./L.) = {3o + {31log w. + {32log L. + U.,I I I I I
i = 1,2,. . .,n, ... (4)0.003 0.10
(0.66) where {31=v(v+pr1 and {32=(v-I) (1-f3d [cf. Behrman (1982, p. 161)]. For thisproduction function, the elasticity of substitution, a = (1+p)-1 , is not identicallyequal to the coefficient of the logarithm of wages. However, the elasticity of substi-tution and the parameters of the indirect form (4) are functionally related by{31= (1+{32)a. Thus, if {32=1=-1 and the observations on the model (4) satisfy basic
regularity conditions, then a consistent estimator for the elasticity of substitution isdefined by
Oil Processing 19 0.351 0.70**
(0.23)
Food Processing 62 0.599 0.82**
(0-16)Notes: Figures in parenthesis denotes estimated standard errors.
**denotes significant at the one-percent level. a= {31 (1+132)-1, (5)
Although the estimated elasticities for the four industries are different, it is ofinterest to consider if the CES production functions have the same elasticities ofsubstitution. We consider the hypothesis that the four industries have indirect forms
(2) with the same coefficient of the logarithm of wages(Le. the same elasticity) butpermit the functions to have different intercept (or efficiency) parameters. If thishypothesis is true, then the relevant test statistic has F-distribution with degrees offreedom 3 and 54, respectively. For the givensample data, the test statistic has value0.70, which is not statistically significant. Thus the hypothesis that the four food-processing industries have the same elasticitiesis not rejected.3 The estimated elasti-city of substitution, under the assumption that the four food-processing industrieshave the same elasticities, is 0.82, which is not significantly different from one. Thecoefficient of determination for the associated indirect form for the four industriesis equal to 0.599.
where {31and 132are the least-squares estimators for the parameters, {31and {32'inthe indirect form of the variable-returns-to-scaleCES production function (4). Thisestimator does not have a finite mean (or variance) because the least-squaresestimators, ~1 and ~, are normally distributed, under the assumptions of the model(3). However, the estimator (5) is such that the random variable, n-% (0-- a),convergesin distribution, as n approaches infinity, to a normal random variable withmean zero and a finite variance. By using a Taylor-seriesexpansion of the estimator(5), a consistent estimator can be obtained for its asymptotic variance, in terms ofthe variances and covariance for ~1 and ~ .
The estimated elasticities of substitution for the four food-processingindustries,. under the assumptions of the variable-returns-to-scaleCES productionfunction (4), are presented in Table 3, together with the valuesof the coefficient ofdetermination and estimates for the homogeneity parameter (discussedbelow). Theelasticity estimates are different from those presented in Table 2 for the constant-returns-to-scale CES production function. Except for rice husking, all the estimatesare not significantly different from zero. However, the relatively large standarderrors imply that all the elasticity estimates are not significantly different from one.
3The hypothesis that the four food-processing industries have identical indirect forms (2)is also accepted at the five-percent level of significance, because the associated F-statistic, withparameters 6 and 54, respectively, is equal to 1.97. The estimated elasticity under this assump-tion is 1.11. with an estimated standard error of 0.14, and so is significantly different from zero,but not significantly different from one.

66 G. E. Battese and S. J. Malik Elasticities of Substitution 6'1
where ~1 and~2 are as defmed for (5). Although this estimator does not have afmite mean or variance, a consistent estimator for its asymptotic variance can beobtained by standard methods.
Values of the consistent estimator (6) for the homogeneity parameter arepresented in Table 3. The values obtained for flour milling, rice husking and edible-oil processing are unreasonable. However, estimates of the asymptotic variancesaresufficiently large that the hypothesis of constant returns to scale is not rejected. Theresults reported in Table 3 suggest that a more precise analysis of the degree ofhomogeneity of the CES production function (3) may require additional data oralternative estimators for the homogeneity parameter than that defined by (6).
If the coefficient of the logarithm of labour (32is zero for the indirect form (4)for the variable-returns-to-scaleCES production function, then the t-ratio for the
estimator for that parameter has tn-a distribution, where n is the number of samplefirms in the given industry. The values of the t-ratios for flour milling, rice husking,sugar refming and edible oil processing are t12 = - 1.60,t14 = 0.91,t8 =0.02 andt 16= -D.89, respectively,whicharenot significantat the five-percentlevel. Thusthehypothesis of constant returns to scale is not rejected, given the assumptions of thevariable-returns-to-scaleCES production function (3) - (4).
The estimated elasticities for the four food-processing industries, under theassumption of the variable-returns-to-scaleCES production. function, are not signi-ficantly different. If the hypothesis that the four industries have the same elasticitiesis true, then the traditional test statistic involved has F-distribution with degrees offreedom 6 and 50. The value of this test statistic for the givensample data is 1.07,
~ch is not significant at the ten-percent level. The estimated elasticity, under the. assumption that the four food-processing industries have the same elasticities, is1.09, as reported at the bottom of Table 3. This elasticity is significantly different
from zero at the one-percent level, but is not significantly different from one.
Estimates for the Elasticities of Substitution and the Homogeneity Parameter
for Food-processing Industries, under the Assumptions of theVariable-Returns-to-Scale CES Production Function
Number
of Firms
Table 3
Industry
Flour Milling
R2
15 0.267
Rice Husking 17 0.700
Sugar Refining 11 0.003
Oil Processing 19 0.382
Food Processing 62 0.609
log (Y./L.) = {3o + /31log w. + /33log (K./L.) + U.,I I I I I Ii=1,2,..:,n, ... (8)
Notes: Figures in parenthesis denotes estimated standard errors.
**denotes significant at the one-percent level.
4. ANALYSES INVOLVING YES PRODUCTION FUNCTIONS
In this section we consider the estimation of the elasticity of substitutionunder the assumption that a variable-elasticity-of-substitution (VES) productionfunction applies. We initially consider that the stochastic constant-returns-to-scaleYES production function [cf. Lu and Fletcher (1968)] ,
Yj = r(8K;"P + (1-D)71Lj--P(K/L)-C(1+p)l-l/P eUj,i = 1, 2, . . ., n, (7)
applies, where the variables Yj' Kj and Lj and the random errors Uj' U2, . . ., Un,are as defined for the constant-returns-to-scale CES production function (1).
The indirect form of this YES production function is defmed by
(6)
where {31=(1 +p)-1; and {33=C.
It is evident that if the coefficient of the logarithm of the capital-labour ratio{33is zero, then the model reduces to the indirect form of the constant-returns-to-scale CES production function (2). Given the assumption of the YES productionfunction (7), it follows that a test of the hypothesis that the production function hasconstant elasticity of substitution is obtained by a t-test on the least-squaresestimator for the coefficient of the logarithm of the capital-labour ratio.
The homogeneity parameter, v, is expressed in terms of the parameters /31and
(32of the indirect form (4) of the variable-returns-to-scale CES production function
by v = I + {32 (1_/3.)--1, provided /31 -=1= 1. From this it follows that a consistentestimator for the homogeneity parameter is defined by
v = 1 + ~ (I_~.)-1
HomogeneityElasticity Parameter
3.03 -1.51
(6.45) (9.93)
0.82** 3.04
(0.21) (5.36)
0.10 1.01
(0.74) (0.77)
1.42 3.92
(1.12) (14.64)
1.09** --1.25
(0.33) (7.99)
68 G. E. Battese and S. J. Malik
Given the assumptions of perfect competition, the elasticity of substitutionfor the constant-returns-to-scale YES production function (7) is expressed in termsof the parameters of the indirect form (8) by
a = (31(1-€ (33)-1 (9)
where € =(wL+rK)JrK is the ratio of total factor costs to the rental cost of capitalfor the fIrm involved [cf. Lu and Fletcher (1968, p. 450)] .
A consistent estimator for the elasticity is defined by
a = ~I (1-€ ~3)-1 (10). .
where (31and (33denote the least-squares estimators for (31and (33in the indirectform (8) and the value of € is taken to be the ratio of the sample mean of valueadded to the sample mean of value added minus employment cost for the fIrms inthe industry concerned. The asymptotic variance of this estimator for the elasticityis estimated by standard methods.
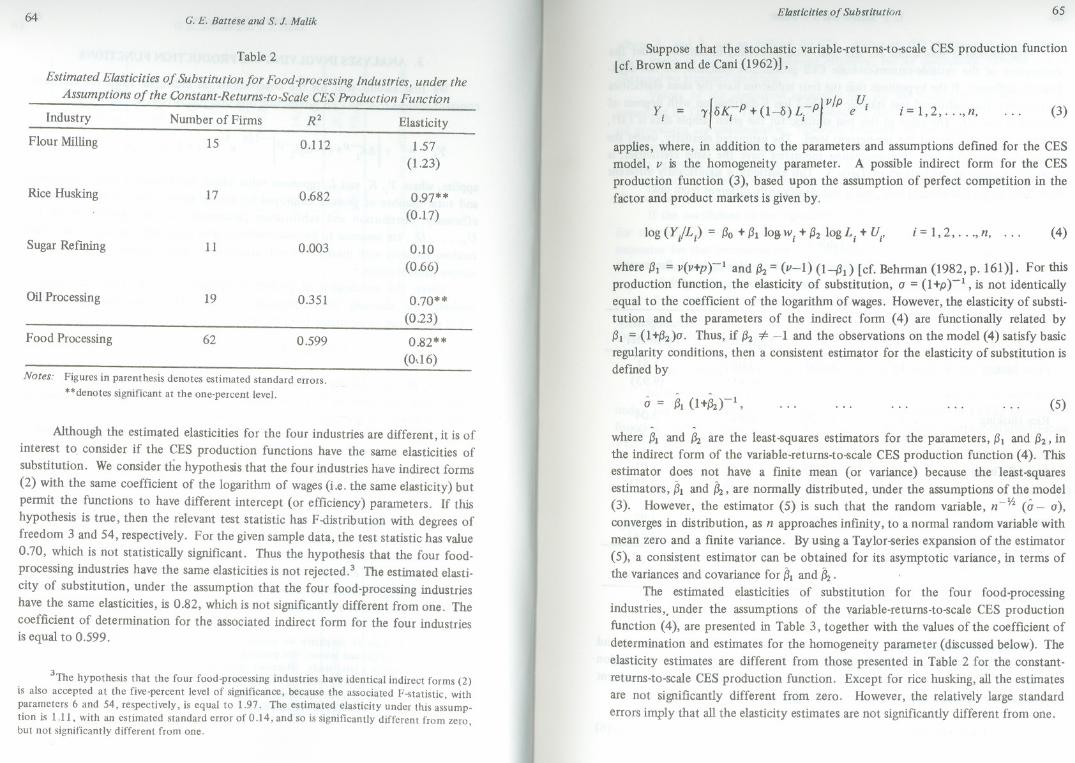
The elasticity estimates for the four food-processing industries are presentedin Table 4, together with the number of fIrms involved, values of the coefftcient of
Table 4
Estimated Elasticities of Substitution for Food-processing Industries, under the
Assumptions of the Constant-Returns-to-Scale YES Production Function
Industry
Flour Milling
Number of Firms R2 Elasticity €-values
0.616 3.70
(12.60)
1.198
Rice Husking 0.989 0.99**
(0.07)
1.345
Sugar Refining 0281 0.70
(0.67)
1.1911
Oil Processing 0.181 0.62
(0.42)
0.79**
(0.22)
1.18
18 1.17
Food Processing 42 0.611
Notes: Figures in parenthesis denotes estimated standard errors.*'" denotes significant at the one-percent level
1
1
Elasticities of Substitution 69
determination (R2) for the least-squares fIt of the indirect form (8), and therespective €-values. The elasticity of substitution for the four industries combined isalso estimated. If the hypothesis that the four food-processing industries have thesame slope parameters ((31and (33)for their indirect forms (8) is true, then theappropriate test statistic has F-distribution with degreesof freedom 6 and 30, respec-tively. For the data available, this test statistic has value 0.32, which is not signif-icant, at the ten-percent level. It is noted, however, that even if the hypothesis thatthe indirect forms (8) for the four industries have the same slope parameters is true,the elasticities for the four industries are likely to be different under the assumptionof the YES production function. Differences are expected to arise because ofdifferent levels of capital and labour in the different industries (Le. the value of € in(9) generallyvaries from industry to industry).
The estimated elasticity for rice husking is signifIcantly different from zero atthe one-percent level. The estimated elasticities for the other industries are notsignifIcantly different from zero. The large estimated elasticity for flour milling,3.70, is due to the value of € (33being close to one, making the denominator in (10)small relative to (31' The elasticity estimates reported for rice husking and edible oilprocessing in Table 4 are not signifIcantly different from those reported for theseindustries in Table 2. The coefficients of determination (R 2) reported in Table 4are generally higher than those reported for the respective categories in Tables 2and 3.
If the hypothesis that the coefftcient of the logarithm of the capital-labourratio (33is zero, is true for each industry, then the t-ratio associated with the
estimator for the parameter has t-distribution with degreesof freedom n-3, where nis the number of sample fIrms in the given industry. The values of the t-ratio forflour milling, rice husking, sugar refIning and edible oil processing are t5 = 1.78,t2 =-0.12, t8 = 0.94 and tl5 = 0.97, respectively, which are not signifIcant at thefIve-percentlevel. Thusthe hypothesisof constantelasticityof substitutionis notrejected, given that the constant-returns-to-scale YES production function (7) - (8)applies. .
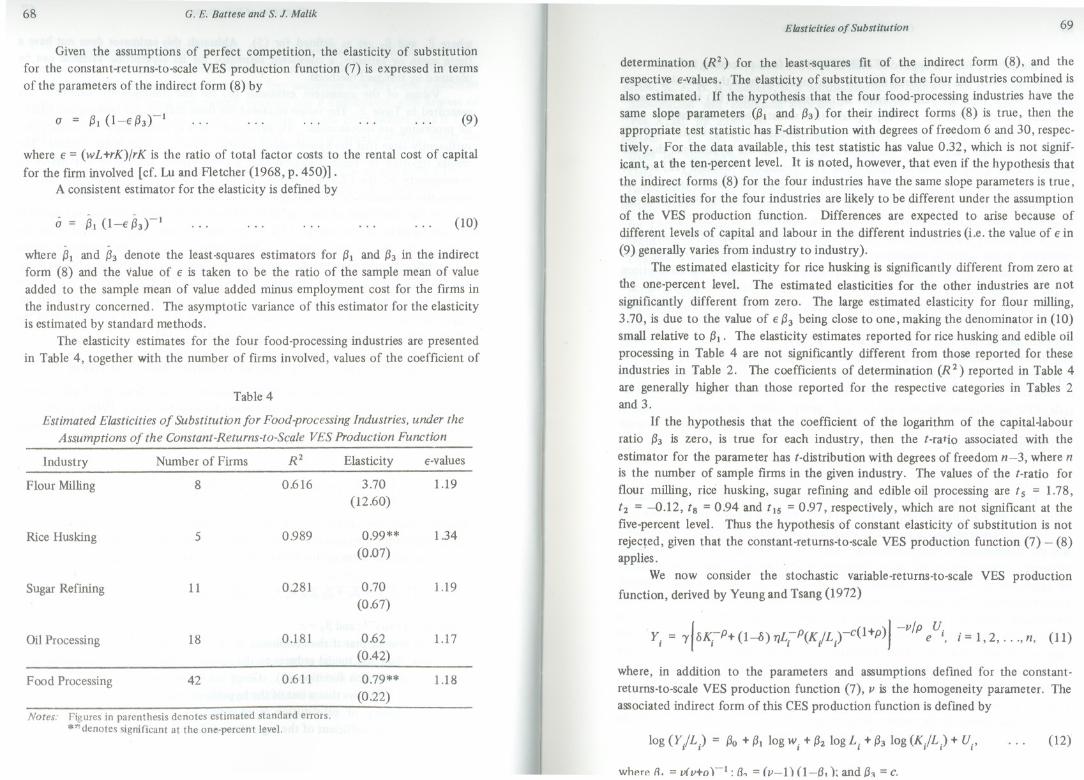
We now consider the stochastic variable-returns-to-scale YES productionfunction, derived by Yeung and Tsang (1972)
Y. = 'Y1
6KI-p+(1~)llL:-p(K./L.rC(1+p)
J-vJp eUI, i=I,2,...,n, (11)I I I I
where, in addition to the parameters and assumptions defmed for the constant-returns-to-scale YES production function (7), v is the homogeneity parameter. Theassociated indirect form of this CES production function is defined by
log (Y'/L I) = (30 + (31log WI + (32log L. + (33log (K./L.) + U.,I I I I I (12)
WhP.TP.R.=v(v+o)-I: B~ = (v-I) (I-B.); and B?= c.
70 G. E. Dattese and S. J. Malik Elasticities of substitution 71
5. CONCLUSIONS
REFERENCES
Arrow, K. J., H. B. Chenery, B. S. Minhasand R. M. Solow (1961). "Capital-LabourSubstitution and Economic Efficiency". Review of Economics and Statistics.
Vol. XLIII. pp.225-250.Battese, G. E., and S. J. Malik (1986a). "Identification and Estimation of Elasti-
cities of Substitution for Firm-Level Production Functions Using AggregativeData". Armidale: Department of Econometrics, University of New England.(WorkingPapers in Econometrics and Applied Statistics, No. 26)
Battese, G. E., and S. J. Malik (1986b). "Estimation of Elasticities of Substitutionfor (;ES Production Functions Using AggregativeData on Selected ManufacturingIndustries in Pakistan". Armidale: Department of Econometrics, University of NewEngland. (WorkingPapers in Econometrics and Applied Statistics, No. 26)
Behrman, J. R. (1982). "County and Sectoral Variations in Manufacturing Elasti-cities of Substitution Between Capital and Labour". In A. Krueger (ed.), TradeandEmployment in Developing Countries. Vol. 2. Chicago: University of ChicagoPress. pp. 159-191.
Brown, M., and J. S. de Cani (1962). "Technological Change and the Distributionof Income". International Economic Review. Vol.4. pp.289-309.
Government of Pakistan (1982). Census of Manufacturing Industries, 1976-77.Karachi: Statistics Division.
Government of Pakistan (1983). The Pakistan Economic Survey, 1982-83. Islam-abad: Finance Division.
Kazi, S., Z. S. Khan and S. A. Khan (1976). "Production Relationship in Pakistan'sManufacturing". PakistanDevelopment Review. Vol. XV, No.4. pp. 406-423.
KemaI, A. R (1978). "Substitution Elasticities in the Large-scaleManufacturingIndustries of Pakistan". PakistanDevelopment Review. Vol. XX, No.1. pp. 1-36.
Lu, Y. C., and L. B. Fletcher (1968). "A Generalization of the CES ProductionFunction". Review of Economics and Statistics. Vol. L. pp.449-452.
Yeung, P., and H. Tsang (1972). "Generalized Production Function and Factor-Intensity Crossovers: An Empirical Analysis". The Economic Record. Vol. 48.pp.387-399.
This indirect form is applied to each of the four food-processingindustries anda test obtained for the hypothesis that the four industries have the same slope para-meters. Given that the random errors in the indirect forms (12) have the samevariances for all industries, the appropriate test statistic has F-distribution with'degrees of freedom 9 and 26. The value of this statistic for the given data is 0.25,which is not significant at the ten-percent level. Thus, the hypothesis, that theindirect forms of the variable-returns-to-scaleVES production function (12) for thefour food-processing industries have the same slope parameters, is not rejected. Asstated for the constant-returns-to-scale VES production function, this does not neces-sarily imply that the four industries have the same elasticities.
It is evident that the variable-returns-to-scaleVES production function (11) isequivalent to the constant-returns-to-scale CES production function (1) if the para-meters, {32and {33,in the indirect form (12), are both zero. Under the assumptionsof the VES production function (11), it follows that if these two parameters arezero, then the appropriate test statistic has F-distribution with degreesof freedom 2and n-4, where n is the number of sample firms in the industry involved. The valuesof this F-statistic are 4.33, 2.36, 0.s5 and 0.46 for the four respective food-proces-sing industries. These values are not significant at the five-percent level and so thehypothesis that the constant-returns-to-scale CES production function (1) - (2)is adequate, is not rejected, given that the assumptions of the va.riable-returns-to-scale VES production function (11) - (12) apply. Thus, we do not proceed toobtain estimates for the elasticities of substitution for the variable-returns-to-scale
VES production function.
The foregoing analyses, based upon firm-level data, suggest that the constant-retums-to-scale CES production function (1) - (2) is an adequate representation ofthe data, given the assumptions of the models considered. Given the available dataand the assumptions of this production function, the hypothesis that the four food-processing industries have the same elasticities is not rejected. Thus, these data maybe aggregated to efficiently estimate the elasticity for the two-digit-levelindustry,Food Processing. The estimated elasticity is significantly different from zero at theone-percent level, but not significantly different from one. In fact, none of theelasticity estimates obtained are significantly different from one. These analysessuggest strongly that the Cobb-Douglas production function is an adequaterepresentation of the fum-level data. Given the problems of estimation withinadequate capital data, the indirect form (2) of the CES production function (1)provides a convenient framework for estimating the elasticity of substitution. How-ever, the usefulness of the results obtained is limited by the extent to which theassumptions underlying the analysesare likely to be true.