Embed Size (px)
Citation preview

Virtual Instructor-Led Workshop SeriesBICSI 2018©
Estimation and Earned Value Management for ICT Projects
BICSI 2018©

Estimation Best Practices01
Overview of the Work Breakdown Structure (WBS)
02
Agenda
BICSI 2018©
Earned Value Management03

BICSI 2018©
Estimation Best Practices
BICSI 2018©

BICSI 2018© 4
What is the difference between an estimate and a guess?

BICSI 2018©BICSI 2018© 5
Estimate: Approximation, prediction, or projection of a quantity based on experience and/or information available at the time, with the recognition that other pertinent facts are unclear or unknown
Estimate: Approximation, prediction, or projection of a quantity based on experience and/or information available at the time, with the recognition that other pertinent facts are unclear or unknown
In other words:An estimate is almost the same as an educated guessIn other words:An estimate is almost the same as an educated guess

BICSI 2018© 6
Which estimation techniques have you used?Poll
Top-Down
Bottom-Up
Analogous
Parametric
PERT
What-If

BICSI 2018©
Common Estimating Practices
7
Top‐Down
Bottom‐Up Parametric
PERT
What‐If
Analogous
Past Project
New Project

BICSI 2018©BICSI 2018©
Pros Cons
Quickly Develop Estimate Accuracy
Lower Cost to Implement Overlooks Lower Levels of Input
Small Tasks Can Be Aggregated Potential to Mislead
8

BICSI 2018©BICSI 2018©
Pros Cons
Extremely Accurate Estimate Inflation Is Aggregated
Controls Cost Scope of Work Must Be Complete
Risks Can Be Identified Time Consuming to Develop
Bottom‐Up
9

BICSI 2018©BICSI 2018©
Pros Cons
Extremely Fast Requires Identical Projects
Easy to Implement Adjustments Can Be Subjective
Great for Initial Estimates Accuracy Can Suffer
Bottom‐UpAnalogous
Past Project
New Project
10

BICSI 2018©BICSI 2018©
Pros Cons
Versatility Database Requirements
Sensitivity Currency
Statistical Output Relevancy
AnalogousPast Project
New Project
Parametric
11

BICSI 2018©BICSI 2018©
PERT
Pros Cons
Easily Plan Large Projects Can Be Complicated
Can Show Critical Path Time Consuming
Accounts for Poor Outcomes Estimation Inaccuracies
12

BICSI 2018©
Task Optimistic Most Likely PessimisticTrench Pathway $15,000 $18,000 $22,000Install Conduit $2,000 $3,400 $4,600Install Fiber $8,000 $8,500 $8,750Test/Term Fiber $1,000 $1,250 $2,000
PERT Practice
Answer$18,166.67
$3,366.67$8,458.33$1,333.33
13

BICSI 2018©BICSI 2018©
Pros Cons
Evaluate Different Outcomes Garbage In/Garbage Out
More Informed Decisions/Outcomes
Information Overload
Improved Project Predictability Decision Paralysis
What‐If
14

BICSI 2018©
MoneyExperienceInformationTime
Which should you use?
15

BICSI 2018© 16
• You have been asked to estimate a small project.
• You will have 48 Category 6A cables running from one patch panel to another.
• The total distance between panels, include slack up and down, is 280 ft.
• How many 1000‐ft boxes of cable will be needed?
Exercise: Quick Estimate?

BICSI 2018©
Steps to Better Estimates
Documentation Understand the Scope
Clarify Assumptions
Create a ChecklistEvaluate RiskUnderstand
Constraints
Review Peer/Delayed
Management Buy-in
17

BICSI 2018© 18
What pieces of documentation should we have for proper estimating?

BICSI 2018©
Documentation
19
BICSI 2018©
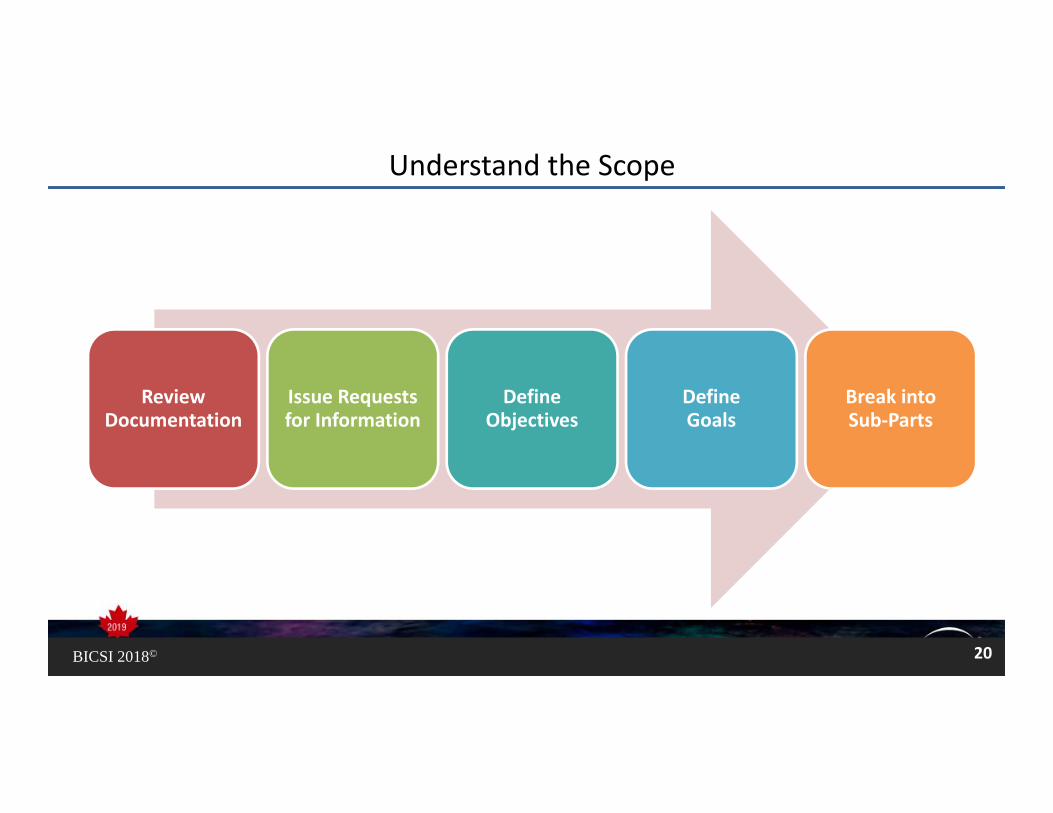
Review Documentation
Issue Requests for Information
Define Objectives
Define Goals
Break into Sub‐Parts
Understand the Scope
20

BICSI 2018©
Clarify Assumptions
Common Assumptions
LaborCosts
Working Hours
MaterialAvailability
Equipment
Indirect Costs
Site Access
Pathways
FurniturePlacement
21

BICSI 2018©
Create Checklist
Organization
Motivation
Productivity
Creativity
Delegation
Excellence
22

BICSI 2018©
Evaluate Risk
TechnicalTechnical LogisticalLogistical EnvironmentalEnvironmental
ManagementManagement FinancialFinancial Socio-PoliticalSocio-Political
23

BICSI 2018© 24
• At project estimation
• During project initiation
• I don’t currently evaluate risk
When do you evaluate risk??

BICSI 2018©
Cost Time Quality
Risk
Resources
Stakeholders
Technology
Safety
Environment
Understand Constraints
25

BICSI 2018©BICSI 2018©
No one but a fool is always right““
‐ David Hare
26

BICSI 2018©
Review Peer/Delayed
Review the Estimate
Verify Data
Don’t Miss Decimals
Phone a Peer
27

BICSI 2018©
Management Buy‐in
28

BICSI 2018©BICSI 2018©BICSI 2018© 29
How do you define labor?
What is it?
How do you calculate it?

BICSI 2018©
Labor Cost
Indirect$Direct$Labor$ = +
30

BICSI 2018©
Direct vs Indirect Costs
Wage paid to the employee
Direct$
Examples?
Indirect$
31

BICSI 2018©
Determine Base Compensation
STEP ONEHourly Base Pay $25.00 Hours Worked per Week 40Weeks per Year 52Base Compensation $52,000.00
Determine Base Compensation by multiplying the Hourly Base Pay by Hours Worked Per Week by Weeks Per Year.
32
1

BICSI 2018©
Determine the Hours of Total Paid Time Off
STEP TWOTotal Paid Time Off 88
HolidaysDays 6Hours 8Total 48
Vacation TimeDays 5Hours 8Total 40
Sick TimeDays 0Hours 8Total 0
Training TimeDays 0Hours 8Total 0
2 Determine the hours of Total Paid Time Off for which the employee is paid but does not work.
33

BICSI 2018©
Determine Admin Time
STEP THREE
Admin Time Per Year
Hours 2
Total Available Weeks 49
Total Yearly Admin 98
Determine the hours of Admin Time spent per year on tasks that are non-production related.
34
3

BICSI 2018©
Calculate Available Working Hours
STEP FOUR
Total Hours Per Year 2080
Total Paid Time Off 88
Available Working Hours 1992
Calculate Available Working Hours by subtracting Total Paid Time Off from the Total Hours per Year (usually 2080).
35
4

BICSI 2018©
Determine the Total Production Hours
STEP FIVE
Available Working Hours 1992
Admin Time 98
Total Production Hours 1894
Determine the Total Production Hours the employee can work by subtracting the Admin Time from the Available Working Hours.
36
5

BICSI 2018©
Calculate the Indirect Costs
STEP SIXIndirect Costs % $
Payroll Tax Rate 10% $5,200.00 Workers Compensation Rate 10% $5,200.00 Uniforms 1% $520.00 Tool Allowance 0% $0.00 Company Events 0% $0.00 Bonus 1% $520.00 Cost Of Living Increase 1% $520.00 Raises 1% $520.00 Health Insurance 3% $1,560.00
Total Indirect Costs $14,040.00
Calculate the Indirect Costs for the employee.
37
6

BICSI 2018©
Determine the Total Burden Labor
STEP SEVEN
Base Compensation $52,000.00
Total Indirect Costs $14,040.00
Total Burden Labor $66,040.00
Total Burden Labor is equal to the Base Compensation plus the Total Indirect Costs.
38
7

BICSI 2018©
Find the Actual Cost per Hour
STEP EIGHT
Total Burdened Labor $66,040.00
Total Production Hours 1894
Actual Cost Per Hour $34.87
To find the Actual Cost Per Hour, divide the Total Burden Labor by the Total Production Hours.
39
8

BICSI 2018©
Determine Labor Burden
STEP NINE
Actual Cost Per Hour $34.87
Hourly Base Pay $25.00
Labor Burden 1.40
40
Labor Burden can be determined taking Actual Cost Per Hour and dividing by Hourly Base Pay.9

BICSI 2018©
Determine the Labor Sale Price
STEP TEN
Markup on labor 25%
Actual Cost Per Hour $34.87
Labor Sale Price $43.59
41
Multiply the determined Markup on Labor by the Actual Cost per Hour to determine the Labor Sale Price.10

BICSI 2018©
Labor Calculator WorkbookLABOR CALCULATOR
STEP ONE STEP TWO STEP THREE
Hourly Base Pay $25.00 Total Paid Time Off 88 Admin Time Per Year
Hours Worked Per Week 40 Holidays Hours 2
Weeks Per Year 52 Days 6 Total Available Weeks 49
Base Compensation $52,000.00 Hours 8 Total Yearly Admin 98
Total 48
STEP FOUR STEP SIX
Total Hours Per Year 2080 Vacation Time Indirect Costs % $
Total Paid Time Off 88 Days 5 Payroll Tax Rate 10% $5,200.00
Available Working Hours 1992 Hours 8 Workers Compensation Rate 10% $5,200.00
Total 40 Uniforms 1% $520.00
STEP FIVE Tool Allowance 0% $0.00
Available Working Hours 1992 Sick Time Company Events 0% $0.00
Admin Time 98 Days 0 Bonus 1% $520.00
Total Production Hours 1894 Hours 8 Cost Of Living Increase 1% $520.00
Total 0 Raises 1% $520.00
STEP SEVEN Health Insurance 3% $1,560.00
Base Compensation $52,000.00 Training Time Total Indirect Costs $14,040.00
Total Indirect Costs $14,040.00 Days 0
Total Burdened Labor $66,040.00 Hours 8
Total 0
STEP EIGHT STEP NINE STEP TEN
Total Burdened Labor $66,040.00 Actual Cost Per Hour $34.87 Markup on labor 25%
Total Production Hours 1894 Hourly Base Pay $25.00 Actual Cost Per Hour $34.87
Actual Cost Per Hour $34.87 Labor Burden 1.40 Labor Sale Price $43.59
42
BICSI 2018©
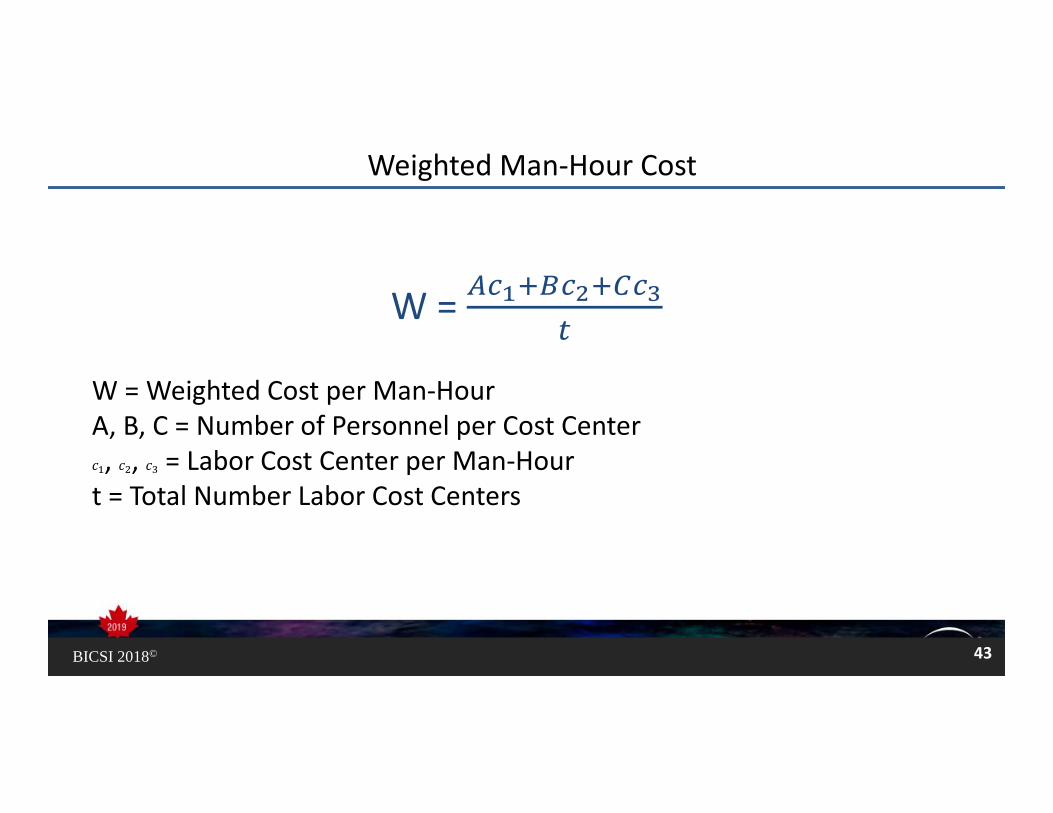
W =
W = Weighted Cost per Man‐HourA, B, C = Number of Personnel per Cost Center, , = Labor Cost Center per Man‐Hourt = Total Number Labor Cost Centers
Weighted Man‐Hour Cost
43

BICSI 2018©
Weighted Man‐Hour Cost Scenario
Labor Cost Center Quantity Cost/Man Hour Total Man Hour Cost
Apprentice 6 $25.00 $150.00
Journeyman 3 $35.00 $105.00
Foreman 1 $45.00 $ 45.00
44

BICSI 2018©
“Lots of Math”
W =
W =
W =
W =$10045

BICSI 2018©
Labor Cost Center Cost/Man Hour Quantity Total Per Man Hour Man Hours Cost
Apprentice $25.00 6 $150.00 40 $6,000.00
Journeyman $35.00 3 $105.00 40 $4,200.00
Foreman $45.00 1 $45.00 40 $1,800.00
Totals: 120 $12,000.00
Scenario Check
∗
$100 ∗ 120 $12,000
46

BICSI 2018©
Week of Extended OT 50 hrs/wk 60 hrs/wk 70‐72 hrs/wk 84 hrs/wk
1 0.95 0.91 0.86 0.75
2 0.93 0.88 0.80 0.70
3 0.92 0.85 0.73 0.65
4 0.91 0.81 0.68 0.60
5 0.85 0.76 0.63 0.55
6 0.86 0.72 0.58 0.50
7 0.76 0.67 0.54 0.47
8 0.77 0.64 0.51 0.44
9 0.74 0.62 0.50 0.43
10 0.72 0.61 0.49 0.42
11 0.72 0.60 0.48 0.41
12 0.71 0.59 0.47 0.40
13 0.69 0.56 0.46 0.39
14 0.68 0.55 0.45 0.38
15 0.67 0.54 0.44 0.37
16 0.66 0.53 0.43 0.36
Overtime
47

BICSI 2018© 48
Create labor rates for your sample project using the template provided (Materials):
• Assign at least four labor categories with a different number of personnel for each category.
• Compute the Weighted Man‐Hour Cost.
Exercise

BICSI 2018©
Recap and Review
49
Weighted Labor Calculator
Weighted Labor Rate $ 67.16
Labor Cost Center Number of Personnel Cost/Man Hour Total Cost
Apprentice 4 $ 31.38 $ 125.52
Journeyman 2 $ 43.59 $ 87.18
Foreman 1 $ 61.02 $ 61.02
Site Safety 1 $ 39.05 $ 39.05
Project Coordinator 1 $ 23.01 $ 23.01

BICSI 2018©
The Work Breakdown Structure (WBS)
BICSI 2018©

BICSI 2018©BICSI 2018©BICSI 2018© 51
Which project would you choose?
Photoshoot for Great White Sharks
Study of Polar Bear Migration Patterns
Study of Anacondas in Captivity

BICSI 2018© 52
• Yes
• Sometimes
• No
• What’s a project charter?
Do you create a project charter for every project??

BICSI 2018©BICSI 2018©
First, have a definite, clear practical ideal; a goal, an objective. Second, have the
necessary means to achieve your ends; wisdom, money, materials, and methods. Third, adjust all your means to that end.
““
‐ Aristotle
53

BICSI 2018©
Project Charter
Defines
• Scope• Objectives• Overall Approach
Critical Element
• Initiating• Planning• Executing• Controlling• Assessing
Single Point of Reference
• Project goals• Scope• Organization• Estimates• Work Breakdown Structure
• Budget
Contract
• Budget• Time• Risks• Resources• Standards
54

BICSI 2018©
Goals and Objectives
Statements of Work (SOW)
Organizational Impacts
Project Deliverables
Project Estimated Costs & Duration
Scope of Work
55

BICSI 2018©
Recall: Documentation
56

BICSI 2018©
Recall: Evaluate Risk
TechnicalTechnical LogisticalLogistical EnvironmentalEnvironmental
ManagementManagement FinancialFinancial Socio-PoliticalSocio-Political
57

BICSI 2018©
Cost Time Quality
Risk
Resources
Stakeholders
Technology
Safety
Environment
Recall: Understand Constraints
58

BICSI 2018©BICSI 2018©BICSI 2018© 59
What is a Work Breakdown
Structure?

BICSI 2018©
Work Breakdown Structure
Project Scope DefinedProject Scope Defined Outcome OrientedOutcome Oriented
60

BICSI 2018©
• The total program can be described as a summation of subdivided elements
• Planning can be performed
• Costs and budgets can be established
• Time, cost, and performance can be tracked
• Objectives can be linked to company resources in a logical manner
• Schedules and status-reporting procedures can be established
• Network construction and control planning can be initiated
• The responsibility assignments for each element can be established
Why Is It Important?
61
BICSI 2018©
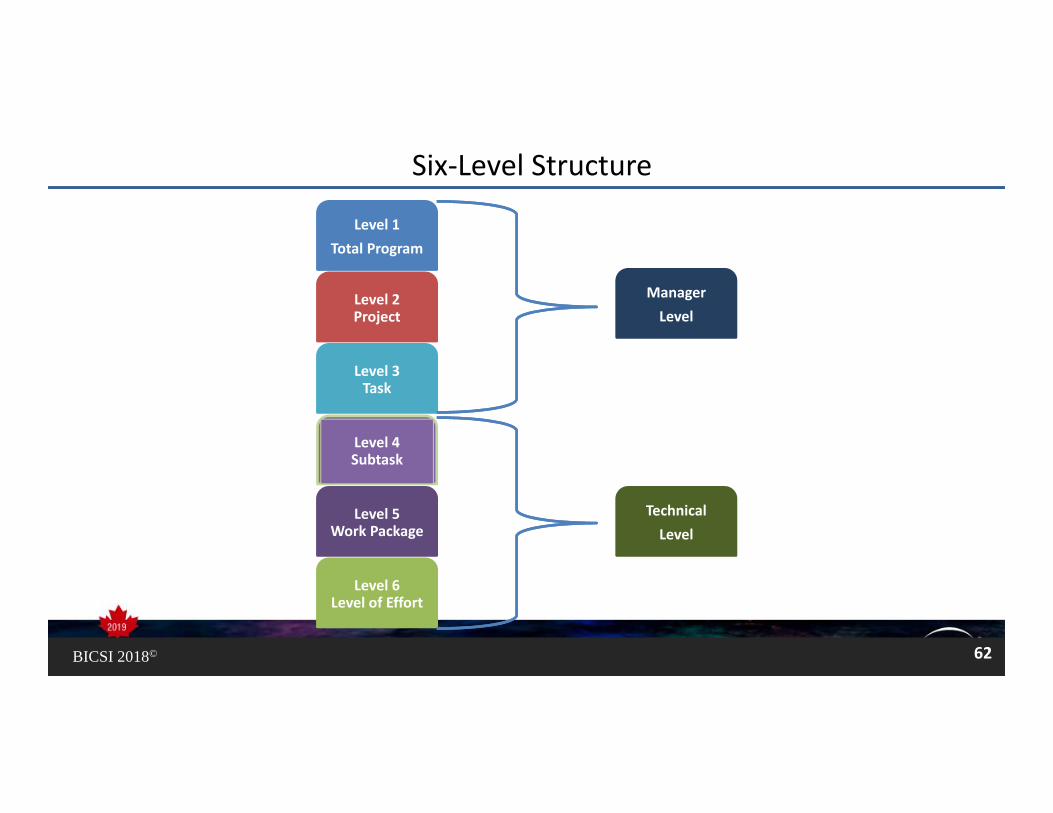
Six‐Level Structure
Level 1Total Program
Level 2Project
Level 3Task
Level 4Subtask
Level 5Work Package
Level 6Level of Effort
ManagerLevel
TechnicalLevel
62

BICSI 2018©
Outline
Two Basic Types of Work Breakdown Structure Design
1. University ICT Upgrade
1.1. Business Building
1.1.1. First Floor TR
1.1.1.1. Ladder Rack Construction
1.1.1.1.1. Install Supports
1.1.1.1.1.1. Install Anchors
1.1.1.1.1.2. Install Threaded Rod
1.2. Science Building
1.2.1. First Floor TR
Tree
University ICT Upgrade
Business Building
First Floor TR
Ladder Rack Construction
Install Supports
Install Anchors
Install Threaded Rod
Second Floor TR
Science Building
First Floor TR
63

BICSI 2018©
Do not attempt to subdivide work to the lowest possible level.
DO WHAT MAKES SENSE!
How Detailed Does It Need to Be?
1. University Project
Level 1Total Program
1.1. Business Building
Level 2Project
1.1.1 First Floor TR
Level 3Task
1.1.1.1. Ladder Rack Construction
Level 4Subtask
1.1.1.1.1. Install Supports
Level 5Work Package
1.1.1.1.1.1. Install Anchors
Level 6Level of Effort
64

BICSI 2018©
Rules for Work Breakdown Structures
The WBS and work description should be easy to understand.1
65
HS11

Slide 65
HS11 What do you think about having the list build over the slides? If it is too much, I can rethinkHeather Stadelhofer, 5/7/2018

BICSI 2018©
Rules for Work Breakdown Structures
The WBS and work description should be easy to understand.1Since scope of effort can change during a program, every effort should be made to maintain flexibility in the WBS.2
66

BICSI 2018©
Rules for Work Breakdown Structures
The WBS and work description should be easy to understand.1
Most WBS elements (at the lowest control level) range from 0.5 to 2.5 percent of the total project budget.3
Since scope of effort can change during a program, every effort should be made to maintain flexibility in the WBS.2
67

BICSI 2018©
Rules for Work Breakdown Structures
The WBS and work description should be easy to understand.1
The WBS can act as a list of discrete and tangible milestones so that everyone will know when the milestones were achieved.4
Most WBS elements (at the lowest control level) range from 0.5 to 2.5 percent of the total project budget.3
Since scope of effort can change during a program, every effort should be made to maintain flexibility in the WBS.2
68

BICSI 2018©
Rules for Work Breakdown Structures
All schedules should follow the WBS.5
The WBS and work description should be easy to understand.1
The WBS can act as a list of discrete and tangible milestones so that everyone will know when the milestones were achieved.4
Most WBS elements (at the lowest control level) range from 0.5 to 2.5 percent of the total project budget.3
Since scope of effort can change during a program, every effort should be made to maintain flexibility in the WBS.2
69

BICSI 2018©
Level One—Define the Major Deliverables
1. University Project
Level 1Total ProgramUniversity ICT
Upgrade
70

BICSI 2018©
Level Two — Sub Deliverables / Project Level
1. University Project
Level 1Total Program
1.1. Business Building
Level 2Project
University ICT Upgrade
Business Building
Science Building
71

BICSI 2018©
Level Three — Task
1. University Project
Level 1Total Program
1.1. Business Building
Level 2Project
1.1.1 First Floor TR
Level 3Task
University ICT Upgrade
Business Building
First Floor TR Second Floor TR
Science Building
First Floor TR
72

BICSI 2018©
Level Four—Subtask
1. University Project
Level 1Total Program
1.1. Business Building
Level 2Project
1.1.1 First Floor TR
Level 3Task
1.1.1.1. Ladder Rack Construction
Level 4Subtask
University ICT Upgrade
Business Building
First Floor TR
Ladder Rack Construction
Second Floor TR
Science Building
First Floor TR
73

BICSI 2018©
Level Five —Work Package
1. University Project
Level 1Total Program
1.1. Business Building
Level 2Project
1.1.1 First Floor TR
Level 3Task
1.1.1.1. Ladder Rack Construction
Level 4Subtask
1.1.1.1.1. Install Supports
Level 5Work Package
University ICT Upgrade
Business Building
First Floor TR
Ladder Rack Construction
Install Supports
Second Floor TR
Science Building
First Floor TR
74

BICSI 2018©
Level Six — Level of Effort
1. University Project
Level 1Total Program
1.1. Business Building
Level 2Project
1.1.1 First Floor TR
Level 3Task
1.1.1.1. Ladder Rack Construction
Level 4Subtask
1.1.1.1.1. Install Supports
Level 5Work Package
1.1.1.1.1.1. Install Anchors
Level 6Level of Effort
University ICT Upgrade
Business Building
First Floor TR
Ladder Rack Construction
Install Supports
Install Anchors
Install Threaded Rod
Second Floor TR
Science Building
First Floor TR
75

BICSI 2018©
1. University ICT Upgrade1.1. Business Building 1.1.1. First Floor TR1.1.1.1. Ladder Rack Construction1.1.1.1.1. Install Supports1.1.1.1.1.1. Install Anchors1.1.1.1.1.2. Install Threaded Rod1.2. Science Building1.2.1. First Floor TR1.3 Change Orders1.3.1. First Floor Cable Additions1.3.1.1. Add Two Cables to Room 124
Change Orders
University ICT Upgrade
Business Building
First Floor TR
Ladder Rack Construction
Install Supports
Install Anchors
Install Threaded Rod
Second Floor TR
Science Building
First Floor TR
Change Orders
First Floor Cable
Additions
Add Two Cables to Room 214
76
BICSI 2018©
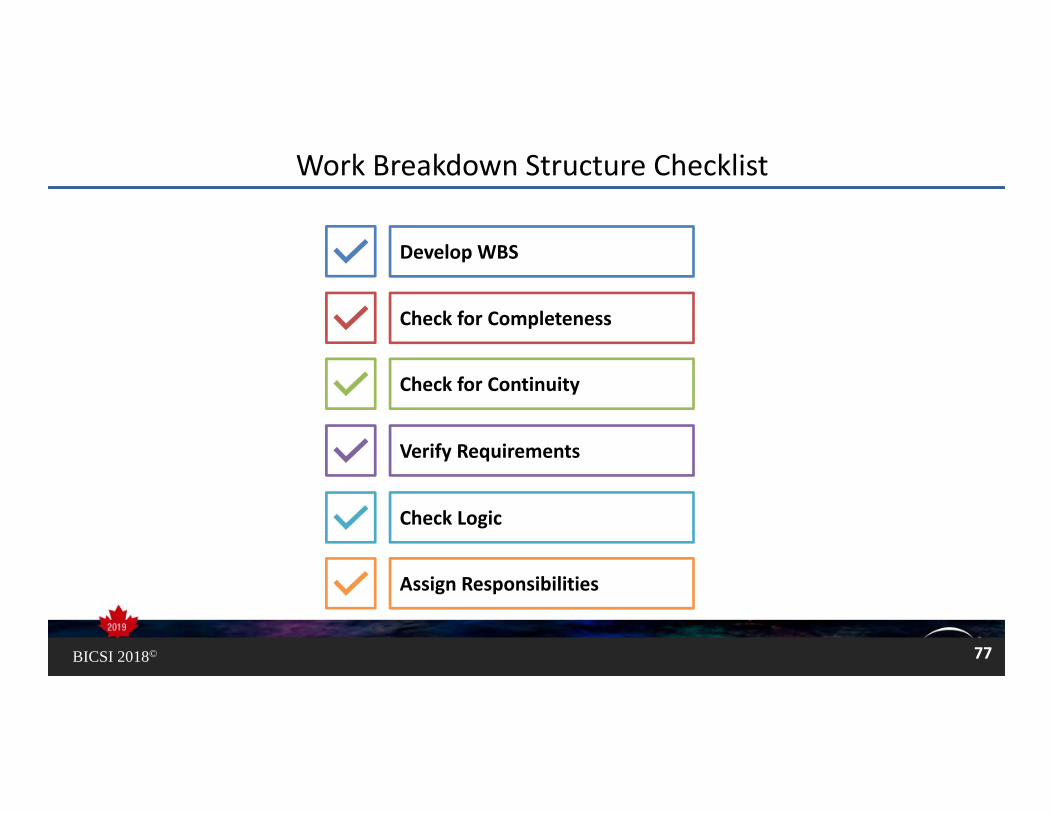
Work Breakdown Structure Checklist
Develop WBS
Check for Completeness
Check for Continuity
Verify Requirements
Check Logic
Assign Responsibilities
77

BICSI 2018©
BICSI Example —Work Breakdown Structure
78

BICSI 2018©
Simple Scope of Work
79

BICSI 2018©
Simple Prints
80

BICSI 2018© 81
Create a Work Breakdown Structure

BICSI 2018©
Work Breakdown Structure —Outline1. Building Two Second Floor
1.1. Upgrade Activities 1.1.1. Telecommunications room (TR)
1.1.1.1. Room preparation 1.1.1.2. Remove existing Category 6 cable distribution equipment 1.1.1.3. Installation of Category 6A cable distribution equipment 1.1.1.4. Bonding and Grounding verification 1.1.1.5. Cleanup and restoration
1.1.2. Firestop, cleanup, and restoration 1.1.3. Horizontal cabling (including)
1.1.3.1. Remove Existing Category 6 cable 1.1.3.2. Pull new Category 6A cables 1.1.3.3. Dress new Category 6A cables 1.1.3.4. Terminate new Category 6A twisted-pair (TRs) 1.1.3.5. Faceplate install/jacking 1.1.3.6. Test new Category 6A cable 1.1.3.7. Apply faceplate labels 1.1.3.8. Inspection and acceptance
1.1.4. Materials 1.1.4.1. Material order 1.1.4.2. Material delivery to site 1.1.4.3. Material issuance 1.1.4.4. Recycle existing Category 6 cable
1.1.5. Operations & Maintenance Manual 1.1.5.1. Recycling Documentation 1.1.5.2. As-Built Documentation 1.1.5.3. As-built Drawings 1.1.5.4. Test results
82

BICSI 2018©
Work Breakdown Structure — Tree
Building Two Second Floor
Upgrade Activities
Building 2 2nd Floor
Upgrade Activities
TRFirestop,
cleanup, and restoration
Horizontal cabling Materials O&M Manual
Room preparation
Remove existing Cat 6 cable distribution
equipment
Installation of Cat 6A cable
distribution equipment
Bonding & grounding verification
Cleanup and restoration
Remove existing Cat 6 cables
Pull new Cat 6A cables
Dress new Cat 6A cables
Terminate new Cat 6A twisted-pair (TR)
Faceplate/install jacking
Test new Cat 6A cables
Apply faceplate labels
Inspection & acceptance
Material order
Material delivery to site
Material issuance
Recycle existing
Cat 6 cable
Recycling documentation
As-Built documentation
As-built drawings
Test results
83

BICSI 2018©
Earned Value Management (EVM)
BICSI 2018©

BICSI 2018©BICSI 2018©BICSI 2018© 85
How do you feel about math?Poll?
I love it! It was my favorite class!
Math? There’s a reason I majored in history…

BICSI 2018©
Planned ValuePVBudget at
Completion
Actual CostAC Earned ValueEV
Lots O’ Math
Elements of EVM
BAC
LOM
86

BICSI 2018©
Planned Value (PV)
0
10000
20000
30000
40000
50000
60000
70000
March April May June July August
Planned Value
87

BICSI 2018©
Outline
Work Breakdown Structure Planned Values
1. University ICT Upgrade
1.1. Business Building
1.1.1. First Floor TR
1.1.1.1. Ladder Rack Construction
1.1.1.1.1. Install Supports - $1,200
1.1.1.1.1.1. Install Anchors - $800
1.1.1.1.1.2. Install Threaded Rod - $400
1.2. Science Building
1.2.1. First Floor TR
Tree
University ICT Upgrade
Business Building
First Floor TR
Ladder Rack Construction
Install Supports $1,200
Install Anchors $800
Install Threaded Rod
$400
Second Floor TR
Science Building
First Floor TR
88

BICSI 2018©
Budget at Completion (BAC)
0
10000
20000
30000
40000
50000
60000
70000
March April May June July August
Planned Value
89

BICSI 2018©
Actual Cost (AC)
0
10000
20000
30000
40000
50000
60000
70000
80000
March April May June July August
Actual Cost
90
BICSI 2018©
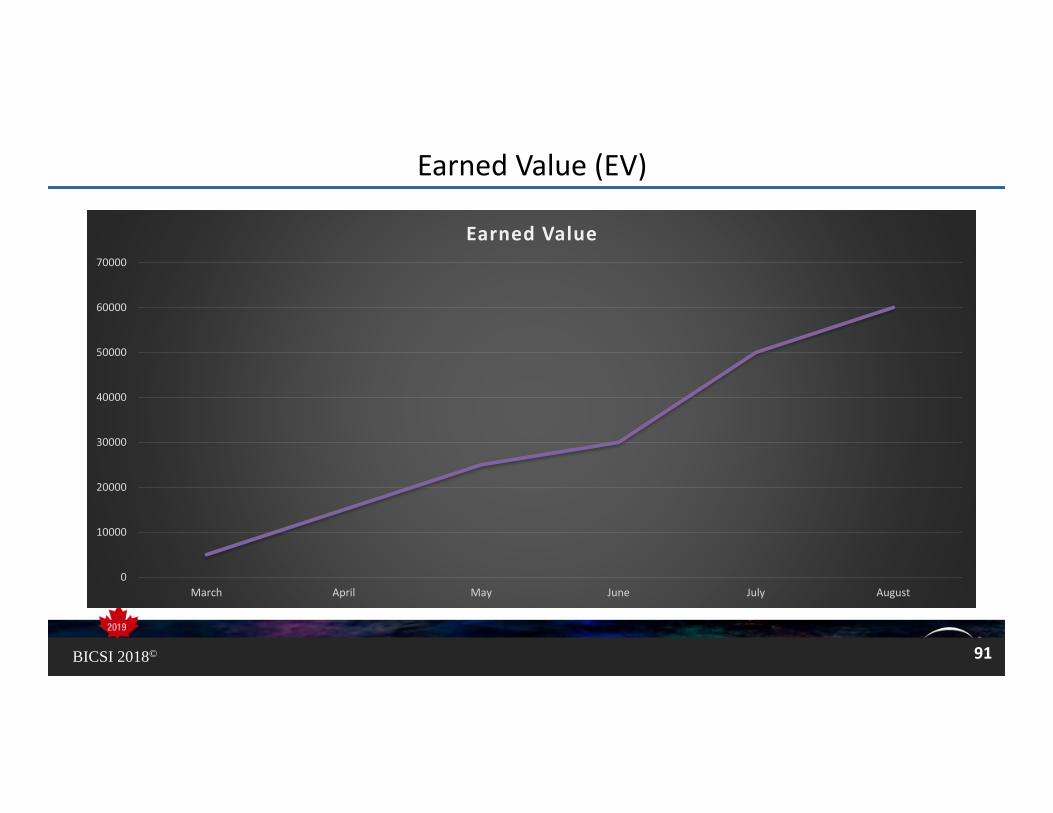
Earned Value (EV)
0
10000
20000
30000
40000
50000
60000
70000
March April May June July August
Earned Value
91

BICSI 2018©
Earned Value Defined
WBS ITEM QUANTITY
1.1.1.1.1 Install Supports1.1.1.1.1.1 Install Anchors 120
1.1.1.1.1.2 Install Threaded Rod 120
92
BICSI 2018©
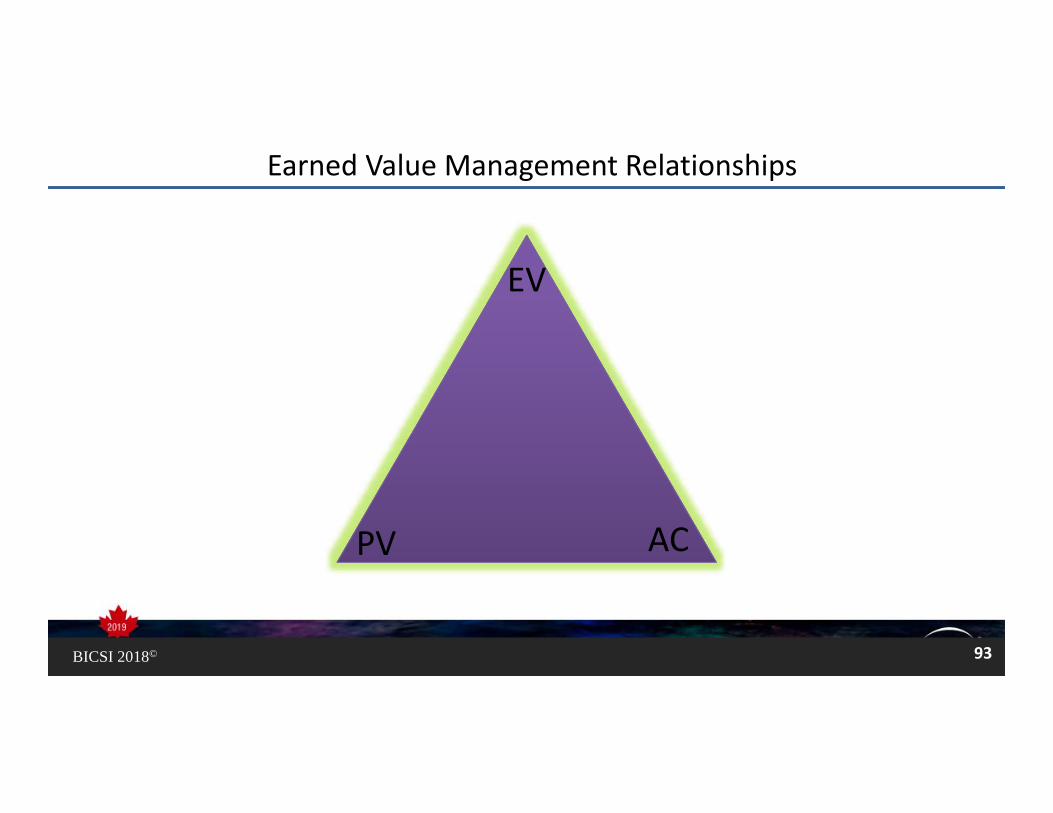
Earned Value Management Relationships
EV
PV AC
93

BICSI 2018©BICSI 2018©
Pure mathematics is, in its way, the poetry of logical ideas.
““
‐ Albert Einstein
94

BICSI 2018©
NAME ACRONYM FORMULA USE
Cost Variance CV EV‐AC Cost baseline comparison
Schedule Variance SV EV‐PV Schedule baseline comparison
Cost Performance Index CPI EV/AC Project budget efficiency
Schedule Performance Index SPI EV/PV Project schedule efficiency
Cost Schedule Index CSI CPI x SPI Likelihood of project recover
Work in Progress WIP (CPI x SPI)/2 Cash flow and billing
Estimate At Completion EAC BAC/CPI Project cost at completion
Estimate To Completion ETC EAC‐AC Budget to spend to complete project
Variance At Completion VAC BAC‐EAC Amount over/under original budget
To Complete Performance Index – BAC (BAC‐EV)/(BAC‐AC) CPI needed to meet original budget
To Complete Performance Index – EAC (BAC‐EV)/(EAC‐AC) CPI needed to meet Estimate at Completion
Lots O’ Math
95
BICSI 2018©
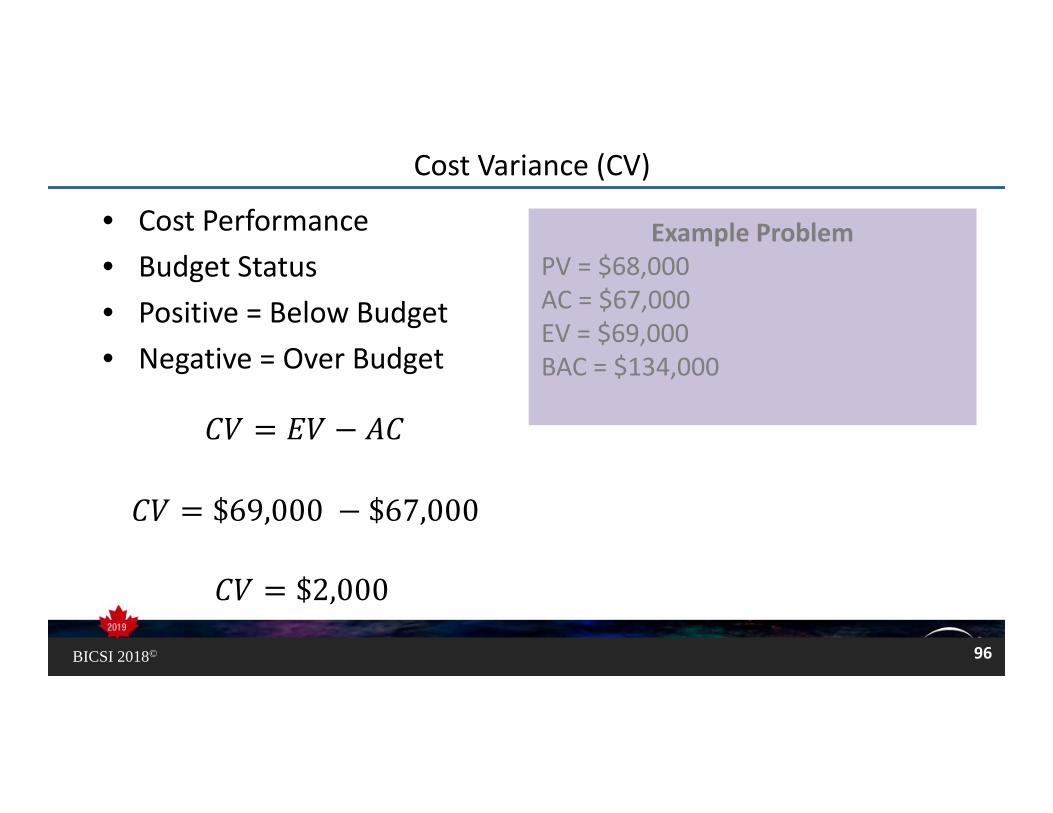
$69,000 $67,000
$2,000
Cost Variance (CV)
Example ProblemPV = $68,000AC = $67,000EV = $69,000BAC = $134,000
• Cost Performance• Budget Status• Positive = Below Budget• Negative = Over Budget
96

BICSI 2018©
Cost Variance (CV) – Student Problem One
Student ProblemPV = $35,000AC = $41,000EV = $33,000BAC = $94,000
$33,000 $41,000
$ 8,000
97

BICSI 2018©
Schedule Variance (SV)
Example ProblemPV = $68,000AC = $67,000EV = $69,000BAC = $134,000
$69,000 $68,000
$1,000
• Schedule Performance• Schedule Status• Positive = Ahead of Schedule• Negative = Behind Schedule
98

BICSI 2018©
Schedule Variance (SV) – Man Hours
$69,000 $68,000
$1,000$1,000$25.00
40 $25.00
99

BICSI 2018©
$33,000 $35,000
$ 2,000
Schedule Variance (SV) – Student Problem Two
Student ProblemPV = $35,000AC = $41,000EV = $33,000BAC = $94,000
100
BICSI 2018©
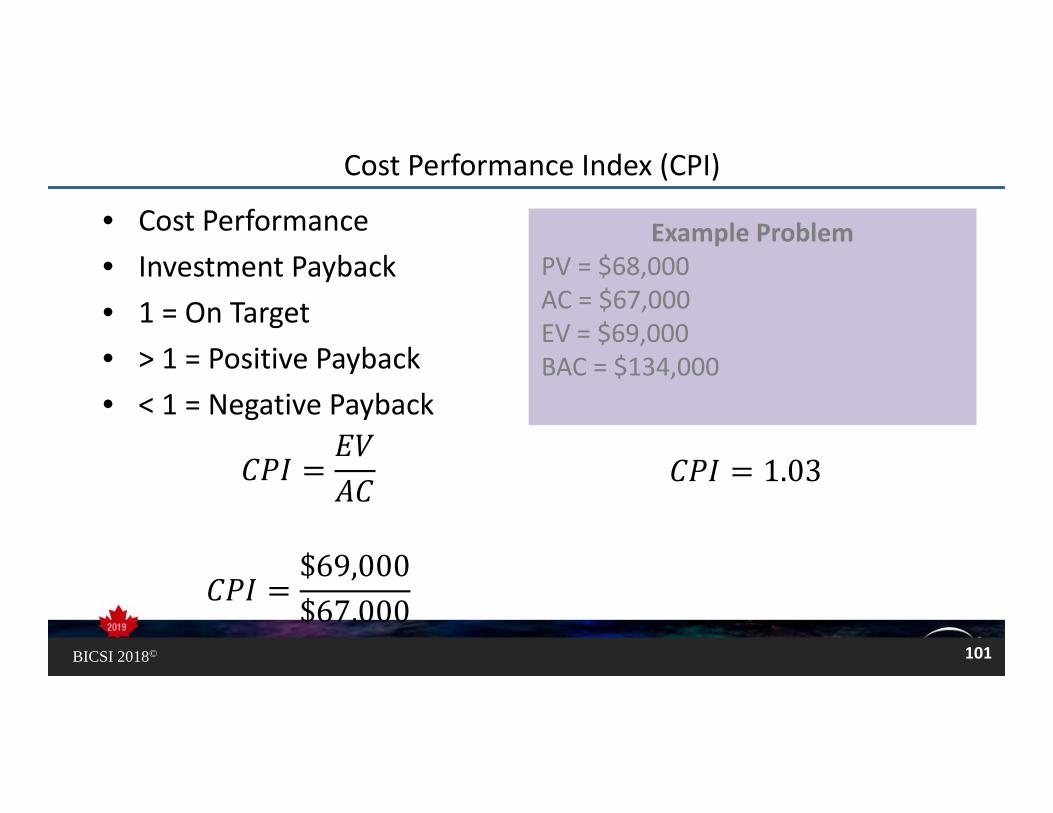
Cost Performance Index (CPI)
Example ProblemPV = $68,000AC = $67,000EV = $69,000BAC = $134,000
$69,000$67,000
• Cost Performance• Investment Payback• 1 = On Target• > 1 = Positive Payback• < 1 = Negative Payback
1.03
101

BICSI 2018©
$33,000$41,000
.81
Cost Performance Index (CPI) – Student Problem Three
Student ProblemPV = $35,000AC = $41,000EV = $33,000BAC = $94,000
102
BICSI 2018©
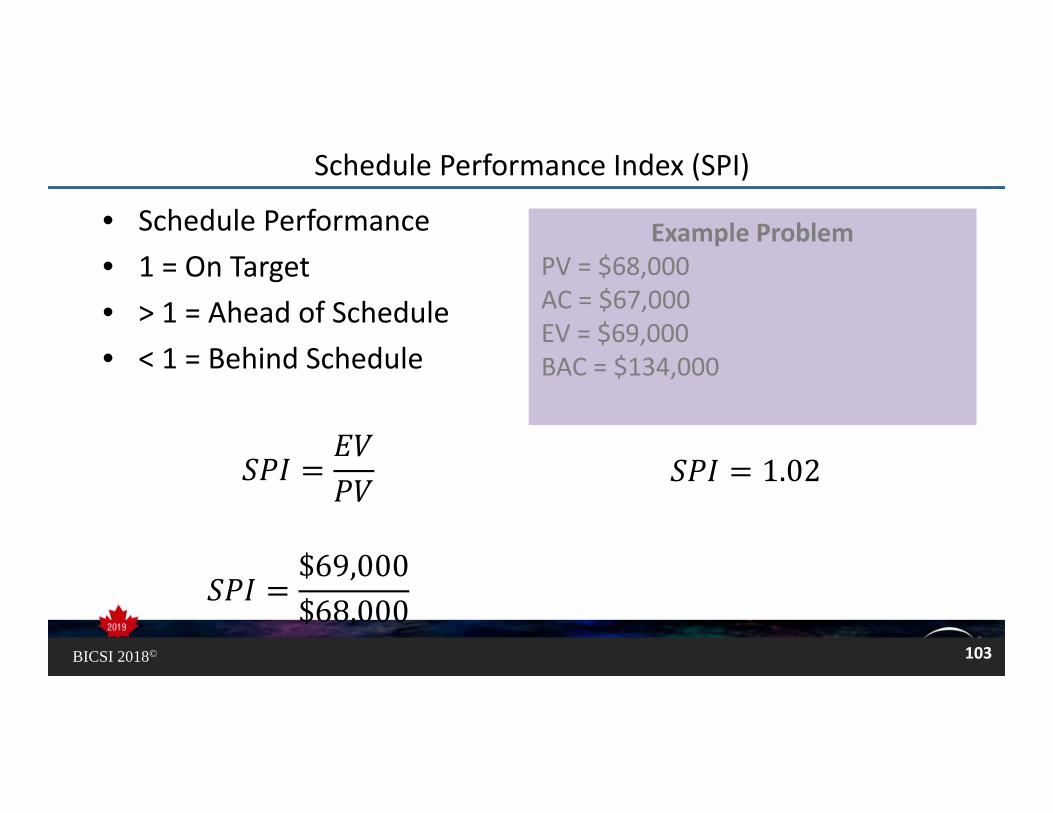
Schedule Performance Index (SPI)
Example ProblemPV = $68,000AC = $67,000EV = $69,000BAC = $134,000
$69,000$68,000
• Schedule Performance• 1 = On Target• > 1 = Ahead of Schedule• < 1 = Behind Schedule
1.02
103
BICSI 2018©
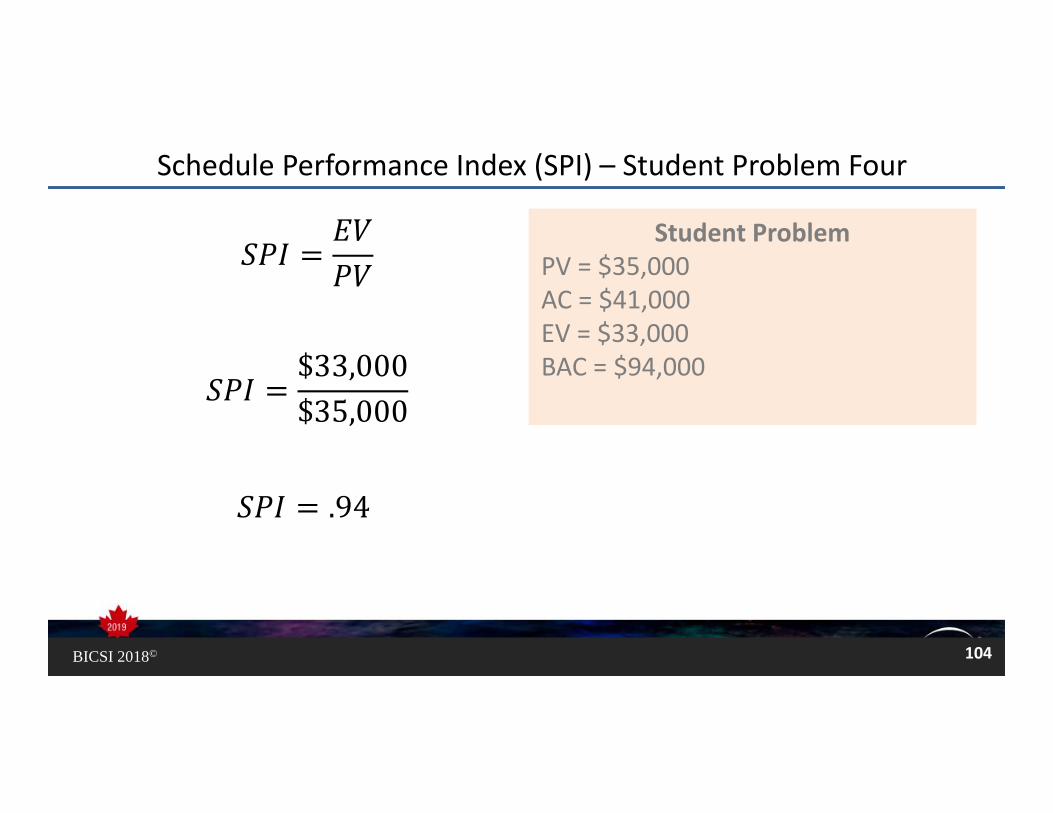
$33,000$35,000
.94
Schedule Performance Index (SPI) – Student Problem Four
Student ProblemPV = $35,000AC = $41,000EV = $33,000BAC = $94,000
104

BICSI 2018©
Control Charts
0.8
0.85
0.9
0.95
1
1.05
1.1
Week 1 Week 2 Week 3 Week 4 Week 5 Week 6 Week 7 Week 8 Week 9 Week 10 Week 11 Week 12
SPI and CPI Control Chart
Upper Control Limit SPI CPI Lower Control Limit
105

BICSI 2018©
• Showslikelihoodofprojectrecovery• 1poorlikelihood• 1greaterlikelihood
1.03 1.02
1.05
Cost Schedule Index (CSI)
Example ProblemPV = $68,000AC = $67,000EV = $69,000BAC = $134,000CPI = 1.03SPI = 1.02
106

BICSI 2018©
.81 .94
.76
Cost Schedule Index (CSI) – Student Problem Five
Student ProblemPV = $35,000AC = $41,000EV = $33,000BAC = $94,000CPI = .81SPI = .94
107

BICSI 2018©
2
1.03 1.022
1.03
Work in Progress (WIP)
Example ProblemPV = $68,000AC = $67,000EV = $69,000BAC = $134,000CPI = 1.03SPI = 1.02
108
BICSI 2018©
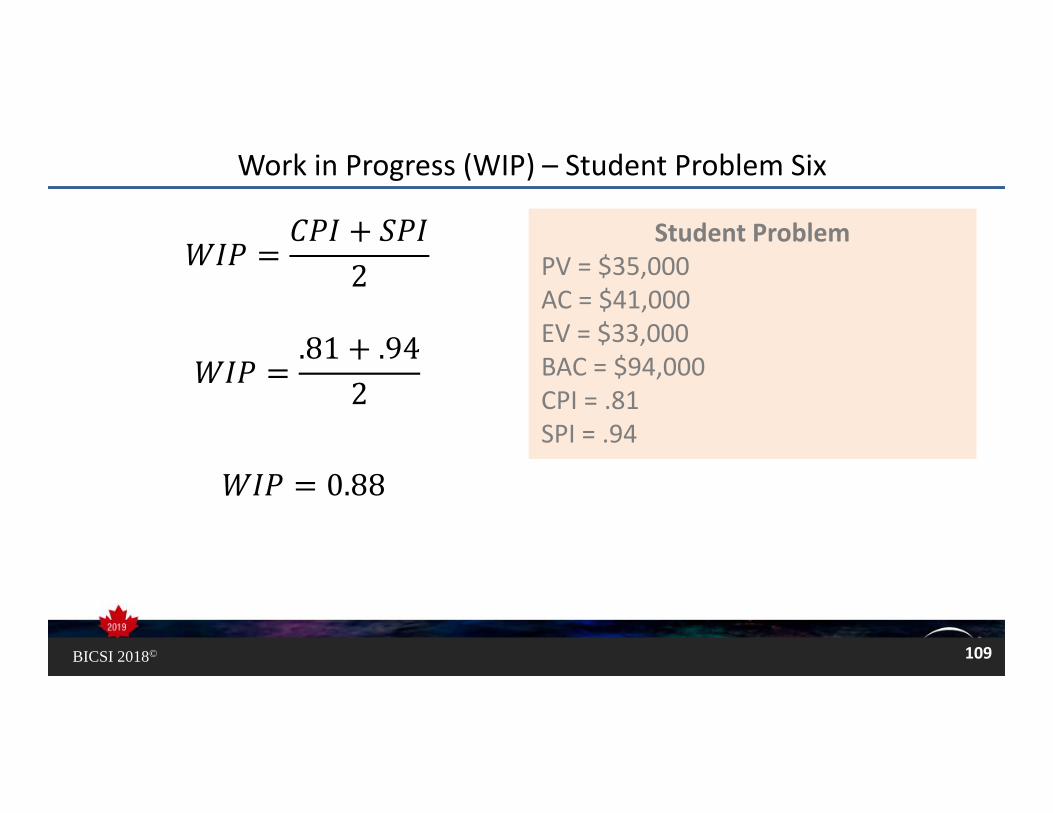
2
.81 .942
0.88
Work in Progress (WIP) – Student Problem Six
Student ProblemPV = $35,000AC = $41,000EV = $33,000BAC = $94,000CPI = .81SPI = .94
109

BICSI 2018©
• Estimated total cost of project if CPI remains constant
$134,0001.03
130,097
Estimate at Completion (EAC)
Example ProblemPV = $68,000AC = $67,000EV = $69,000BAC = $134,000CPI = 1.03SPI = 1.02
110

BICSI 2018©
$94,000.81
116,049
Estimate at Completion (EAC) – Student Problem Seven
Student ProblemPV = $35,000AC = $41,000EV = $33,000BAC = $94,000CPI = .81SPI = .94
111
BICSI 2018©
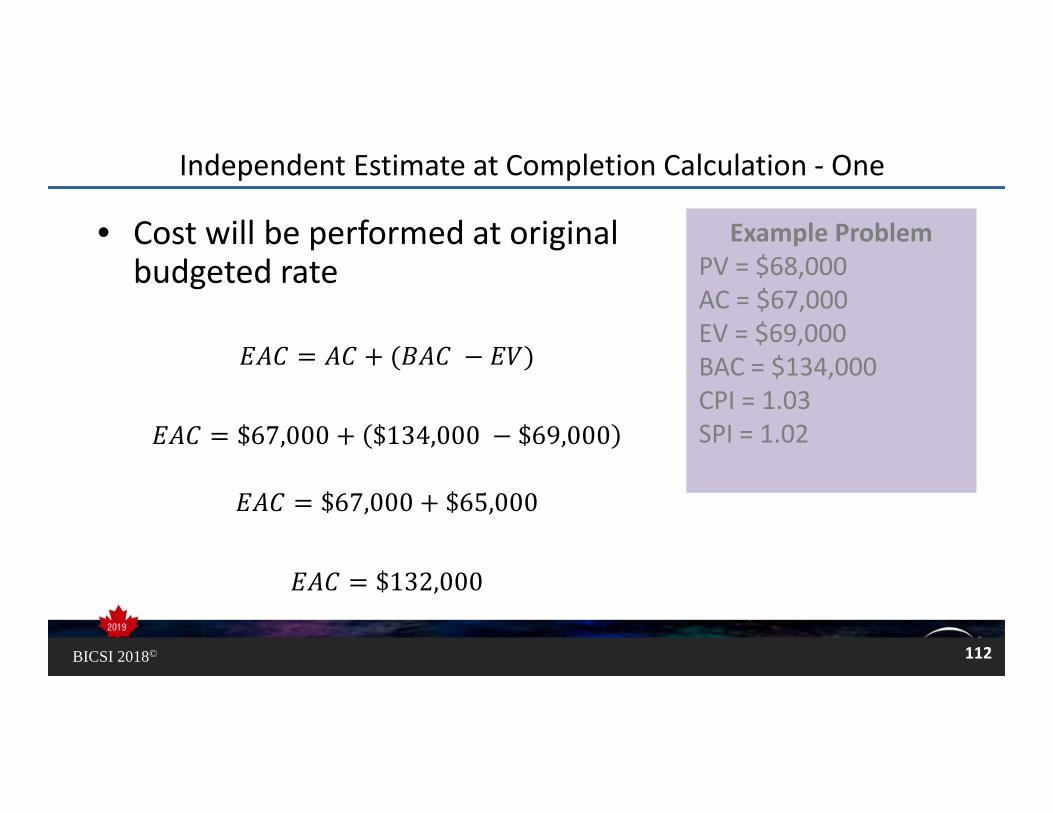
• Cost will be performed at original budgeted rate
$67,000 $134,000 $69,000
$67,000 $65,000
$132,000
Independent Estimate at Completion Calculation ‐ One
Example ProblemPV = $68,000AC = $67,000EV = $69,000BAC = $134,000CPI = 1.03SPI = 1.02
112
BICSI 2018©
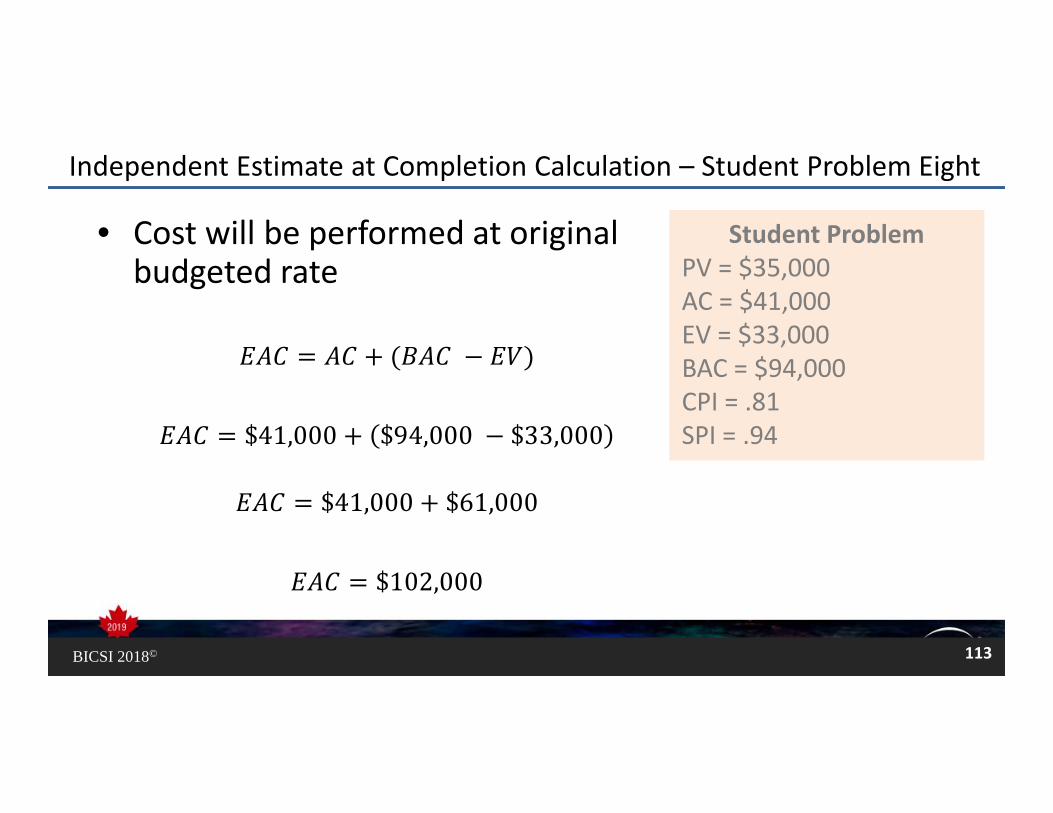
Independent Estimate at Completion Calculation – Student Problem Eight
Student ProblemPV = $35,000AC = $41,000EV = $33,000BAC = $94,000CPI = .81SPI = .94
• Cost will be performed at original budgeted rate
$41,000 $94,000 $33,000
$41,000 $61,000
$102,000
113

BICSI 2018©
• Future cost will be the same as the last three reporting periods.
⁄
Independent Estimate at Completion Calculation ‐ Two
114

BICSI 2018©
• Future performance will be affected by past schedule performance
$67,000 $134,000 $69,000
1.03 1.02
$67,000 $65,0001.05
Independent Estimate at Completion Calculation ‐ Three
Example ProblemPV = $68,000AC = $67,000EV = $69,000BAC = $134,000CPI = 1.03SPI = 1.02
115

BICSI 2018©
$67,000 $61,905
$128,905
Independent Estimate at Completion Calculation ‐ Three
116

BICSI 2018©
Independent Estimate at Completion Calculation – Student Problem Nine
Student ProblemPV = $35,000AC = $41,000EV = $33,000BAC = $94,000CPI = .81SPI = .94
$41,000 $94,000 $33,000
.81 .94
$41,000 $61,000.76
$41,000 $80,263
117
$121,263
BICSI 2018©
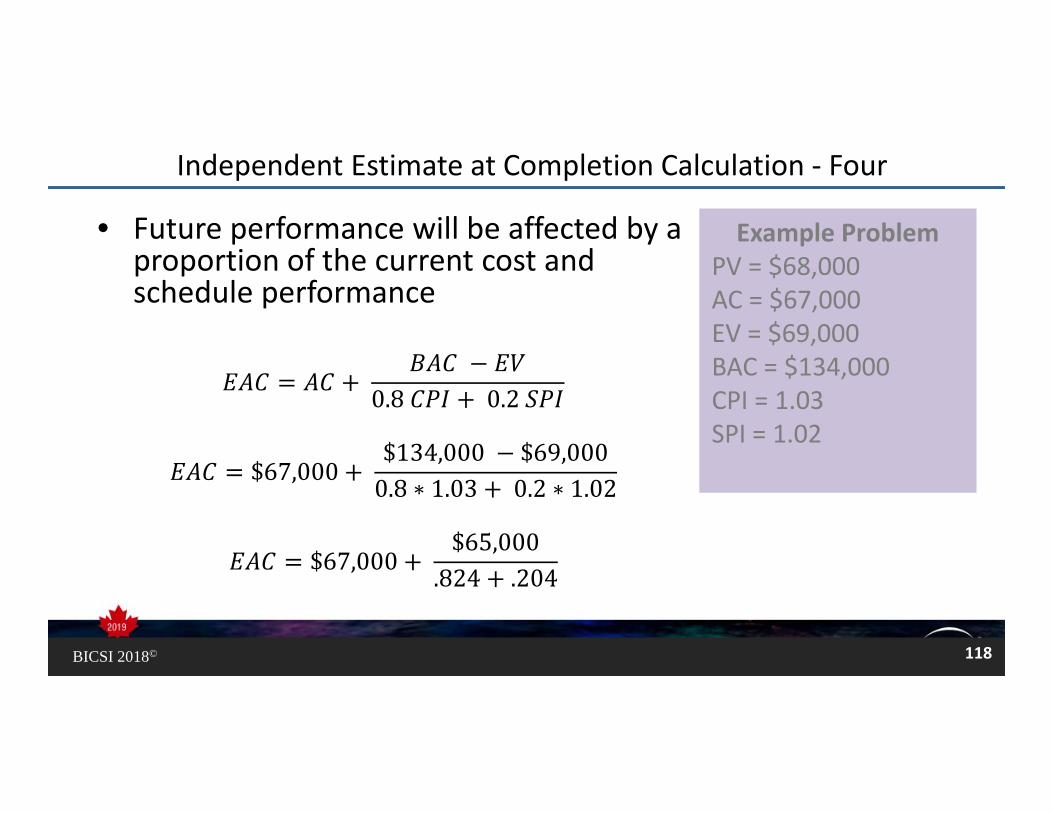
• Future performance will be affected by a proportion of the current cost and schedule performance
0.8 0.2
$67,000 $134,000 $69,0000.8 ∗ 1.03 0.2 ∗ 1.02
$67,000 $65,000
.824 .204
Independent Estimate at Completion Calculation ‐ Four
Example ProblemPV = $68,000AC = $67,000EV = $69,000BAC = $134,000CPI = 1.03SPI = 1.02
118

BICSI 2018©
$67,000 $65,0001.028
$67,000 $63,230
$130,230
Independent Estimate at Completion Calculation ‐ Three
119

BICSI 2018©
Independent EAC Calculation – Student Problem Ten
Student ProblemPV = $35,000AC = $41,000EV = $33,000BAC = $94,000CPI = .81SPI = .94
$41,000 $72,967
$113,967
0.8 0.2
$41,000 $94,000 $33,0000.8 ∗ .81 0.2 ∗ .94
$41,000 $61,000
.648 .188
$41,000$61,000.836
120

BICSI 2018©
EAC Method Example Value Student Value
$130,097 $116,049
$132,000 $102,000
$128,905 $121,000
0.8 0.2$130,230 $113,967
EAC Comparison
Example Student
BAC 134,000 94,000
121

BICSI 2018©
• Remaining amount to be spent on project with no change to CPI
$134,000 $69,0001.03
$65,0001.03
Estimate to Complete (ETC) – Statistical
Example ProblemPV = $68,000AC = $67,000EV = $69,000BAC = $134,000CPI = 1.03SPI = 1.02EAC = $130,097
63,107.00
122

BICSI 2018©
• Remaining amount to be spent on project using revised EAC
$130,097 $67,000
$70,097
Estimate to Complete (ETC) – Estimate at Completion
Example ProblemPV = $68,000AC = $67,000EV = $69,000BAC = $134,000CPI = 1.03SPI = 1.02EAC = $130,097
123

BICSI 2018©
$116,049 $41,000
$75,049
Estimate to Complete (ETC) – Student Problem Ten
Student ProblemPV = $35,000AC = $41,000EV = $33,000BAC = $94,000CPI = .81SPI = .94EAC = $116,049
124

BICSI 2018©
• How much more or less than was budgeted• Positive value is under the original budget• Negative value is over the original budget
$134,000 $130,097
$3,903
Variance at Completion (VAC)
Example ProblemPV = $68,000AC = $67,000EV = $69,000BAC = $134,000CPI = 1.03SPI = 1.02EAC = $130,097
125

BICSI 2018©
$94,000 $116,049
$ 22,049
Variance at Completion (VAC) – Student Problem Eleven
Student ProblemPV = $35,000AC = $41,000EV = $33,000BAC = $94,000CPI = .81SPI = .94EAC = $116,049
126

BICSI 2018©
• Target CPI to Complete project at original budget
• TPCI < 1 = Project likely to be at or under budget
• TCPI > 1 = Project NOT likely to be at or under budget
$134,000 $69,000$134,000 $67,000
To Complete Performance Index (TCPIBAC) ‐ Baseline
Example ProblemPV = $68,000AC = $67,000EV = $69,000BAC = $134,000EAC = $130,097
$65,000$67,000
.97
127

BICSI 2018©
$94,000 $33,000$94,000 $41,000
$61,000$53,000
1.15
To Complete Performance Index (TCPIBAC) – Student Problem 12
Student ProblemPV = $35,000AC = $41,000EV = $33,000BAC = $94,000CPI = .81SPI = .94EAC = $116,049
128

BICSI 2018©
• Target CPI to Complete project at revised budget
• TPCI < 1 = Project likely to be at or under budget
• TCPI > 1 = Project NOT likely to be at or under budget
$134,000 $69,000$132,000 $67,000
To Complete Performance Index (TCPIEAC) ‐ Estimate
Example ProblemPV = $68,000AC = $67,000EV = $69,000BAC = $134,000EAC* = $132,000
$65,000$63,097
1.03
129

BICSI 2018©
$94,000 $33,000$102,000 $41,000
$61,000$61,000
1.00
To Complete Performance Index (TCPIEAC) – Student Problem 13
Student ProblemPV = $35,000AC = $41,000EV = $33,000BAC = $94,000CPI = .81SPI = .94EAC* = $102,000
130

BICSI 2018©
TCPI Method Example Value Student Value
.97 1.15
∗
1.03 1.00
TCPI Comparison
Example Student
Calculated CPI 1.03 .81
Difference ‐0.6 .34
Difference 0.00 .19
131

BICSI 2018©
TCPI Control Chart
0.8
0.85
0.9
0.95
1
1.05
1.1
1.15
1.2
1.25
1.3
Week 1 Week 2 Week 3 Week 4 Week 5 Week 6 Week 7 Week 8 Week 9 Week 10 Week 11 Week 12
TCPI Control Chart
Upper Control Limit TCPI Lower Control Limit
132

BICSI 2018©
Earned Value Management Benefits
Utilizing EVM allows us to manage by exception.
Numbers don’t lie—usually.
Creates data-based decision-making.
Acts as tactical and strategic planning for projects and programs.
133

BICSI 2018©
EVM Workbook
134

BICSI 2018©BICSI 2018© 135BICSI 2018©
What is one thing you learned from the
course?

BICSI 2018©BICSI 2018© 136BICSI 2018©
Any Questions?

BICSI 2018©BICSI 2018© 137BICSI 2018©
35 CECs 6 CECs 2 CECs
PM102:Applied Telecommunications
Project Management
PM103:Advanced Tools for
ICT Project Management
Resource Management

BICSI 2018©BICSI 2018© 138BICSI 2018©
![Estimation of CO2 emission reduction and economic impacts of ICT ...€¦ · 2 emission reduction and economic impacts of ICT services using AIM/CGE [Japan] Machiko Shinozuka, Xiaoxi](https://img.dokumen.tips/doc/110x75/5f0da3287e708231d43b5735/estimation-of-co2-emission-reduction-and-economic-impacts-of-ict-2-emission.jpg)