Embed Size (px)
Citation preview
AQUACULTURE ENVIRONMENT INTERACTIONSAquacult Environ Interact
Vol. 8: 511–525, 2016doi: 10.3354/aei00195
Published September 1
INTRODUCTION
The initial post-smolt migration of salmon from theriver to the ocean is generally a period of high mortality (Lacroix et al. 2005, Thorstad et al. 2007,2011a,b, 2012b, Lacroix 2008, Dempson et al. 2011).This mortality partially results from a combination ofthe vulnerability of salmon smolts during the physio-logically challenging transition from freshwater tosaltwater habitat (Strand & Finstad 2007, Strand et al.2011) and the aggregation of predators in near-shorehabitats (Hvidsten & Lund 1988, Handeland et al.1996). Consequently, the migration speed throughthis transition zone can be understood as an optimal
strategy to reduce predator encounters by movingquickly while at the same time adjusting to the phys-iological stress associated with the transition fromfreshwater to saltwater (Thorstad et al. 2012b).
In addition to natural challenges, cumulative an -thropogenic factors that affect rivers and near-shorehabitats have increased, including factors such aspollution, bycatch in fisheries, river regulation andclimate change (Thorstad et al. 2011b). The mostpressing anthropogenic factor affecting Atlanticsalmon post-smolts is thought to be aquaculture(Costello 2006). Farmed fish in net pens can functionas source populations for diseases and parasites suchas sea lice that can then be transferred to wild fish
© The authors 2016. Open Access under Creative Commons byAttribution Licence. Use, distribution and reproduction areunrestricted. Authors and original publication must be credited.
Publisher: Inter-Research · www.int-res.com
*Corresponding author: [email protected]†Deceased
Estimating the temporal overlap between post-smolt migration of Atlantic salmon and salmon
lice infestation pressure from fish farms
K. W. Vollset1,*, B. T. Barlaup1, S. Mahlum1, P. A. Bjørn2, O. T. Skilbrei2,†
1Uni Research, Uni Environment, LFI, 5006 Bergen, Norway2Institute of Marine Research, 5817 Bergen, Norway
ABSTRACT: To be able to design effective management to alleviate wild fish from parasite infes-tation pressure from fish farms, it is pivotal to understand when post-smolts migrate past areas ofpotential exposure to salmon lice Lepeophtheirus salmonis. Here, data from release groups ofcoded-wire-tagged Atlantic salmon Salmo salar smolts and their subsequent recaptures in a trapnet in the outer fjord 12 to 97 km from the various release sites were used to estimate the smolts’progression rate and their arrival time in an outer fjord in Norway. The arrival time estimates tothe outer fjord are compared with modelled infestation pressure from local fish farms. The overallprogression rate varied from 0.8 to 31.2 km d−1 (0.05 to 2.20 body lengths s−1), with mean andmedian values of 8.8 and 7.8 km d−1, respectively (0.60 and 0.54 body lengths s−1). The progressionrate varied with water discharge from the rivers into the fjords, fish length, condition factor andsmolt origin. Simulated arrival time and capture of wild smolts suggest that smolts from the differ-ent rivers arrive in the outer fjord system with a difference of up to 4 wk. The arrival time for therivers with the longest migration was estimated to be from mid-May throughout June. Infestationpressure from fish farms increased from the beginning of June in 2 of 3 study years, suggestingthat an increase in lice exposure from fish farms will overlap with smolts from late-migrating populations in some but not all years.
KEY WORDS: Fish farm · Lepeophtheirus salmonis · Management · Progression rate · Salmo salar ·Sea lice
OPENPEN ACCESSCCESS

Aquacult Environ Interact 8: 511–525, 2016
(Tully & Nolan 2002, Vollset et al. 2015). Therefore, tominimize the potential impacts of sea lice, it isthought that coordinated winter and early springdelousing in farms can minimize the production ofinfectious free-living stages of lice during the migra-tion of wild salmon smolts (Heuch et al. 2005, Serra-Llinares et al. 2014). For instance, Peacock et al.(2013) documented how coordinated and correct useof winter delousing in nearby farms had a positiveeffect on the recruitment of wild pink salmon Onco-rhynchus gorbuscha. Thus, understanding the timingand duration of smolt migrations through areas ofhigh concentrations of fish farms is essential to beable to optimize and evaluate the effect of such miti-gation efforts.
One commonly used method to study the behav-iour of salmon smolts through near-shore environ-ments is the use of acoustic tags (Lacroix et al. 2005,Thorstad et al. 2007, Lacroix 2008, Skilbrei 2010,Dempson et al. 2011, Thorstad et al. 2011a,b, 2012b).However, the main disadvantages of using acoustictags are potential tag effects, handling of the fish anddifficulty in distinguishing live individuals from pre-dated individuals (Thorstad et al. 2012a, Gibson et al.2015). An alternate method is to employ a mark−recapture study design with the use of less invasivegroup tagging techniques such as coded wire tags(CWTs, Vollset et al. 2016). Although resolution islost compared to acoustic tags, the uncertaintiesassociated with predation and tagging effects arereduced. The method does not give detailed informa-tion on migration speeds of individual fish, but can beused to calculate progression rates during outwardmigration of salmon smolts.
Using cultivated Atlantic salmon Salmo salar smoltsfrom 3 cultivation sites from 2 stocking programmes,we used a mark−recapture study design to assessand predict the progression rate of salmon post-smolts through the estuary and early marine migra-tion. First, we modelled how river discharge, fishsize, condition factor and fish origin influenced theprogression rate. Second, we compared the catchesof wild post-smolts in a trap net with the simulatedprogression rates and times of fjord entry from thedifferent rivers in the system. Finally, we estimatedthe modelled salmon lice Lepeophtheirus salmonisinfestation pressure from surrounding fish farms andcompared it with the modelled time of arrival for thelargest river in the region, the Vosso River. Under-standing and predicting the migration timing of post-smolts will enable managers to provide guidelines foreffective lice treatment in aquaculture to minimizeimpacts on wild fish.
MATERIALS AND METHODS
Study area
The study area is located on the west coast of Nor-way (Fig. 1; Vosso: 60° 64’ N, 5° 95’ E, Dale: 60° 58’ N,5° 78’ E). The key geographical feature of the area isa deep and narrow fjord that surrounds the largeisland of Osterøy. The fjord opens up into an archi-pelago in the outer fjord system, and this geographyoffers various potential migration routes for post-smolts. The main water discharge follows the deep-est channel down Byfjorden and up Hjeltefjorden.However, surface water also flows through Rad -fjorden and Herdlefjorden depending on freshwaterdischarge, wind and tidal cycles. The surface water(0−5 m) inside the Osterfjord (indicated in the map bythe presence of a pontoon bridge; Fig. 1) is primarilyfresh or brackish (<10 ppt) during the post-smoltmigration and only seldom registers salinity values>20 ppt (Skilbrei 2012). Unpublished data fromacoustic tagged smolt (B.T. Barlaup unpubl.) suggestthat the majority of individuals follow the main flowof the system and migrate to the south of Osterøy(southern route, Fig. 1). No data exist to show whatchannels are preferred in the outer region of thefjord. There are close to 40 approved fish farm loca-tions in the region which can be defined as themigration route of the salmon smolt from the innerfjord. The production in these farms is dependent onlocal fallowing regimes. All farms in the inner fjordproduce rainbow trout Oncorhynchus mykiss, whilemost farms in the outer region produce Atlanticsalmon Salmo salar.
Cultivated smolt production and mark−recapturemethods
During the study period, the production of culti-vated smolts occurred in the Evanger net-pen facil-ity, Voss hatchery and Dale hatchery (Table 1). Boththe Evanger and Voss hatchery smolts are hatchedfrom eggs from the living gene bank of the Vossopopulation in Eidfjord. Voss hatchery smolts werereared until the smolt stage (1 yr old) in standardhatchery tanks, while Evanger smolts were rearedin a net-pen facility in Lake Evanger, within theVosso watershed. For the Dale River system, wildbrood fish were collected in the Dale River, and 1 yrold smolts were produced in the hatchery by theriver. In the following text, the 3 groups will betreated as separate groups in the analysis and are
512
Vollset et al.: Overlap of salmon migration with lice infestation 513
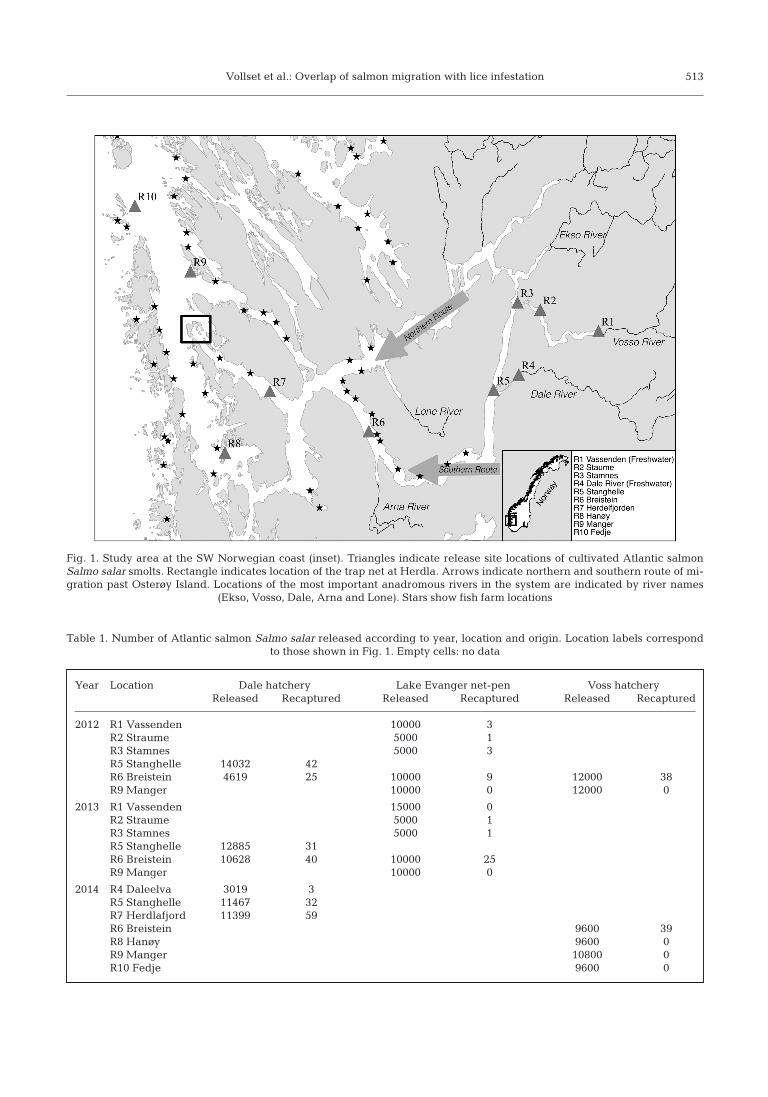
Fig. 1. Study area at the SW Norwegian coast (inset). Triangles indicate release site locations of cultivated Atlantic salmonSalmo salar smolts. Rectangle indicates location of the trap net at Herdla. Arrows indicate northern and southern route of mi-gration past Osterøy Island. Locations of the most important anadromous rivers in the system are indicated by river names
(Ekso, Vosso, Dale, Arna and Lone). Stars show fish farm locations
Year Location Dale hatchery Lake Evanger net-pen Voss hatcheryReleased Recaptured Released Recaptured Released Recaptured
2012 R1 Vassenden 10000 3R2 Straume 5000 1R3 Stamnes 5000 3R5 Stanghelle 14032 42R6 Breistein 4619 25 10000 9 12000 38R9 Manger 10000 0 12000 0
2013 R1 Vassenden 15000 0R2 Straume 5000 1R3 Stamnes 5000 1R5 Stanghelle 12885 31R6 Breistein 10628 40 10000 25R9 Manger 10000 0
2014 R4 Daleelva 3019 3R5 Stanghelle 11467 32R7 Herdlafjord 11399 59R6 Breistein 9600 39R8 Hanøy 9600 0R9 Manger 10800 0R10 Fedje 9600 0
Table 1. Number of Atlantic salmon Salmo salar released according to year, location and origin. Location labels correspond to those shown in Fig. 1. Empty cells: no data

Aquacult Environ Interact 8: 511–525, 2016
named Evanger, Voss hatchery and Dale hatchery.These groups will be termed ‘origin’. At least 10 dprior to being released, all fish were sedated withMS222 and tagged with CWTs.
The tagging activity was conducted as part of aseparate experiment assessing the effects of pro-phylactic treatment against salmon lice on post-smolt survival (see Vollset et al. 2014). The treat-ment occurred from 10 to 14 d prior to release. Thesmolts from the Vosso River were sorted and sepa-rated into groups that either received normal fishfeed or pellets with emamectin benzoate. The treat-ment groups received a dosage of emamectin ben-zoate of 50 µg kg−1 body mass d−1 for 8 d. The DaleRiver smolts released in 2012 and the first groupreleased in 2013 received an intra-peritoneal injec-tion of emamectin benzoate (Glover et al. 2010). Thecontrols were given a placebo injection. All othersmolts released in 2013 and 2014 were treated bybathing the smolts in a solution of Substans EX (itsuse was demonstrated by Skilbrei et al. 2015).Although we did not expect the treatments to haveany effect on the progression rate of the post-smoltsduring the early near-shore migration, we didinclude treatment in the model as a co-variable tocorrect for potential effects. In the initial analysis,the effect of treatment was non-significant and hadlittle impact on the progression rate, and we havechosen to exclude it from the analysis and resultssections for clarity.
Fish were released at various locations (Table 1).They were either released in the river or trans-ported in specially constructed tanks (Voss hatcheryand Evanger) or towing net pens (Dale hatchery) tovarious locations in the estuary and fjord (Fig. 1).To re-capture post-smolts at Herdla, we used 3modified trap nets as outlined by Barlaup et al.(2013). All 3 traps were deployed from 4 May to2 July 2012, 6 May to 5 July 2013 and 5 May to8 July 2014 at various locations close to Herdla(Fig. 1). This location is approximately 65 and90 km from the Dale River and the Vosso River, re -spectively, and is at the end of Herdlefjorden whichis 1 out of 3 possible channels through which thepost-smolts can migrate in the outer fjord. The dis-tance from the various release locations and thetrap net location varied from 12 to 97 km. Recap-tured post-smolts with CWTs were then analysed inthe laboratory to determine tagging location. Allpost-smolts caught in the trap net were visuallyinspected for salmon lice, and lice were identifiedto life history stage in the laboratory using a stereo-microscope (Hamre et al. 2013).
Wild post-smolt migration
In addition to assessing the recaptures of cultivatedand CWT post-smolts, the trap nets at Herdla caughtwild salmon post-smolts (i.e. post-smolts caught atHerdla and with the adipose fin intact) most likelyoriginating from rivers within Osterfjorden.
Data analysis
Progression rate and explanatory variables
Progression rate (km d−1) was calculated as the dis-tance from release site to re-capture site, measuredthrough the thalweg of the fjord, divided by the time(days) between the release and re-capture time. Weused the southern migration route to calculate thedistance for all release groups. The trap nets werechecked once a day, and migration time is thereforeonly estimated in units of whole days. Multiple fac-tors are thought to influence the progression rate ofsmolts. We included several variables in the analysis:length (total length at capture), condition (Fulton’scondition factor, K), origin (Evanger, Voss hatcheryand Dale hatchery), and river discharge (Table 2). Tocalculate discharge, we used a stream flow gauge inthe Vosso River. While other rivers contribute to theoverall hydraulics of the system, the Vosso River isthe dominant driver of discharge in the inner fjordsystem. The stream flow gauge is located above thepower station at Evanger in the Vosso River system.Thus, variation in flow mostly reflects variation inwater from the catchment area and is, thus, stronglycorrelated with rainfall and snow melting in the
514
Variable Range/factors Random/Fixed
Year 2012−2014 RandomRelease location Recaptures from 5 Random
release locations (Vosso [R1−3], Dale [R4], Stanghelle [R5], Breistein [R6], Herdlafjorden [R7])
Length (cm) 11−22.3 FixedCondition factor K 0.65−1.27 FixedDischarge (m3 s−1) 31−303 FixedOrigin Voss hatchery, Fixed
Lake Evanger net-pen, Dale hatchery
Table 2. Summary of variables selected to determine migra-tion speed of Atlantic salmon Salmo salar smolts. Release
locations are shown in Fig. 1
Vollset et al.: Overlap of salmon migration with lice infestation
region. We used a 5 d average of discharge from dayof release to present discharge based on literatureestimates of the time that fish spend in the fjord system (Thorstad et al. 2012b).
Modelling progression rates of cultivated post-smolts
Our main goal was to explore how the 4 differentselected variables explained the progression rate.Progression rate was log-transformed to fit a normaldistribution. The data were first assessed for non-lin-earity by using a simple generalized additive model(GAM) model (Wood 2011). In this model, all vari-ables were defined as fixed effects. The relationshipbetween progression rate and length and betweenprogression rate and condition seemed to be curvi -linear (the plot of the GAM is presented in Fig. S1 inthe Supplement at www.int-res.com/articles/suppl/q008 p511_ supp. pdf). Accordingly, we included a qua d -ratic term to explain these patterns. Second, a gener-alized linear mixed model was used. In this model,year and release location were defined as randomeffects; length, condition, discharge and origin, in -cluding the quadratic terms mentioned above, weredefined as fixed effects (Table 2). No interactionterms were included.
To select the variables that best explained the pro-gression rate, we used Akaike’s information criterioncorrected for small sample size (AICc; Burnham &Anderson 2002). All variable combinations wereexplored. The ΔAICc (the difference in AICc valuesfrom the model with the smallest AIC value) andAICc weights (the amount of support for a candidatemodel) were calculated for each model (48 in total).We only considered models that had a ΔAICc < 4 asan adequate model to explain the migratory speed ofpost-smolts (Burnham & Anderson 2002). All statisti-cal analysis was performed with the statistical pro-gram R (v. 3.0.2).
Predicting wild post-smolt migration
To visualize the migration of fish in dif-ferent rivers in the fjord system, a datasimulation approach was used. Based onthe model parameters from the top model(see Table 5), we simulated the time ofcapture at the trap net location from eachof the rivers in the region based on thetiming of wild smolt river descent fromthe Vosso, Dale, Lone, Arna and Ekso
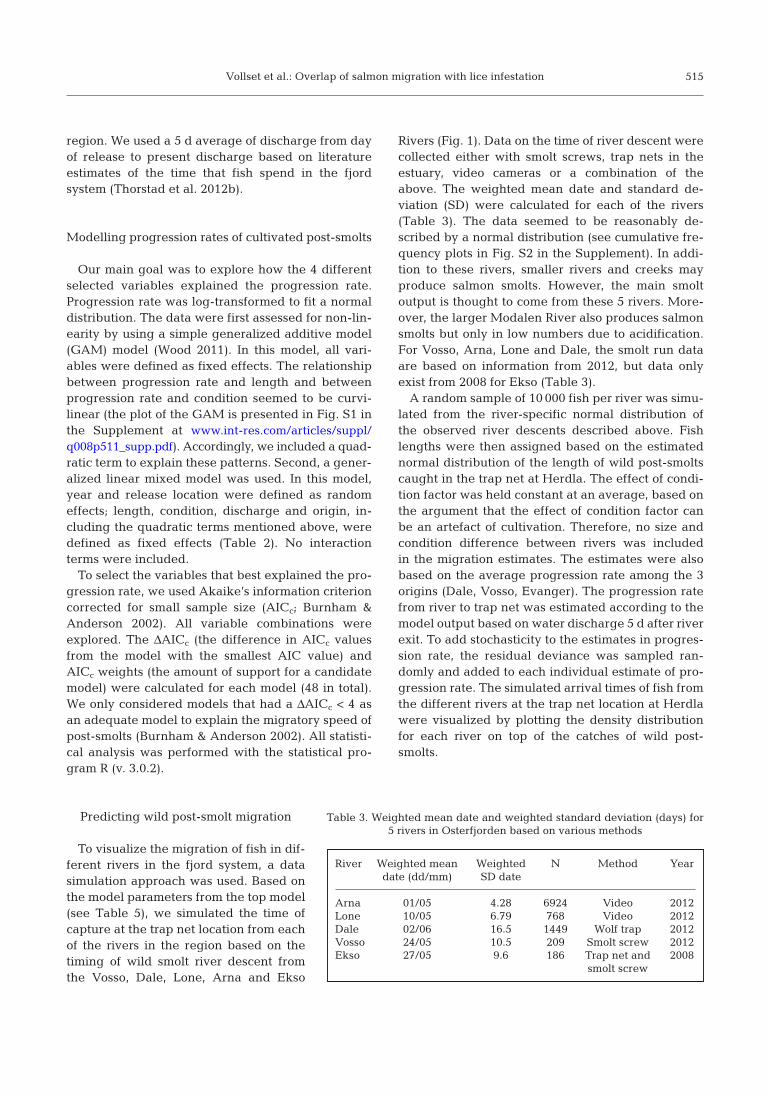
Rivers (Fig. 1). Data on the time of river descent werecollected either with smolt screws, trap nets in theestuary, video cameras or a combination of theabove. The weighted mean date and standard de -viation (SD) were calculated for each of the rivers(Table 3). The data seemed to be reasonably de -scribed by a normal distribution (see cumulative fre-quency plots in Fig. S2 in the Supplement). In addi-tion to these rivers, smaller rivers and creeks mayproduce salmon smolts. However, the main smoltoutput is thought to come from these 5 rivers. More-over, the larger Modalen River also produces salmonsmolts but only in low numbers due to acidification.For Vosso, Arna, Lone and Dale, the smolt run dataare based on information from 2012, but data onlyexist from 2008 for Ekso (Table 3).
A random sample of 10 000 fish per river was simu-lated from the river-specific normal distribution ofthe observed river descents described above. Fishlengths were then assigned based on the estimatednormal distribution of the length of wild post-smoltscaught in the trap net at Herdla. The effect of condi-tion factor was held constant at an average, based onthe argument that the effect of condition factor canbe an artefact of cultivation. Therefore, no size andcondition difference between rivers was includedin the migration estimates. The estimates were alsobased on the average progression rate among the 3origins (Dale, Vosso, Evanger). The progression ratefrom river to trap net was estimated according to themodel output based on water discharge 5 d after riverexit. To add stochasticity to the estimates in progres-sion rate, the residual deviance was sampled ran-domly and added to each individual estimate of pro-gression rate. The simulated arrival times of fish fromthe different rivers at the trap net location at Herdlawere visualized by plotting the density distributionfor each river on top of the catches of wild post-smolts.
515
River Weighted mean Weighted N Method Yeardate (dd/mm) SD date
Arna 01/05 4.28 6924 Video 2012Lone 10/05 6.79 768 Video 2012Dale 02/06 16.5 1449 Wolf trap 2012Vosso 24/05 10.5 209 Smolt screw 2012Ekso 27/05 9.6 186 Trap net and 2008
smolt screw
Table 3. Weighted mean date and weighted standard deviation (days) for 5 rivers in Osterfjorden based on various methods
Aquacult Environ Interact 8: 511–525, 2016
Annual variation in smolt runs
Data did not exist for smolt migrations across yearsfor all rivers in the region. To illustrate the extent ofvariation in the timing of the smolt run among years,we present data from smolt runs from the wolf trap inDale, where we have data from 2004 to 2014.
Modelled infestation pressure from fish farms
To illustrate how lice infestation pressure changeswith season during the migration in the outer region,we modelled the infestation pressure from surround-ing fish farms at the trap net location at Herdla usingthe method described by Aldrin et al. (2013). Themethod does not necessarily correctly depict theinfestation pressure on migrating salmon smolt.However, we do not have data on where the salmonmigrate. Consequently, the point estimate of infesta-tion pressure is used as an illustration of the temporaltrend in the infestation pressure for the differentyears. The infestation pressure from each year wasplotted on top of the modelled arrival time at the trapnet location of smolt from Vosso and the wild fishcaught each year at the trap net.
RESULTS
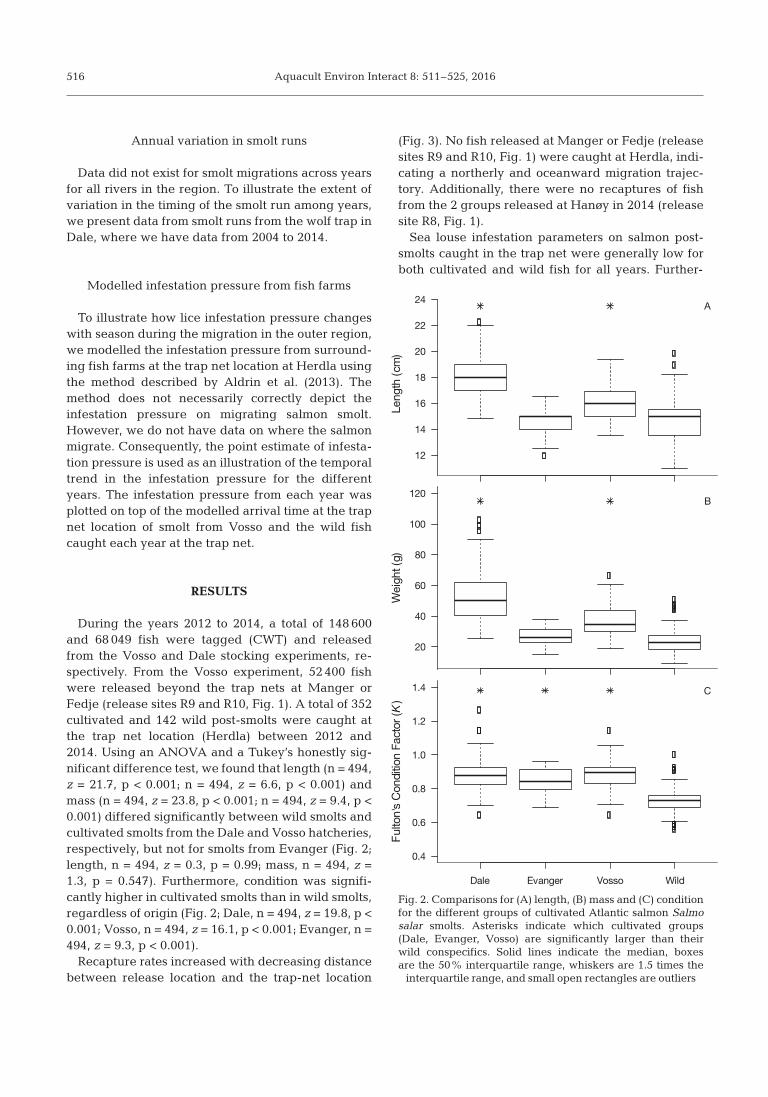
During the years 2012 to 2014, a total of 148 600and 68 049 fish were tagged (CWT) and releasedfrom the Vosso and Dale stocking experiments, re -spectively. From the Vosso experiment, 52 400 fishwere released beyond the trap nets at Manger orFedje (release sites R9 and R10, Fig. 1). A total of 352cultivated and 142 wild post-smolts were caught atthe trap net location (Herdla) between 2012 and2014. Using an ANOVA and a Tukey’s honestly sig-nificant difference test, we found that length (n = 494,z = 21.7, p < 0.001; n = 494, z = 6.6, p < 0.001) andmass (n = 494, z = 23.8, p < 0.001; n = 494, z = 9.4, p <0.001) differed significantly between wild smolts andcultivated smolts from the Dale and Vosso hatcheries,respectively, but not for smolts from Evanger (Fig. 2;length, n = 494, z = 0.3, p = 0.99; mass, n = 494, z =1.3, p = 0.547). Furthermore, condition was signifi-cantly higher in cultivated smolts than in wild smolts,re gardless of origin (Fig. 2; Dale, n = 494, z = 19.8, p <0.001; Vosso, n = 494, z = 16.1, p < 0.001; Evanger, n =494, z = 9.3, p < 0.001).
Recapture rates increased with decreasing distancebetween release location and the trap-net location
(Fig. 3). No fish released at Manger or Fedje (releasesites R9 and R10, Fig. 1) were caught at Herdla, indi-cating a northerly and oceanward migration trajec-tory. Additionally, there were no recaptures of fishfrom the 2 groups released at Hanøy in 2014 (releasesite R8, Fig. 1).
Sea louse infestation parameters on salmon post-smolts caught in the trap net were generally low forboth cultivated and wild fish for all years. Further-
516
Leng
th(c
m)
12
14
16
18
20
22
24A
Wei
ght(
g)
20
40
60
80
100
120B
Ful
ton'
sC
ondi
tion
Fact
or(K
)
Dale Evanger Vosso Wild
0.4
0.6
0.8
1.0
1.2
1.4 C
Fig. 2. Comparisons for (A) length, (B) mass and (C) conditionfor the different groups of cultivated Atlantic salmon Salmosalar smolts. Asterisks indicate which cultivated groups(Dale, Evanger, Vosso) are significantly larger than theirwild conspecifics. Solid lines indicate the median, boxesare the 50% interquartile range, whiskers are 1.5 times the
interquartile range, and small open rectangles are outliers

Vollset et al.: Overlap of salmon migration with lice infestation
more, adult stages of lice were observed on post-smolts that had been released 1 to 14 d prior to recap-ture. Because this stage of salmon lice would nothave sufficient time to develop (~40 d) before recap-ture and due to the simultaneous capture of sea troutSalmo trutta in the trap net, sea lice most likelyjumped from sea trout hosts when both species wereconfined inside the trap net chamber prior to process-ing. Moreover, the low levels and strongly 0-inflateddata precluded any significance test of differences in
abundance of lice between years, sizes or groups(wild/cultivated). However, there seemed to be morelice on the post-smolts in 2012 than in the other2 years, viz. 2013 and 2014 (Table 4). Additionally,wild, treated and untreated post-smolts had similaramounts of lice within years.
Migratory speed
The overall progression rate estimated from re -captured cultivated post-smolts varied from 0.8 to31.2 km d−1, with mean and median values of 8.8 and7.8 km d−1, respectively. This rate corresponds to 0.05to 2.20 body lengths (BL) s−1, with mean and medianvalues of 0.60 and 0.54 BL s−1, respectively.
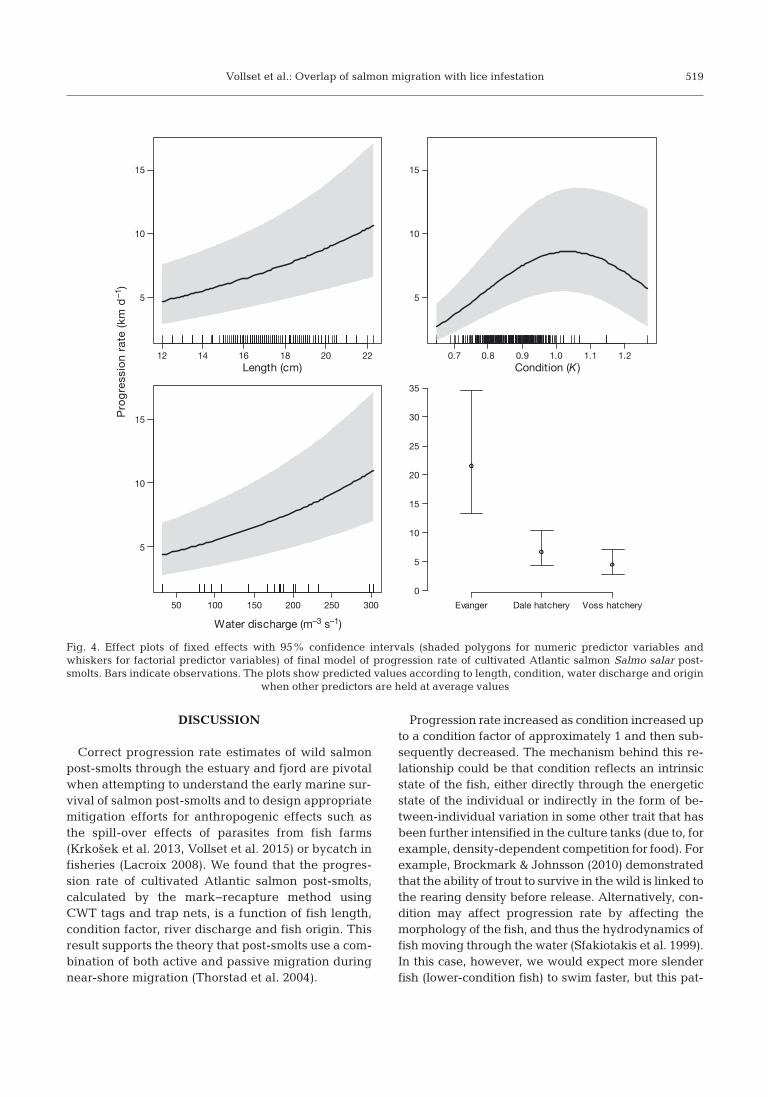
The best model selected, with 94% AICc weight,included all variables except the quadratic term oflength (Tables 5 & 6). The model met the assumptionsof normality, homogeneity and independence. Withthe other variables held constant at averaged values,progression rate increased from 4.7 km d−1 for a 12 cmpost-smolt to 10.6 km d−1 for a 22 cm post-smolt(Fig. 4). Progression rate increased from 2.7 km d−1
for a post-smolt with a condition factor of 0.7, toapproximately 9 km d−1 at a condition factor of 1 andthen subsequently decreased (Fig. 4). Progressionrate increased linearly from 4.3 km d−1 during dayswith a 5 d average discharge of 50 m3 s−1 to 10.9 kmd−1 during days with a discharge of 300 m3 s−1 (Fig. 4).The average estimated progression of fish from thenet pen in Evanger was clearly much higher (21.4 kmd−1) than in the fish from the hatcheries at Dale(6.6 km d−1) and Voss (4.4 km d−1; Fig. 4).
517
R1R2R3
R4
R5R6
R7
0
0.1
0.2
0.3
0.4
0.5
0.6
y = –0.006x + 0.5429
R² = 0.8815
1200 20 40 60 80 100
Rec
aptu
red
(%)
Seaward distance from release site to capture site (km)
Fig. 3. Percent recapture of Atlantic salmon Salmo salarsmolts vs. distance between release site and capture site atHerdla. Location codes (R1–R7) correspond to the trianglesindicated in Fig. 1. The trend line (with R2 and function)is drawn for illustrative purposes. Release groups fromHanøy, Manger and Fedje (beyond the trap net) had 0 re -captures and were not included. d: releases in marine
waters, j: releases in rivers or estuaries
Type Year N Attached stages All stagesAbundance Intensity Prevalence (%) Abundance Intensity Prevalence (%)
Not 2012 48 0.17 1.14 15 0.54 1.53 35treated 2013 49 0.02 1.00 2 0.02 1.00 2
2014 69 0.00 0.00 0 0.01 0.00 1
Treated 2012 75 0.19 1.08 17 0.52 1.50 352013 49 0.00 0.00 0 0.00 0.00 02014 57 0.00 0.00 0 0.07 0.00 7
Wild 2012 30 0.27 2.67 10 0.63 2.71 232013 71 0.03 2.00 1 0.03 2.00 12014 47 0.13 2.00 6 0.34 0.00 17
Table 4. Salmon lice Lepeophtheirus salmonis counted on Atlantic salmon Salmo salar smolts caught in a trap net at Herdlafor the years 2012 to 2014. Abundance (average number of lice on all samples), intensity (average number of lice on fish withlice) and prevalence (percentage of the sample with lice) are calculated both for attached stages (copepodites, chalimus I andchalimus II) and for all stages because mobile stages may have jumped from other fish in the trap net chamber. The sample isdivided into cultivated and tagged fish not treated with anti-parasitic agent (Not treated), treated with an anti-parasitic agent
(Treated) and untagged wild fish (Wild)
Aquacult Environ Interact 8: 511–525, 2016
Comparisons of estimated time of migration andcapture of wild post-smolts
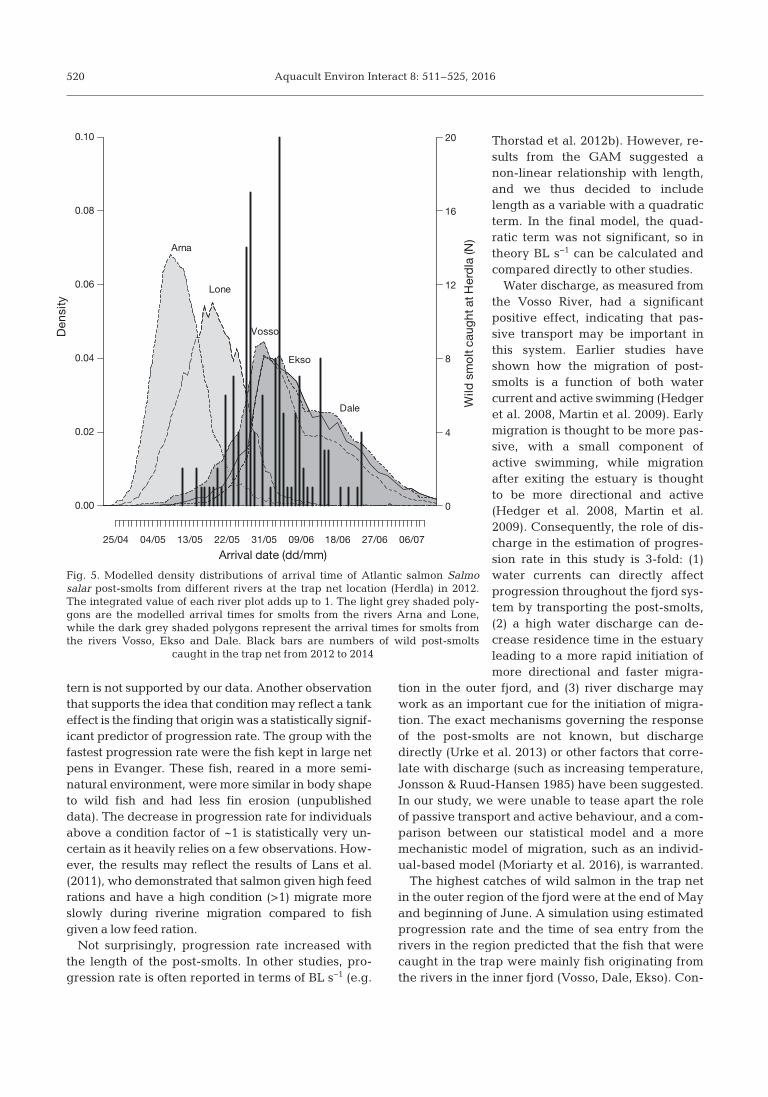
Wild Atlantic salmon post-smolts were caughtbetween 14 May and 27 June at Herdla, with me -dian dates of 30 May in 2012, 28 May in 2013 and8 June in 2014. We modelled the density distributionof arrival time at the trap net location from the vari-ous rivers in 2012 and overlaid a histogram of wildfish caught at Herdla for all 3 years (Fig. 5). Plotsusing discharge data from 2013 and 2014 gave simi-lar results and are presented in Figs. S3 & S4 in theSupplement. In all 3 years, the post-smolts originat-ing from the rivers in the inner fjord (Vosso, Ekso,Dale) were estimated to migrate faster than thepost-smolts from the rivers in the outer fjord (Arna,
Lone) because they entered the fjord during timesof higher discharge. The estimated time betweenriver descent and arrival time at Herdla was 3.0 dfor the shortest distance (Lone River, 38 km, range:2.1−3.3 d) and 6.5 d for the longest distance (VossoRiver, 93 km, range: 5.1−8.2 d). Simulated arrivaltimes suggest that smolts from the different riversarrive at the outer fjord system with a difference ofup to 4 wk (Fig. 5).
Annual variation in smolt run
The median dates of the smolt run from the wolftrap in Dale are presented in Fig. S7 in the Supple-ment. The median date of the smolt run varied 25 d
among years. To exemplify how differ-ences in marine entry time would affectour model results, we plotted the modelusing the mean date ±10 d. The plots aregiven in Figs. S5 & S6 in the Supplementand demonstrate that the modelledarrival time in the outer fjord is highlysensitive to the date when the fish leavethe river.
Modelled arrival time and infestationpressure from surrounding fish farms
Infestation pressure from fish farmsincreased at the beginning of June in2012 and 2014, but not in 2013. Conse-quently, the tail end of the migratingsmolts originating from the inner fjords(illustrated by the Vosso River) wouldexperience the highest infestation pres-sure in these years (Fig. 6).
518
Variable Estimate SD t p
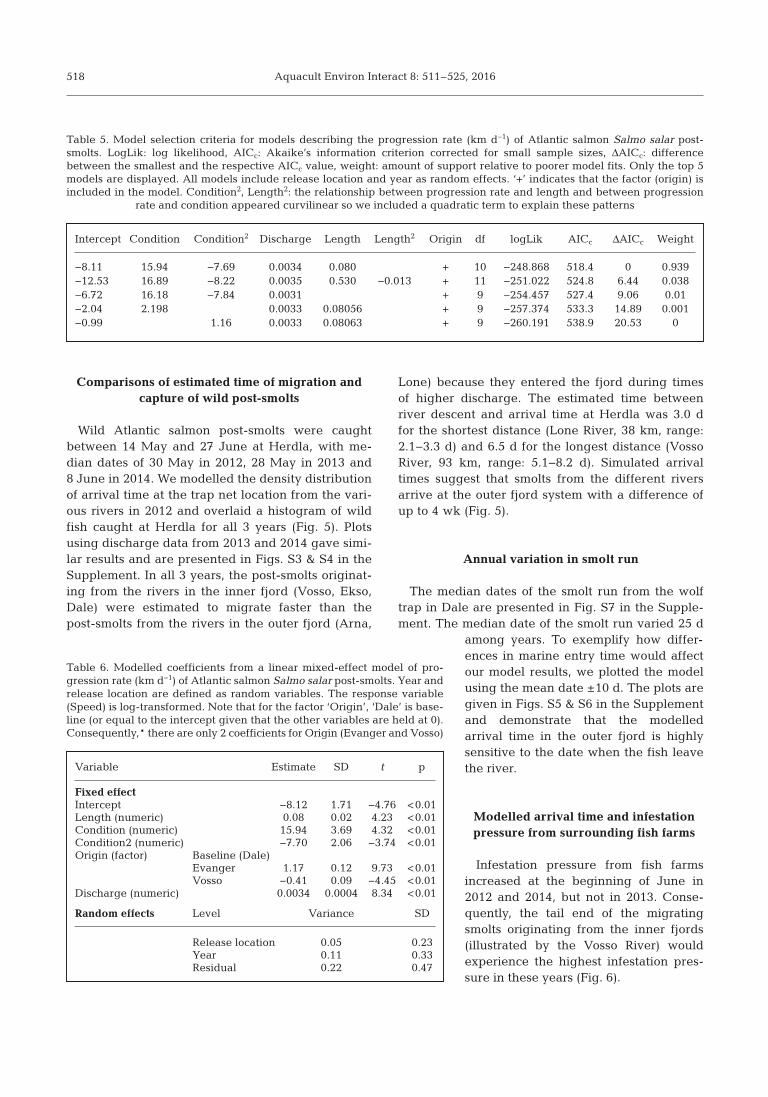
Fixed effectIntercept −8.12 1.71 −4.76 <0.01Length (numeric) 0.08 0.02 4.23 <0.01Condition (numeric) 15.94 3.69 4.32 <0.01Condition2 (numeric) −7.70 2.06 −3.74 <0.01Origin (factor) Baseline (Dale)
Evanger 1.17 0.12 9.73 <0.01Vosso −0.41 0.09 −4.45 <0.01
Discharge (numeric) 0.0034 0.0004 8.34 <0.01
Random effects Level Variance SD
Release location 0.05 0.23Year 0.11 0.33Residual 0.22 0.47
Table 6. Modelled coefficients from a linear mixed-effect model of pro-gression rate (km d−1) of Atlantic salmon Salmo salar post-smolts. Year andrelease location are defined as random variables. The response variable(Speed) is log-transformed. Note that for the factor ‘Origin’, ‘Dale’ is base-line (or equal to the intercept given that the other variables are held at 0).Consequently,* there are only 2 coefficients for Origin (Evanger and Vosso)
Intercept Condition Condition2 Discharge Length Length2 Origin df logLik AICc ΔAICc Weight
−8.11 15.94 −7.69 0.0034 0.080 + 10 −248.868 518.4 0 0.939−12.53 16.89 −8.22 0.0035 0.530 −0.013 + 11 −251.022 524.8 6.44 0.038−6.72 16.18 −7.84 0.0031 + 9 −254.457 527.4 9.06 0.01−2.04 2.198 0.0033 0.08056 + 9 −257.374 533.3 14.89 0.001−0.99 1.16 0.0033 0.08063 + 9 −260.191 538.9 20.53 0
Table 5. Model selection criteria for models describing the progression rate (km d−1) of Atlantic salmon Salmo salar post-smolts. LogLik: log likelihood, AICc: Akaike’s information criterion corrected for small sample sizes, ΔAICc: differencebetween the smallest and the respective AICc value, weight: amount of support relative to poorer model fits. Only the top 5models are displayed. All models include release location and year as random effects. ‘+’ indicates that the factor (origin) isincluded in the model. Condition2, Length2: the relationship between progression rate and length and between progression
rate and condition appeared curvilinear so we included a quadratic term to explain these patterns
Vollset et al.: Overlap of salmon migration with lice infestation
DISCUSSION
Correct progression rate estimates of wild salmonpost-smolts through the estuary and fjord are pivotalwhen attempting to understand the early marine sur-vival of salmon post-smolts and to design appropriatemitigation efforts for anthropogenic effects such asthe spill-over effects of parasites from fish farms(Krkošek et al. 2013, Vollset et al. 2015) or bycatch infisheries (Lacroix 2008). We found that the progres-sion rate of cultivated Atlantic salmon post-smolts,calculated by the mark−recapture method usingCWT tags and trap nets, is a function of fish length,condition factor, river discharge and fish origin. Thisresult supports the theory that post-smolts use a com-bination of both active and passive migration duringnear-shore migration (Thorstad et al. 2004).
Progression rate increased as condition increased upto a condition factor of approximately 1 and then sub-sequently decreased. The mechanism behind this re-lationship could be that condition reflects an intrinsicstate of the fish, either directly through the energeticstate of the individual or indirectly in the form of be-tween-individual variation in some other trait that hasbeen further intensified in the culture tanks (due to, forexample, density-dependent competition for food). Forexample, Brockmark & Johnsson (2010) dem onstratedthat the ability of trout to survive in the wild is linked tothe rearing density before release. Alternatively, con-dition may affect progression rate by affecting themorphology of the fish, and thus the hydro dynamics offish moving through the water (Sfa kio takis et al. 1999).In this case, however, we would expect more slenderfish (lower-condition fish) to swim faster, but this pat-
519
12 14 16 18 20 22Length (cm)
Pro
gre
ssio
n ra
te (
km d
–1)
0.7 0.8 0.9 1.0 1.1 1.2Condition (K )
50 100 150 200 250 300
Water discharge (m–3 s–1)
Evanger Dale hatchery Voss hatchery
15
10
5
15
10
5
35
30
25
20
15
10
5
0
15
10
5
Fig. 4. Effect plots of fixed effects with 95% confidence intervals (shaded polygons for numeric predictor variables andwhiskers for factorial predictor variables) of final model of progression rate of cultivated Atlantic salmon Salmo salar post-smolts. Bars indicate observations. The plots show predicted values according to length, condition, water discharge and origin
when other predictors are held at average values
tern is not supported by our data. Another observationthat supports the idea that condition may reflect a tankeffect is the finding that origin was a statistically signif-icant predictor of progression rate. The group with thefastest progression rate were the fish kept in large netpens in Evanger. These fish, reared in a more semi-natural environment, were more similar in body shapeto wild fish and had less fin erosion (unpublisheddata). The decrease in progression rate for individualsabove a condition factor of ~1 is statistically very un-certain as it heavily relies on a few observations. How-ever, the results may reflect the results of Lans et al.(2011), who demonstrated that salmon given high feedrations and have a high condition (>1) migrate moreslowly during riverine migration compared to fishgiven a low feed ration.
Not surprisingly, progression rate increased withthe length of the post-smolts. In other studies, pro-gression rate is often reported in terms of BL s−1 (e.g.
Thorstad et al. 2012b). However, re -sults from the GAM suggested anon-linear relationship with length,and we thus decided to includelength as a variable with a quadraticterm. In the final model, the quad-ratic term was not significant, so intheory BL s−1 can be calculated andcompared directly to other studies.
Water discharge, as measured fromthe Vosso River, had a significantpositive effect, indicating that pas-sive transport may be important inthis system. Earlier studies haveshown how the migration of post-smolts is a function of both watercurrent and active swimming (Hedgeret al. 2008, Martin et al. 2009). Earlymigration is thought to be more pas-sive, with a small component ofactive swimming, while migrationafter exiting the estuary is thoughtto be more directional and active(Hedger et al. 2008, Martin et al.2009). Consequently, the role of dis-charge in the estimation of progres-sion rate in this study is 3-fold: (1)water currents can directly affectprogression throughout the fjord sys -tem by transporting the post-smolts,(2) a high water discharge can de -crease residence time in the estuaryleading to a more rapid initiation ofmore directional and faster migra-
tion in the outer fjord, and (3) river discharge maywork as an important cue for the initiation of migra-tion. The exact mechanisms governing the responseof the post-smolts are not known, but dischargedirectly (Urke et al. 2013) or other factors that corre-late with discharge (such as increasing temperature,Jonsson & Ruud-Hansen 1985) have been suggested.In our study, we were unable to tease apart the roleof passive transport and active behaviour, and a com-parison be tween our statistical model and a moremechanistic model of migration, such as an individ-ual-based model (Moriarty et al. 2016), is warranted.
The highest catches of wild salmon in the trap netin the outer region of the fjord were at the end of Mayand beginning of June. A simulation using estimatedprogression rate and the time of sea entry from therivers in the region predicted that the fish that werecaught in the trap were mainly fish originating fromthe rivers in the inner fjord (Vosso, Dale, Ekso). Con-
Aquacult Environ Interact 8: 511–525, 2016520
Den
sity
25/04 04/05 13/05 22/05 31/05 09/06 18/06 27/06 06/07
Arna
Lone
Vosso
Ekso
Dale Wild
sm
olt
caug
ht a
t Her
dla
(N)
0.10
0.08
0.06
0.04
0.02
0.00
20
16
12
8
4
0
Arrival date (dd/mm)
Fig. 5. Modelled density distributions of arrival time of Atlantic salmon Salmosalar post-smolts from different rivers at the trap net location (Herdla) in 2012.The integrated value of each river plot adds up to 1. The light grey shaded poly-gons are the modelled arrival times for smolts from the rivers Arna and Lone,while the dark grey shaded polygons represent the arrival times for smolts fromthe rivers Vosso, Ekso and Dale. Black bars are numbers of wild post-smolts
caught in the trap net from 2012 to 2014

Vollset et al.: Overlap of salmon migration with lice infestation
versely, we did not observe large catches of post-smolts at Herdla in the periods during which we pre-dicted the post-smolts from the Lone and Arna toarrive. This result can partially be explained by thatthe smolt output from these rivers was smaller andthat the deployment of the trap net began in earlyMay and may have missed some of the fish fromthese rivers. If our estimates are correct, the salmonpost-smolts from the rivers with the shortest migra-
tion distance and the earliest migration (Lone andArna) will arrive 3 to 4 wk earlier in the outer re -gion than the salmon post-smolts from rivers in theinner region and will most likely experience a verydifferent near-shore environment as the season progresses. Because of the vast difference betweenmigration timing between the populations originat-ing in the inner fjord and the outer fjord, post-smoltscan be differentially affected by the coordinated
521
Date
Den
sity
25/04 30/04 05/05 10/05 15/05 20/05 25/05 30/05 04/06 09/06 14/06 19/06 24/06 29/06 04/07 09/07
Wild
sm
olt
caug
ht a
t H
erdl
a (N
)W
ild s
mol
t ca
ught
at
Her
dla
(N)
25/04 30/04 05/05 10/05 15/05 20/05 25/05 30/05 04/06 09/06 14/06 19/06 24/06 29/06 04/07 09/07
Infe
stat
ion
pre
ssur
e (1
06 lic
e)
25/04 30/04 05/05 10/05 15/05 20/05 25/05 30/05 04/06 09/06 14/06 19/06 24/06 29/06 04/07 09/07
Wild
sm
olt
caug
ht a
t H
erdl
a (N
)
20
16
12
8
4
0
20
16
12
8
4
0
20
16
12
8
4
0
10
8
6
4
2
0
10
8
6
4
2
0
10
8
6
4
2
0
0.05
0.04
0.03
0.02
0.01
0.00
Den
sity
0.05
0.04
0.03
0.02
0.01
0.00
Den
sity
0.05
0.04
0.03
0.02
0.01
0.00
A
B
C
Fig. 6. Modelled density distribution of arrival time of Atlantic salmon Salmo salar post-smolts from the Vosso River at the trapnet location (Herdla) in (A) 2012, (B) 2013 and (C) 2014. Black bars are the number of wild smolts caught in the respectiveyears. Dashed line is the estimated sea louse Lepeophtheirus salmonis infection pressure based on the distance to fish farms asexplained by Aldrin et al. (2013). The infestation pressure is calculated for a single point at the location of the trap net. The
infestation pressure scale is shown on the right

Aquacult Environ Interact 8: 511–525, 2016
spring delousing in the region. Federal regulations inNorway state that all salmon farmers must conductearly spring delousing between 5 March and 10 Aprilon the west coast of Norway to avoid harmful levelsof salmon lice during the smolt run of wild Atlan -tic salmon (http:// lovdata.no/ dokument/ SF/ forskrift/2012-12-05-1140) (Heuch et al. 2005, Serra-Llinareset al. 2014). Within each region, the fish farmers candecide at what time during this period and what typeof treatment should be applied during this delousing.Clearly, detailed information about when post-smoltsfrom different rivers arrive in different regions of thefjord is very relevant to optimize this activity.
The sea lice infestation pressure increased in 2012and 2014 at the start of June. This overlapped withthe tail end of the migration of salmon from the riversfrom the inner region (illustrated by the Vosso River).These 2 years correspond to when the largest fallow-ing zones in the outer region are in their second yearof production. A pattern of high infestation pressurein areas with high biomass in surrounding fish farmshas been recorded in various studies (Penston &Davies 2009, Jansen et al. 2012, Serra-Llinares et al.2014, 2016) and has also been observed along thewest coast of Norway during June according to thenational sea lice surveillance programme (Tarangeret al. 2015). Based on the current results, lice infesta-tion pressure must be kept low from the end of Aprilto the end of June to encompass all populations in theregion when attempting to minimize the risk of spill-over effects from fish farms to migrating wild salmonsmolts.
The estimated time spent migrating from the riverto reach the outer fjord system (Herdla) ranged from2.1 to 3.3 d for smolts from the Lone River and 5.1 to8.2 d for the Vosso River. In comparison, the annualvariation in the smolt run from the Dale River variedby 25 d. It seems that the time of exit from the riversand the migration distance are the most importantpredictors of the time that the fish arrive in the outerfjord in our model. Consequently, among-year andamong-river variation in the smolt run is, togetherwith the modelled infestation pressure, the key infor-mation for assessing the effect of management actionsin fish farms, such as spring delousing, on popula-tions of wild salmon. Hvidsten et al. (1998) found thatthe seawater entrance of smolts was negatively cor-related with latitude in 5 rivers and suggested thatpopulation-specific behaviour will result in smoltsthat, on average, enter the sea when the sea surfacetemperature exceeds 8°C. Similarly, Otero et al.(2014) looked at data from 67 rivers in the NorthAtlantic over 5 decades and found that some of the
variation in run timing could be explained by sea sur-face temperature, freshwater temperature, dischargepatterns, a spatial pattern extending across the NorthAtlantic and a temporal decadal trend. However, alarge part of the variation remained unexplained, asthe model was allowed to vary according to a randomintercept and a random slope for the various sites.This statistical method makes sense when trying totease out global patterns of climate change andchanges in phenology but also makes it difficult topredict local patterns. Given that among-river, re -gional and annual variation in the marine entrance ofsmolts is large, any local mitigation plan to alleviatethe effects of fish farming on migrating post-smoltsshould include data from that region’s largest rivers.
An important source of error in our speed estimatesis that progression rate is mainly based on cultivatedsmolts that had been released in marine waters(release groups at Stanghelle, Breistein and Herdle-fjord, R5−R7). Studies on acoustically tagged fishhave demonstrated that fish can move slowly duringthe estuarine transition and increase their speedwhen individuals reach areas of higher salinity (Mar-tin et al. 2009). Therefore, overall swim speeds couldbe overestimated with exclusion of the more passiveriverine migration and potential transitional phaseonce the fish reach areas of increased salinity. Fur-thermore, simultaneous releases of several thousandsmolts, as conducted in the present study, may stim-ulate school formation and migratory behaviour(Skilbrei et al. 1994) and may be advantageous forsurvival and increase progression rate. For example,cultivated smolts fitted with acoustic tags releasedtogether with several thousand smolts from net pensduring spring and summer migrated very rapidly outof a 22 km long fjord (~1.3 BL s−1), with no loss oftagged fish (Skilbrei 2010). However, Thorstad et al.(2012b) reviewed several studies using acoustictransmitters and showed that progression rates dur-ing the early marine migration varied between 0.4and 3.0 BL s−1, on average, across studies, demon-strating that our estimates (mean = 0.6 BL s−1) aremost likely not overestimates.
The infestation levels of salmon lice on post-smoltswere low on the fish caught in the trap net for bothwild and cultivated fish. This finding is most likelybecause the post-smolts migrated through surfacefreshwater in the inner fjord and were not exposed tolice before they entered the outer fjord system,where the salinity in the surface water increased.Salmon lice are known to avoid salinity values below20 ppm (Heuch 1995). Thus, it seems evident that thefocus of spring delousing should be on keeping lice
522
Vollset et al.: Overlap of salmon migration with lice infestation
levels low in the outer region of the fjord during thepost-smolt migration from May through June. Inter-estingly, treatment did not seem to have any effect onthe prevalence of the chalimus stages of sea lice onpost-smolts even though emamectin benzoate hasbeen documented to remove all stages of lice (Stoneet al. 2002). However, the treatment may not havebeen effective for a sufficiently long period at thisstage because the lice must start eating, die and falloff (Gjelland et al. 2014).
The trap net was located in 1 out of 3 potentialchannels where the fish can migrate to reach theopen ocean. The location of the trap is such that it isunlikely that fish that migrated other routes wouldhave been caught, and this is further corroborated bythe fact that we did not catch any fish from therelease in Hjeltefjorden (R8). However, for the esti-mation of the arrival time at the outer fjord, we usedthe location at Herdla as the arrival point. This can beproblematic when trying to assess the impacts of liceon wild salmon, as we do not know what proportionof the post-smolts migrate the other possible migra-tion channels. The shortest migration path (37 km)compared to the longest migration path (75 km) inthe outer fjord system (from the pontoon bridge to thesame location outside the archipelago) would lead toa ca. 4 to 5 d difference in exposure to salmon lice inthe outer region. This uncertainty must be taken intoconsideration when adapting a management strat-egy. However, it must also be pointed out that thisvariation is dwarfed by the potential variation in thetime of the smolt run between years that wereobserved in Dale.
The recapture rate of fish released in the river orestuary was low compared with fish released in theinner fjord closer to the recapture site. A similar pat-tern has been observed in the same region in largerdatasets (Skilbrei et al. 2013, Vollset et al. 2014). Onepotential explanation of the low recapture rates is theincreased potential for dispersal with longer migra-tions. For instance, fish released further from theouter estuary may disperse more and, consequently,select different migration paths to a greater extent(e.g. through Radfjorden or Hjeltefjorden). Anotherpossibility is that the groups with the longest migra-tion distance have a higher mortality. Acoustic stud-ies on cultivated smolts from the Vosso River (Vollsetet al. 2016) suggest a high estuarine mortality. Thesestudies also demonstrate that smolts that migrateslowly are less likely to survive through the estuaryand that cod Gadus morhua and trout Salmo truttafeed on salmon during the estuarine migration. Simi-lar patterns of high estuarine mortality have been
observed elsewhere (Lacroix 2008, Thorstad et al.2012a) and have also been linked to predation (Hvid-sten & Lund 1988, Thorstad et al. 2012a). Conse-quently, a large part of the mortality of cultivatedsalmon smolts occurs before the salmon are severelyaffected by salmon lice.
Concluding remarks
The modelled arrival time and capture of wild post-smolts suggest that post-smolts from the largest riverin the inner fjord migrate past the outer fjord sys-tems, the most likely area of salmon lice exposure,from mid-May throughout June. By coupling ecolog-ical data on behaviour of smolt with modelled infes-tation pressure from fish farms, we have demon-strated the importance of detailed local knowledgeon migration of wild salmon when designing effec-tive management to alleviate disease transfer to wildfish. This study has demonstrated that local mitiga-tion plans should at the very least include localknowledge on the migration times of wild salmonsmolt from the largest rivers in the region.
Acknowledgements. Ove T. Skilbrei tragically passed awayjust prior to the final submission of the revised manuscript.We dedicate this work to his memory. This study was par-tially funded by the Norwegian Research Council throughthe project BaseLice (project nr. 243912/E50), the Norwe-gian Seafood Research Fund (project nr. 900778) and TheEnvironmental Directorate. Cultivated fish were producedwith financial support from the power company BKK andregional fish farms (Vossolauget). Thanks to Lars Qviller forproviding estimates of lice infestation levels.
LITERATURE CITED
Aldrin M, Storvik B, Kristoffersen AB, Jansen PA (2013)Space-time modelling of the spread of salmon licebetween and within Norwegian marine salmon farms.PLOS ONE 8: e64039
Barlaup BT, Gabrielsen SE, Loeyland J, Schlaeppy ML,Wiers T, Vollset KW, Pulg U (2013) Trap design for catch-ing fish unharmed and the implications for estimatesof sea lice (Lepeophtheirus salmonis) on anadromousbrown trout (Salmo trutta). Fish Res (Amst) 139: 43−46
Brockmark S, Johnsson JI (2010) Reduced hatchery rearingdensity increases social dominance, postrelease growth,and survival in brown trout (Salmo trutta). Can J FishAquat Sci 67: 288−295
Burnham KP, Anderson DR (2002) Model selection andmulti-model inference: a practical information-theoreticapproach. Springer, New York, NY
Costello MJ (2006) Ecology of sea lice parasitic on farmedand wild fish. Trends Parasitol 22: 475−483
Dempson JB, Robertson MJ, Pennell CJ, Furey G and others
523

Aquacult Environ Interact 8: 511–525, 2016
(2011) Residency time, migration route and survival ofAtlantic salmon Salmo salar smolts in a Canadian fjord. JFish Biol 78: 1976−1992
Gibson AJF, Halfyard EA, Bradford RG, Stokesbury MJW,Redden AM (2015) Effects of predation on telemetry-based survival estimates: insights from a study on endan-gered Atlantic salmon smolts. Can J Fish Aquat Sci 72: 728−741
Gjelland KØ, Serra-Llinares RM, Hedger RD, Arechavala-Lopez P and others (2014) Effects of salmon lice infectionon the behaviour of sea trout in the marine phase.Aquacult Environ Interact 5: 221−233
Glover KA, Samuelsen OB, Skilbrei OT, Boxaspen K, Lunes-tad BT (2010) Pharmacokinetics of emamectin benzoateadministered to Atlantic salmon, Salmo salar L., by intra-peritoneal injection. J Fish Dis 33: 183−186
Hamre LA, Eichner C, Caipang CMA, Dalvin ST and others(2013) The salmon louse Lepeophtheirus salmonis(Copepoda: Caligidae) life cycle has only two chalimusstages. PLOS ONE 8: e73539
Handeland SO, Jarvi T, Ferno A, Stefansson SO (1996)Osmotic stress, antipredator behaviour, and mortality ofAtlantic salmon (Salmo salar) smolts. Can J Fish AquatSci 53: 2673−2680
Hedger RD, Martin F, Hatin D, Caron F, Whoriskey FG,Dodson JJ (2008) Active migration of wild Atlantic sal -mon Salmo salar smolt through a coastal embayment.Mar Ecol Prog Ser 355: 235−246
Heuch PA (1995) Experimental evidence for aggregation ofsalmon louse copepodids (Lepeophtheirus salmonis) instep salinity gradients. J Mar Biol Assoc UK 75: 927−939
Heuch PA, Bjørn PA, Finstad B, Holst JC, Asplin L, Nilsen F(2005) A review of the Norwegian ‘National Action PlanAgainst Salmon Lice on Salmonids’: the effect on wildsalmonids. Aquaculture 246: 79−92
Hvidsten NA, Lund RA (1988) Predation on hatchery-rearedand wild smolts of Atlantic salmon, Salmo salar L, in theEstuary of River Orkla, Norway. J Fish Biol 33: 121−126
Hvidsten NA, Heggberget TG, Jensen AJ (1998) Sea watertemperatures at Atlantic salmon smolt entrance. Nord JFreshw Res 74: 79−86
Jansen PA, Kristoffersen AB, Viljugrein H, Jimenez D,Aldrin M, Stien A (2012) Sea lice as a density-dependentconstraint to salmonid farming. Proc R Soc Lond B BiolSci 279: 2330−2338
Jonsson B, Ruud-Hansen J (1985) Water temperature as theprimary influence on timing of seaward migrations ofAtlantic salmon (Salmo salar) smolts. Can J Fish AquatSci 42: 593−595
Krkošek M, Revie CW, Gargan PG, Skilbrei OT, Finstad B,Todd CD (2013) Impact of parasites on salmon recruit-ment in the Northeast Atlantic Ocean. Proc R Soc Lond BBiol Sci 280: 20122359
Lacroix GL (2008) Influence of origin on migration and sur-vival of Atlantic salmon (Salmo salar) in the Bay ofFundy, Canada. Can J Fish Aquat Sci 65: 2063−2079
Lacroix GL, Knox D, Stokesbury MJW (2005) Survival andbehaviour of post-smolt Atlantic salmon in coastal habi-tat with extreme tides. J Fish Biol 66: 485−498
Lans L, Greenberg LA, Karlsson J, Calles O, Schmitz M,Bergman E (2011) The effects of ration size on migrationby hatchery-raised Atlantic salmon (Salmo salar) andbrown trout (Salmo trutta). Ecol Freshw Fish 20: 548−557
Martin F, Hedger RD, Dodson JJ, Fernandes L, Hatin D,Caron F, Whoriskey FG (2009) Behavioural transition
during the estuarine migration of wild Atlantic salmon(Salmo salar L.) smolt. Ecol Freshw Fish 18: 406−417
Moriarty PE, Byron CJ, Pershing AJ, Stockwell JD, Xue H(2016) Predicting migratory paths of post-smolt Atlanticsalmon (Salmo salar). Mar Biol 163: 1−11
Otero J, L’Abee-Lund JH, Castro-Santos T, Leonardsson Kand others (2014) Basin-scale phenology and effects ofclimate variability on global timing of initial seawardmigration of Atlantic salmon (Salmo salar). Glob ChangeBiol 20: 61−75
Peacock SJ, Krkošek M, Proboszcz S, Orr C, Lewis MA(2013) Cessation of a salmon decline with control of parasites. Ecol Appl 23: 606−620
Penston MJ, Davies IM (2009) An assessment of salmonfarms and wild salmonids as sources of Lepeophtheirussalmonis (Kroyer) copepodids in the water column inLoch Torridon, Scotland. J Fish Dis 32: 75−88
Serra-Llinares RM, Bjørn PA, Finstad B, Nilsen R, Harbitz A,Berg M, Asplin L (2014) Salmon lice infection on wildsalmonids in marine protected areas: an evaluation of theNorwegian ‘National Salmon Fjords’. Aquacult EnvironInteract 5: 1−16
Serra-Llinares RM, Bjørn PA, Finstad B, Nilsen R, Asplin L(2016) Nearby farms are a source of lice for wildsalmonids: a reply to Jansen et al. (2016). Aquacult Environ Interact 8: 351−356
Sfakiotakis M, Lane DM, Davies JBC (1999) Review of fishswimming modes for aquatic locomotion. IEEE J OceanEng 24: 237−252
Skilbrei OT (2010) Reduced migratory performance offarmed Atlantic salmon post-smolts from a simulatedescape during autumn. Aquacult Environ Interact 1: 117−125
Skilbrei OT (2012) The importance of escaped farmed rain-bow trout (Oncorhynchus mykiss) as a vector for thesalmon louse (Lepeophtheirus salmonis) depends on thehydrological conditions in the fjord. Hydrobiologia 686: 287−297
Skilbrei O, Jørstad K, Holm M, Farestveit E, Grimnes A,Aardal L (1994) A new release system for coastal ranch-ing of Atlantic salmon (Salmo salar) and behavioural patterns of released smolts. Nord J Freshw Res 69: 84−94
Skilbrei OT, Finstad B, Urdal K, Bakke G, Kroglund F,Strand R (2013) Impact of early salmon louse, Lepeoph-theirus salmonis, infestation and differences in survi -val and marine growth of sea-ranched Atlantic salmon,Salmo salar L., smolts 1997-2009. J Fish Dis 36: 249−260
Skilbrei OT, Espedal PG, Nilsen F, Garcia EP, Glover KA(2015) Evaluation of emamectin benzoate and substanceEX against salmon lice in sea-ranched Atlantic salmonsmolts. Dis Aquat Org 113: 187−194
Stone J, Roy WJ, Sutherland IH, Ferguson HW, SommervilleC, Endris R (2002) Safety and efficacy of emamectin ben-zoate administered in-feed to Atlantic salmon, Salmosalar L., smolts in freshwater, as a preventative treatmentagainst infestations of sea lice, Lepeophtheirus salmonis(Kroyer). Aquaculture 210: 21−34
Strand R, Finstad B (2007) Migratory behaviour in relation tosmolt development and releasing strategies in At lanticsalmon (Salmo salar L.) smolts. Aquaculture 273: 277−283
Strand JET, Davidsen JG, Jorgensen EH, Rikardsen AH(2011) Seaward migrating Atlantic salmon smolts withlow levels of gill Na+, K+ -ATPase activity; is sea entrydelayed? Environ Biol Fishes 90: 317−321
Taranger GL, Karlsen Ø, Bannister RJ, Glover KA and others
524
Vollset et al.: Overlap of salmon migration with lice infestation
(2015) Risk assessment of the environmental impact ofNorwegian Atlantic salmon farming. ICES J Mar Sci 72: 997−1021
Thorstad EB, Økland F, Finstad B, Sivertsgård R, Bjørn PA,McKinley RS (2004) Migration speeds and orientation ofAtlantic salmon and sea trout post-smolts in a Norwegianfjord system. Environ Biol Fishes 71: 305−311
Thorstad EB, Økland F, Finstad B, Sivertsgård R, PlantalechN, Bjørn PA, McKinley RS (2007) Fjord migration andsurvival of wild and hatchery-reared Atlantic salmon andwild brown trout post-smolts. Hydrobiologia 582: 99−107
Thorstad EB, Uglem I, Arechavala-Lopez P, Økland F, Fin-stad B (2011a) Low survival of hatchery-released Atlanticsalmon smolts during initial river and fjord migration.Boreal Environ Research 16: 115−120
Thorstad EB, Whoriskey F, Rikardsen AH, Aarestrup K(2011b) Aquatic nomad: the life and migrations of theAtlantic salmon. In: Aas Ø, Einum S, Klemetsen A,Skurdal J (eds) Atlantic salmon ecology. Blackwell Publishing Ltd., Oxford, p 1–33
Thorstad EB, Uglem I, Finstad B, Chittenden CM, Nilsen R,Økland F, Bjørn PA (2012a) Stocking location and preda-tion by marine fishes affect survival of hatchery-rearedAtlantic salmon smolts. Fish Manag Ecol 19: 400−409
Thorstad EB, Whoriskey F, Uglem I, Moore A, Rikardsen
AH, Finstad B (2012b) A critical life stage of the Atlanticsalmon Salmo salar: behaviour and survival during thesmolt and initial post-smolt migration. J Fish Biol 81: 500−542
Tully O, Nolan DT (2002) A review of the population biologyand host-parasite interactions of the sea louse Lepeoph-theirus salmonis (Copepoda: Caligidae). Parasitology 124:S165−S182
Urke HA, Kristensen T, Ulvund JB, Alfredsen JA (2013)Riverine and fjord migration of wild and hatchery-rearedAtlantic salmon smolts. Fish Manag Ecol 20: 544−552
Vollset KW, Barlaup BT, Skoglund H, Normann ES, SkilbreiOT (2014) Salmon lice increase the age of returningAtlantic salmon. Biol Lett 10: 20130896
Vollset KW, Krontveit RI, Jansen PA, Finstad B and others(2015) Impacts of parasites on marine survival of Atlanticsalmon: a meta-analysis. Fish Fish 7: 91−113
Vollset KW, Mahlum S, Davidsen JG, Skoglund H, BarlaupBT (2016) Interaction between migration behaviour andestuarine mortality in cultivated Atlantic salmon Salmosalar smolts. J Fish Biol, doi:10.1111/jfb.13097
Wood SN (2011) Fast stable restricted maximum likelihoodand marginal likelihood estimation of semiparametricgeneralized linear models. J R Stat Soc Ser B StatMethodol 73: 3−36
525
Editorial responsibility: Pablo Sánchez Jerez, Alicante, Spain
Submitted: February 24, 2016; Accepted: July 8, 2016Proofs received from author(s): August 26, 2016
➤
➤
➤
➤
➤
➤
➤