Embed Size (px)
Citation preview

Estimating the Global Economic Effects of GMOs
Kym Anderson Centre for International Economic Studies University of Adelaide Chantal Pohl Nielsen Danish Institute of Agricultural and Fisheries Economics and University of Copenhagen Sherman Robinson International Food Policy Research Institute Washington D.C. Karen Thierfelder U.S. Naval Academy Annapolis MD Revision of a paper presented at the IFPRI-sponsored pre-conference workshop of the Australian Agricultural and Resource Economics Society, Adelaide, 22 January 2001. Forthcoming in Agricultural Biotechnology: Markets and Policies in an International Setting, edited by P. Pardey, Washington, D.C.: International Food Policy Research Institute, 2001.
2
ABSTRACT
The new agricultural biotechnologies using transgenic or genetically modified organisms (GMOs) are attracting an exceptionally large degree of opposition. Both environmental and food safety concerns have been raised by opponents to the development of genetically modified (GM) crops. The vast majority of opponents want at least to have labels on products that may contain GMOs, while the most extreme of them (particularly in Western Europe) want to see GM crops totally excluded from production and consumption in their country. This extreme view contrasts with the more relaxed attitude towards the use of GMOs in pharmaceuticals, and swamps discussions of the positive attributes of the new technology. To illustrate the usefulness of quantitative models for informing the GMO debate, the present paper draws on recent studies by the authors that use empirical models of the global economy to examine what the effects of widespread adoption of genetically modified crop varieties in some (non-European) countries might be in light of different policy and consumer preference responses. In one study, the GTAP global model is used to examine the effects of an assumed degree of GMO-induced productivity growth in selected countries for maize and soybean. Those results are compared with what they would be if (a) Western Europe chose to ban consumption and hence imports of those products from countries adopting GM technology or (b) some Western European consumers and intermediate users responded by boycotting imported GM-potential crops. Another study uses a GAMS-based global computable general equilibrium (CGE) model in which countries can produce both GM and GM-free varieties of maize and soybeans. As in the GTAP analysis, there is an assumed degree of GMO-induced productivity growth for the GM variety. The model is used to explore the impact on production, trade, and the relative price of the GM and non-GM varieties of a preference shift towards GM-free food in Western Europe and High-income Asia. The final section discusses areas where future empirical work of this sort might focus. Key words: GMOs, trade policy, import ban, WTO JEL codes: C68, D58, F13, O3, Q17, Q18
Estimating the Global Economic Effects of GMOs
Kym Anderson, Chantal Nielsen, Sherman Robinson, and Karen Thierfelder
1. Introduction Virtually all new technologies, even when they unambiguously benefit the vast majority of society, are opposed by at least a few people. The new agricultural biotechnologies that are generating transgenic or genetically modified organisms (GMOs), however, are attracting an exceptionally large degree of opposition to their production and trade. Both environmental and food safety concerns have been raised by opponents to the development of transgenic or genetically modified crops. The vast majority of opponents want at least to have labels on products that may contain GMOs, while the most extreme of them (particularly in Western Europe) want to see GM crops totally excluded from production and consumption in their country.1 This extreme view contrasts with the more relaxed attitude towards the use of the new biotechnologies in pharmaceuticals, and swamps discussions of the current and prospective positive attributes of GM crops. Also associated with that negative view is the idea that we should not try to measure the economic and other effects of GMOs because there is too much uncertainty surrounding the technology. We beg to differ with the latter sentiment, believing that without attempts to quantify the economic effects of GMOs, opinion formation and policy making would be even less well informed because it would have to depend even more on guesswork.
To illustrate the usefulness of quantitative models for informing GMO debates, the present paper draws on recent studies2 by the authors that use two existing empirical models of the global economy to examine what the effects of widespread use of genetically modified crop varieties in some (non-European) countries might be in the light of different policy or consumer preference responses. Specifically, the standard global, economy-wide GTAP model is used to explore the possible effects of an assumed degree of GMO-induced productivity growth in selected countries for maize and soybean. These are more controversial than cotton and rice (see Nielsen and Anderson 2000c) because they are grown extensively in rich countries and are consumed by people there both directly and via animal products. Those maize/soybean results are compared with what they would be if (a) Western Europe chose to ban consumption and hence imports of those products from countries adopting GM technology or (b) some Western European consumers and intermediate users responded by boycotting imported GM-potential crops. Another study uses a GAMS-based global CGE model in which countries can produce both GM and GM-free varieties of maize and soybeans. As in the GTAP analysis, there is an assumed degree of GMO-induced productivity growth for the GM variety. The model is used
1 Whether import bans to achieve that would be consistent with other obligations members of the World Trade Organization may have is a moot point not discussed here, but see Anderson and Nielsen (2000). 2 Particularly Nielsen and Anderson (2000b) and Nielsen, Robinson and Thierfelder (2000).
2
to explore the impact on production, trade, and the relative price of the GM and non-GM varieties of a preference shift towards GM-free food in Western Europe and High-income Asia. The final section discusses areas where future empirical work of this sort might focus. 2. Estimating economic effects of GMO adoption in the GTAP model in which certain countries produce only the GM variety The apparent differences in preferences and views on environmental issues and consumers’ right to know about food ingredients are unlikely to disappear in the foreseeable future. The extent to which that could lead to trade disputes depends heavily on the directions and magnitudes of the production, trade and welfare consequences of different responses to the technology by different countries. Theory alone is incapable of determining even the likely direction, let alone the magnitude, of some of the effects of those various responses to GMOs. Hence an empirical modelling approach is needed to estimate the economy-wide impact of assumed GMO-induced productivity growth and any associated policy changes and consumer responses. By way of illustration, what follows is a summary of some early attempts at doing that for maize and soybean. These quantitative analyses make use of global economy-wide CGE models and are based on the same global database known as GTAP (Global Trade Analysis Project).3 The global CGE models capture the vertical and horizontal linkages between all product markets both within the model's individual countries and regions as well as between countries and regions via their separately identified bilateral trade flows. The models are shocked with productivity growth in their sectors producing coarse grain (grain other than wheat and rice, which is primarily maize in the countries considered) and oilseeds (primarily soybean in the countries considered). Detailed empirical information about the impact of GMO technology in terms of reduced chemical use, higher yields and other agronomic improvements is at this stage quite limited (see e.g. OECD 1999 and Nelson et al. 1999). Even so, available empirical evidence (e.g. USDA 1999 and James 1997, 1998) suggests that cultivating GM crops has general cost-reducing effects.4 Hence in estimating the economic impact of adopting GM technology in the maize and soybean sectors under different policy and consumer preference assumption, it is assumed that the effect of adopting GM crops can be captured by a Hicks-neutral technology shift, i.e. a uniform reduction in each adopting region of all primary factors and intermediate inputs needed to obtain the same level of production. For present purposes using the GTAP model, the GM-adopting sectors are assumed to experience a one-off increase in total
3 The Global Trade Analysis Project (GTAP) includes a multi-regional computable general equilibrium (CGE) model based on neo-classical perfectly competitive microeconomic theory and a unique global database for use with this and other CGE models. See Hertel (1997) for comprehensive documentation of the standard GTAP model and McDougall et al. 1998 for a description of the most recent GTAP database, which in its full version comprises 50 sectors and 45 countries/regions and describes the global economic structures and trade flows of 1995. 4 Nelson et al. (1999), for example, suggest that glyphosate-resistant soybeans may generate a total production cost reduction of 5%, and their scenarios have Bt corn increasing yields by between 1.8% and 8.1%.

3
factor productivity of 5%, thus lowering the supply price of the GM crop to that extent.5 Assuming sufficiently elastic demand conditions, the cost-reducing technology will lead to increased production and higher returns to the factors of production employed in the GM-adopting sector. Labour, capital, and land consequently will be drawn into the affected sector. As suppliers of inputs and buyers of agricultural products, other sectors will also be affected by the use of genetic engineering in GM-potential sectors through vertical linkages. Input suppliers will initially experience lower demand because the production process in the GM sector has become more efficient. To the extent that the production of GM crops increases, however, the demand for inputs by producers of those crops may actually rise despite the input-reducing technology. Demanders of primary agricultural products such as grains and soybean meal for livestock feed will benefit from lower input prices, which in turn will affect the market competitiveness of livestock products. The widespread adoption of GM varieties in certain regions will affect international trade flows depending on how traded the crop in question is and whether or not trade is restricted specifically because of the GMOs involved. To the extent that trade is not further restricted and not currently subject to binding quantitative restrictions, world market prices for these products will have a tendency to decline and thus benefit regions that are net importers of these products. For exporters, the lower price may or may not boost their trade volume, depending on price elasticities in foreign markets. Welfare in the exporting countries would go down for non-adopters but could also go down for some adopters if the adverse terms of trade change were to be sufficiently strong. Hence the need for empirical analysis. In modelling the adoption of GMOs in maize and soybean production, Nielsen and Anderson (2000b) apply GM-driven productivity growth of 5% in coarse grain (excluding wheat and rice) and oilseeds to North America, Mexico, the Southern Cone region of Latin America, India, China, Rest of East Asia (excluding Japan and the East Asian NICs), and South Africa. Other countries are assumed to refrain from the use of GM crops in their production systems. The authors consider three maize/soybean scenarios. The first is a base case with no policy or consumer reactions to GMOs. The others (scenarios 2 and 3) impose on this base case a policy or consumer response in Western Europe. In scenario 2, Western Europe not only refrains from using GM crops in its own domestic production systems, but the region is also assumed to reject imports of genetically modified oilseeds and coarse grains from GM-adopting regions. Scenario 3 considers the case in which consumers express their preferences through market mechanisms rather than through government regulation. Scenario 1: Selected regions adopt GM maize and soybean Table 1 reports the results for scenario 1. A 5% reduction in overall production costs in these sectors leads to increases in coarse grain production of between 0.4% and
5 Due to the absence of sufficiently detailed empirical data on the agronomic and hence economic impact of cultivating GM crops, the 5% productivity shock applied here represents an average shock (over both commodities and regions). Changing this shock (e.g. doubling it to 10%) generates near-linear changes (i.e. roughly a doubling) in the effects on price and quantity results reported below.

4
2.1%, and increases in oilseed production of between 1.1% and 4.6%, in the GM-adopting regions. The production responses are generally larger for oilseeds as compared with coarse grain. This is because a larger share of oilseed production as compared with coarse grain production is destined for export markets in all the reported regions, and hence oilseed production is not limited to the same extent by domestic demand, which is less price-elastic. Increased oilseed production leads to lower market prices and hence cheaper costs of production in the vegetable oils and fats sectors, expanding output there. This expansion is particularly marked in the Southern Cone region of South America where no less than one-fourth of this production is sold on foreign markets (Table 1a), thereby allowing for a larger production response to the reduced costs of production in this sector. In North America maize is also used as livestock feed, and hence the lower feed prices lead to an expansion of the livestock and meat processing sectors there. Due to the very large world market shares of oilseeds from North and South America and coarse grain from North America (Table 1a), the increased supply from these regions causes world prices for coarse grain and oilseeds to decline by 4.0% and 4.5%, respectively. As a consequence of the more intense competition from abroad, production of coarse grain and oilseeds declines in the non-adopting regions. This is particularly so in Western Europe, a major net importer of oilseeds, of which about half comes from North America. Cereal grain imports into Western Europe increase only slightly (0.1%), but the increased competition and lower price are enough to entail a 4.5% decline in Western European production. In the developing countries too, production of coarse grain and oilseeds is reduced slightly. The changes in India, however, are relatively small compared with e.g. China and the Southern Cone region. This is explained by the domestic market orientation of these sales. That means India’s relatively small production increase causes rather substantial declines in domestic prices for these products, which in turn benefits the other agricultural sectors through vertical linkages. For example, 67% of intermediate demand for coarse grain and 37% of intermediate demand for oilseeds in India stems from the livestock sector, according to the GTAP database. Global economic welfare (as traditionally measured in terms of equivalent variations of income, ignoring any externalities) is boosted in this first scenario by US$9.9 billion per year, two-thirds of which is enjoyed by the adopting regions (Table 1b). It is noteworthy that all regions (both adopting and non-adopting) gain in terms of economic welfare except Sub-Saharan Africa. Most of this gain stems directly from the technology boost. The net-exporting GM-adopters experience worsened terms of trade due to increased competition on world markets, but this adverse welfare effect is outweighed by the positive effect of the technological boost. Western Europe gains from the productivity increase in the other regions only in part because of cheaper imports; mostly it gains because increased competition from abroad shifts domestic resources out of relatively highly assisted segments of EU agriculture. The group of other high-income countries, among which are East Asian nations that are relatively large net importers of the GM-potential crops, benefits equally from lower import prices and a more efficient use of resources in domestic farm production.

5
Scenario 2: Selected regions adopt GM maize and soybean plus Western Europe bans imports of those products from GM-adopting regions In this scenario, Western Europe not only refrains from using GM crops in its own domestic production systems, but the region is also assumed to reject imports of genetically modified oilseeds and coarse grain from GM-adopting regions. This assumes that the labelling requirements of the Biosafety Protocol (UNEP 2000) enable Western European importers to identify such shipments and that all oilseed and coarse grain exports from GM-adopting regions will be labelled “may contain GMOs”. Under those conditions the distinction between GM-inclusive and GM-free products is simplified to one that relates directly to the country of origin,6 and labelling costs are ignored. This import ban scenario reflects the most extreme application of the precautionary principle within the framework of the Biosafety Protocol. A Western European ban on the imports of genetically modified coarse grain and oilseeds changes the situation in scenario 1 rather dramatically, especially for the oilseed sector in North America which has been highly dependent on the EU market. The result of the European ban is not only a decline in total North American oilseed exports by almost 30%, but also a production decline of 10%, pulling resources such as land out of this sector (Table 2). For coarse grain, by contrast, only 18% of North American production is exported and just 8% of those exports are destined for Western Europe. Therefore the ban does not affect North American production and exports of maize to the same extent as for soybean, although the downward pressure on the international price of maize nonetheless dampens significantly the production-enhancing effect of the technological boost. Similar effects are evident in the other GM adopting regions, except for India – once again because its production of these particular crops is virtually all sold domestically and so is not greatly affected by market developments abroad. For Sub-Saharan Africa, which by assumption is unable to adopt the new GM technology, access to the Western European markets when other competitors are excluded expands. Oilseed exports from this region rise by enough to increase domestic production by 4%. Western Europe increases its own production of oilseeds, however, so the aggregate increase in its oilseed imports amounts to less than 1%. Its production of coarse grain also increases, but not by as much because of an initial high degree of self-sufficiency. Europe’s shift from imported oilseeds and coarse grain to domestically produced products has implications further downstream. Given an imperfect degree of substitution in production between domestic and imported intermediate inputs, the higher prices of domestically produced maize and soybean mean that livestock feed is slightly more expensive. (Half of intermediate demand for coarse grain in Western Europe stems from the livestock sector.) Inputs to other food processing industries, particularly the vegetable oils and fats sector, also are more expensive. As a consequence, production in these downstream sectors decline and competing imports increase.
6 By distinguishing between GMO-inclusive and GMO-free products by country of origin, one concern may be that GM-adopting regions channel their exports to the country or region imposing the import ban (here Western Europe) through third countries that are indifferent as to the content of GMOs and that do not adopt GM technology in their own production systems. The possibility of such transshipments is abstracted from in this analysis.

6
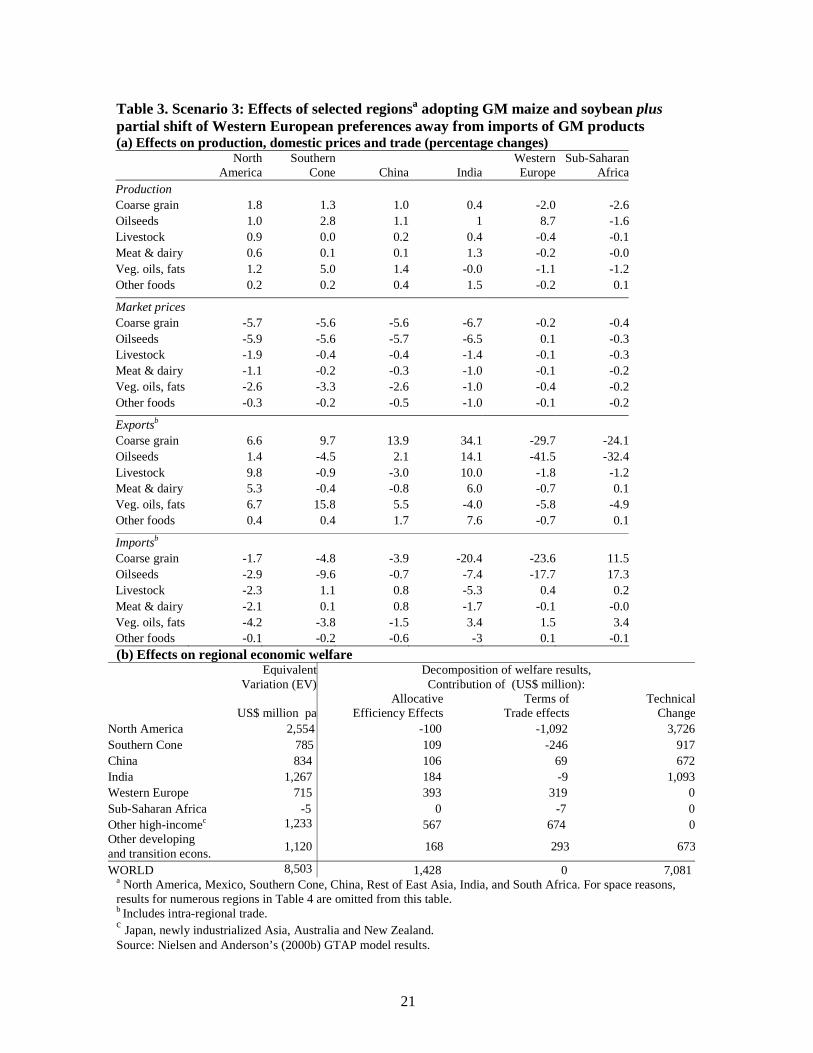
Aggregate welfare implications of this scenario are substantially different from those of scenario 1. Western Europe now experiences a decline in aggregate economic welfare of US$4.3 billion per year instead of a boost of $2 billion (compare Tables 2b and 1b). Taking a closer look at the decomposition of the welfare changes reveals that adverse allocative efficiency effects explain the decline. Most significantly, EU resources are forced into producing oilseeds, of which a substantial amount was previously imported. Consumer welfare in Western Europe is reduced in this scenario because, given that those consumers are assumed to be indifferent between GM-inclusive and GM-free products, the import ban restricts them from benefiting from lower international prices. Bear in mind, though, that in this as in the previous scenarios it is assumed citizens are indifferent to GMOs. To the extent that some Western Europeans in fact value a ban on GM products in their domestic markets, that would partially offset the loss in economic welfare. The key exporters of the GM products, North America, Southern Cone and China, all show a smaller gain in welfare in this as compared with the scenario in which there is no European policy response. Net importers of corn and soybean (e.g. ‘Other high-income’ which is mostly East Asia), by contrast, are slightly better off in this than in scenario 1. Meanwhile, the countries in Sub-Saharan Africa are affected in a slight positive instead of slight negative way, gaining from better terms of trade. In particular, a higher price is obtained for their oilseed exports to Western European markets in this as compared with scenario 1. Two-thirds of the global gain from the new GM technology as measured in scenario 1 would be eroded by an import ban imposed by Western Europe: it falls from $9.9 billion per year to just $3.4 billion, with almost the entire erosion in economic welfare borne in Western Europe (assuming as before that consumers are indifferent between GM-free and GM-inclusive foods). The rest is borne by the net-exporting adopters (mainly North America and the Southern Cone region). Since the non-adopting regions generally purchase most of their imported coarse grain and oilseeds from the North American region, they benefit even more than in scenario1 from lower import prices: their welfare is estimated to be greater by almost one-fifth in the case of a Western European import ban as compared with no European reaction. Scenario 3: Selected regions adopt GM maize and soybean plus some Western Europeans’ preferences shift against GM maize and soybean As an alternative to a policy response, this scenario analyses the impact of a partial shift in Western European preferences away from imported coarse grain and oilseeds and in favour of domestically produced crops.7 The scenario is implemented as an exogenous 25% reduction in final consumer and intermediate demand for all imported oilseeds and coarse grain (that is, not only those which can be identified as coming from GM-adopting regions).8 This can be interpreted as an illustration of incomplete information being provided about imported products (still assuming that GM crops
7 See the technical appendix of Nielsen and Anderson (2000a), which describes how the exogenous preference shift is introduced into the GTAP model. 8 The size of this preference shift is arbitrary, and is simply used to illustrate the possible direction of effects of this type of preference shift as compared with the import ban scenario.

7
are not cultivated in Western Europe), if a label only states that the product “may contain GMOs”. Such a label does not resolve the information problem facing the most critical Western European consumers who want to be able to distinguish between GMO-inclusive and GMO-free products. Thus some European consumers and firms are assumed to choose to completely avoid products that are produced outside Western Europe. That import demand is shifted in favour of domestically produced goods. Western European producers and suppliers are assumed to be able to signal – at no additional cost – that their products are GM-free by e.g. labelling their products by country of origin. This is possible because it is assumed that no producers in Western Europe adopt GM crops (perhaps due to government regulation), and hence such a label would be perceived as a sufficient guarantee of the absence of GMOs. As the results in Table 3 reveal, having consumers express their preferences through market mechanisms rather than through a government-implemented import ban has a much less damaging effect on production in the GM-adopting countries. In particular, instead of declines in oilseed production as in scenario 2 there are slight increases in this scenario, and production responses in coarse grain are slightly larger. Once again the changes are less marked for India and in part also for China, which are less affected by international market changes for these products. As expected, domestic oilseed production in Western Europe must increase somewhat to accommodate the shift in preferences, but not nearly to the same extent as in the previous scenario. Furthermore, there are in fact minor price reductions for agri-food products in Western Europe in part because (by assumption) the shift in preferences is only partial, and so some consumers and firms do benefit from lower import prices. In other words, in contrast to the previous scenario, a certain link between EU prices and world prices is retained here because we are dealing with only a partial reduction in import demand. The output growth in Sub-Saharan Africa in scenario 2, by taking the opportunity of serving European consumers and firms while other suppliers were excluded, is replaced in this scenario by declines: Sub-Saharan Africa loses export share to the GM-adopting regions. The numerical welfare results in this scenario are comparable with those of scenario 1 (the scenario without the import ban or the partial preference shift) for all regions except, of course, Western Europe. Furthermore, the estimated decline in economic welfare that Western Europe would experience if it banned maize and soybean imports is changed to a slight gain in this scenario (although recall that these welfare measures assume consumers are indifferent to whether a food contains GMOs). The dramatic worsening of resource allocative efficiency in the previous scenario is changed to a slight improvement in this one. This is because production in the lightly assisted oilseeds sector increases at the expense of production in all other (more heavily distorted) agri-food sectors in Western Europe. The welfare gains for North America are more similar in this scenario than in the previous one to those of scenario 1. But even in scenario 2, its gains are large, suggesting considerable flexibility in both domestic and foreign markets in responding to policy and consumer preference changes, plus the dominance of the benefits of the new technology for adopting countries. Given that the preference shift in scenario 3 is based on the assumption that non-adopters outside Western Europe cannot guarantee that their exports to this region are GMO-free, Sub-Saharan Africa

8
cannot benefit from the same kind of ‘preferential’ access the region obtained in the previous scenario, where coarse grain and oilseeds from just identifiable GMO-adopting regions were banned completely. Hence Sub-Saharan Africa slips back to a slight loss in this scenario due to a net worsening of its terms of trade and the absence of productivity gains from genetic engineering techniques. Globally, welfare in this case is only a little below that when there is no preference shift: a gain of $8.5 billion per year compared with $9.9 billion in scenario 1, with Western Europe clearly bearing the bulk of this difference. 3. Estimating economic effects of GMO adoption in a global CGE model with segmented markets for GM and Non-GM varieties in all countries An alternative modelling framework is used in a recent analysis by Nielsen, Robinson, and Thierfelder (2000), hereafter the NRT model, which draws on a model developed by Lewis, Robinson and Thierfelder (1999). The NRT model is expressed in levels and solved using the GAMS modelling language. The model is more aggregated than the GTAP model used in Neilsen and Anderson (2000b), with just seven regions and ten sectors, but is otherwise similar to the standard GTAP model. The NRT model introduces GM varieties by segmenting the coarse grain and oilseed sectors into GM and non-GM lines of production. In contrast to the Neilsen and Anderson model in which a country produces either the GM or non-GM variety exclusively, the NRT model allows a country to produce both varieties in response to market conditions. This segregation is introduced based on a notion that there may be a viable market for guaranteed GMO-free products alongside the new GMO-inclusive varieties if the GMO-critical consumers are willing to pay a price premium. Depending on the strength of opposition toward GM products in important markets and the costs of segregating agricultural markets, developing and developed countries alike may benefit from segregated agricultural markets, which will have different prices. Such a market development would be analogous to the niche markets for organic foods. In the base data used for this model analysis, it is assumed that all regions initially produce some of both the GM and non-GM varieties of oilseeds and coarse grain (in contrast to the assumption in the preceding scenarios that only a subset of countries can or choose to develop GM crops). The assumed GM shares of production, based on estimates provided in James (1999) and USDA (2000), are just 10% in all but three regions. The exceptions are the Americas and developing Asian countries where it is assumed 40% of coarse grain and 60% of oilseeds (90% in South America) contain GMOs. Furthermore, the structures of production in terms of the composition of intermediate input and factor use in the GM and non-GM varieties are initially assumed to be identical, as are the destination structures of exports. In the NRT model the authors endogenize the decision of producers and consumers to use GM versus non-GM varieties in production and final demand, respectively. The input-output choice is endogenized for four demanders of coarse grain and oilseeds: livestock, meat & dairy, vegetable oils & fats, and other processed food sectors. Intermediate demands for each composite crop (i.e. GM plus non-GM) are held fixed as proportions of output. In this way, the initial input-output coefficients remain fixed

9
but, for oilseeds and coarse grain, a choice has been introduced between GM and non-GM varieties. Other intermediate input demands remain in fixed proportions to output. Similarly, final consumption of each composite GM-potential good is also fixed as a share of total demand, with an endogenous choice between GM and non-GM varieties. All other consumption shares remain fixed. The choice between GM and non-GM varieties is determined by a CES function.9 Since the available estimates of agronomic and hence economic benefits to producers from cultivating GM crops are few and very diverse, NRT simply assume the GM oilseed and GM coarse grain sectors in all regions have a 10% higher level of primary factor productivity as compared with their non-GM (conventional) counterparts. This shock is slightly different from the shock imposed in the three GTAP scenarios: it is twice the size, but it is applied only to primary factors and not to intermediate input use. This difference in shock size may be interpreted as taking account of market segregation costs in the NRT model, i.e. the costs of preserving the identity of non-GM crops ‘from seed to table’ under the assumption that it is this segment of the market that will have to demonstrate its non-GM characteristic. The NRT model introduces this factor productivity shock in the GM sectors against a variety of base models, which differ in terms of substitution elasticities for GM and non-GM products in two of the most GM-critical regions, namely Western Europe and High-income Asia (mainly Japan). To start with, it is assumed that the elasticity of substitution between GM and non-GM varieties is high and equal in all regions. Then, in order to reflect the fact that citizens in Western Europe and High-income Asia are skeptical of the new GM varieties, the elasticities of substitution between the GM and non-GM varieties are gradually lowered so that GM and non-GM varieties are seen as increasingly poorer substitutes in production and consumption in these particular regions. Citizens in all other regions are assumed to be indifferent, and hence the two crops remain highly substitutable in consumption and production there. What results should we expect? As in the GTAP model scenarios, the more-effective GM production process will initially cause labour, land, and capital to leave the GM sectors because lower (cost-driven) GM product prices will result in lower returns to factors of production. To the extent that demand (domestically or abroad) is very responsive to this price reduction, this cost-reducing technology may potentially lead to increased production and hence higher returns to factors. Suppliers of inputs and buyers of agricultural products also will be affected by the use of genetic engineering in GM-potential sectors through vertical (or backward) linkages. To the extent that the production of GM crops increases, the demand for inputs by producers of those crops may rise. Demanders of primary agricultural products, e.g. livestock producers using grains and oilseeds for livestock feed, will benefit from lower prices, which in turn will affect the market competitiveness of these sectors. The other sectors of the economy may also be affected through horizontal (or forward) linkages. Primary crops and livestock are typically complementary in food
9 See Nielsen, Robinson and Thierfelder (2000) for a formal description of how the endogenous choice between GM and non-GM varieties is incorporated into the model.

10
processing. Cheaper genetically modified crops have the potential of initiating an expansion of food production and there may also be substitution effects. For example, since applying genetic engineering techniques to wheat breeding is apparently more complex compared with maize, the price of wheat will be high relative to other more easily manipulated grains. To the extent that substitutions in production are possible, the food processing industry may shift to the cheaper GM intermediate inputs. Furthermore, widespread use of GM products can be expected to affect the price and allocation of mobile factors of production and in this way also affect the other sectors of the economy. In terms of price effects, there is both a direct and an indirect effect of segregating the markets. Due directly to the output-enhancing productivity effect, countries adopting GM crops should gain from lower cost-driven prices. The more receptive a country is to the productivity-enhancing technology, the greater the gains. There is also an indirect effect, which will depend on the degree of substitutability between GM and non-GM products. When substitutability is high, the price of non-GM crops will decline along with the prices of GM-crops. The lower the degree of substitutability, the weaker will be this effect, and the larger should be the price wedge between GM and non-GM crops. The net effect of these direct and indirect effects on particular countries is theoretically ambiguous, again underscoring the need for empirical analysis. The widespread adoption of GM varieties in certain regions will affect international trade flows depending on how traded the crop in question is and the preferences for GM versus non-GM goods in foreign markets. World market prices for GM products will have a tendency to decline and thus benefit net importers to the extent that they are indifferent between GM and non-GM products. For exporters, the lower price may enable an expansion of the trade volume depending on the price elasticities and preferences in foreign markets. In markets where citizens are critical of GM ingredients in their food production systems, consumers will not fully benefit from the lower prices on GM crops. Furthermore, resources will be retained in the relatively less productive non-GM sectors in these regions. However, as is the case with organic food production, this would simply be a reflection of consumer preferences and hence not welfare-reducing. What production and trade results emerge from the NRT empirical analysis? The expected increase in production of the genetically modified crops is borne out in the empirical results for all regions of the NRT model, as a direct consequence of the assumed increase in factor productivity. (In the interests of space, only selected figures showing the results in Nielsen, Robinson and Thierfelder (2000) are reproduced here.) Due to the relative decline in productivity in the non-GM sectors, production of conventional coarse grain and oilseeds declines. Attention here focuses on the effects on overall trade and bilateral trade patterns for selected regions should citizens in High-income Asia and Western Europe become increasingly critical of GM crops, and hence these crops become correspondingly worse substitutes in production in these two regions.
11
As expected, the North American region is very sensitive to changes in preferences toward GMOs because it is the world’s largest exporter of both oilseeds and coarse grain, and it is particularly dependent on the GM-critical markets for these exports. Total exports of the GM varieties decline as GM and non-GM substitutability worsens in the GM-critical regions, and this is particularly so for oilseeds because almost 80% of North American oilseeds exports are initially sold in these markets, whereas the share is less than 60% for coarse grain. In response to the changing preferences, exports of the non-GM varieties are boosted. These changes are reflected in North America’s production results. Western Europe is an important importer of oilseeds. At the extreme, where Western Europeans are unconcerned about the GM or non-GM status of crops used in production, imports increase dramatically as the lower world market prices are exploited. As substitutability is reduced, GM-imports and production plunge while non-GM imports and production increase. The reduction of total GM oilseed imports occurs at a slower rate than for total GM cereal grain imports, due to the initial high dependence on oilseed imports from regions that are intensive users of GM varieties. Furthermore, as the Western European market becomes more difficult to penetrate, the import prices on GM products faced by Europeans decline. This tendency works against the effect of the preference shift. What about the trade results for the developing country regions? Starting with oilseed exports from South America (an extensive GM adopter) and Sub-Saharan Africa (a region with a low share of GM varieties in total production), the initial increase in total GM oilseed exports from these regions due to the factor productivity shock is reduced as preferences in High-income Asia and Western Europe turn against GMOs. (See figures 1-4.) Exports are directed away from the GM critical regions and spread evenly over the other importing regions. Of South America’s total oilseed exports, 84% are initially sold on GM critical markets as compared with 58% of oilseed exports from Sub-Saharan Africa. The adjustment in total GM oilseed exports is therefore relatively larger for South America. As expected, the exports of non-GM oilseeds from these two regions are generally being diverted toward the GM-critical regions and away from other regions. A noteworthy exception is that non-GM oilseed exports to North America also increase marginally as the other high-income countries become more critical of GMOs. Production of non-GM varieties increases mainly to serve the markets in Western Europe and High-income Asia as citizens there become increasingly critical of GMOs. Given a high yet imperfect substitutability between the two varieties in the non-critical regions such as North America, there is scope for selling both varieties in those markets as well. Both South America and Sub-Saharan Africa depend on imports for almost one-tenth of their total cereal grain absorption. However, in terms of sources, South America depends almost entirely on North America for its imports, while imports into Sub-Saharan Africa come from North America (50%), Western Europe (16%), and the Rest of World (28%). Because citizens of South America and Sub-Saharan Africa are assumed to be uncritical of GMO content, total GM cereal grain imports increase as preferences in Western Europe and High-income Asia turn against GMOs. This is because GM exports are now increasingly directed to non-critical markets (i.e. fewer markets), and so the import price declines even further than the price decline due to the factor productivity shock. Imports of GM crops from the GM critical countries of course decline drastically as production of GM crops in these regions declines. For the non-GM varieties, imports from the GM-critical regions increase marginally as
12
substitutability in those regions worsens and they respond by producing more of the non-GM variety. Given competition from increased supplies of GM crops, prices of non-GM crops also fall, and so South America and Sub-Saharan Africa also face declining prices on non-GM imports from the GM-critical regions as preferences shift. Low-income Asia is a net importer of both oilseeds and cereal grains. Most of these imports (89% of oilseeds and 83% of cereal grains) come from North and South America. Total imports of GM crops into this region increase slightly as preferences turn against GMOs in Western Europe and High-income Asia. Once again, this is because the redirection of GM export crops means increased supplies on fewer markets and hence prices decline even further. The flow of non-GM imports into Low-income Asia is relatively unaffected by the preference changes in the GM-critical regions because the bulk of oilseed imports initially comes from the Americas. In terms of bilateral flows, there are marginal increases in non-GM imports from Western Europe since imports from these regions must compete with GM crops in a GM-indifferent market. How large are the price wedges between GM and non-GM varieties?
The bilateral trade results summarized above show that trade diversion is significant. As preferences in High-income Asia and Western Europe turn against GM varieties, trade of GM-varieties expands in the GM-indifferent markets. At the same time, non-GM exports are redirected toward the GM-critical regions. In other words, markets adjust to accommodate the differences in tastes across countries. This favorable outcome is driven by the price differential that results between the two crop varieties. The price wedges that arise as a consequence of the different levels of factor productivity in GM and non-GM crop production are between 4.0% and 6.6%, varying across crops and regions. Figures 5 and 6 show how the ratios of non-GM to GM prices in different regions develop as substitutability between the two varieties worsens in the GM critical regions. In the GM critical regions, the non-GM/GM price ratio increases as citizens there become increasingly skeptical. This tendency is weaker for cereal grains in Western Europe because this region is not as strongly engaged in international trade in this crop as it is in oilseeds. In North America, the price wedge is generally small, and it declines as GM and non-GM substitutability worsens in the other high-income countries. Given that North America is the world’s largest producer and exporter of both crops, when there is high substitutability in all regions, prices of both varieties decline – the GM price declines due to the productivity shock, while the non-GM price declines because of increased competition in the GM-indifferent markets. In an effort to retain access to the GM critical markets, North American production of non-GM varieties increases as citizens of the GM critical regions become increasingly skeptical of GMOs.
With the exception of oilseeds in South America, the price wedges in the developing countries are unaffected by the preference changes in the Western Europe and High-income Asia. Thus it is the productivity differential that determines the price wedge in developing countries, not preference shifts in the GM critical regions. When developing countries are indifferent to the GM content of agricultural products (whether produced domestically or imported) and obtain most of their imports from
13
countries that are extensive adopters of GM crops, they gain substantially from lower import prices.
What are the effects on economic welfare in the different regions?
Global economic welfare (i.e. absorption) is estimated by the NRT model to increase by US$12 billion per year when GM coarse grain and oilseed production processes experience a 10% primary factor productivity increase, given the assumed regional shares of GM and non-GM varieties (see figure 7). As preferences in Western Europe and High-income Asia turn against GM varieties, this increase is reduced to $11 billion. South America, North America, and Low-income Asia are the main beneficiaries of the factor productivity increase. This is because all of them are assumed to be intense adopters of the productivity-increasing crop varieties. North America gains as the major producer and exporter of both crops. The total absorption gain in this region is reduced, but only by 5% relative to the high substitutability experiment, as a consequence of changing preferences in its important export markets in Western Europe and High-income Asia. However, as with the import ban and preference shift scenarios using the GTAP model above, these results also show that the ‘costs’ of the preference changes are borne mainly by the GM-critical regions themselves, with the gains made in High-income Asia (in terms of lower import prices) basically disappearing. In Western Europe, the initial boost in total absorption is cut in half. In particular, the increases in total absorption in all the developing country regions are not affected by the preference changes in the GM-critical regions. Low-income Asia is the major beneficiary in absolute terms, being both a net importer of the two crops and basically indifferent as to GM content. Hence the region benefits from substantially lower import prices on GM crops. Despite the high dependence on the GM critical regions for its exports of oilseeds, the increase in total absorption in South America is unaffected by the preference changes there because bilateral trade flows adjust well – trade diversion offsets the effects of demand shifts in the GM-critical regions. In Sub-Saharan Africa the gains are small in absolute terms, mainly due to the small share of these particular crops in production and trade, but they are also unaffected by preference changes in GM-critical regions. 4. Conclusions What have we learned? First, the potential economic welfare gains from adopting GMO technology in even just a subset of producing countries for these crops is significant. In the cases considered in the first scenario using the GTAP model it amounts to an estimated $9.9 billion per year for coarse grain and oilseeds. Moreover, developing countries would receive a sizeable share and possibly the majority of those gains – more so the more of them that are capable of introducing the new GM technology. The size of these gains, especially for developing countries, is such that policy makers should not ignore them when considering policy responses to appease opponents of GMO technology. Second, the most extreme use of trade restrictions by Western Europe, namely an import ban on GM crops, would be very costly in terms of economic welfare for the region itself – a cost which governments in the region need to weigh against the

14
perceived benefits to voters of adopting the precautionary principle in that way. Imposing a ban prevents European consumers and intermediate demanders from gaining from lower import prices, domestic production of corn and soybean would be forced to rise at the expense of other farm production, and hence overall allocative efficiency in the region would be worsened. In the case modelled the GM-adopting regions still enjoy welfare gains due to the dominating positive effect of the assumed productivity boost embodied in the GM crops, but those gains are reduced by the import ban as compared with the scenario in which GM crops are traded freely. To the extent that some developing and other countries do not adopt GM crops (by choice or otherwise) and they can verify this at the Western European borders, our results suggest it is possible they could gain slightly in gross terms from retaining access to the GMO-free markets when others are excluded. Whether they gain in net terms would depend on the cost of compliance with European regulations. Third, even if many consumers in Western Europe are concerned about GMOs, the results suggest that letting consumers express that preference through the market reduces the welfare gains from the new technology much less than if a ban on GMOs is imposed in Europe. The results also suggest, however, that developing countries that do not gain access to GM technology may be slightly worse off in terms of economic welfare if they cannot guarantee that their exports entering the Western European markets are GMO-free. For these countries, a complete segregation of GMO-inclusive and GMO-free markets may be a way in which they could reap benefits from selling ‘conventional’ products to GM-critical consumers in industrialised countries. This leads to the fourth conclusion based on the NRT model results, which indicate how global markets are likely to adjust to such segregation, in the sense that non-GM exports are diverted to the GMO-critical regions while GM-exports are diverted to the indifferent regions. Price differentials are significant, but tempered by commodity arbitrage. In particular, in certain GMO-favourable regions, the prices of the non-GM varieties also decline because of the high degree of substitutability between the GM and non-GM varieties in domestic use and increased production to supply critical consumers. In the GMO-critical regions, the price differentials reflect minor increases in supply of the non-GM products and marked declines in supply of GMO varieties. An important aspect of these results is that developing countries are also responsive to these GM preferences, and redirect their trade flows among partners accordingly. But this favourable outcome would require the relative price premium on the non-GM products to be sufficient not only to outweigh the productivity growth foregone by not adopting GMOs but also to cover the potentially significant costs of compliance. The realism of the quantitative results is limited by the lack of empirical data and incomplete knowledge of the effects of GM crops. The analysis has had to be based on simple assumptions about the productivity impact of introducing genetically modified crops in the agricultural production system, and any externalities have been ignored. To do better, more data are needed on the likely nature and size of the productivity gains and any externalities (positive as well as negative) in the various sectors of different countries. The global models used assume perfect competition in all markets, and neither separates out the (relatively tiny) markets for agricultural research and for crop seeds.
15
Furthermore, GMO technology is raising the incentive for vertical integration of firms involved in producing the biotechnology, the germplasm, the seeds, and some of the chemical inputs such as pesticides. Also, if GM crops are to be marketed separately from conventional crops, that may alter merger/acquisition incentives for grain-marketing firms in terms of horizontal integration, and in terms of their involvement in the feed-livestock complex. Less likely is that firms in either of these sectors might also be attracted to vertically integrate into food retailing if enough supermarket chains chose to not stock GM foods. Changes to firm concentration ratios in those sectors could well alter the extent to which they can capture monopolistic rents within the food chain, thereby altering the size of the gains from this technology enjoyed by farmers and final consumers. More-complex modelling would be needed to estimate the distributional and overall welfare consequences of such possibilities.

16
References Anderson, Kym and Chantal Pohl Nielsen (2000) ‘GMOs, Food Safety and the
Environment: What Role for Trade Policy and the WTO?’ Plenary Paper presented at the Triennial Conference of the International Association of Agricultural Economists, Berlin, 13-18 August. (Forthcoming in Tomorrow’s Agriculture: Incentives, Institutions, Infrastructure and Innovations, edited by G.H. Peters and P. Pingali, Aldershot: Ashgate for the IAAE, 2001.)
Hertel, Thomas W. (1997) (ed.) Global Trade Analysis: Modeling and Applications. Cambridge and New York: Cambridge University Press.
James, Clive (1997) Global Status of Transgenic Crops in 1997. ISAAA Briefs No. 5. International Service for the Acquisition of Agri-biotech Applications. Ithaca, New York.
James, Clive (1998) Global Review of Commercialized Transgenic Crops: 1998. ISAAA Briefs No.8. International Service for the Acquisition of Agri-biotech Applications. Ithaca, New York.
James, Clive (1999) Global Status of Commercialized Transgenic Crops: 1999. ISAAA Briefs No.12: Preview. International Service for the Acquisition of Agri-biotech Applications. Ithaca, New York.
Lewis, Jeffrey D., Sherman Robinson and Karen Thierfelder (1999) After the Negotiations: Assessing the Impact of Free Trade Agreements in Southern Africa. TMD Discussion Paper 46. September. International Food Policy Research Institute, Washington, D.C.
McDougall, Robert A., Aziz Elbehri and Truong P. Truong (1998) (eds.) Global Trade, Assistance, and Protection: The GTAP 4 Data Base. Center for Global Trade Analysis, Purdue University, West Lafayette.
Nelson, Gerald C., Timothy Josling, David Bullock, Laurian Unnevehr, Mark Rosegrant and Lowell Hill (1999) The Economics and Politics of Genetically Modified Organisms: Implications for WTO 2000. With Julie Babinard, Carrie Cunningham, Alessandro De Pinto and Elisavet I. Nitsi. Bulletin 809. College of Agricultural, Consumer and Environmental Sciences, University of Illinois at Urbana-Champaign, November.
Nielsen, Chantal Pohl and Kym Anderson (2000a) "GMOs, Trade Policy, and Welfare in Rich and Poor Countries". Paper presented at the World Bank Workshop on Standards, Regulation and Trade, Washington, D.C., 27 April. (Forthcoming in condensed form in Quantifying Trade Effects of Technical Barriers: Can it be Done? edited by Keith Maskus and John Wilson, Ann Arbor: University of Michigan Press.)
Nielsen, Chantal Pohl and Kym Anderson (2000b) "Global Market Effects of Alternative European Responses to GMOs". CIES Discussion Paper 0032, Centre for International Economic Studies, University of Adelaide, July. (Forthcoming in Weltwertschaftliches Archiv 137, 2001.)
Nielsen, Chantal Pohl and Kym Anderson (2000c) "Global Market Effects of Adopting Transgenic Rice and Cotton". mimeo, Centre for International Economic Studies, University of Adelaide, July.
Nielsen, Chantal Pohl, Sherman Robinson and Karen Thierfelder (2001) “Genetic Engineering and Trade: Panacea or Dilemma for Developing Countries?” Paper presented at the Third Annual Conference on Global Economic Analysis, Monash University 28-30 June. (Available as Discussion Paper No. 55, Trade and Macroeconomics Division, International Food Policy Research Institute (IFPRI), Washington, D.C. and Forthcoming in World Development, August 2001.)

17
OECD (1999) Modern Biotechnology and Agricultural Markets: A Discussion of Selected Issues and the Impact on Supply and Markets. Directorate for Food, Agriculture and Fisheries. Committee for Agriculture. AGR/CA/APM/CFS/MD(2000)2, Paris: OECD.
UNEP (2000) Cartagena Protocol on Biosafety to the Convention on Biological Diversity. http://www.biodiv.org/biosafe/biosafety-protocol.htm
USDA (1999) 'Impact of Adopting Genetically Engineered Crops in the U.S.– Preliminary Results'. Economic Research Service, USDA. Washington, D.C., July.
USDA (2000) Biotech Corn and Soybeans: Changing Markets and the Government’s Role. April 12, 2000. http://ers.usda.gov/whatsnew/issues/biotechmarkets/


19
Table 1. Scenario 1: Effects of selected regionsa adopting GM maize and soybean (a) Effects on production, domestic prices and trade (percentage changes)
North
AmericaSouthern
Cone China IndiaWestern Europe
Sub-Saharan Africa
Production Coarse grain 2.1 1.6 1.0 0.4 -4.5 -2.3 Oilseeds 3.6 4.6 1.8 1.1 -11.2 -1.3 Livestock 0.8 -0.0 0.1 0.4 -0.2 -0.1 Meat & dairy 0.5 0.0 0.1 1.3 -0.1 -0.1 Veg. oils, fats 1.1 4.5 1.4 0.0 -0.9 -1.2 Other foods 0.2 0.1 0.4 1.5 -0.1 0.0 Market prices Coarse grain -5.5 -5.5 -5.6 -6.7 -0.5 -0.4 Oilseeds -5.5 -5.3 -5.6 -6.5 -1.2 -0.3 Livestock -1.8 -0.3 -0.4 -1.4 -0.3 -0.3 Meat & dairy -1.0 -0.2 -0.3 -1.0 -0.2 -0.2 Veg. oils, fats -2.4 -3.1 -2.6 -1.0 -0.5 -0.2 Other foods -0.3 -0.2 -0.5 -1.0 -0.1 -0.2 Exportsb Coarse grain 8.5 13.3 16.8 37.3 -11.5 -20 Oilseeds 8.5 10.5 8.2 21.5 -20.5 -26.5 Livestock 8.9 -2.0 -3.3 9.4 -1.1 -1.5 Meat & dairy 4.8 -0.9 -0.9 5.8 -0.5 -0.2 Veg. oils, fats 5.8 14.3 5.6 -3.8 -4.9 -5.3 Other foods 0.2 0.1 1.6 7.6 -0.6 0.1 Importsb Coarse grain -1.6 -4.6 -4.2 -20.5 0.1 11.3 Oilseeds -2.6 -9.2 -1.6 -8.6 2.5 16.5 Livestock -2.1 1.3 0.9 -5.2 0.2 0.5 Meat & dairy -1.9 0.2 0.8 -1.7 -0.0 0.1 Veg. oils, fats -3.7 -3.6 -1.7 3.1 1.3 3.4 Other foods 0 -0.1 -0.6 -3.1 0.1 -0.1 (b) Effects on regional economic welfare
Equivalent
Variation (EV)Decomposition of welfare results,
contribution of (US$ million):
US$ million pa Allocative Efficiency Effects
Terms of Trade effects
Technical Change
North America 2,624 -137 -1,008 3,746 Southern Cone 826 120 -223 923 China 839 113 66 672 India 1,265 182 -9 1,094 Western Europe 2,010 1,755 253 0 Sub-Saharan Africa -9 -2 -9 0 Other high-incomec 1,186 554 641 0 Other developing and transition econs.
1,120 171 289 673
WORLD 9,859 2,756 0 7,108 a North America, Mexico, Southern Cone, China, Rest of East Asia, India, and South Africa. For space reasons, results for numerous regions in Table 4 are omitted from this table. b Includes intra-regional trade. c Japan, newly industrialized Asia, Australia and New Zealand. Source: Nielsen and Anderson’s (2000b) GTAP model results.

20
Table 2. Scenario 2: Effects of selected regionsa adopting GM maize and soybean plus Western Europe bans imports of those products from GM-adopting regions (a) Effects on production, domestic prices and trade (percentage changes)
North
AmericaSouthern
Cone China IndiaWestern Europe
Sub-Saharan Africa
Production Cereal grain 0.9 0.0 0.8 0.4 5.3 -2.2Oilseeds -10.2 -3.6 -0.8 0.8 66.4 4.4Livestock 1.2 0.3 0.2 0.4 -0.8 0.0Meat & dairy 0.8 0.3 0.2 1.4 -0.5 -0.0Veg.oils,fats 2.4 8.1 1.6 0.1 -3.4 0.0Other foods 0.3 0.4 0.5 1.6 -0.5 -0.1 Market prices Cereal grain -6.2 -6.0 -5.6 -6.7 0.8 -0.0Oilseeds -7.4 -6.8 -6.0 -6.5 5.8 0.4Livestock -2.2 -0.7 -0.4 -1.4 0.5 0.1Meat & dairy -1.3 -0.4 -0.3 -1.0 0.3 0.1Veg.oils,fats -3.3 -4.0 -2.7 -1.0 2.0 0.0Other foods -0.4 -0.3 -0.5 -1.0 0.1 0.0 Exportsb Cereal grain 0.3 -2.9 5.0 23.4 15.9 -13.1Oilseeds -28.8 -69.2 -18.4 -8.7 167.2 105.0Livestock 13.7 4.0 -1.4 12.6 -3.8 -1.8Meat & dairy 7.5 2.1 0.1 7.1 -1.4 0.3Veg.oils,fats 14.4 26.2 7.0 1.3 -15.0 5.8Other foods 1.5 1.9 2.0 8.0 -1.4 -0.6 Importsb Cereal grain -1.9 -5.3 -2.8 -20 3.3 13.4Oilseeds -5.6 -21.9 3.0 -3.7 0.6 22.5Livestock -3.2 0.1 0.1 -5.9 0.9 0.5Meat & dairy -2.8 -0.5 0.8 -1.8 -0.2 -0.0Veg.oils,fats -7.7 -5.5 -1.7 4.0 5.5 2.4Other foods -0.6 -0.6 -0.8 -2.8 0.1 0.2(b) Effects on regional economic welfare
Equivalent Variation (EV)
Decomposition of welfare results (US$ million pa):
US$ million paAllocative
Efficiency EffectsTerms of
Trade effectsTechnical
ChangeNorth America 2,299 27 -1,372 3,641 Southern Cone 663 71 -303 893 China 804 74 70 669 India 1,277 190 -3 1,092 Western Europe -4,334 -4,601 257 0 Sub-Saharan Africa 42 5 38 0 Other high-incomec 1,371 592 782 0 Other developing and transition econs.
1,296 101 531 672
WORLD 3,419 -3,541 0 6,966 a North America, Mexico, Southern Cone, China, Rest of East Asia, India, and South Africa. For space reasons, results for numerous regions in Table 4 are omitted from this table. b Includes intra-regional trade. c Japan, newly industrialized Asia, Australia and New Zealand. Source: Nielsen and Anderson’s (2000b) GTAP model results.
21
Table 3. Scenario 3: Effects of selected regionsa adopting GM maize and soybean plus partial shift of Western European preferences away from imports of GM products (a) Effects on production, domestic prices and trade (percentage changes)
North America
Southern Cone China India
Western Europe
Sub-Saharan Africa
Production Coarse grain 1.8 1.3 1.0 0.4 -2.0 -2.6 Oilseeds 1.0 2.8 1.1 1 8.7 -1.6 Livestock 0.9 0.0 0.2 0.4 -0.4 -0.1 Meat & dairy 0.6 0.1 0.1 1.3 -0.2 -0.0 Veg. oils, fats 1.2 5.0 1.4 -0.0 -1.1 -1.2 Other foods 0.2 0.2 0.4 1.5 -0.2 0.1 Market prices Coarse grain -5.7 -5.6 -5.6 -6.7 -0.2 -0.4 Oilseeds -5.9 -5.6 -5.7 -6.5 0.1 -0.3 Livestock -1.9 -0.4 -0.4 -1.4 -0.1 -0.3 Meat & dairy -1.1 -0.2 -0.3 -1.0 -0.1 -0.2 Veg. oils, fats -2.6 -3.3 -2.6 -1.0 -0.4 -0.2 Other foods -0.3 -0.2 -0.5 -1.0 -0.1 -0.2 Exportsb Coarse grain 6.6 9.7 13.9 34.1 -29.7 -24.1 Oilseeds 1.4 -4.5 2.1 14.1 -41.5 -32.4 Livestock 9.8 -0.9 -3.0 10.0 -1.8 -1.2 Meat & dairy 5.3 -0.4 -0.8 6.0 -0.7 0.1 Veg. oils, fats 6.7 15.8 5.5 -4.0 -5.8 -4.9 Other foods 0.4 0.4 1.7 7.6 -0.7 0.1 Importsb Coarse grain -1.7 -4.8 -3.9 -20.4 -23.6 11.5 Oilseeds -2.9 -9.6 -0.7 -7.4 -17.7 17.3 Livestock -2.3 1.1 0.8 -5.3 0.4 0.2 Meat & dairy -2.1 0.1 0.8 -1.7 -0.1 -0.0 Veg. oils, fats -4.2 -3.8 -1.5 3.4 1.5 3.4 Other foods -0.1 -0.2 -0.6 -3 0.1 -0.1 (b) Effects on regional economic welfare
Equivalent Variation (EV)
Decomposition of welfare results, Contribution of (US$ million):
US$ million paAllocative
Efficiency EffectsTerms of
Trade effectsTechnical
ChangeNorth America 2,554 -100 -1,092 3,726 Southern Cone 785 109 -246 917 China 834 106 69 672 India 1,267 184 -9 1,093 Western Europe 715 393 319 0 Sub-Saharan Africa -5 0 -7 0 Other high-incomec 1,233 567 674 0 Other developing and transition econs.
1,120 168 293 673
WORLD 8,503 1,428 0 7,081 a North America, Mexico, Southern Cone, China, Rest of East Asia, India, and South Africa. For space reasons, results for numerous regions in Table 4 are omitted from this table. b Includes intra-regional trade. c Japan, newly industrialized Asia, Australia and New Zealand. Source: Nielsen and Anderson’s (2000b) GTAP model results.