Embed Size (px)
Citation preview
1
Estimating the environmental impacts of concrete
CEES 2313: Water Quality Fundamentals Instructor: Liz Butler
School of Civil Engineering and Environmental Science University of Oklahoma, Norman, OK
I. Learning objectives By the end of this unit, you should be able to:
A. Estimate the energy and water required to produce one unit mass (e.g., 1 kg) of concrete (sometimes called the “embedded” or “embodied” energy or water).
B. Apply the EIO-LCA model or the NREL LCI database to quantify emissions of pollutants (e.g., atmospheric CO2) associated with the manufacture of concrete and other materials and processes.
C. Use the library database CompendexWeb (COMPuterized ENgineering inDEX) to find a journal article on a topic of interest (for this assignment, the topic will be sustainability or sustainable engineering as it relates to concrete). Obtain the article you want from either the library shelves, the library web page (for journals that the university subscribes to electronically), or from interlibrary loan.
D. Discuss how/whether concrete can play a role in sustainable engineering. II. Background information In this section we will review several topics related to estimating the environmental impacts of concrete. A. Sustainable development The original definition of “sustainable development” came from a United Nations commission (The “Brundtland commission”) in 1987: “Sustainable development is development that meets the needs of the present without compromising the ability of future generations to meet their own needs. It contains within it two key concepts:
• the concept of 'needs', in particular the essential needs of the world's poor, to which overriding priority should be given; and
• the idea of limitations imposed by the state of technology and social organization on the environment's ability to meet present and future needs.”

2
Here “needs” meant basic human needs (food, shelter, water, sanitation) and “development” referred primarily to improving the living standards of the world’s poorest. Since 1987, the term sustainable development has in some fields evolved without much change into the term “sustainability”. For example, the web page of the U. S. Environmental Protection Agency says “The traditional definition of sustainability calls for policies and strategies that meet society’s present needs without compromising the ability of future generations to meet their own needs” (http://www.epa.gov/sustainability/basicinfo.htm#sustainability). B. Sustainable engineering Manufacture of any product (e.g., anything from a pencil to a building) or operation of a process (e.g., wastewater treatment) consumes materials and energy, and emits wastes to the environment. Many of these “engineered” products and processes also use materials (e.g., copper) or fossil fuels for which the global reserves are limited. While generally not true at the start of the industrial revolution and throughout the first two thirds of the 20th century, in recent years there has been a growing global awareness of the adverse impacts of many manufacturing and other processes on the environment, and a desire to minimize these impacts. This means that concerns with sustainability in engineered products and processes will only increase in the future. Engineers design products, systems, and processes to meet human needs and desires. Sustainable engineering is the design of such products, systems, and processes so as to minimize adverse impacts on the environment, particularly waste emissions and energy consumption. This involves: 1. Minimizing materials use and promoting recycling and reuse.
Exercise: Look in your backpack and pick out a couple of products. Which are made from recycled material? Which are recyclable? Which can be completely disassembled and all component materials separated (a necessary step prior to recycling)?
2. Using primarily renewable (e.g., biofuels) versus primarily nonrenewable (petroleum fuels) resources where possible.
Exercise: Consider one of the products in your backpack. What resources (including minerals or ores, wood fibers, and fossil fuels) were used to manufacture this product? Are they renewable?
3. Design for the “life cycle,” which means considering the entire life cycle of a product at the design stage, and choosing materials and features with lowest environmental impacts.
Exercise: Consider one the products from the previous exercise, or think of some process you engaged in today (e.g., brushing your teeth; making toast or coffee; driving to school). Draw in a flow chart the life cycle of the product or process
3
(e.g., identify all steps from “cradle” to “grave”, i.e., raw material extraction to ultimate product disposal.) Identify the step(s) in the life cycle that you believe to have the greatest environmental impacts. Identify how the product/process could be changed to minimize these impacts.
For more on the topic of sustainable engineering, read about “Design for the Environment” or DfE. C. Concrete use worldwide Concrete is a mixture of cement, water, air, and aggregate (which consists of crushed rock, gravel, sand, and synthetic or waste materials, including sometimes crushed recycled concrete) that hardens after wetting to form a solid material. Concrete can be thought of as the final product, and cement, water, air, and aggregate as the ingredients or “recipe” for concrete. Almost every country in the world has at least one cement plant; some (e.g., the United States, China, and India), have more than 100 (van Oss and Padovani 2002). Concrete is an inexpensive material with the potential to construct many components of society’s infrastructure, such as roads, sewers, houses, and schools. Thus, it can contribute in a direct way to development in the less developed world. In addition, one group estimates that the cement industry employs 850,000 people worldwide (Battelle Memorial Institute 2002), meaning that cement (and concrete) manufacture contribute significantly to economic activity and generation of income throughout the world. D. Concrete life cycle Cement is the binder or active ingredient in concrete—i.e., the ingredient that makes concrete harden when mixed with water. Production of cement has significant adverse environmental impacts, mainly arising from the production of the cement component called clinker. Clinker is made by mixing limestone (CaCO3) with silica (SiO2) and small amounts of iron and aluminum oxides, then heating in a kiln. The resulting material is ground and mixed with gypsum (CaSO4) and aggregate to form cement.
Exercise: Go to the website of the Portland Cement Association (http://www.cement.org/basics/howmade.asp) and click on “Take a Virtual Tour of a Cement Plant” for some animations illustrating how cement is made.
Exercise: Draw a flow diagram of the life cycle of concrete. Identify steps in the process where adverse environmental impacts may occur.
One significant adverse environmental impact of concrete comes in the production of cement, which involves limestone calcining in a high temperature kiln to form quicklime (CaO): CaCO3 + heat → CO2(g) + CaO (1)

4
The “heat” in equation 1 comes at least in part from fossil fuel combustion, which also generates CO2(g) CH2O (a fuel) + O2 → CO2(g) + H2O (2) The remaining chemical transformations that take place in the kiln include formation of calcium silicates, aluminates, and ferrates (van Oss and Padovani 2002), which give cement its binding properties. Generation of electricity used to rotate the kiln (most commonly a rotary kiln), grind the clinker, and run the conveyor belts into the kiln also produce CO2 emissions. (In the U.S., electricity is generated primarily through combustion of coal). CO2 emissions from limestone calcination (reaction 1) and fossil fuel combustion (reaction 2) together constitute the biggest environmental impact from cement manufacture and concrete production. It has been estimated that approximately 3% (Battelle Memorial Institute 2002) to 8% (Wilson 1993) of the CO2 generated globally each year comes from cement manufacture, with about equal masses of CO2 coming from limestone calcination (reaction 1) and fossil fuel consumption (reaction 2) (van Oss and Padovani 2003). Concrete manufacture also results in emissions of other pollutants to the air, as we will discuss below, and consumes a significant amount of water, especially for “wet process” clinker production. III. Tools for estimating environmental impacts of concrete and other products and processes A. EIO-LCA model The “Economic Input Output-Life Cycle Assessment” (EIO-LCA) model (Hendrickson et al. 1998) is a free public-domain software available at http://www.eiolca.net. Go to this page and click on “method” to learn more about the model. It was generated by taking survey data from the U.S. Department of Commerce that identifies the products and services used to make one unit of output (in terms of dollars) from any of the U.S. manufacturing sectors, then linking this information to the average water and energy consumption and emissions to the environment associated with those products and services.
Exercise: Go to http://www.eiolca.net. Answer the following questions. (We will work through the first as a class. Do the second on your own or in small groups.)
a. What are the greenhouse gas emissions, energy use, toxics emissions, and
water use associated with the production of $1M worth of concrete in the U.S.?
b. Pick one category of output (e.g., CO2 emissions or water use) associated with production of $1M worth of concrete and compare it to that associated with production of $1M of another product or service (your choice—could be

5
anything that you find in EIO-LCA model). Any surprises? Discuss with the others at your table.
Steps for using the EIO-LCA model
• Go to http://www.eiolca.net. • Click on “use the tool”. • Choose the USA 2002 model (unless another one is appropriate). • Select the appropriate sector, either by searching or by choosing from the drop
down menu. (Hint: Cement and concrete manufacturing are listed under “Plastic, rubber, and nonmetallic mineral products”. For this example, choose “ready-mix concrete manufacturing”.)
• Select the amount of “economic activity”, i.e., the dollar value of concrete for which you wish to assess the environmental impacts.
• Select the category of results to display. o Economic activity o Greenhouse gases o Energy o Toxic releases o Water use
Strengths/limitations of the EIO-LCA model:
• It accounts for environmental impacts from all economic sectors contributing to the production of a product or service (a strength).
• The output data are highly aggregated and averaged over the whole U.S. economy (a weakness).
• The model accounts for environmental impacts only at the production stage (e.g., the adverse impacts associated with manufacturing a toaster), and not the use stage (e.g., the adverse environmental impacts associated with using the toaster every day for 20 years) (another weakness).
B. NREL LCI database The National Renewable Energy Lab (NREL) life cycle inventory (LCI) database is publicly available at http://www.nrel.gov/lci, but to use it you must register and agree to the terms of use. It also provides information on emissions associated with manufacture of different products as well as processes such as transportation.
Exercise: Repeat the exercise above for manufacture of 1 kg of Portland Cement using the NREL LCI database. Cement constitutes about 12% of ready mix concrete, on average (Wilson 1993).

6
IV. Is concrete sustainable? The environmental “costs” of concrete, particularly the significant CO2 emissions associated with cement manufacturing, may be “offset” to some extent by some potential environmental benefits of concrete, including:
Using cement kilns for heating water (to generate steam for heating buildings—say those at the cement plant or nearby facilities).
Using cement kilns for hazardous waste incineration. Incorporation of waste materials (e.g., fly ash from coal combustion, blast furnace slag
from steel production) into concrete as a means of waste disposal and/or to reduce the amount of cement needed.
Designs that take advantage of concrete’s thermal properties (it heats up and releases heat slowly). For more information, see the Portland Cement Association web page: http://www.concretethinker.com/solutions/Thermal-Mass.aspx.
Designs that use pervious or porous concrete (through which water can flow, preventing or lessening runoff from parking lots and other impervious ground cover).
Note that not all of these benefits directly offset the adverse environmental impact of concrete production associated with CO2 emissions. Some benefits are in other areas altogether (e.g., preventing runoff of oils and grease from parking lots into surface waters). The overall environmental impacts of concrete compared to other materials for different applications should be evaluated using life cycle assessment. V. Homework assignment Please be prepared to discuss your answers to questions 1 and 2 in your groups on the homework due date. 1. Go to http://libraries.ou.edu and use the database CompendexWeb to find an article related to the sustainability of concrete. Type a 250-500 word summary of the article that contains the following components, each under a heading of the same name:
• Synopsis of the article’s main points; • Authors’ positions and/or recommendations, and • Implications of the results (don’t limit this section to what the author says are the
implications—include your own). To narrow your search for an article, use multiple key word phrases such as “sustainable” and “concrete construction”. For ideas on key word phrases to search for, browse the following websites (or others):
• American Concrete Institute Green Building Resources web page: http://www.concrete.org/technical/green-building-resources.htm
7
• Portland Cement Association “Sustainable Development” web page: http://www.cement.org/SD/index.asp.
The article you review must be a full length journal article—typically 5,000 words or more (at least 4-5 typeset pages). Include a copy of the article that you review with your assignment. 2. Use the EIO-LCA model to estimate the environmental impacts associated with manufacturing the concrete used in the two new buildings on campus: Devon Energy Hall and the Engineering Practice Facility. According to Boldt Construction (the company that built the buildings), approximately 11,308 cubic yards of concrete were poured to construct the buildings. Assume an overall concrete cost of $75 per cubic yard.
a. Calculate the CO2 emissions associated with manufacture of this concrete. b. Calculate the water required to manufacture this concrete. c. Calculate the energy required to manufacture this concrete.
Next, using the EIO-LCA model, compare a, b, and c to the CO2 emissions and water and energy used to generate the electricity used in these buildings in one year.
d. Calculate the CO2 emissions associated with generation of electricity used in both buildings in one year. To find electricity use for campus buildings, go to http://www.ou.edu/physicalplant/energy_report.shtml. The units of energy in the figures at this link should be kWh. To find out the cost of electricity, visit the U.S. Energy Information Administration: http://www.eia.doe.gov/electricity/epm/table5_6_b.html. Since the emissions estimates from the EIO-LCA model are averaged for the whole country, for this exercise, use the “U.S. total” electricity cost for all sectors. Use the most recent year for which full data are available (2009).
e. Calculate the water required to generate the electricity used in both buildings in one year.
f. Calculate the energy required to generate the electricity used in both buildings in one year.
Summarize your results for a-f in a neat table, but show all work used to calculate each number. Specifically, for credit, you must provide enough information documenting your problem solving process at each step that someone else could repeat exactly what you did. Answers for which the entire problem solving process is not clearly documented will receive no credit. You are free to work in groups on question 2. If you do this, please write the names of all people you worked with on your assignment, and each group member should also turn in all work her/himself. VI. References

8
Battelle Memorial Institute, 2002. Toward a sustainable cement industry. An independent study commissioned by the World Business Council for Sustainable Development. <http://www.wbcsd.org/web/publications/batelle-full.pdf> (Aug. 18, 2010). Hendrickson, C. T., Horvath, A., Joshi, S., Lave, L., 1998. Economic input-output models for environmental life cycle assessment. Environ. Sci. Technol. 32(7), 184A-191A. Wilson, A., 1993. Cement and concrete: Environmental considerations. Environ. Build. News 2(2), 7–12. < http://www.buildinggreen.com/auth/article.cfm/1993/3/1/Cement-and-Concrete-Environmental-Considerations/> (Aug. 18, 2010). van Oss, H. G., Padovani, A. C., 2002. Cement manufacture and the environment. Part I: Chemistry and technology. J. Ind. Ecol. 6(1), 89–105. van Oss, H. G., Padovani, A. C., 2003. Cement manufacture and the environment. Part II: Environmental challenges and opportunities. J. Ind. Ecol. 7(1), 93–126.

1
Estimating the environmental impacts of concrete
Solutions to exercises and homework problems
These solutions were prepared by Aissata Cisse (Undergraduate Teaching Assistant) and Liz Butler (Professor)
School of Civil Engineering and Environmental Science University of Oklahoma, Norman, OK
December 21, 2010
Students in the Fall 2010 section of Water Quality Fundamentals (CEES 2313) provided the examples shown here.

2
Solutions to exercises Section II.B.1 Examples of products that are made from recycled material include a plastic container for mints, a plastic ruler, napkins, and spiral notebook paper. Examples of products that are recyclable include notebooks, plastic water bottles, parts of calculators, and (possibly) the plastic around a pen. The calculator could be disassembled to some extent. Other products that could be disassembled include three ring binders and spiral notebooks. Section II.B.2 In the case of the calculator, the resources used were:
• Plastic: renewable • Copper: non-renewable • Fossil fuels: non-renewable
Section II.B.3 Consider the example of taking a shower, focusing specifically on the water used. The life cycle of water for a shower is illustrated below. (This example was prepared by Amanda Oehlert.)
Water in ground
Pumped up via well
Heated in hot water
tank
Comes out in shower
Goes to septic tank via drain
Absorbed into ground
This uses energy to draw the water out of
the ground, which uses fossil fuels.
This probably has one of the biggest environmental impacts because it
uses electricity to heat the water and that uses fossil fuels.
This step has the least impact because the water returns to the ground and provides
water for plants.
This step could be altered by taking shorter showers thereby using less water needing to be heated, or by
maybe having a small water heater that uses less electricity to heat, or maybe by getting solar panels on the house to heat the water with sunlight instead
of electricity

3
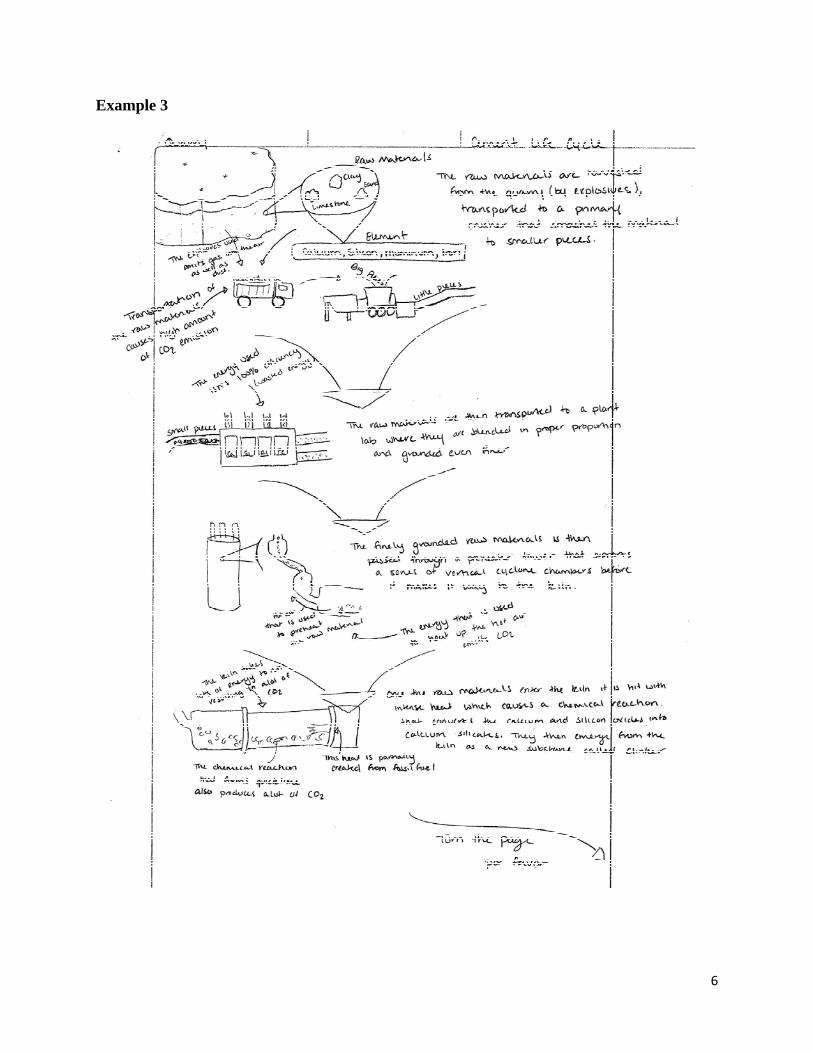
Section II.D; second exercise
Three example flow diagrams of the life cycle of concrete are shown on the following pages. These examples were prepared by Josh Wright (example 1), Nick Ibarguen (example 2) and Lianh Winn (example 3).

4
Example 1

5
Example 2
6
Example 3
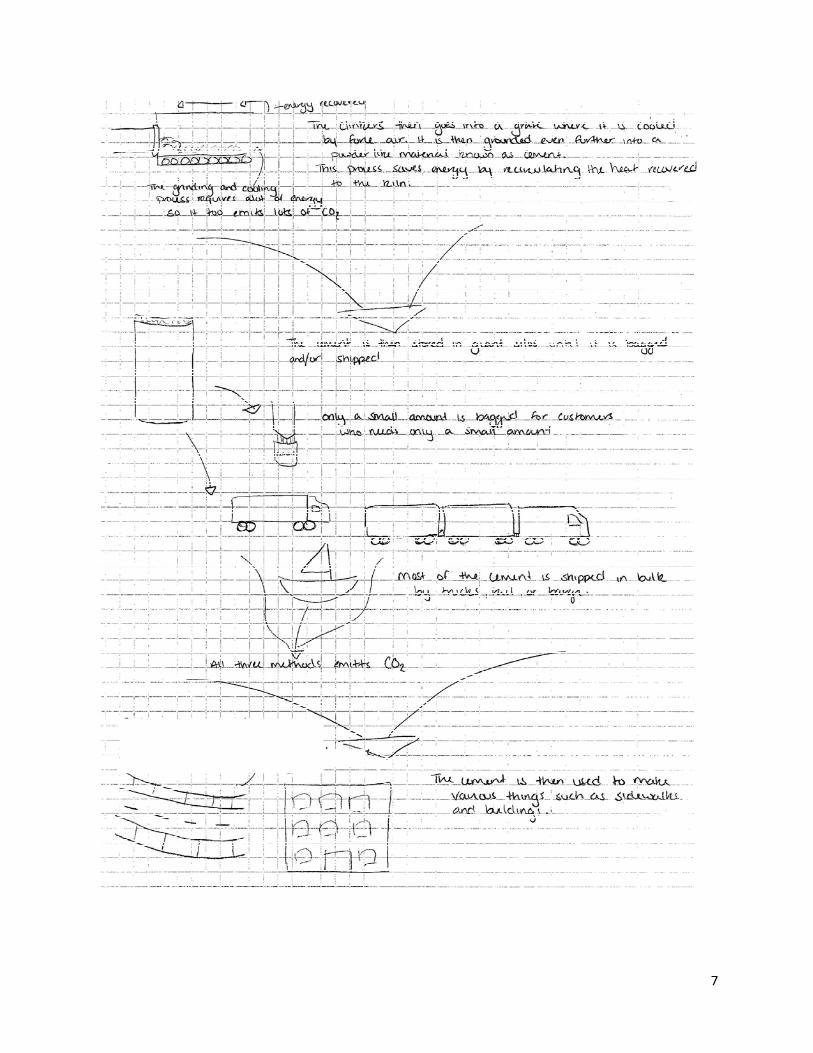
7
8
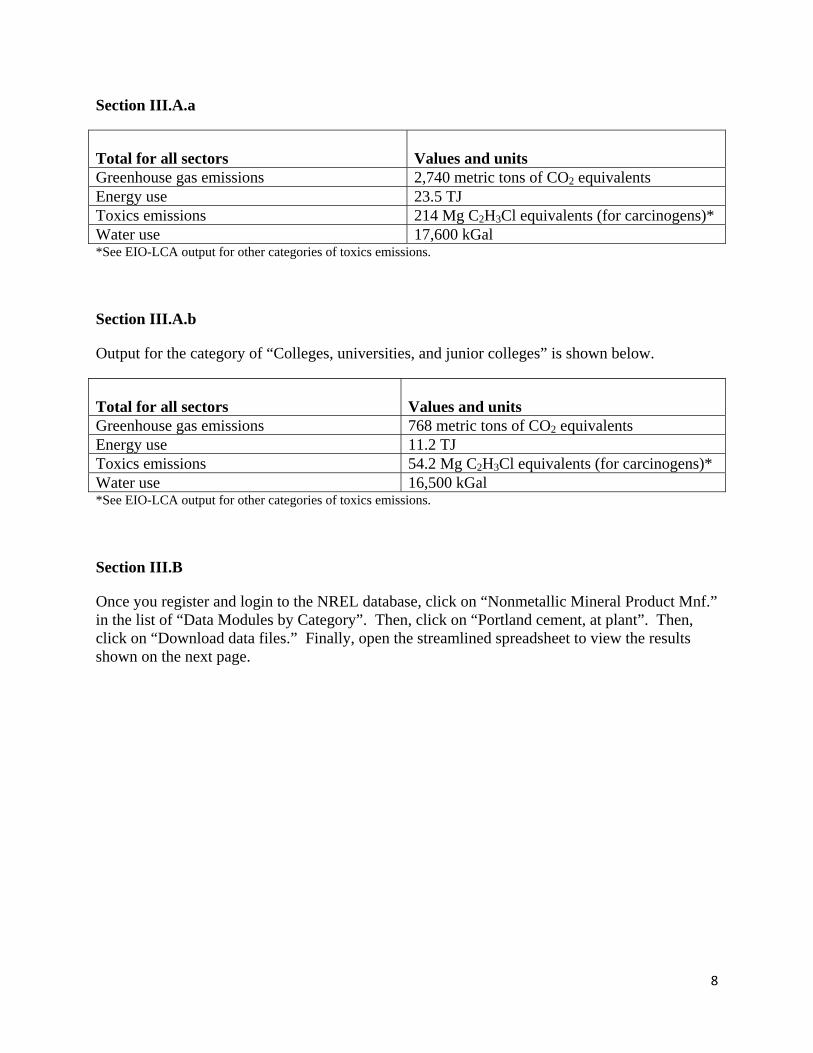
Section III.A.a
Total for all sectors
Values and units
Greenhouse gas emissions 2,740 metric tons of CO2 equivalents Energy use 23.5 TJ Toxics emissions 214 Mg C2H3Cl equivalents (for carcinogens)* Water use 17,600 kGal *See EIO-LCA output for other categories of toxics emissions.
Section III.A.b
Output for the category of “Colleges, universities, and junior colleges” is shown below.
Total for all sectors
Values and units
Greenhouse gas emissions 768 metric tons of CO2 equivalents Energy use 11.2 TJ Toxics emissions 54.2 Mg C2H3Cl equivalents (for carcinogens)* Water use 16,500 kGal *See EIO-LCA output for other categories of toxics emissions.
Section III.B
Once you register and login to the NREL database, click on “Nonmetallic Mineral Product Mnf.” in the list of “Data Modules by Category”. Then, click on “Portland cement, at plant”. Then, click on “Download data files.” Finally, open the streamlined spreadsheet to view the results shown on the next page.

9
Name Portland cement, at plant(blue shading indicates no
input required) Flow Location Category SubCategory Infrastructure Process Units Quantity uncertainstd
Inputs from Technosphere
Bituminous coal, combusted in industrial boiler US no kg 1.075E-01Gasoline, combusted in equipment US no L 1.330E-04Liquefied petroleum gas, combusted in industrial boiler US no L 1.429E-05Dummy_Middle distillates, combusted in industrial boiler US no m3 1.065E-06Natural gas, combusted in industrial boiler US no m3 5.568E-03Dummy_Petroleum coke, combusted in industrial boiler US no kg 2.234E-02Residual fuel oil, combusted in industrial boiler US no L 4.418E-05Dummy_Waste, miscellaneous, combusted in industrial boiler US no kg 1.483E-03Dummy_Waste, oil, combusted in industrial boiler US no m3 4.872E-07Dummy_Waste, solvents, combusted in industrial boiler US no kg 8.814E-03Dummy_Waste, tire derived, combusted in industrial boiler US no kg 3.370E-03Dummy_Waste, other solid, combusted in industrial boiler US no kg 9.339E-04Electricity, at grid, US US no kWh 1.444E-01
Dummy_Bottom ash, unspecified origin US no kg 1.009E-02Dummy_Fly ash, unspecified origin US no kg 1.346E-02Dummy_Foundry sand, at mine US no kg 3.824E-03Dummy_Slag, at blast furnace US no kg 1.980E-02Dummy_Explosives, at plant US no kg 2.950E-04Dummy_Refractory material, unspecified, at plant US no kg 6.475E-04Dummy_Grinding media, at plant US no kg 1.400E-04Dummy_Grinding aids, at plant US no kg 3.600E-04Dummy_Filter bags, at plant US no kg 1.918E-05Dummy_Oil and grease, at plant US no kg 1.300E-04Dummy_Cement bags, at plant US no kg 6.800E-04Dummy_Chains, at plant US no kg 2.007E-05Dummy_Disposal, cement kiln dust, in residual material landfill US no kg 3.730E-02
Dummy_Recycling, cement kiln dust US no kg 9.650E-03
Inputs from Nature Limestone, in ground resource in ground kg
1.372E+00Shale, in ground resource in ground kg 5.223E-02Clay, unspecified, in ground resource in ground kg 5.969E-02Sand, unspecified, in ground resource in ground kg 4.050E-02Iron ore, in ground resource in ground kg 1.353E-02Slate, in ground resource in ground kg 1.134E-03
Gypsum, in ground resource in ground kg6.146E-02
Raw material, unspecified resource in ground kg 2.642E-02Water, process, unspecified natural origin/kg resource in water kg 8.829E-02Water, unspecified natural origin/kg resource in water kg 7.523E-01
Outputs to Nature Particulates, unspecified air low population density kg 2.350E-03
Particulates, > 2.5 um, and < 10um air low population density kg 2.963E-04
Particulates, < 2.5 um air low population density kg 9.111E-08
Carbon dioxide air low population density kg 3.736E-01
Carbon dioxide, fossil air low population density kg 5.534E-01
Sulfur dioxide air low population density kg 1.662E-03
Nitrogen oxides air low population density kg 2.503E-03
VOC, volatile organic compounds air low population density kg 5.015E-05
Carbon monoxide air low population density kg 1.105E-03
Methane air low population density kg 3.954E-05
Ammonia air low population density kg 4.757E-06
Hydrogen chloride air low population density kg 6.486E-05
Mercury air low population density kg 6.236E-08
Dioxins and furans, measured as 2,3,7,8-tetrachlorodibenzo-p-dioxin air low population
density kg 9.975E-11Suspended solids, unspecified water unspecified kg 2.344E-04Aluminum water unspecified kg 8.598E-07Phenols, unspecified water unspecified kg 2.205E-08Oils, unspecified water unspecified kg 7.518E-06Nitrate compounds water unspecified kg 5.897E-06DOC, Dissolved Organic Carbon water unspecified kg 1.378E-05Chloride water unspecified kg 7.275E-04Sulfate water unspecified kg 6.156E-04Sulfide water unspecified kg 6.614E-08Ammonium, ion water unspecified kg 9.480E-07Phosphorus water unspecified kg 5.512E-09Zinc water unspecified kg 3.307E-08
Product / co-product outputs Portland cement, at plant US kg 1.000E+00
10
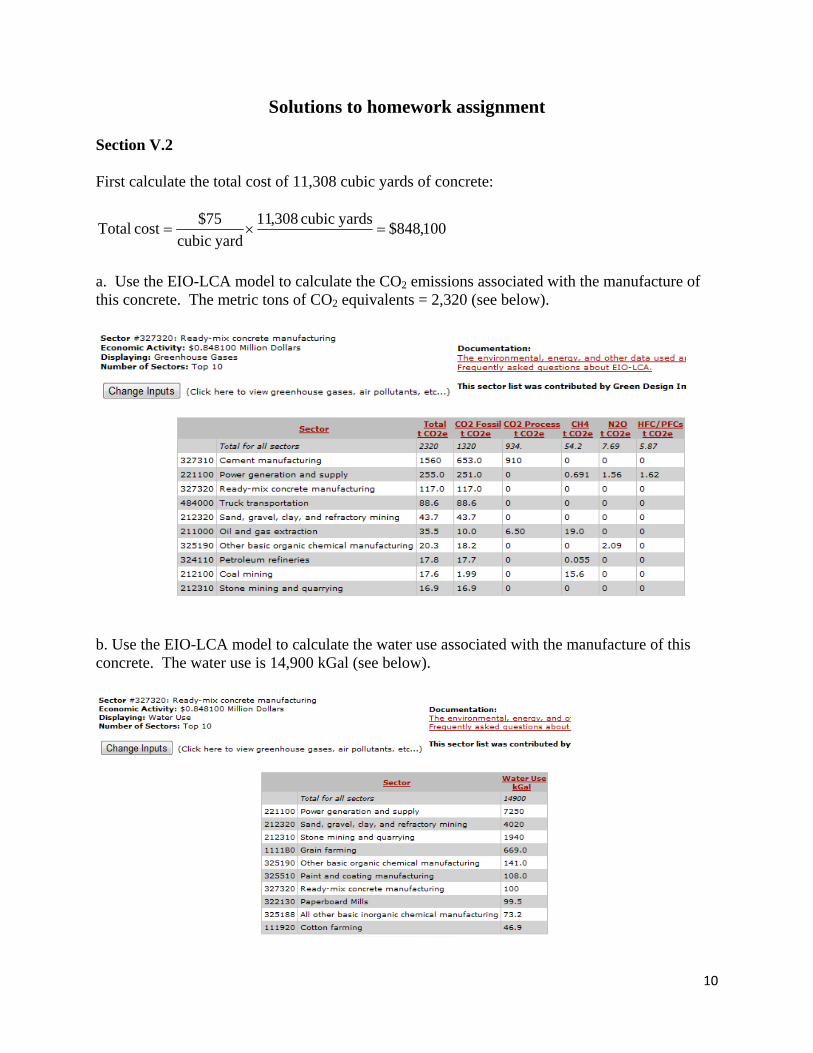
Solutions to homework assignment Section V.2 First calculate the total cost of 11,308 cubic yards of concrete:
100,848$yards cubic 830,11yard cubic
75$cost Total =×=
a. Use the EIO-LCA model to calculate the CO2 emissions associated with the manufacture of this concrete. The metric tons of CO2 equivalents = 2,320 (see below).
b. Use the EIO-LCA model to calculate the water use associated with the manufacture of this concrete. The water use is 14,900 kGal (see below).

11
c. Use the EIO-LCA model to calculate the energy use associated with the manufacture of this concrete. The energy use is 19.9 TJ (see below).
d. Electricity use for the two new buildings are not yet posted on the Physical Plant website. To solve this problem, assume that the electricity use for a similar building (Carson Engineering Center) is equal to the electricity use in Devon Energy Hall and the Engineering Practice Facility: The total electricity use for Carson Engineering Center for 2009 was 1,277,000 kWh. Assume that the total electricity use for both Devon Energy Hall and the Engineering Practice Facility equals about twice this value, or 2,554,000 kWh. The cost of electricity is estimated at 9.91 cents/kWh (US total for all sectors, 2010 data.) Then, the total cost of electricity used in the two buildings is equal to:
40.101,253$ 2,554,000cents .919cost Total =×=kWh
kWh
Next, we estimate the environmental impacts associated with this electricity generation using the EIO-LCA model. d. The CO2 emissions associated with generation of this electricity is equal to 2,370 metric tons of CO2 equivalents (see below).

12
e. The water use associated with generation of this electricity is equal to 63,700 kGal (see below).

13
f. The energy use associated with generation of this electricity is equal to 28.2 TJ (see below).
The data for V.2.a-f are summarized in the table below.
Activity Environmental impact
Manufacture of the concrete required to construct the two buildings
Annual electricity use in the two buildings
Emissions of CO2 equivalents in metric tons
2,320 2,370
Water use in kGal 14,900 63,700 Energy use in TJ 19.9 28.2 These data show that, over the lifetime of the buildings (at least 50 years), the adverse environmental impacts associated with generating the electricity used in the two buildings will dwarf any adverse environmental impacts associated with manufacturing the concrete needed to construct the buildings. Efforts to reduce adverse environmental effects should therefore focus on conservation and use of energy efficient lighting and other devices.