Embed Size (px)
Citation preview
WIK-Consult Report
Study for TalkTalk
Estimating the cost of GEA:
2013 restatement and 2014 update
WIK-Consult GmbH
Rhöndorfer Str. 68
53604 Bad Honnef
Germany
Bad Honnef, 13 August 2014


GEA Cost Analysis I
Contents
1 Introduction 1
2 Restated 2013 cost estimation 2
2.1 Inclusion of backhaul costs 2
2.2 Amendments to roll-out patterns 3
2.3 Summary of revisions to 2013 cost estimation 4
3 Updates to penetration 4
3.1 Developments in SFBB take-up 5
3.2 Developments in market shares 8
3.3 Updates on NGA deployments 9
3.3.1 Implications of coverage data for overlap 10
3.4 Estimates of GEA take-up 11
4 Other 2014 changes – WACC 12
5 Cross-checks against reported investment 13
6 Updated cost estimate 2014 and sensitivities 14
6.1 Key parameters 14
6.2 Updated base case and sensitivities for 2014 14
6.2.1 Standalone sensitivities on penetration 14
6.2.2 Other sensitivities 15


GEA Cost Analysis 1
1 Introduction
In the context of Ofcom’s 2012/13 review of the Wholesale Local Access market1,
TalkTalk asked WIK-Consult to prepare a model to estimate the cost of Generic Ether-
net Access (GEA) in the UK. The WIK model was finalised in March 2013 and the asso-
ciated summary was made publicly available2.
For the purpose of the estimation, WIK constructed a bottom-up cost model based on
the costs of a representative Main Distribution Frame (MDF), ie an MDF with an ‘aver-
age’ number of lines and street cabinets as might be applicable to BT’s commercial roll-
out of FTTx. The model runs over a timeframe of 60 years, within which depreciated
assets are continuously renewed. Lifetimes of 40 years for ducts, 20 years for fibre ca-
ble and cabinets and 8 years for active electronics were considered in the base case.
Monthly cost estimates were derived using economic depreciation, whereby high up-
front investments are recovered over time, based on expectations about future uptake
of the service. Uptake projections were based on a detailed forecast to 2020. The
Weighted Average Cost of Capital (WACC) in the base case was the applicable Open-
reach WACC of 8.8%3 with a 2% added risk-adjustment4 for FTTx-related assets, ex-
cluding ducts5. The result of this model was an estimated monthly cost for GEA of £4.39
in 2013.
Following the publication by Ofcom in June 2014 of a consultation on its approach to
the VULA margin6, TalkTalk asked WIK-Consult to update the model. The main chang-
es consist of:
A revision to the original 2013 model to reflect our current understanding of the
GEA product, and BT’s FTTC historic roll-out patterns. This results in a restat-
ed cost estimation for the 2013 base case.
An update to the forecasted take-up of GEA based on recent (FY 2013/14) da-
ta about the take-up of superfast broadband (SFBB) in general, and on BT
Openreach’s platform. The updated GEA take-up forecast results in an updat-
ed cost estimation for GEA from 2014 onwards.
1 Ofcom Review of the wholesale local access market – consultation published 2013
http://stakeholders.ofcom.org.uk/consultations/fixed-access-market-reviews/ 2 WIK-Consult summary report for Talk Talk: Estimating the cost of GEA
http://stakeholders.ofcom.org.uk/binaries/consultations/fixed-access-markets/responses/TalkTalk_Group_second_addit1.pdf
3 Ofcom’s estimation of the pre-tax nominal WACC for BT’s access business Openreach as determined
in Ofcom’s 2012 charge control review for LLU and WLR see p. 129 in OFCOM (2012) Charge control review for LLU and WLR services Annexes http://stakeholders.ofcom.org.uk/binaries/consultations/wlr-cc-2011/statement/annexesMarch12.pdf
4 Risk adjustment based on benchmarks see WIK (2013) Estimating the Cost of GEA 5 The approach taken of using an Openreach WACC with risk-adjustment for FTTx-specific assets was
considered to allow a differentiation between assets constructed for the specific purpose of FTTx and those which might also be usable for other purposes
6 Ofcom fixed access market reviews: approach to the VULA margin
http://stakeholders.ofcom.org.uk/consultations/VULA-margin/

2 GEA Cost Analysis
We conduct a number of sensitivities on the updated cost estimation. These include
assessing the effect on costs of different take-up and deployment patterns for SFBB on
the BT Openreach platform, greater duct reutilisation, a different approach to WACC
and shorter lifetimes for equipment specific to the VDSL deployment, in case a faster
migration to FTTP occurs.
We cross-check the results with publicly available information concerning BT’s fibre
investments.
2 Restated 2013 cost estimation
A number of amendments have been made to the original model and its parameters to
reflect our current understanding of the GEA product and BT Openreach’s FTTC/VDSL
deployment patterns.
2.1 Inclusion of backhaul costs
In the 2013 estimation, it was assumed that handover was available at all MDF sites
where GEA was available. In practice, as of July 2014, we understand from information
provided by TalkTalk that BT had 1,633 handover links to serve 2,488 GEA-enabled
MDF sites. On this basis, we have included backhaul costs in proportion to the 44% of
MDF sites where handover is presumed not to be available. The Openreach Ethernet
Backhaul Direct wholesale product price7 has been used as a proxy for the base case
resulting in an additional connection cost of £12,250 and annual rental of £15,6008 per
backhaul circuit.
To facilitate backhaul integration into the model, Ethernet switch investment has been
changed from a location (MDF-site)-based investment to a per-DSLAM switch cost. This
avoids the need to distinguish in the model between different types of MDF site (that is,
with and without GEA handover) for the dimensioning of Ethernet switches. This meth-
odological change has a neutral effect on investment requirements.
Other changes associated with backhaul integration which broadly result in lower in-
vestment requirements are:
Ethernet network sided ports for hand-over are now required only at MDF sites
with a handover. This results in lower investment than previously assumed.
7 See BT EBD price list 10Gbps UK excluding FlexZone
http://www.openreach.co.uk/orpg/home/products/pricing/loadProductPriceDetails.do?data=F6GFzqfhDSmh7Oyv8Xw%2Bt6ZkEknUEHFW9O1w%2FCiItaVZ6rNZujnCs99NbIKJZPD9hXYmiijxH6wrCQm97GZMyQ%3D%3D
8 Band A
GEA Cost Analysis 3
Co-location costs (for which MCU costs9 are used as a proxy) are now only ap-
plicable at hand-over sites. In order to reflect potential additional power require-
ments due to the increased size and/ or number of Ethernet switches at the
sites, we doubled the energy costs as a proxy. This may be an over-estimation.
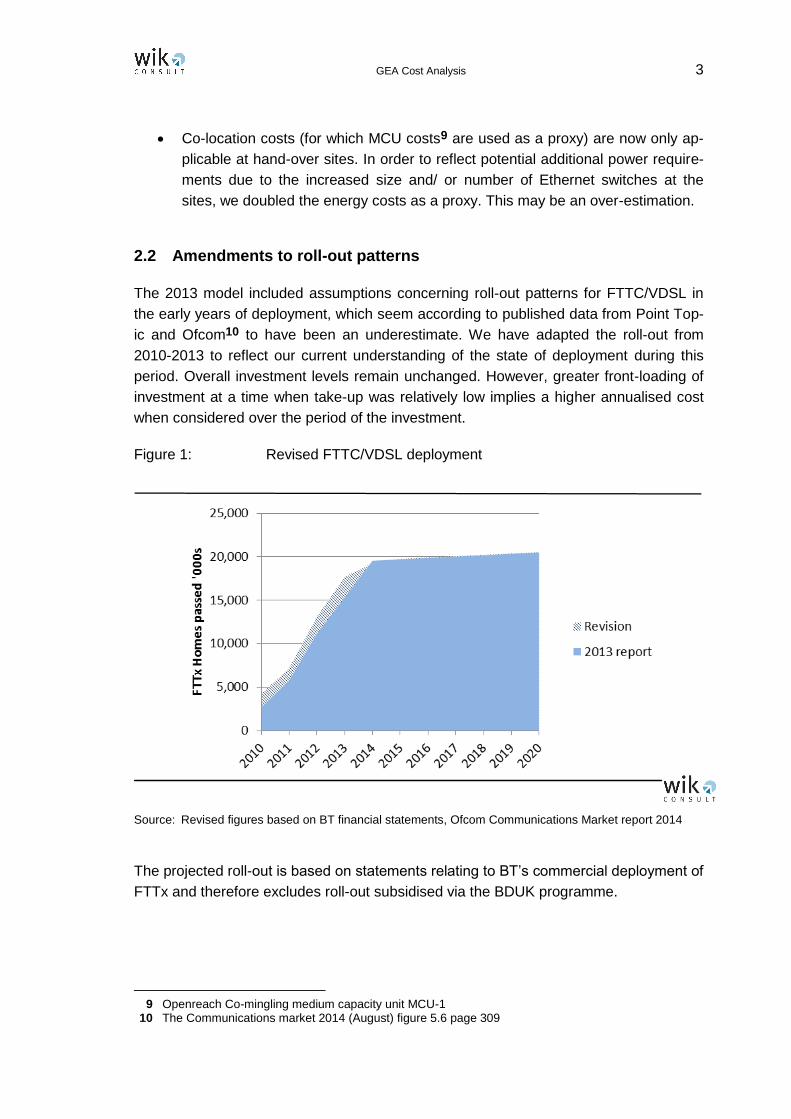
2.2 Amendments to roll-out patterns
The 2013 model included assumptions concerning roll-out patterns for FTTC/VDSL in
the early years of deployment, which seem according to published data from Point Top-
ic and Ofcom10 to have been an underestimate. We have adapted the roll-out from
2010-2013 to reflect our current understanding of the state of deployment during this
period. Overall investment levels remain unchanged. However, greater front-loading of
investment at a time when take-up was relatively low implies a higher annualised cost
when considered over the period of the investment.
Figure 1: Revised FTTC/VDSL deployment
Source: Revised figures based on BT financial statements, Ofcom Communications Market report 2014
The projected roll-out is based on statements relating to BT’s commercial deployment of
FTTx and therefore excludes roll-out subsidised via the BDUK programme.
9 Openreach Co-mingling medium capacity unit MCU-1 10 The Communications market 2014 (August) figure 5.6 page 309

4 GEA Cost Analysis
2.3 Summary of revisions to 2013 cost estimation
The cumulative effects of changes to the roll-out pattern and the addition of backhaul
costs result in a restated 2013 base case of £4.60 (see Table 1).
Table 1: Restated 2013 base case – summary of effects
Description of
changes 2013 Cost estimate
2014 cost es-timate
Effect of change compared with 2013 original
estimation
Base case 2013 £4.39 £4.31
Backhaul
Backhaul costs added for 44% served MDF sites based on EBD Type A 10Gbit/s
£4.49 £4.41 +0.10
Roll-out Faster deployment in 2010-2012
£4.50 £4.42 +0.11
Revised base case
£4.60 £4.52 +0.21
Source: WIK cost estimate
3 Updates to penetration
Cost models for emerging services in which high upfront investments are spread using
‘economic depreciation’ are particularly sensitive to assumptions around uptake. For
this reason, in our 2013 model, we prepared a detailed forecast of the evolution of
SFBB. Forward forecasts were based on past experience of the degree to which stand-
ard broadband customers had converted to SFBB on both the cable and Openreach
platforms, and were cross-checked with international experience on conversion rates.
In this updated report, we have revised our SFBB forecast to take account of reported
developments since March 2013 in deployment and take-up. These are based on fig-
ures reported in Virgin Media and BT Investor Relations statements and press releases,
as well as Ofcom’s annual market reports.
We continue to make projections on the basis of the commercially funded deployment
by BT. In doing so, we have deducted deployments funded with the support of the
Broadband Development UK (BDUK) programme11, and made proportionate adjust-
11 Figures on subsidised deployment are based on the May 2014 DCMS “Broadband Performance Ind i-
cator” which includes developments up to March 2014.

GEA Cost Analysis 5
ments to the take-up figures on the BTOR platform12. As the scope of publicly funded
roll-out increases from 2014 onwards, distinguishing commercial from subsidised roll-
out may become increasingly challenging.
3.1 Developments in SFBB take-up
Data on SFBB take-up subsequent to March 2013 indicate that our previous estimates
for SFBB penetration in the original model were conservative (see Figure 2). After re-
ducing take-up on the GEA platform to account for a proportion of customers which may
have been served by subsidised infrastructure, BT Openreach achieved take-up of
2.3m on the GEA platform at the end of the 2013 calendar year, compared with our pro-
jections of 2.2m. Take-up on the Virgin Media cable platform was 3.2m against our pro-
jections of 2.7m. This represented around 70% of VM’s customer base. Although SFBB
take-up on the cable platform is not relevant for penetration on GEA, it signals the will-
ingness of customers to take higher-speed broadband and SFBB’s status as the mod-
ern ‘norm’ for broadband, as opposed to being an emerging product. Overall, actual
take-up of SFBB at end 2013 was 5.6m subscribers compared with our projection of
5m.
Available data for the 2014 calendar year suggests that take-up continues to outstrip
our previous projections. As of June 2014, data from BT and Virgin Media investor re-
ports (adjusted to exclude subscribers in subsidised regions) shows that there were
approximately 6.5m commercial SFBB retail connections13, only 200,000 less than the
previously projected customer-base for the full year to end 2014. An adjusted 2.9m of
these connections were on the BT Openreach platform of which 2.2 were BT Retail. If
these growth-rates continued, and if alongside the conversion of BT Retail customers
there was also an increased conversion for other operators on the BTOR platform, there
would be 7.4m commercial SFBB subscribers by the end of 2014, around 700,000 more
than initial projections.
12 In order to discount subscribers which may be subscribing on a subsidised platform, we divide the
total number of subscribers by the ratio of commercial to total FTTx lines. The commercial deployment is estimated by subtracting BDUK subsidised deployment as reported by DCMS in May 2014 from the BT stated figures concerning total deployment.
13 Figures derived from VM Q2 2014 and BT Q1 2014/15 investor statements. VM figures based on
previous ‘superfast’ definition of 30Mbit/s

6 GEA Cost Analysis
Figure 2: SFBB take-up: actual vs projected
Source: projections from WIK March 2013 ‘Estimating the cost of GEA’, actuals from BT, VM financial statements
The enhanced uptake of SFBB in 2013 and 2014, could indicate that it may be reason-
able in a base case to assume a higher ultimate conversion rate from standard broad-
band to SFBB in the model up to 2020. Consequently, we have modelled a new base
case which assumes that 75% of BT Retail broadband customers will subscribe to
SFBB by 2020 rather than 65% as previously. On the assumption that there is a level
playing field for the provision of SFBB and that the customer attributes of competitors
are similar to those of BT retail, we have projected a process whereby other players
catch up to achieve 75% uptake of SFBB amongst their broadband customers by 2020.
The revised penetration forecast results in an estimated 7.3m commercial SFBB cus-
tomers by end 201414 and 14.7m by end 2020 compared with the previously forecast
13.3m
A new ‘high’ scenario is shown for 85% conversion by 2020, while the original base
case of 65% remains as a more conservative estimate.
14 This approximates the 7.4m customers based on extrapolations of the June 2014 figures

GEA Cost Analysis 7
Figure 3: SFBB take-up revised forecast
Source: BT, VM investor statements, WIK forecasts from Dec 2014
It is conceivable that average customers of non-BT Retail operators on the Openreach
platform may be more price sensitive than those of BT. To assess the impact of this
scenario, we also show the implications if only 65% of non BT-Retail broadband cus-
tomers subscribe to SFBB compared with 85% of BT Retail customers by 2020 (see
Figure 4).
Projections around Virgin Media customer conversion to SFBB remain unchanged with
an expectation of full conversion by the end of 2016.

8 GEA Cost Analysis
Figure 4: Conversion rates from standard to superfast broadband – historic
and projections for scenario where competitors’ customers are
more price sensitive than BT retail
Source: VM, BT financial statements, WIK projections from 2014
3.2 Developments in market shares
As with the original 2013 model, the penetration forecast implicitly assumes that the
market shares of operators active in broadband service provision (combining standard
and SFBB) will be stable15. This assumption is needed in order to avoid cost estima-
tions being affected by any impact of current pricing on competition. Recent data shows
that in practice, for broadband lines taken together, market shares have been relatively
stable, although BT Retail has gradually increased its share by around 1% per annum.
The distribution of market shares for SFBB however differs from that of broadband as a
whole with a stronger position for BT Retail and Virgin Media relative to the wider mar-
ket (see Figure 5). Although there has been an increase in the share of non BT Retail
operators on the Openreach platform, thus far the catch-up has been less than our ex-
pectations from the original model. After adjusting for customers on subsidised net-
works, as of December 2013 BT Retail had around 1.9m SFBB customers (around 28%
of its total broadband customers), compared with around 0.5 SFBB customers for oth-
ers on the Openreach platform (around 4% of broadband customers of these opera-
tors). BT Retail acquired around 0.3m more customers than in the model projections,
while others on the Openreach platform acquired 0.2m fewer customers than anticipat-
ed.
15 There is an assumption of stable market shares for BT Retail in comparison with VM and other (non-
specific) alternative operators on the BTOR platform taken as a whole.

GEA Cost Analysis 9
Figure 5: Share of SFBB subscriptions end 2013
Source: VM, BT financial statements
The updated model continues to assume a catch-up by non-BT operators in the share
of SFBB customers, such that in the base case, they increase from a low base to reflect
existing broadband market share distributions, or slightly lower market shares for SFBB
than those applicable to broadband as a whole in a scenario where access-based cus-
tomers are more price sensitive than those of BT.
3.3 Updates on NGA deployments
We have updated the coverage data for Virgin Media’s Docsis 3.0 and BT’s FTTx roll-
out to reflect statements made by the companies in investor reports, after subtracting
coverage subsidised by BDUK16.
In an investor presentation covering Q3 2013/201417, BT reported that more than 18m
households had been served with FTTx at this stage, of which at least 17.75m is likely
to have been commercial. Meanwhile, in a May 2014 financial statement18, BT reported
that 19m households had been passed as of March 2014, of which around 18.5m is
estimated to have been commercial. BT’s Q1 2014/2015 financial reports suggest that
20m households had been covered as of end June 2014, although the proportion of
served households subsidised by BDUK and other sources in this period is unknown at
this time.
16 See DCMS May 2014 report 17 31 January 2014 Slide 18 BT Group plc Q3 2013/14 results presentation 18 8 May 2014 BT Group Results for the fourth quarter and year to 31 March 2014

10 GEA Cost Analysis
A January 2014 press statement by BT19 indicates that it plans to extend the scope of
its commercial roll-out to an additional 400,000 premises over 3 years. After adjusting
for the subsidised roll-out and planned additional roll-out beyond the originally envis-
aged 19m20, we project a commercially funded coverage of around 19.1m homes by
the end of December 2014, with slight increases in the years to come, stabilising at
70% of total UK households. This remains broadly consistent with our updated assump-
tions as reflected in the revised 2013 base case (see Figure 1).21
We have also updated the estimate of overall NGA coverage (all technologies) to reflect
an updated coverage report prepared by Point Topic for the European Commission22
and data from Ofcom23.
3.3.1 Implications of coverage data for overlap
In the March 2013 penetration forecast, we noted that the pattern of BT deployment had
overlapped rather less with the pre-existing cable Docsis 3.0 deployment than might
have been expected. In our base case, we took the conservative assumption that the
pattern would change such that the vast majority of BT’s commercial deployment would
ultimately overlap cable deployment, in order to main competitive provision in these
areas.
Data released by Point Topic subsequent to our initial model24 which suggests that
overall NGA coverage for the UK reached 70% at the end of 2012 suggests that the
pattern of BT’s deployment continued to fall to a significant degree outside cable areas
at that time, and to a greater extent than we had estimated. Ofcom’s coverage estimate
of 73% for June 201325, also suggests that a proportion of BT coverage continued to
fall outside cabled areas.
However, BT’s January 2014 press statement suggests that the additional FTTx instal-
lation to 400,000 households would be focused in cities (where presumably cable is
more likely to be present). For this reason, as a base scenario we would tend to favour
the continued use of a conservative assumption that overlap will continue to increase
until the majority of the cable area is passed by commercially funded FTTx.
19 BT press statement 24 January 2014
http://www.btplc.com/news/articles/showarticle.cfm?articleid=%7Ba9f34acc-532e-4278-8dbe-e4807626d1ed%7D
20 BT press release DC13-027, February 12th
2013.
http://www.btplc.com/News/Articles/Showarticle.cfm?ArticleID=23F28D29-F8B5-4EC0-A3F8-04C1FEA340F1
21 Subsequent coverage extension after reaching the target coverage rate is due to household growth
assumptions. 22 Data drawn from Point Topic (2013) broadband coverage in Europe in 2012 – country results 23 The Communications Market 2013 (August) http://stakeholders.ofcom.org.uk/market-data-
research/market-data/communications-market-reports/cmr13/?a=0 24 Point Topic (2013) 25 Page 320 Ofcom Communications Market 2013
http://stakeholders.ofcom.org.uk/binaries/research/cmr/cmr13/UK_5.pdf

GEA Cost Analysis 11
It should be noted that assumptions on the area of coverage have significant implica-
tions for the model output. If BT continued its present, more dispersed, pattern of de-
ployment, the take-up of GEA would be higher (because its addressable market in non-
cabled areas approaches 100%), and monthly costs would therefore be lower. This
scenario is presented as a sensitivity.
3.4 Estimates of GEA take-up
The updates to the roll-out and penetration forecast for retail SFBB serve to provide two
important inputs to the cost model. Changes to FTTx deployment assumptions affect
the timing and scale of investments within the cost model, while take-up of retail SFBB
on the Openreach platform (which is linked to the conversion rates from standard
broadband of BT Retail and access-based competitors) serves to inform the take-up of
the wholesale input for these services - GEA. The derived penetration of GEA as a pro-
portion of households served with FTTx, which is used in the model is shown in Figure
6)
Figure 6: Penetration in the cost model
Source: actuals to 2014, thereafter output from WIK penetration forecast model
GEA penetration estimates based on detailed forecasts extend to 2020. In the base
case, there is a further assumption of a gradual increase of take-up in GEA of 1% per
year until 2030, after which no further increases are assumed. We have modelled a
sensitivity (labelled ‘longer growth’) in which gradual increases continue for a further 10
years until 2040. Other sensitivities shown include:

12 GEA Cost Analysis
No overlap: BT continues to roll-out beyond cabled areas rather than prioritising
on completing coverage in cabled areas
Price sensitive: entrant customers are more price sensitive than those of BT Re-
tail, and therefore the conversion rates of these customers from standard to su-
per-fast broadband reaches 65% by 2020 compared with 85% of BT Retail’s
customers.
4 Other 2014 changes – WACC
The base case for the updated 2014 GEA cost estimate uses the same approach to-
wards WACC as the original model i.e. the Openreach WACC is used with a 2% risk
premium for NGA-specific assets. In the 2014 Ofcom Fixed Access Market Review draft
Statement Ofcom estimates that the Openreach WACC is 8.6%26. This WACC with
added risk adjustment is therefore used in the 2014 update. This results in a slight re-
duction in costs compared with the previously estimated 2013 WACC.
We also include a sensitivity where the Rest of BT (RoBT) WACC of 10.8% is used
without a risk adjustment27. This would result in an increase in costs which is mainly
explained by the application of a higher WACC to ducts associated with FTTx deploy-
ment.
Table 2: Summary of WACC estimates used in GEA cost estimate and sensi-
tivities
Openreach WACC Rest of BT WACC
2013 Ofcom BCMR Statement 8.8% 9.9%
2014 Ofcom draft FAMR State-ment
8.6% 10.8%
Relevance to WIK GEA cost estimate
Base case + 2% risk premium for fibre and FTTx-specific active equipment
Sensitivity on base case without risk premium
26 See Table A7.32 page 178 – Estimate of BT WACC, 2014 FAMR Statement
http://stakeholders.ofcom.org.uk/binaries/consultations/review-wba-markets/statement/wba-draft-statement_Annexes.pdf
27 The RoBT WACC is assumed in this context to reflect applicable risks for the relevant products

GEA Cost Analysis 13
5 Cross-checks against reported investment
Our cost estimate for GEA is based on a bottom-up model which is based on an aver-
aged approximation of the actual network topology for FTTC/VDSL (scorched node ap-
proach). It is useful in sanity-checking the results of such an approach, to cross-check
the aggregate investment levels indicated by the model with those reported by BT.
In 2008, BT announced a £1.5bln programme to deploy SFBB to 10 million homes by
201228, and BT reported in 2010 that it would investment an additional £1bln in fibre
roll-out to reach two thirds of UK premises by 201529. On 24 January 2014, BT reported
that it would invest a further £50m to make SFBB available to an additional 400,000
premises30. BT continues in press statements to report that its total commercial invest-
ment in FTTx is around £2.5bln. These investment levels are consistent with the in-
vestment modelled in the GEA cost estimate, which in the base case for 2014 stands at
£2.3bln. This gives some comfort that the estimate – at least as far as network deploy-
ment costs are concerned – is reasonable.
A cross-check with capex levels for Openreach reported in BT financial statements do
not show significant variations over the period in which the FTTx investments occurred,
compared with previous periods, although Openreach capex in FY2011/2012, a year in
which there was substantial FTTx deployment was some £60m over previous years. We
noted in the 2013 summary report that one possible explanation might be that FTTx
investment replaced investment in other activities or may have included some invest-
ments such as duct renewals that may have occurred irrespective of FTTx. A further
potential explanation could be the possible inclusion of retail investments or network
operating costs within BT’s stated £2.5bln fibre spend.
With available public data, it is not possible to gauge the actual investment level specifi-
cally related to FTTx and associated inputs with any degree of certainty. In order to as-
sess the impact of a scenario in which the FTTx-specific investments were below
£2.5bln, we include a sensitivity in which there is a reduced requirement for new duct
construction relating to FTTx such that duct reuse increases from the base case of 70%
to 80%. The reduced investment results in significantly lower monthly costs than in the
base case.
28 http://www.btplc.com/News/ResultsPDF/q108release.pdf 29 http://www.btplc.com/News/ResultsPDF/q410release.pdf 30 http://www.btplc.com/news/articles/showarticle.cfm?articleid=%7Ba9f34acc-532e-4278-8dbe-
e4807626d1ed%7D

14 GEA Cost Analysis
6 Updated cost estimate 2014 and sensitivities
6.1 Key parameters
A summary of the main parameters for the 2014 updated base case compared with the
2013 base case is shown below. As discussed in sections 0 and 4, the most significant
change is an adaptation to the forecast penetration rate to reflect developments in up-
take which exceeded previous forecasts. The WACC has also been marginally de-
creased to reflect Ofcom’s updated estimate for the Openreach WACC as of 2014, to
which an NGA risk premium is added.
Table 3: Comparison of key parameters for 2013 and 2014 base case esti-
mates
Source: Openreach and RoBT WACC derived from Ofcom, risk premium based on benchmarks (see March 2013 summary report)
6.2 Updated base case and sensitivities for 2014
The increased penetration in the base case scenario results in a lower cost estimate for
2013 of £4.11 (compared with the restated £4.60), and for 2014 of £4.04 (compared
with the restated £4.52).
6.2.1 Standalone sensitivities on penetration
Conducting sensitivities on the penetration of GEA shows an estimated range between
£3.80 and £4.50 for 2013 and £3.70 and £4.45 for 2014. Lower penetration estimates of
a maximum 65% conversion to SFBB by 2020, which are similar to the original base
case published in 2013 result in broadly similar outcomes to our original estimate.
Key parameters used Base Case WIK Report 2013 Base Case WIK Report 2014
WACC (nominal) 8.8% 8.6%
WACC increase for NGA assets 2.0% 2.0%
new built ducts eligible for risk premium? no no
penetration in year 10 40% 46%
subscribers in year 10 8,227,366 9,392,506
penetration in year 60 51% 57%
subscribers in year 60 10,422,240 11,787,863
Premises covered 20,510,822 20,510,822
duct reuse share 70% 70%

GEA Cost Analysis 15
Table 4: Estimated monthly cost per line in GBP (base case and penetration
sensitivities)
Source: WIK estimates
As expected, scenarios in which BT pursues a strategy of avoiding rather than overlap-
ping cable and continued growth of uptake beyond 2030 lead to lower average cost. A
scenario in which customers of entrants are more price sensitive than those of BT Con-
sumer increases estimated costs compared to the base case by 9p, due to lower overall
take-up of GEA.
6.2.2 Other sensitivities
The results of other sensitivities on the updated 2014 cost estimate are shown in Table
5, alongside estimated initial investment levels associated with these scenarios. All
three tested scenarios have relatively significant effects.
Table 5: 2014 updated base case – other sensitivities
Source: WIK estimates
The effect of increasing duct re-use from the previously assumed 70% of all ducts to
80% results both in a substantial cost decrease and reduction in initial investment re-
quirements from £2.3bln to £1.9bln.
Use the RoBT WACC of 10.8% for all assets without an additional NGA risk premium
results in a significant increase in monthly costs of 44p, due to the application of this
WACC to ducts (which are excluded from a risk premium in the base scenario).
Finally, we conducted a sensitivity whereby the lifetime of active equipment, previously
set at 8 years is halved. This might be a relevant scenario in circumstances in which
2014 Report Base case 2013 2014Difference to
base case (GB) % difference
4.11 4.04
Stand-alone sensitivities on penetration
Low penetration: 65% BB customers in passed areas on NGA 4.53 4.45 0.41 10%
High penetration: 85% BB customers in passed areas on NGA 3.78 3.71 -0.33 -8%
BT continues to avoid cable rather than overlapping 3.89 3.82 -0.22 -5%
Entrant customers are more price sensitive than those of BT – and therefore fewer convert to SFBB (85% vs 65% conversion rate)4.20 4.13 0.09 2%
Longer growth 4.02 3.95 -0.09 -2%
2014 Report Base case Initial capex £bln 2013 2014Difference to
base case (GB) % difference
2.3 4.11 4.04
Other sensitivities
Duct reuse share increased from 70% to 80% 1.9 3.57 3.50 -0.54 -13%
DSLAM, cabinet, splitter lifetime cut to 50% 2.3 4.71 4.62 0.58 14%
WACC 10.8% and no risk premium 2.3 4.56 4.49 0.44 11%

16 GEA Cost Analysis
upgrades towards FTTP occur sooner than originally envisaged. The initial investment
would thus be depreciated over fewer years. The result would be an increase in monthly
costs of 58p.
Although there is some variation, all scenarios assessed result in estimated monthly
costs of below £5. The relative lack of certainty surrounding uptake and overall lifetime
of the FTTC/VDSL investment continue to make definitive assessments difficult at this
stage. Such uncertainties may however diminish over time.