Embed Size (px)
Citation preview

Estimating statistical significance of exome sequencing data for rare mendelian disorders using population-wide linkage analysis
Cornelis AlbersNHS Blood and Transplant, University of Cambridge &
Wellcome Trust Sanger Institute
Cornelis Albers
• Exome sequencing of a small (4-10) number of affected individuals only is a powerful strategy to detect high penetrance disease mutations, especially for recessive disorders
• Looks for independent mutation events in the unrelated individuals, as opposed to family based analysis where the causative mutation is shared between the affected individuals
Introduction
Cornelis Albers
Approach
• Call sequence variants from whole-exome data
• Filter out previously seen variants or variants above some population allele frequency
• Filter out variants predicted to be non-functional (e.g. intronic variants)
• See if there is a functional unit (a gene) where all affected individuals have at least two unfiltered variants (for a recessive disease).
Cornelis Albers
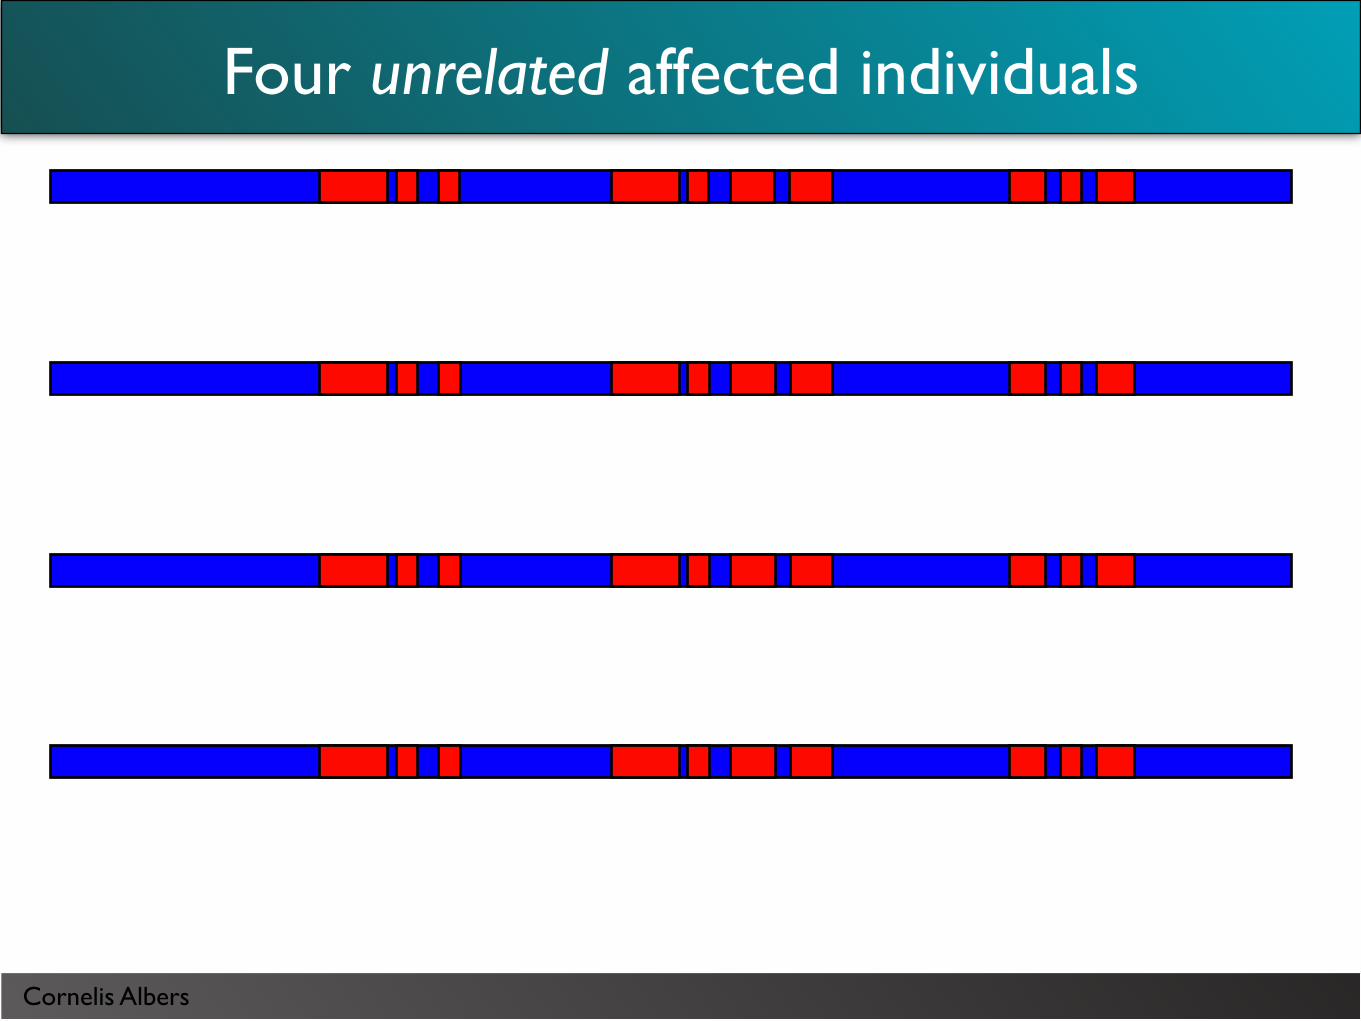
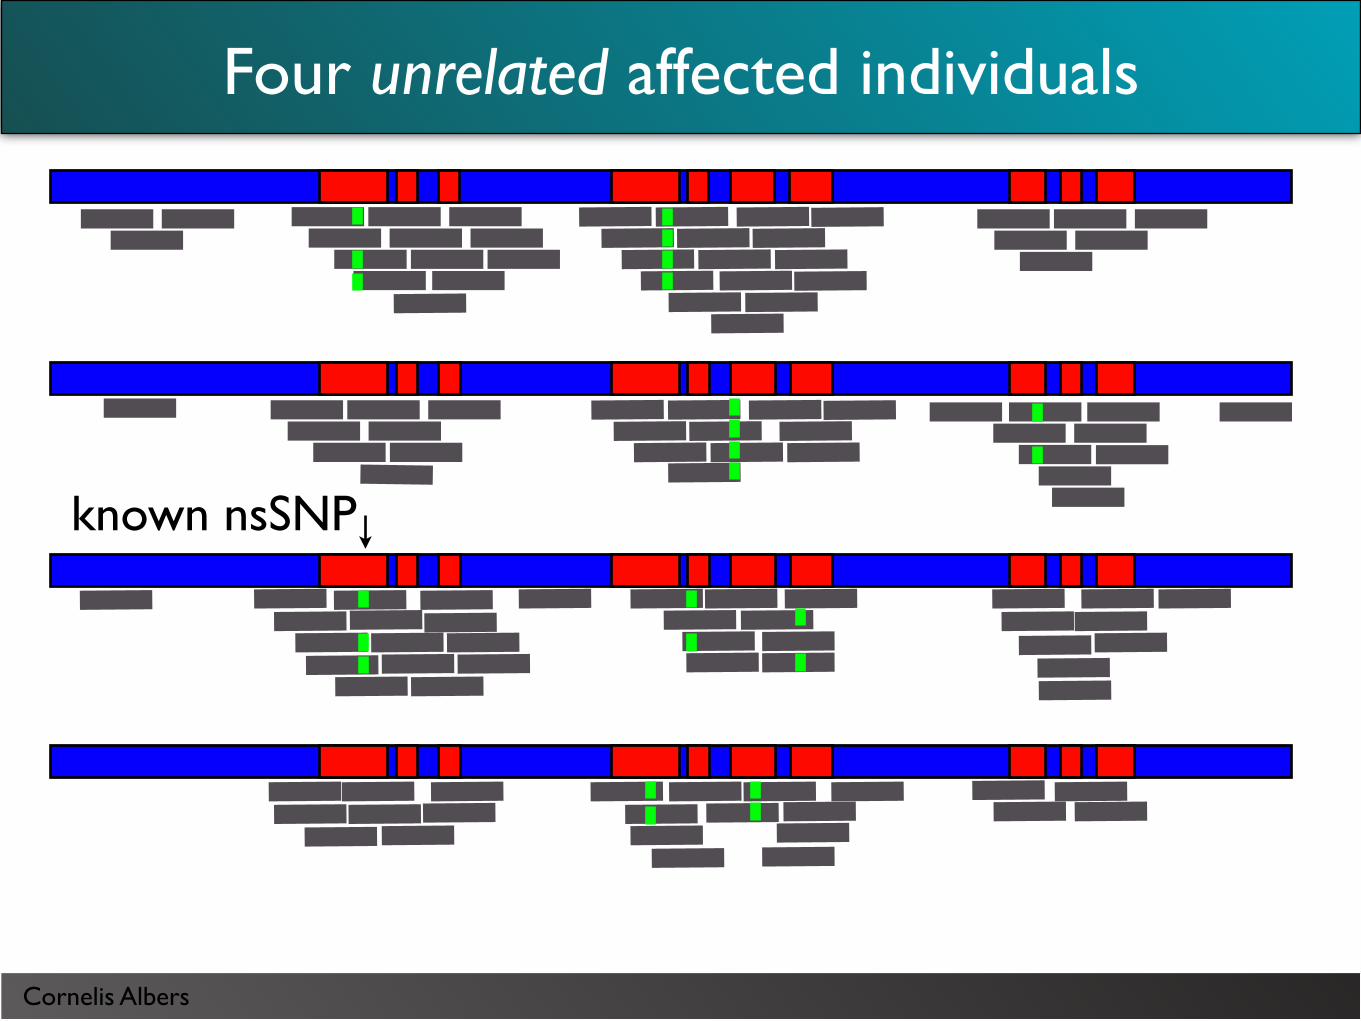
Four unrelated affected individuals

Cornelis Albers
Four unrelated affected individuals
Cornelis Albers
Four unrelated affected individuals
Cornelis Albers
known nsSNP
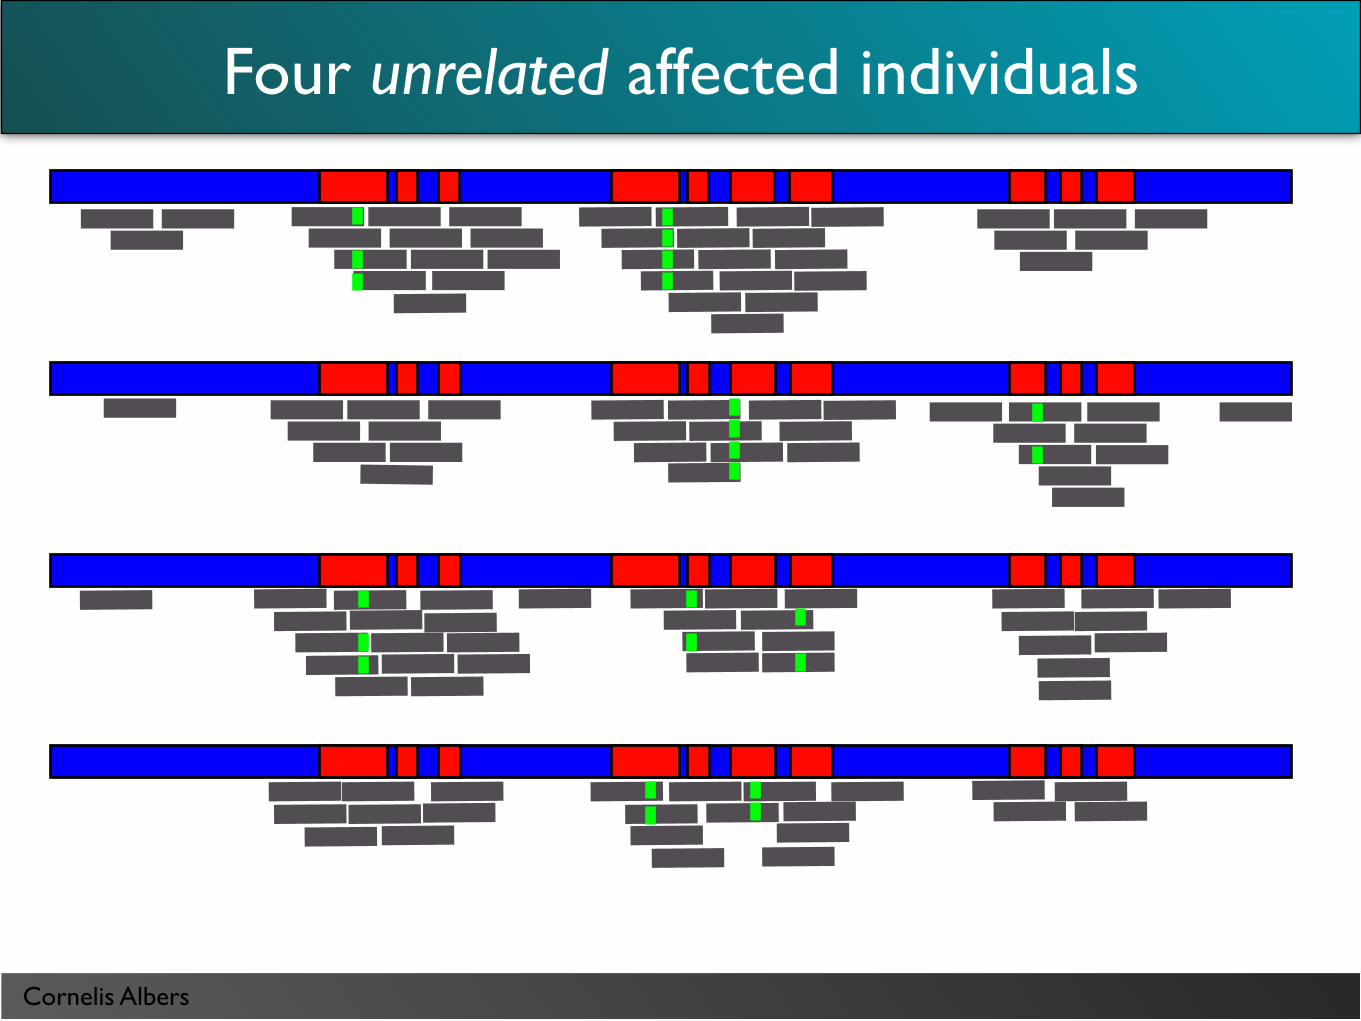
Four unrelated affected individuals

Cornelis Albers
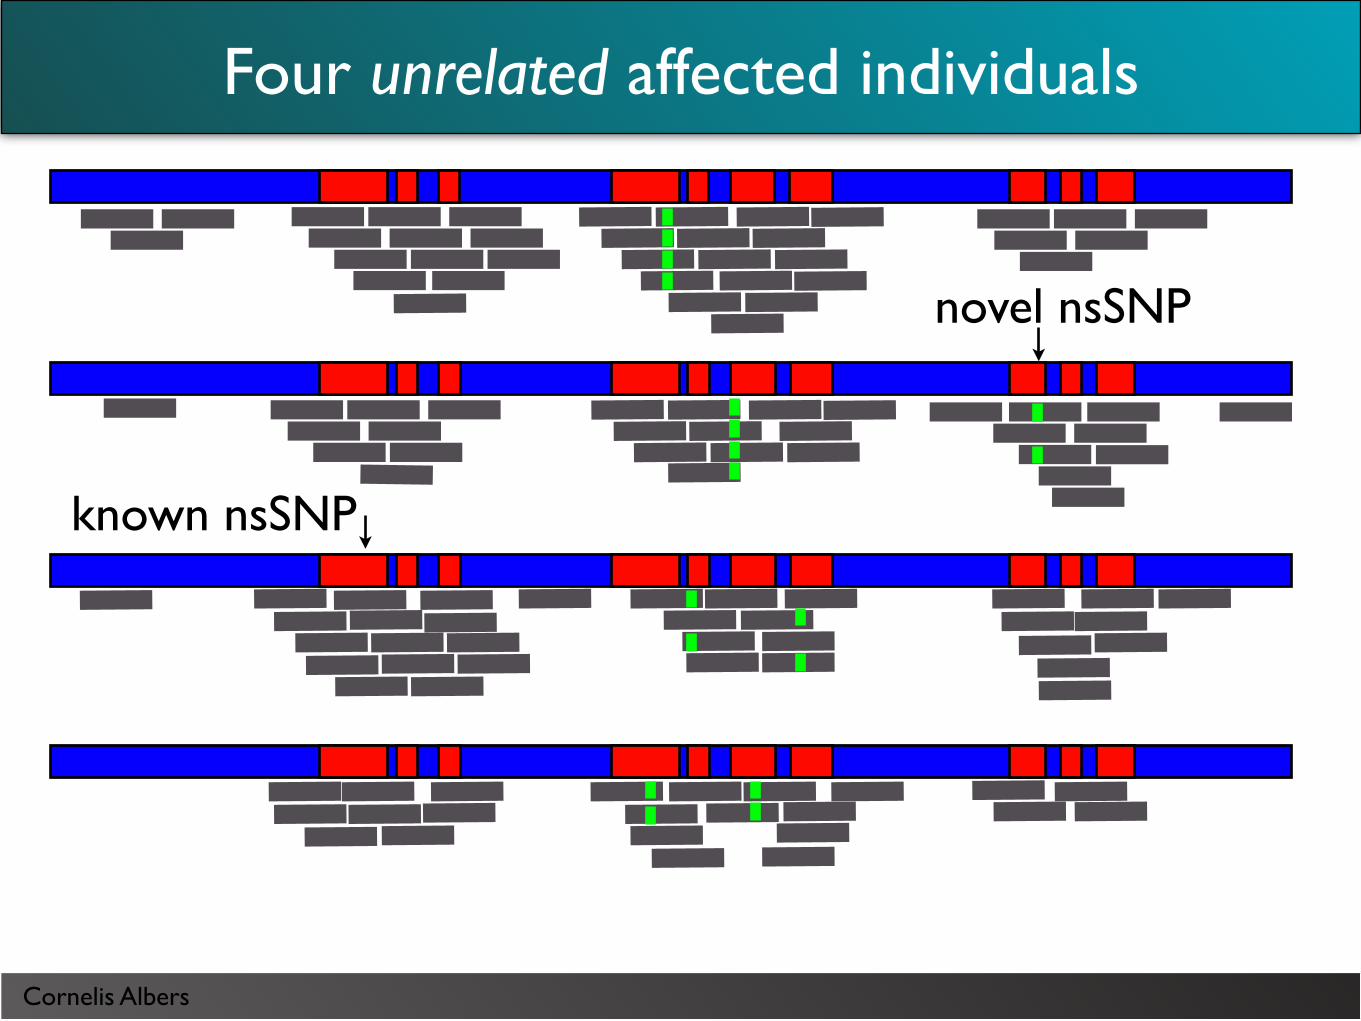
novel nsSNP
known nsSNP
Four unrelated affected individuals
Cornelis Albers
novel nsSNP
known nsSNP
Four unrelated affected individuals

Cornelis Albers
one novel homozygous mutation or two novel heterozygous mutations in the same gene
novel nsSNP
known nsSNP
Four unrelated affected individuals
Cornelis Albers
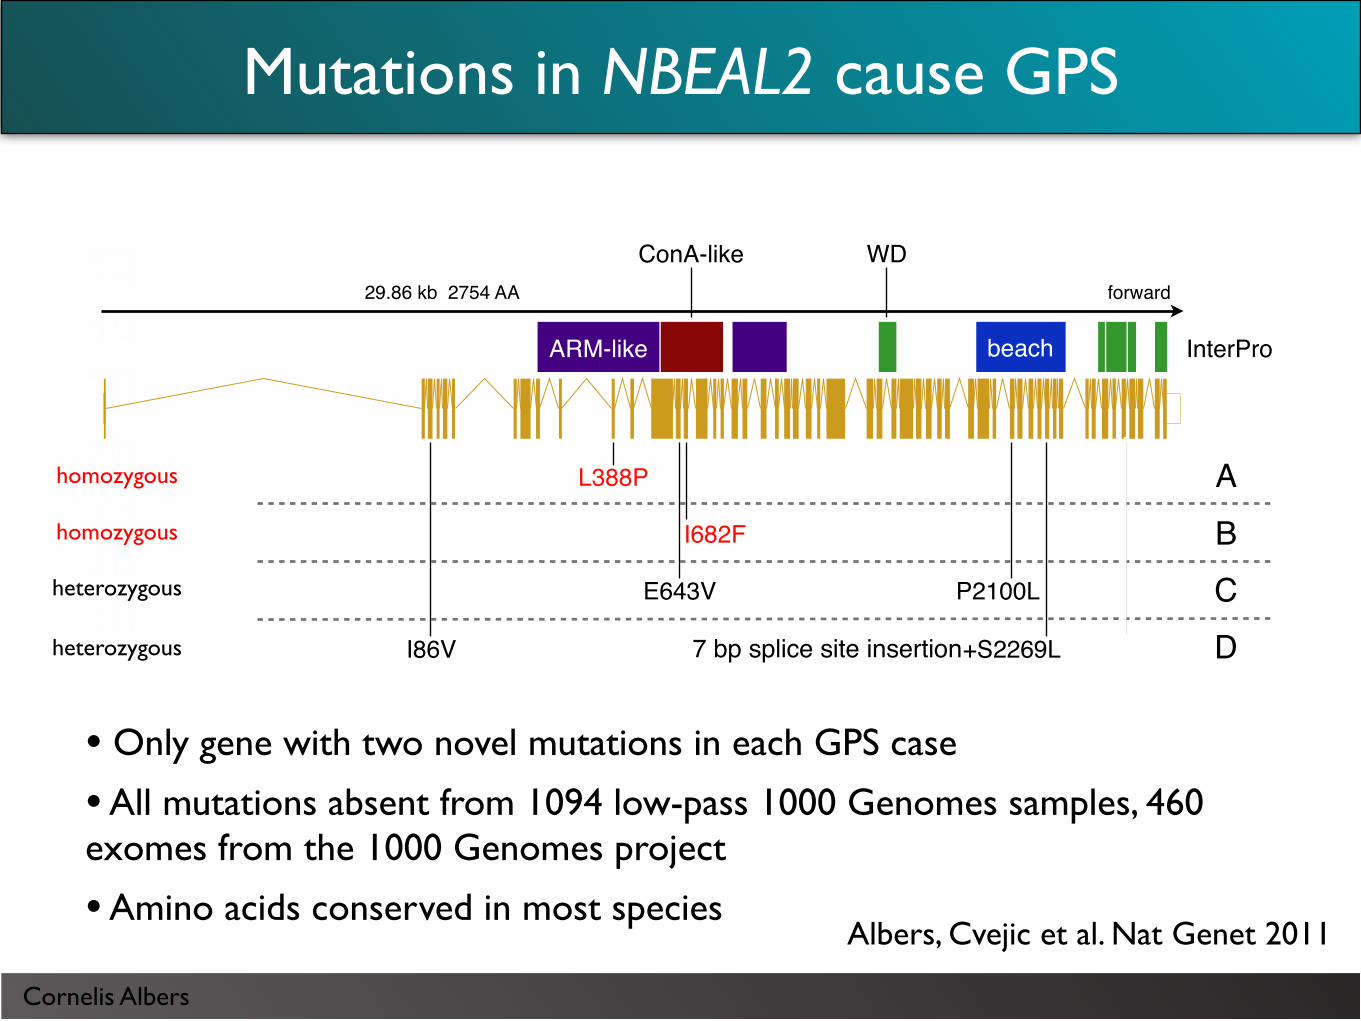
• Only gene with two novel mutations in each GPS case
• All mutations absent from 1094 low-pass 1000 Genomes samples, 460 exomes from the 1000 Genomes project
• Amino acids conserved in most species
Mutations in NBEAL2 cause GPS
Albers, Cvejic et al. Nat Genet 2011
control GPS, paucity of !-granules
GPSGPS
Mi
GPSGPSMC OCS
V
a
A
B
C
D
L388P
I682F
E643V P2100L
I86V splice+S2269L G2553E
29.86 kb 2754 AA forward
beach
WD
ARM-like
ConA-like
InterPro
b
c d
e
!
control control
o-Dianisidine staining 3dpf
nbeal2 MO nbeal2 MO
o-Dianisidine staining 3dpf
control nbeal2 MO
cd41:EGFP
control nbeal2 MOcontrol nbeal2 MO
homozygous
homozygous
heterozygous
heterozygous 7 bp splice site insertion
Cornelis Albers
Motivation
Cornelis Albers
Motivation
• Can the filtering strategy be formalized in a statistical framework?
Cornelis Albers
Motivation
• Can the filtering strategy be formalized in a statistical framework?
• What is the statistical significance for the presence of X novel mutations in Y affected individuals in a gene?
Cornelis Albers
Motivation
• Can the filtering strategy be formalized in a statistical framework?
• What is the statistical significance for the presence of X novel mutations in Y affected individuals in a gene?
• What if we see an enrichment of low-frequency variants in a gene in the patients? When should we follow this up?
• In another exome study, we found four 2% SNPs in four patients in a 1 kb window. How significant is that result?
• Does a result reach genome-wide significance?
Cornelis Albers
Population linkage analysis
Cornelis Albers
Population linkage analysis
• With (whole genome) sequence data, the causal variants can be observed directly.
Cornelis Albers
Population linkage analysis
• With (whole genome) sequence data, the causal variants can be observed directly.
• Given a disease model (ie, penetrance values for each sequence variant), the probability of the observed phenotype can be computed directly from the sequence data.
Cornelis Albers
Population linkage analysis
• With (whole genome) sequence data, the causal variants can be observed directly.
• Given a disease model (ie, penetrance values for each sequence variant), the probability of the observed phenotype can be computed directly from the sequence data.
• 1000 Genomes individuals are healthy controls
• For ‘unrelated’ individuals, we use the coalescent to integrate over all possible relationships between affected and unaffected individuals (in pedigree linkage analysis the pedigree is known and fixed).
Cornelis Albers
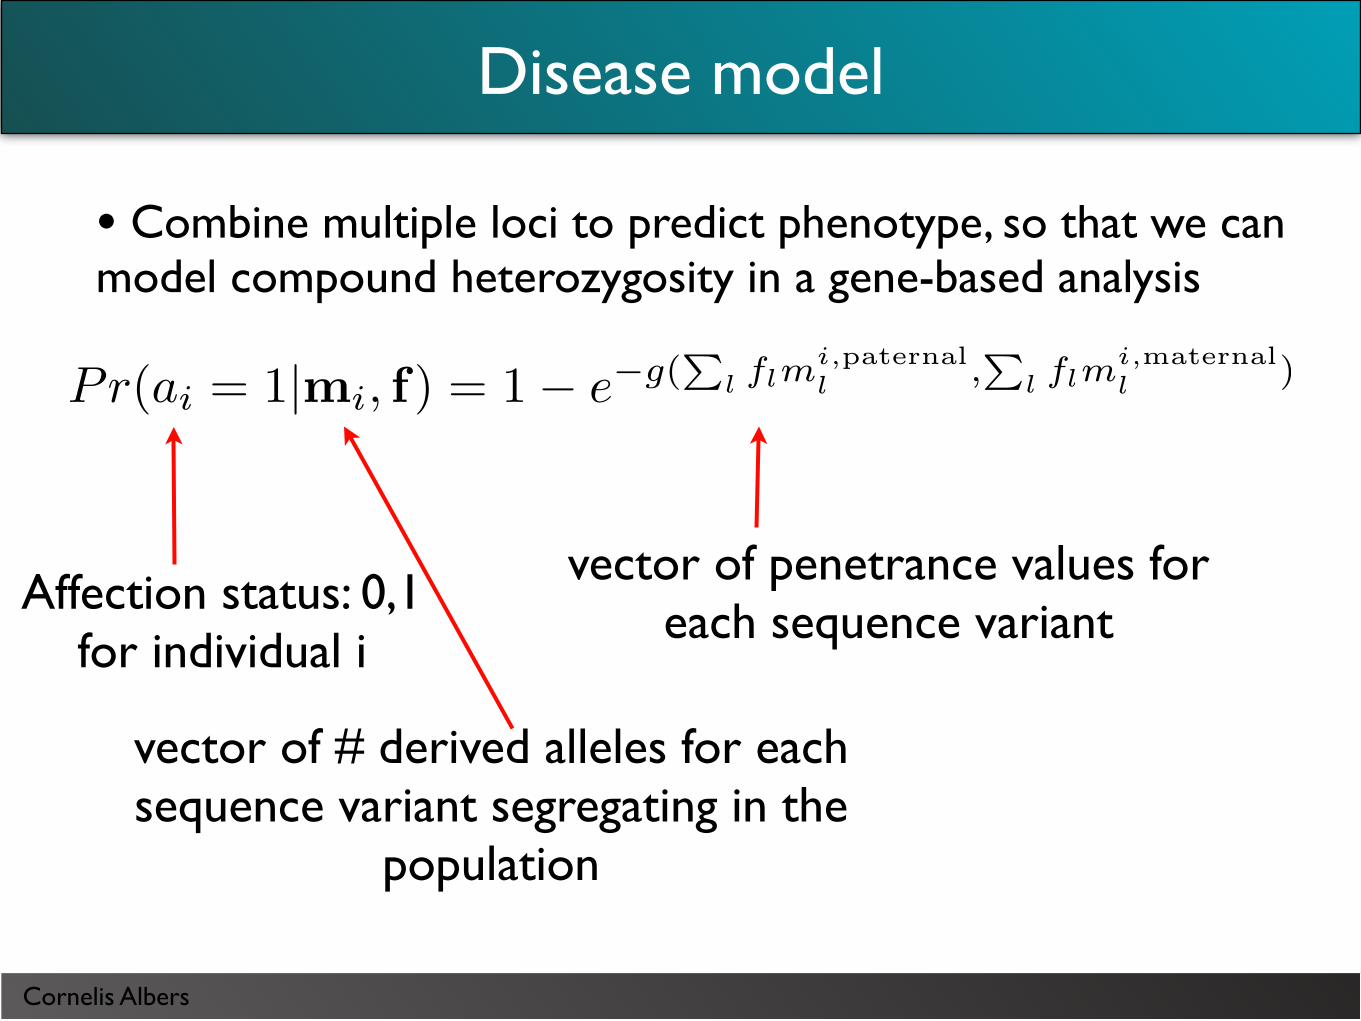
Disease model
Affection status: 0,1 for individual i
vector of # derived alleles for each sequence variant segregating in the
population
vector of penetrance values for each sequence variant
• Combine multiple loci to predict phenotype, so that we can model compound heterozygosity in a gene-based analysis
Pr(ai = 1|mi, f) = 1! e!g(P
l flmi,paternall ,
Pl flm
i,maternall )
Cornelis Albers
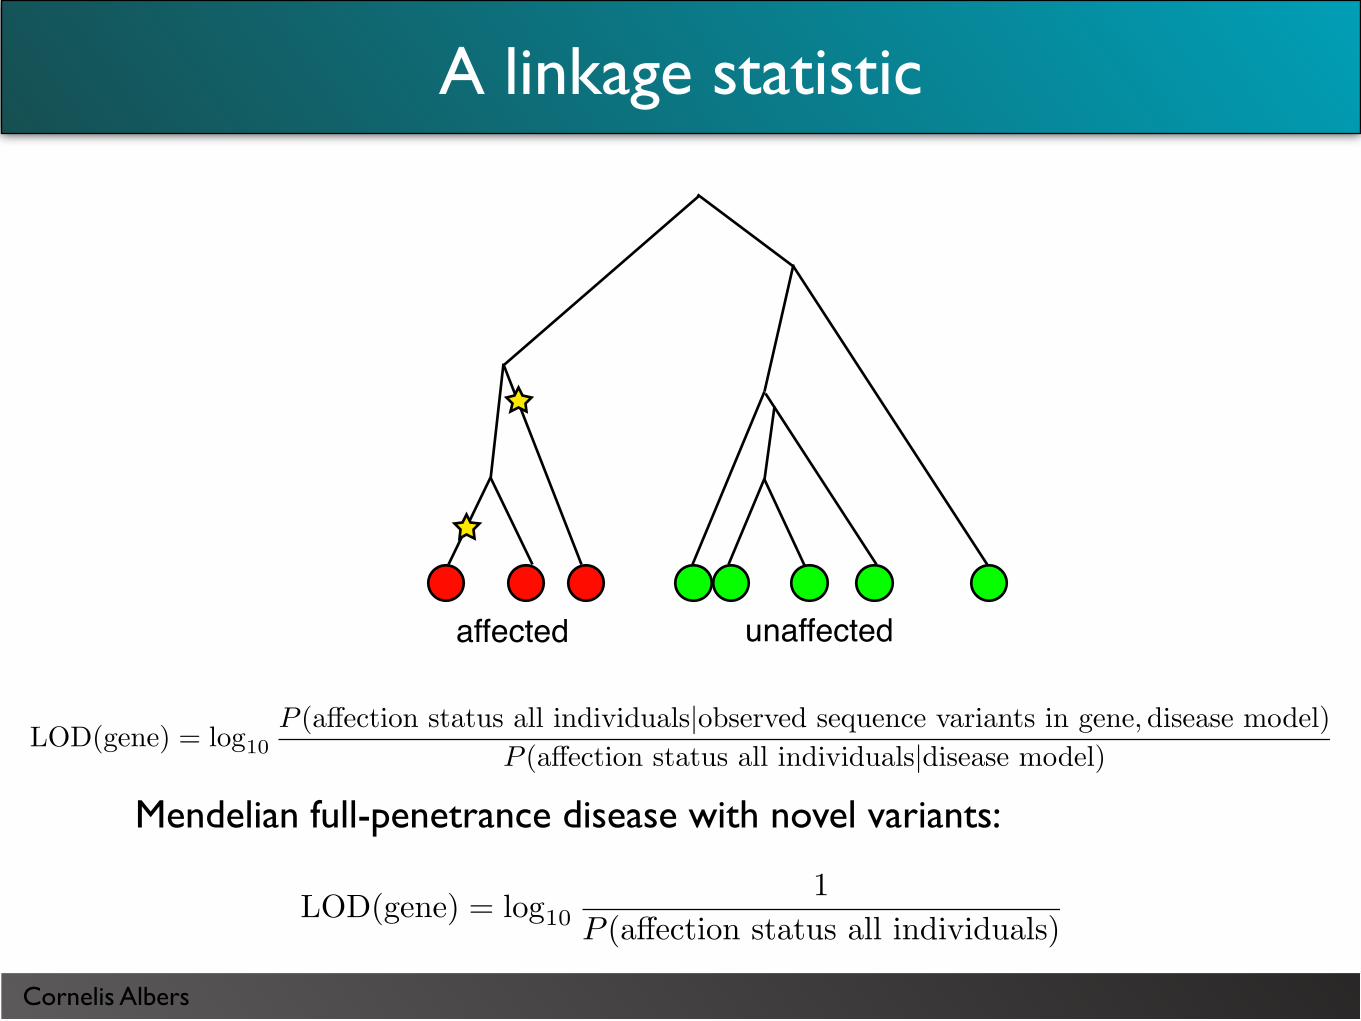
A linkage statistic
unaffectedaffected
LOD(gene) = log101
P (a!ection status all individuals)
Mendelian full-penetrance disease with novel variants:
LOD(gene) = log10P (a!ection status all individuals|observed sequence variants in gene,disease model)
P (a!ection status all individuals|disease model)

Cornelis Albers
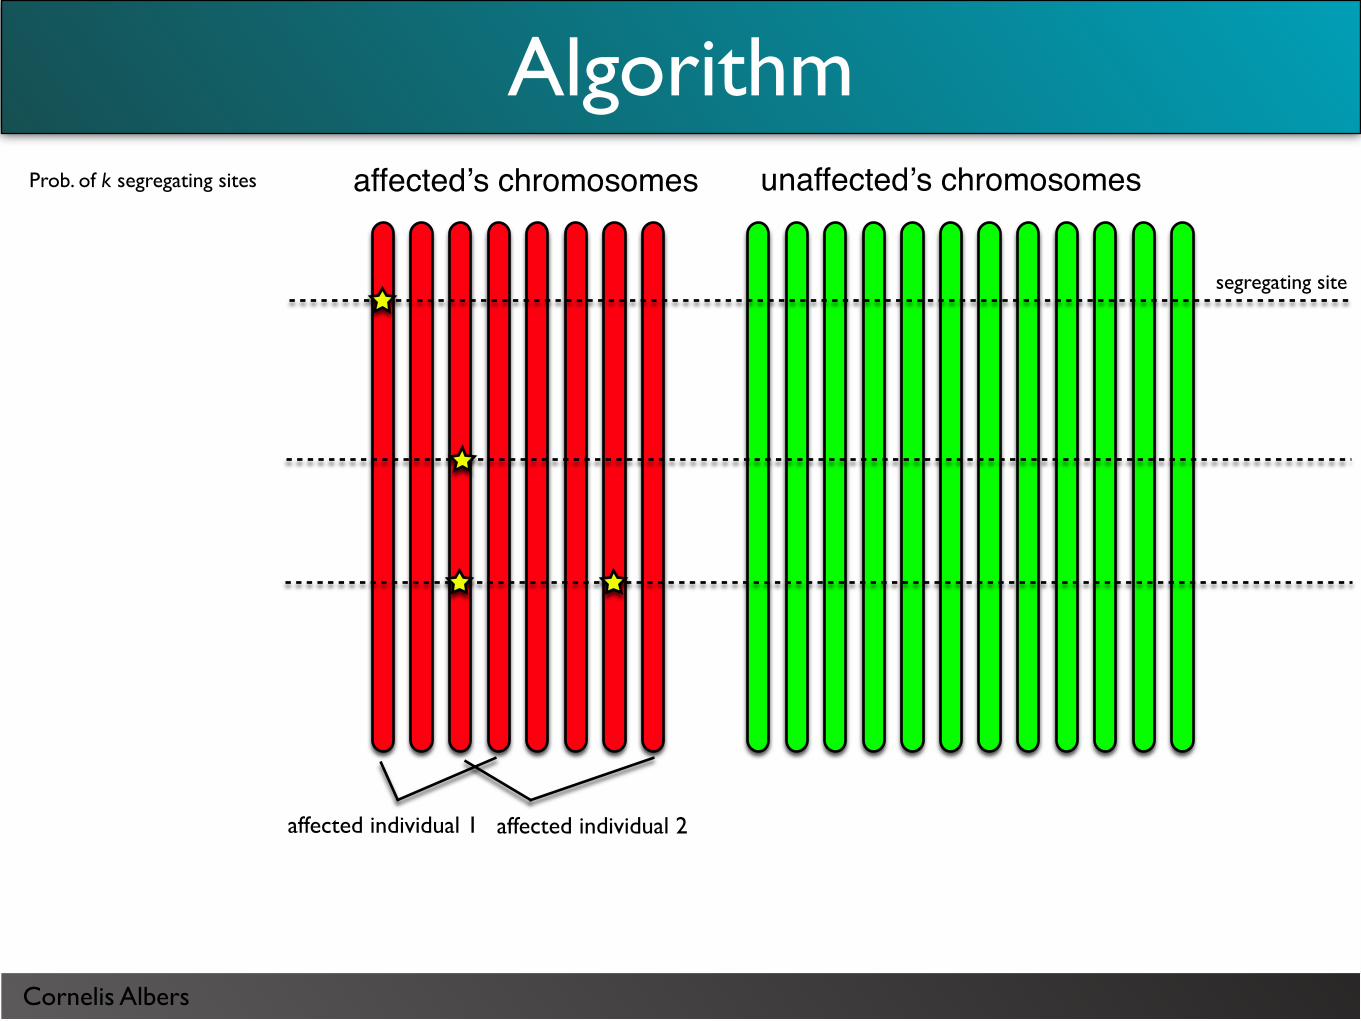
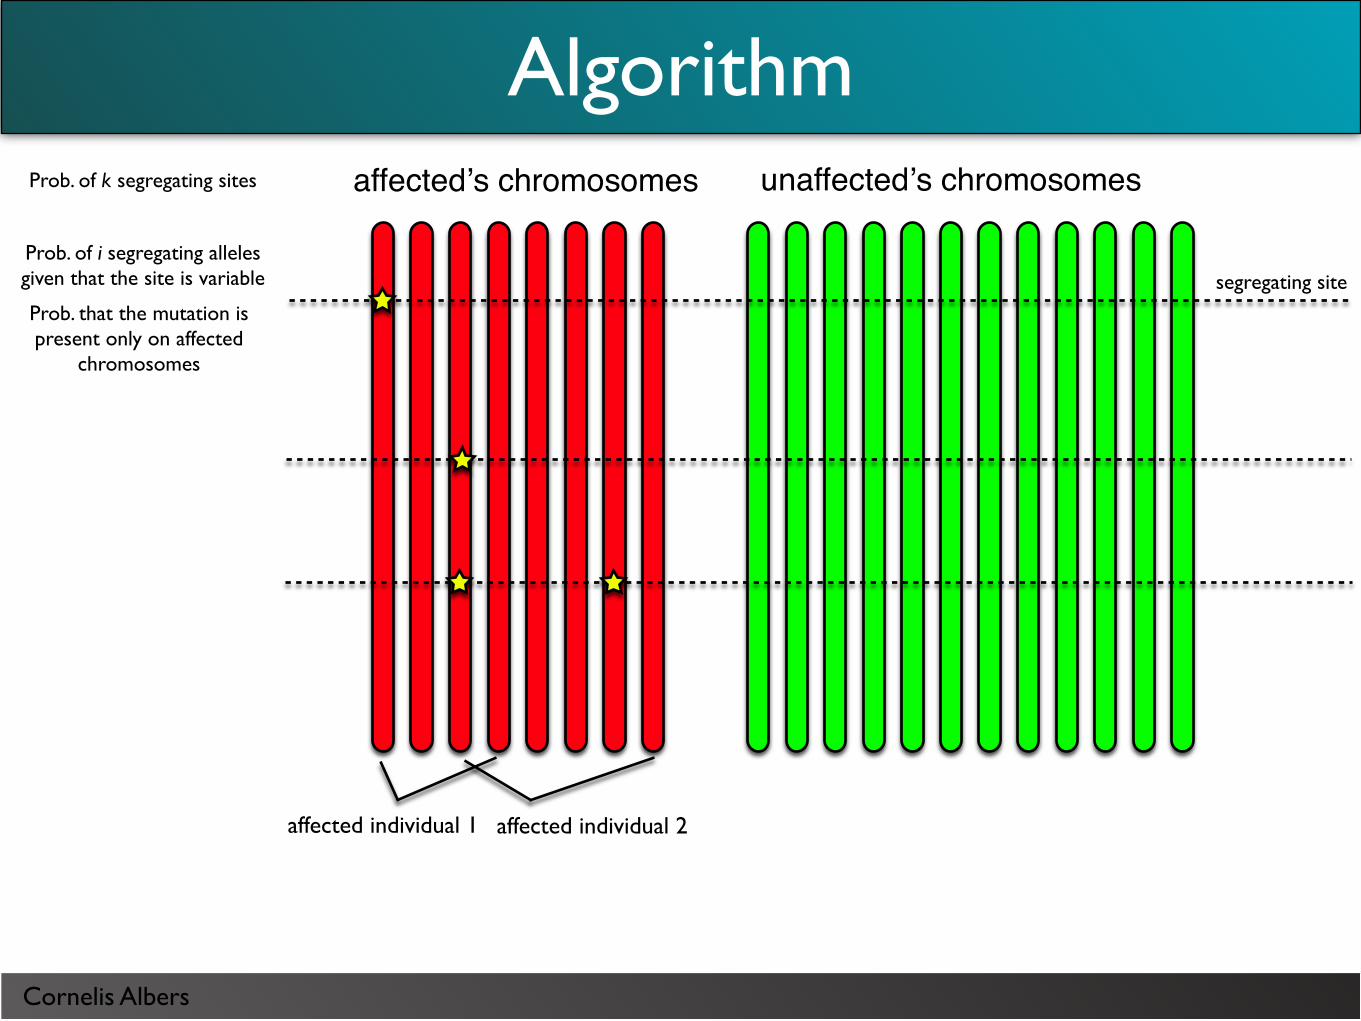
Algorithm
segregating site
unaffectedʼs chromosomesaffectedʼs chromosomes
affected individual 1 affected individual 2
Cornelis Albers
Algorithm
segregating site
unaffectedʼs chromosomesaffectedʼs chromosomes
affected individual 1 affected individual 2
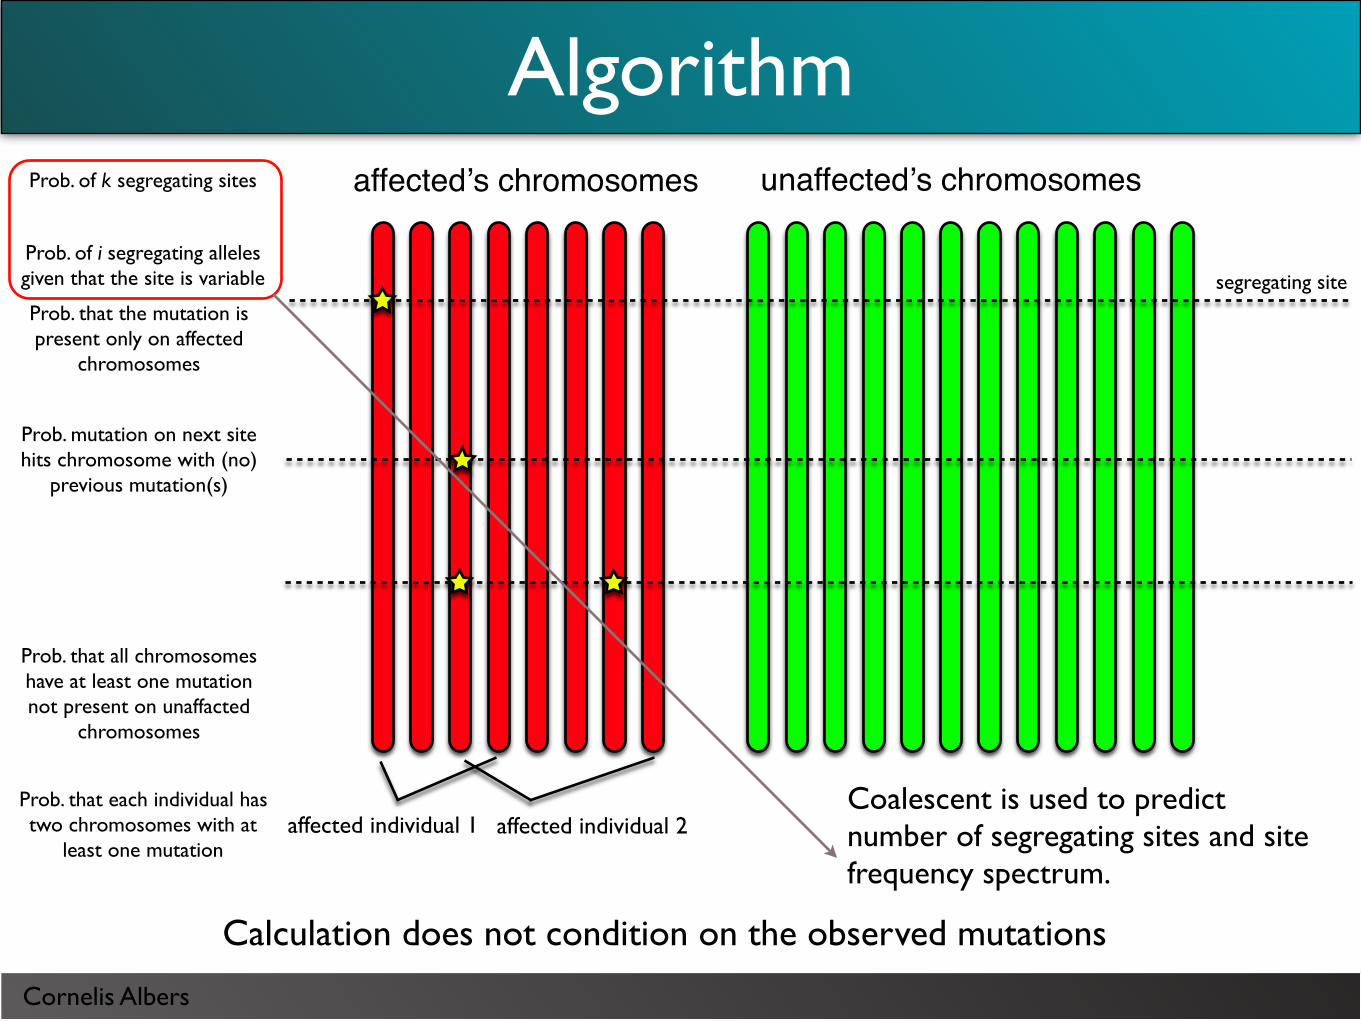
Prob. of k segregating sites
Cornelis Albers
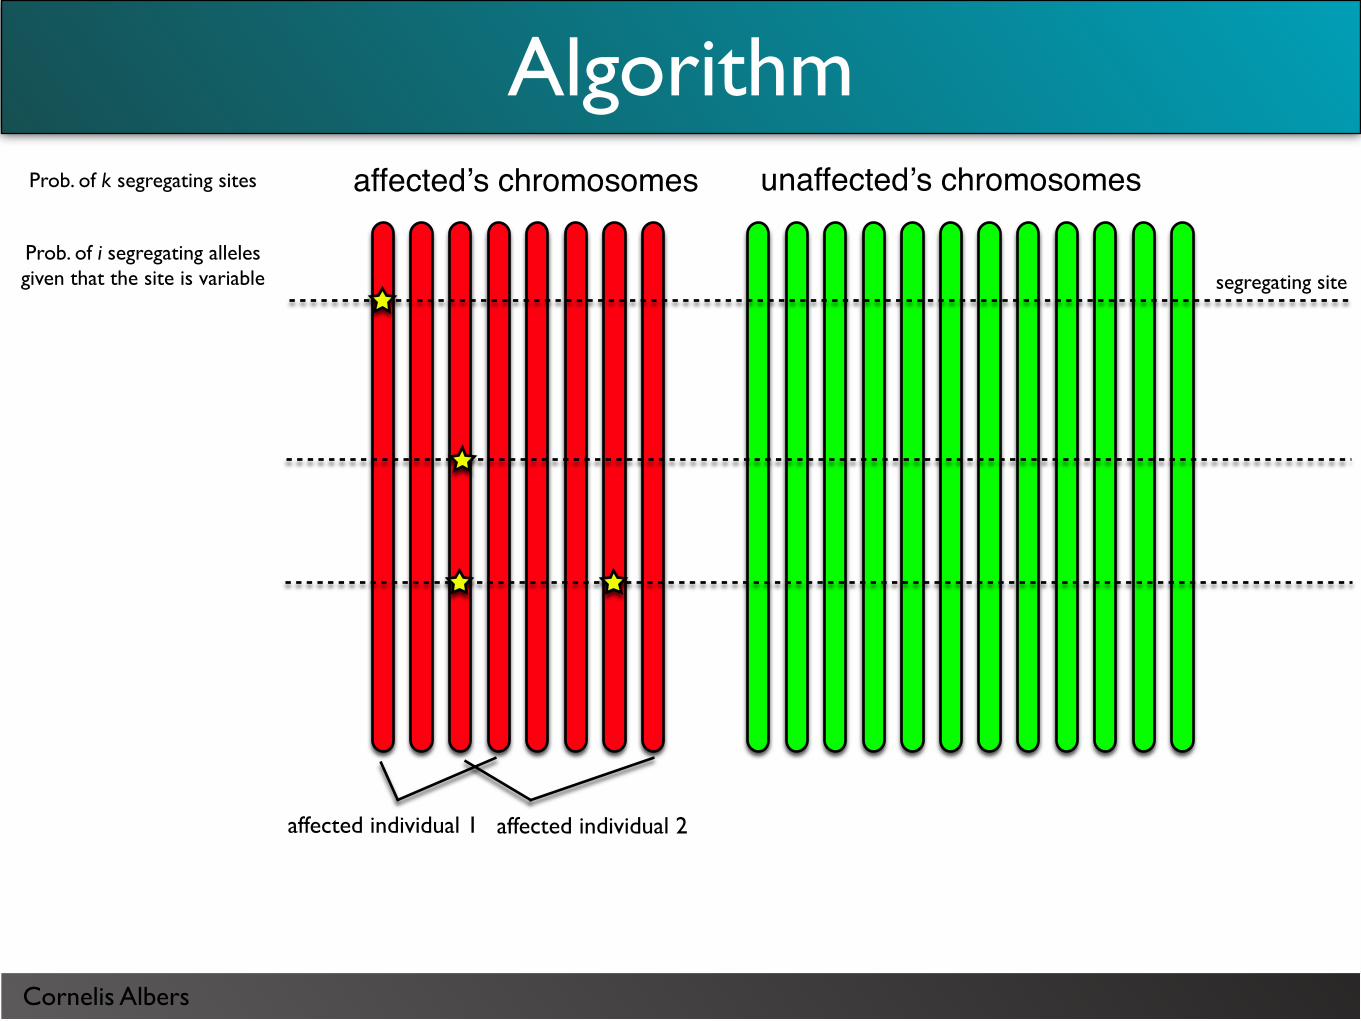
Algorithm
segregating site
unaffectedʼs chromosomesaffectedʼs chromosomes
affected individual 1 affected individual 2
Prob. of i segregating alleles given that the site is variable
Prob. of k segregating sites
Cornelis Albers
Algorithm
segregating site
unaffectedʼs chromosomesaffectedʼs chromosomes
affected individual 1 affected individual 2
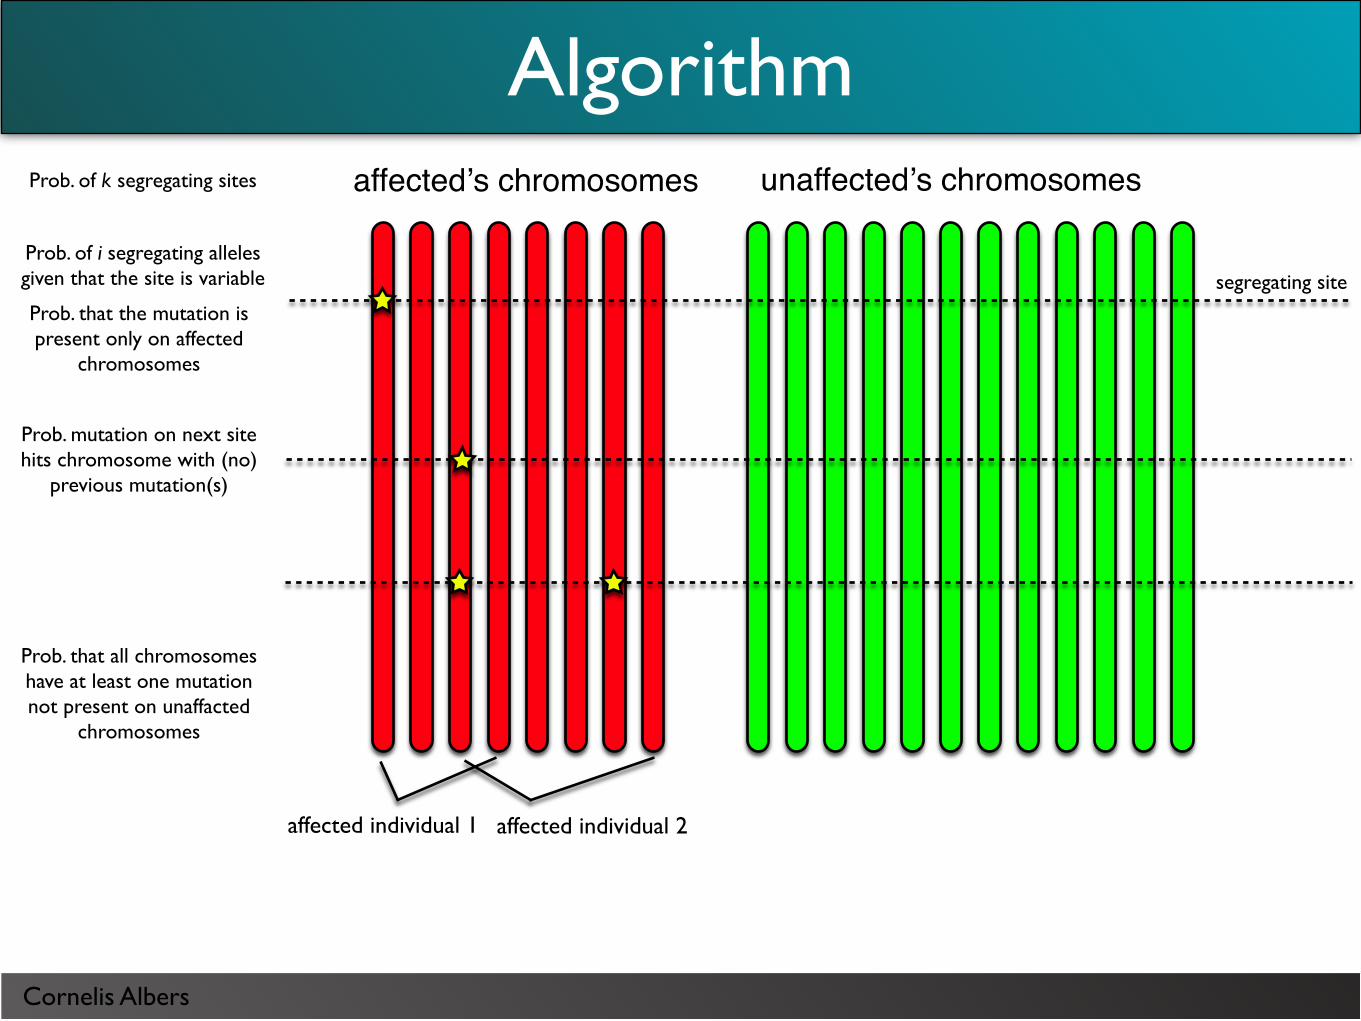
Prob. that the mutation is present only on affected
chromosomes
Prob. of i segregating alleles given that the site is variable
Prob. of k segregating sites

Cornelis Albers
Algorithm
segregating site
unaffectedʼs chromosomesaffectedʼs chromosomes
affected individual 1 affected individual 2
Prob. that the mutation is present only on affected
chromosomes
Prob. of i segregating alleles given that the site is variable
Prob. of k segregating sites
Prob. mutation on next site hits chromosome with (no)
previous mutation(s)
Prob. that all chromosomes have at least one mutation not present on unaffacted
chromosomes
Cornelis Albers
Algorithm
segregating site
unaffectedʼs chromosomesaffectedʼs chromosomes
affected individual 1 affected individual 2
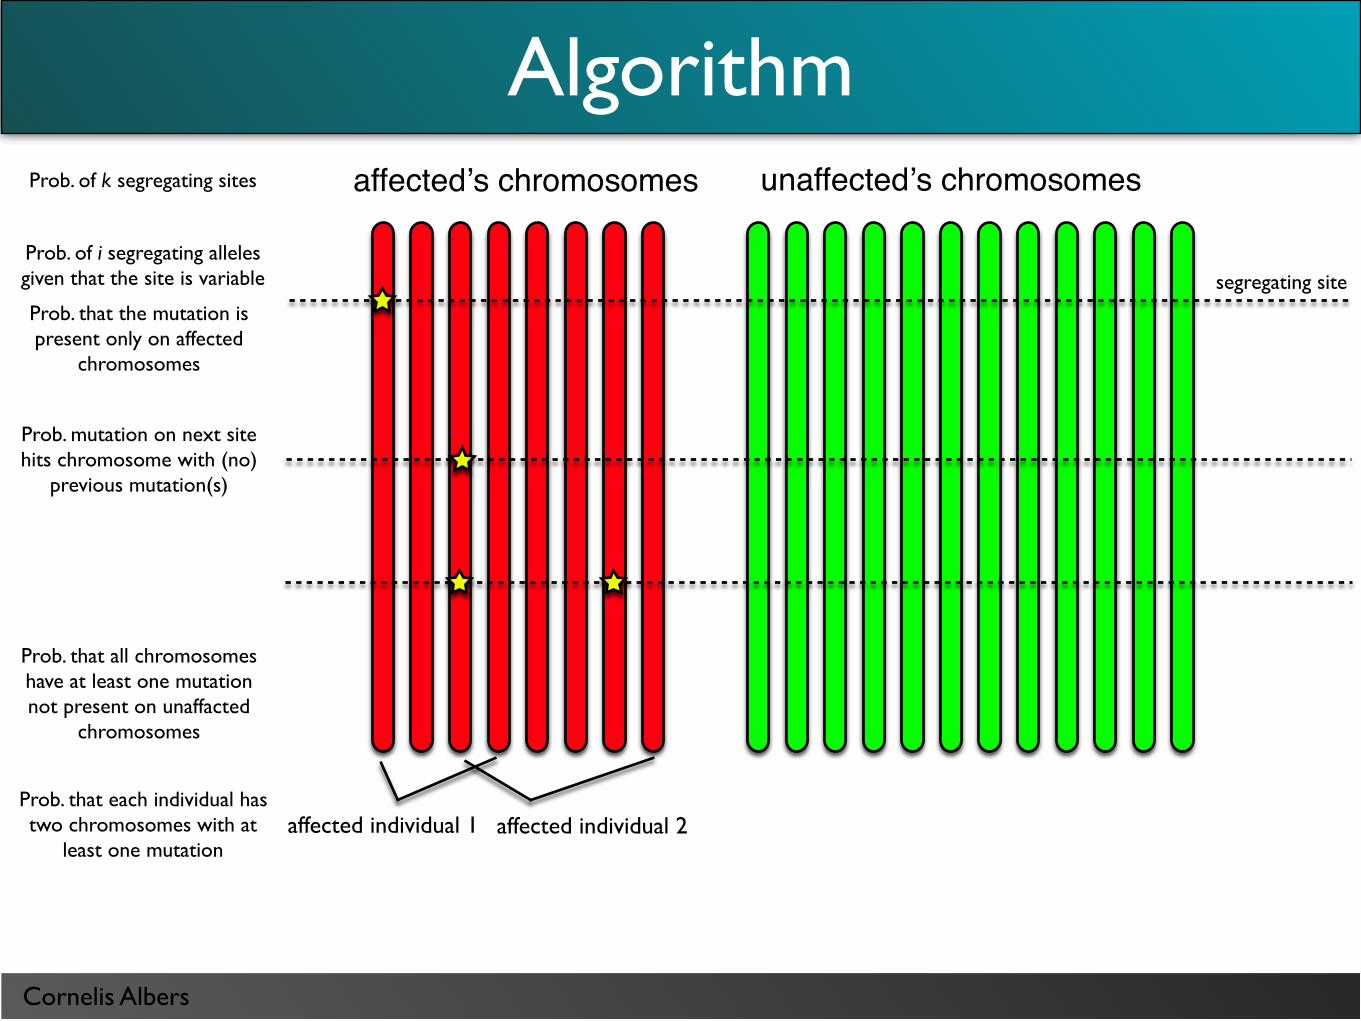
Prob. that the mutation is present only on affected
chromosomes
Prob. of i segregating alleles given that the site is variable
Prob. of k segregating sites
Prob. mutation on next site hits chromosome with (no)
previous mutation(s)
Prob. that all chromosomes have at least one mutation not present on unaffacted
chromosomes
Prob. that each individual has two chromosomes with at
least one mutation
Cornelis Albers
Algorithm
segregating site
unaffectedʼs chromosomesaffectedʼs chromosomes
affected individual 1 affected individual 2
Prob. that the mutation is present only on affected
chromosomes
Prob. of i segregating alleles given that the site is variable
Prob. of k segregating sites
Prob. mutation on next site hits chromosome with (no)
previous mutation(s)
Prob. that all chromosomes have at least one mutation not present on unaffacted
chromosomes
Prob. that each individual has two chromosomes with at
least one mutation
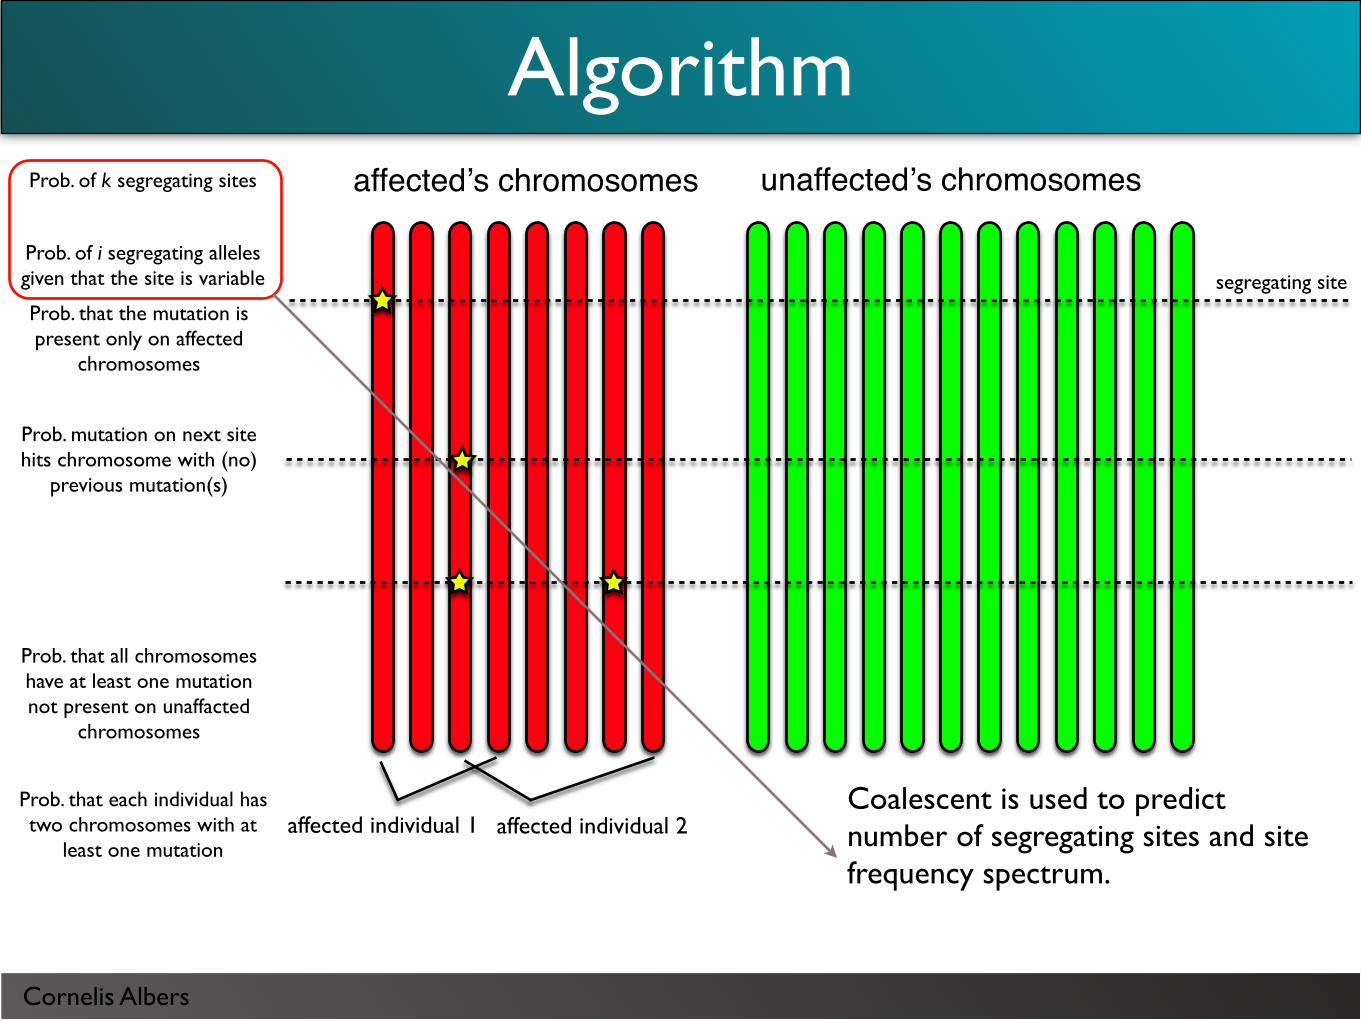
Coalescent is used to predict number of segregating sites and site frequency spectrum.
Cornelis Albers
Algorithm
segregating site
unaffectedʼs chromosomesaffectedʼs chromosomes
affected individual 1 affected individual 2
Prob. that the mutation is present only on affected
chromosomes
Prob. of i segregating alleles given that the site is variable
Prob. of k segregating sites
Prob. mutation on next site hits chromosome with (no)
previous mutation(s)
Prob. that all chromosomes have at least one mutation not present on unaffacted
chromosomes
Prob. that each individual has two chromosomes with at
least one mutation
Coalescent is used to predict number of segregating sites and site frequency spectrum.
Calculation does not condition on the observed mutations

Cornelis Albers
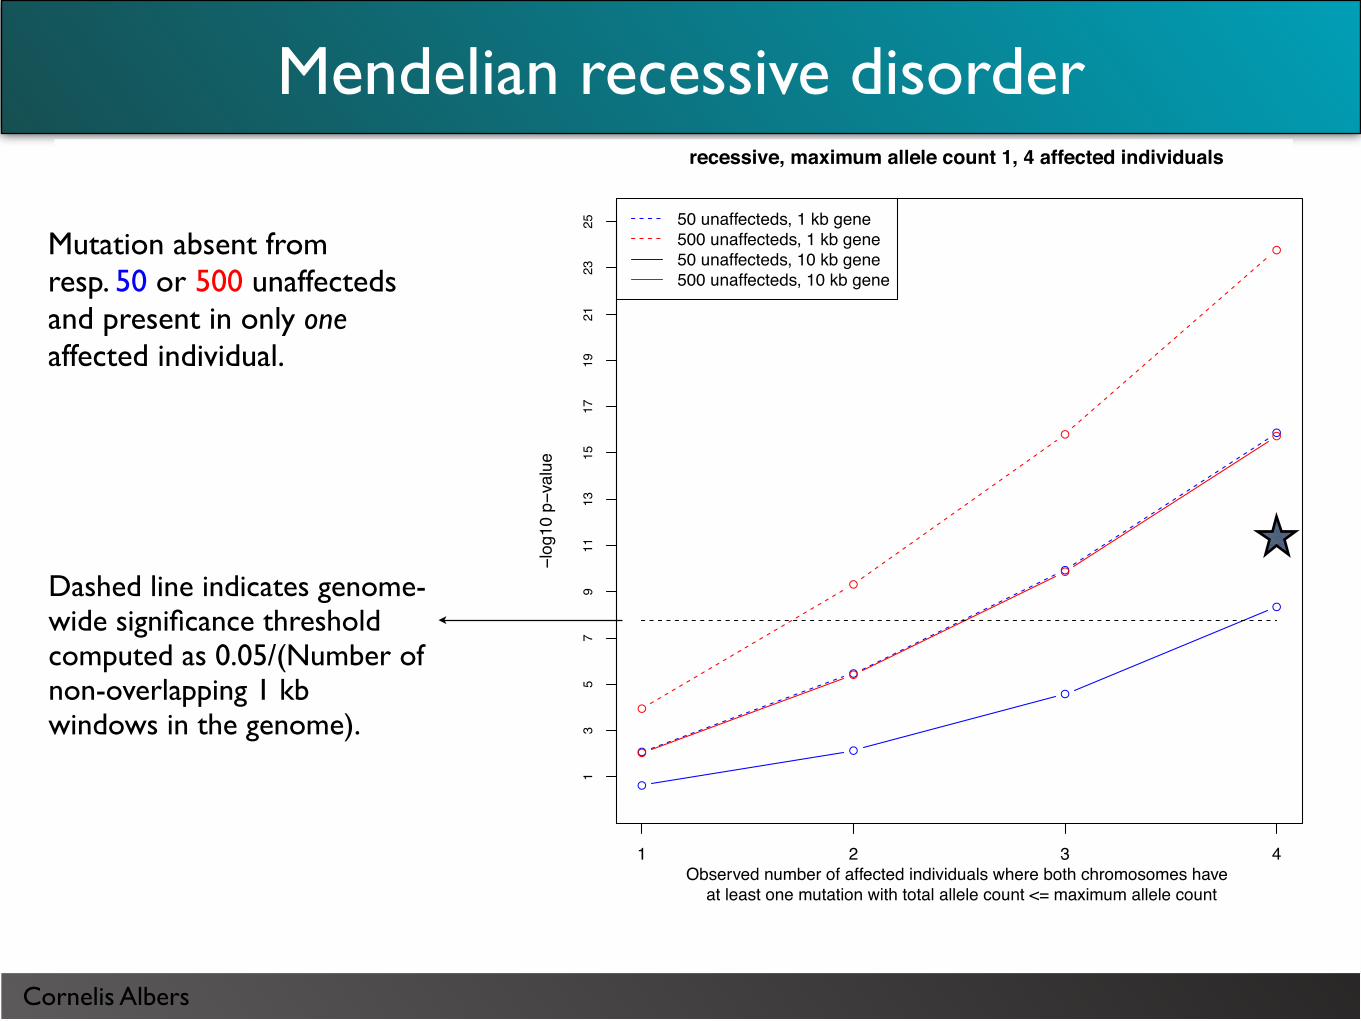
Mutation absent from resp. 50 or 500 unaffecteds and present in only one affected individual.
Mendelian recessive disorder
●
●
●
●
recessive, maximum allele count 1, 4 affected individuals
Observed number of affected individuals where both chromosomes have at least one mutation with total allele count <= maximum allele count
−log
10 p−v
alue
●
●
●
●
●
●
●
●
●
●
●
●
1 2 3 4
13
57
911
1315
1719
2123
25 50 unaffecteds, 1 kb gene500 unaffecteds, 1 kb gene50 unaffecteds, 10 kb gene500 unaffecteds, 10 kb gene
Dashed line indicates genome-wide significance threshold computed as 0.05/(Number of non-overlapping 1 kb windows in the genome).
Cornelis Albers
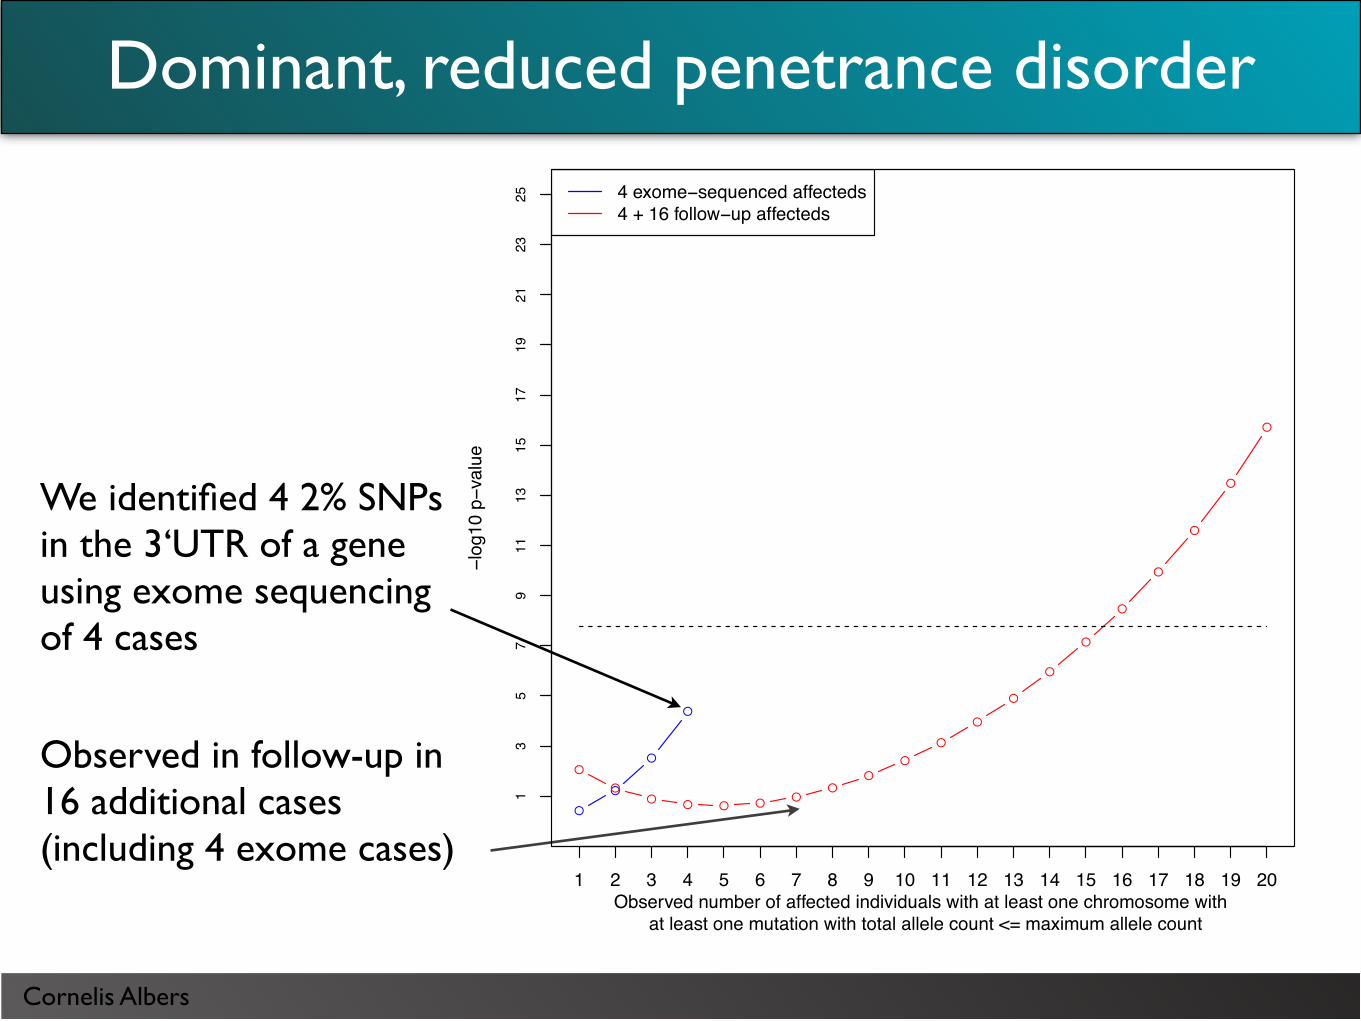
We identified 4 2% SNPs in the 3‘UTR of a gene using exome sequencing of 4 cases
Observed in follow-up in 16 additional cases (including 4 exome cases)
Dominant, reduced penetrance disorder
●
●
●
●
dominant, maximum allele frequency 2%, 500 unaffected individuals, 1 kb region
Observed number of affected individuals with at least one chromosome with at least one mutation with total allele count <= maximum allele count
−log
10 p−v
alue
●
●●
● ● ●●
●●
●
●
●
●
●
●
●
●
●
●
●
1 2 3 4 5 6 7 8 9 10 11 12 13 14 15 16 17 18 19 20
13
57
911
1315
1719
2123
25 4 exome−sequenced affecteds4 + 16 follow−up affecteds

Cornelis Albers
Population stratification
• Very high number of low-frequency alleles for some individuals, manifests as inflated heterozygosity
• Population stratification has severe effect on rate of low-frequency mutations and may inflate significance estimates.
• Estimate relatedness from low-frequency mutations
Number of common non-ref alleles
Num
ber
of <
5% n
on-r
ef a
llele
s 14000
2000 PCA
PC1PC
2
Cornelis Albers
Acknowledgements
• Richard Durbin
• Willem Ouwehand
• Paquita Nurden, Remi Favier, Marie-Christine Alessi, Evelien Bouwmans & Jonathan Stephens (Gray Platelet Syndrome study)
• Patrick Tarpey, Cancer Genome Project Group @ Sanger