Embed Size (px)
Citation preview

Estimating spatial and temporal beta-diversity of plant communities from spaceborne hyperspectral data
CSIRO LAND & WATER
Simon Ferrier (CSIRO)
Pedro Leitão (Technische Universität Braunschweig)
With thanks to: Kerry Cawse-Nicholson, Chris Ware, Karel Mokany, Tom Harwood, Andrew Hoskins, Mike Harfoot
c

Biodiversity crisis is now attracting significant attention


https://www.unep-wcmc.org/resources-and-data/towards-an-approach-for-species-accounting
Broad approaches to monitoring biodiversity change


https://www.unep-wcmc.org/resources-and-data/towards-an-approach-for-species-accounting
Broad approaches to monitoring biodiversity change

Modelling and mapping of continuous patterns in collective properties of biodiversity
Local richness (alpha diversity) at location A =
f (abiotic environment, biogeographic history, human disturbance, etc)
Compositional dissimilarity (pairwise beta diversity) between locations A
and B = f (differences in abiotic environment, biogeographic isolation etc)
Location A
Location B

Biodiversity Habitat Index (BHI)
Local habitat condition (intactness) - statistical downscaling of land-use change using MODIS remote sensing
Biologically-scaled environments (ecosystems)- modelling of spatial variation in biodiversity composition (beta diversity) using data for > 400,000 species
Biodiversity Habitat Index (BHI) - estimated proportion of habitat remaining within biologically-scaled environments
• Combines remotely monitored habitat condition with modelled spatial variation in biodiversity composition
• Derived at 1km grid resolution across the entire land surface of the planet
low high
low high

Global
Malaysia
Indonesia
Borneo Lowland Rain Forests
2005 20152010
Bio
div
ersi
ty H
abit
at I
nd
exThe BHI is recalculated, using remote-sensing inputs from different years, to report change in habitat retention across all biologically-scaled environments
Biodiversity Habitat Index - 2015
Habitat condition - 2015
Ecoregion: IM0102Borneo Lowland Rain Forests
low high
low high
occurring within any given spatial unit (e.g. country, ecoregion, the entire planet)

https://www.unep-wcmc.org/resources-and-data/towards-an-approach-for-species-accounting
Broad approaches to monitoring biodiversity change


30 metres
The coarser pixel resolution of spaceborne imaging spectroscopy presents a major challenge

30 m
etr
es
Can pairwise beta-diversity (across space and/or time) be estimated directly from composite spectral profiles?
?

Modelling and mapping of continuous patterns in collective properties of biodiversity
Local richness (alpha diversity) at location A =
f (abiotic environment, biogeographic history, human disturbance, etc)
Compositional dissimilarity (pairwise beta diversity) between locations A
and B = f (differences in abiotic environment, biogeographic isolation etc)
Location A
Location B

Generalised dissimilarity modelling (GDM)Ferrier, S et al (2007) Diversity & Distributions
=
−+=n
p
pjppip xfxf1
)()(
−−= edij 1
Compositional
dissimilarity
Ecological distance
Biological
survey
data
Environmental
predictor A Environmental
predictor BEnvironmental
predictor C
predictor A
predictor B
f(p
red
icto
r A
)f
(pre
dic
tor
B)


Pedro Leitão’s work

Mapping Cerrado woody plant community turnover with spaceborne imaging spectroscopy dataPedro J. Leitão,Marcel Schwieder, Fernando Pedroni, Maryland Sanchez, José R. R. Pinto, Mercedes Bustamante, Patrick Hostert

4.03.2020 | Leitão et al. | SBG Webinar | page 2
Motivation & Aims:
• Mapping and monitoring spatial patterns of community composition and turnover using spaceborne imaging spectroscopy
• Develop an operational method capable of dealing with high-dimensional and high-collinear remote sensing data
The EnMAP is one of several forthcoming spaceborne imaging spectroscopy missions

4.03.2020 | Leitão et al. | SBG Webinar | page 3
Methods:
• Sparse Generalized Dissimilarity Modelling (SGDM)
SCCA
GDM GDM
Remote Sensing Data Cube
Biodiversity Data Community Dissimilarity
Canonical Components Community
Composition Map
KnnINMDS
Signif.test
SGDM

4.03.2020 | Leitão et al. | SBG Webinar | page 4
Methods:
• Sparse Generalized Dissimilarity Modelling (SGDM)
• Generalized Dissimilarity Modelling (GDM)
• A statistical technique for analysing and predicting patterns of turnover in community composition
• Fits non-linear functions on the environmental variables to predict compositional dissimilarity
• Affected by data collinearity

4.03.2020 | Leitão et al. | SBG Webinar | page 5
Methods:
• Sparse Generalized Dissimilarity Modelling (SGDM)
• Sparse Canonical Correlation Analysis (SCCA)
• Supervised transformation approach
• Used in genetic research, where typically number of features is much greater than number of samples
• Transforms two matrices in order to maximise the correlation between them
• Based on penalised (Lasso) regression, thus downweighting redundant data
• Capable of (and designed for) dealing with high-dimensional and high-collinear datasets

4.03.2020 | Leitão et al. | SBG Webinar | page 6
Methods:
• Sparse Generalized Dissimilarity Modelling (SGDM) sgdm Package
2015, Description of the SGDM method
2017, Description of the sgdm R package
2018, Mapping Cerrado woody plant communities

4.03.2020 | Leitão et al. | SBG Webinar | page 7
Data:
• Woody plant inventory data following a systematic sampling scheme(RAPELD adapted to the Cerrado)
Floristic gradients
PESA:• 65 samples• 184 species
PNCV:• 29 samples• 94 species
4.03.2020 | Leitão et al. | SBG Webinar | page 8
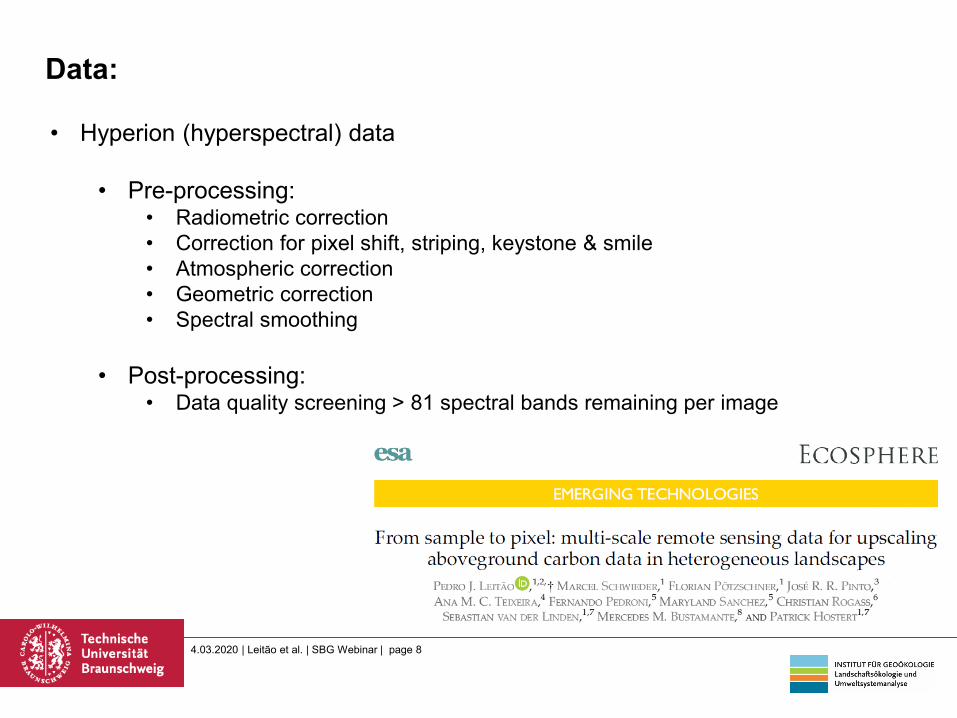
Data:
• Hyperion (hyperspectral) data
• Pre-processing:• Radiometric correction• Correction for pixel shift, striping, keystone & smile• Atmospheric correction• Geometric correction• Spectral smoothing
• Post-processing:• Data quality screening > 81 spectral bands remaining per image

4.03.2020 | Leitão et al. | SBG Webinar | page 9
Results:
R2 = 0.392R2 = 0.710
PESA PNCV• Woody plant community maps

4.03.2020 | Leitão et al. | SBG Webinar | page 10
Results:
• Spectral band contribution

4.03.2020 | Leitão et al. | SBG Webinar | page 11
Conclusions & Discussion
Our method allowed for mapping species community turnoverusing spaceborne imaging spectroscopy
Relevant considerations/challenges for the generalization ofSGDM include:
The method is not suitable for data extrapolation(i.e. models need to include the full data space)
Input spectral data needs to be harmonized It is sensitive to
Detection/correction of atmospheric effects Topographic/shading effects Phenological changes
Sensitivity to temporal or physiological changes needs to betested

4.03.2020 | Leitão et al. | SBG Webinar | page 12
Thank you for your attention
@steppebird
Acknowledgements:
Ana Teixeira, Eddy Lenza, Christian Rogaß
This research was funded by the German Aerospace Centre - Project Management Agency (50EE0949 ; 50EE1309)

Where to from here? – strategies for accessing or generating data to further test and develop ideas
➢ Combine existing spaceborne hyperspectral data (e.g. Hyperion archive) and coincident existing vegetation plot data (e.g. sPlot database)
➢ Simulate spaceborne hyperspectral data by aggregating existing airborne data (e.g. AVIRIS) across areas with existing vegetation plot data
➢ Commission spaceborne data (e.g. DESIS) across areas with existing vegetation plot data
➢ Collect new vegetation plot data across areas with good spaceborne and/or airborne hyperspectral data coverage

EO-1 Hyperion:
archive scenes
Vegetation plots
Over 93,000 of the 1.12 million vegetation plots in the
sPlot database fall within Hyperion scenes

Where to from here? – strategies for accessing or generating data to further test and develop ideas
➢ Combine existing spaceborne hyperspectral data (e.g. Hyperion archive) and coincident existing vegetation plot data (e.g. sPlot database)
➢ Simulate spaceborne hyperspectral data by aggregating existing airborne data (e.g. AVIRIS) across areas with existing vegetation plot data
➢ Commission spaceborne data (e.g. DESIS) across areas with existing vegetation plot data
➢ Collect new vegetation plot data across areas with good spaceborne and/or airborne hyperspectral data coverage

Where to from here? – numerous challenges in refining and extending the analytical approach – for example …
➢ Accommodating shorter-term temporal dynamics (seasonality, drought, fire etc)
➢ Disentangling natural and anthropogenic drivers of variation in community composition
➢ Coupling spaceborne imaging spectroscopy with other cutting-edge observation technologies – e.g. eDNA / metabarcoding / metagenomics


Turner, W (2014) Science

Thank you
CSIRO Land and WaterSimon Ferrier
t +61 2 62464191e [email protected] www.csiro.au
CSIRO LAND & WATER

![Estimating Missing Temporal Meta-Information using ...ceur-ws.org/Vol-1959/paper-04.pdf · We aim to augment a temporal knowledge base using web table data [13,7]. Fig-ure 1 shows](https://img.dokumen.tips/doc/110x75/5ec08ca6dab1c121617ded31/estimating-missing-temporal-meta-information-using-ceur-wsorgvol-1959paper-04pdf.jpg)