Embed Size (px)
Citation preview

Agronomy 2020, 10, 828; doi:10.3390/agronomy10060828 www.mdpi.com/journal/agronomy
Article
Estimating Sensory Properties with Near‐Infrared
Spectroscopy: A Tool for Quality Control and
Breeding of ‘Calçots’ (Allium cepa L.)
Silvia Sans 1,2,*, Joan Ferré 3, Ricard Boqué 3, José Sabaté 1,2, Joan Casals 1,2 and Joan Simó 1,2
1 Department of Agri‐Food Engineering and Biotechnology, BarcelonaTech, Campus Baix Llobregat, Esteve
Terrades 8, 08860 Castelldefels, Spain; [email protected] (J.S.); [email protected] (J.C.);
[email protected] (J.S.) 2 Miquel Agustí Foundation, Campus Baix Llobregat, Esteve Terrades 8, 08860 Castelldefels, Spain 3 Rovira i Virgili University, Department of Analytical Chemistry and Organic Chemistry,
Campus Sescelades, 43007 Tarragona, Spain; [email protected] (J.F.); [email protected] (R.B.)
* Correspondence: [email protected]; Tel.: +34‐935‐521‐101
Received: 26 May 2020; Accepted: 8 June 2020; Published: 11 June 2020
Abstract: Using trained panelists to evaluate sensory attributes is unfeasible when many samples
must be evaluated, such as in quality control or breeding programs. Near‐infrared spectroscopy
(NIRS) is a rapid inexpensive method often used in food quality evaluation. We assessed the
feasibility of using NIRS to estimate sweetness, fiber perception, and off‐flavors, the most important
sensory attributes in cooked ‘calçots’ (the immature floral stems of second‐year onion resprouts).
The best results were achieved through models using interval partial least squares (iPLS) variable
selection on spectra from pureed cooked ‘calçots’, which yielded values of the ratio of performance
to deviation (RPD) greater than 1.4 in all cases. Therefore, it would be feasible to use NIRS to
estimate sensory properties in ‘calçots’. This approach would be useful in initial screening to discard
samples that differ substantially from the ideotype; thus, sensory analysis by trained panels could
be reserved for finer discriminations.
Keywords: ‘calçot’; NIRS; sensory analysis; quality control; PLS; onion
1. Introduction
‘Calçots’ (Allium cepa L.) are the immature floral stems of second‐year ‘Blanca Tardana de Lleida’
(BTL) onion landrace resprouts. This crop is typical of Catalonia (Northeast Spain), where ‘calçots’
are typically prepared by roasting on a hot open fire. Although official economic data are lacking, the
market volume for ‘calçots’ is estimated at €20 million [1]. However, the economic importance of
‘calçots’ lies not only in their production but also in associated agro‐tourism, which boosts the
regional economy and has increased the demand for ‘calçots’ worldwide.
‘Calçots’ from the traditional cultivation area have been awarded the European Union’s food‐
quality label ‘Protected Geographical Indication’ (PGI) [2]. To date, the PGI’s regulating board has
focused the quality control of ‘calçots’ on morphological traits (length and width of the edible part)
but producers aim to highlight the internal quality, especially organoleptic attributes.
The sensory ideotype representing consumer preferences of the ideal ‘calçot’ is sweet, with low
fiber perception, and without off‐flavors [3]. The evaluation of sensory attributes requires trained
panelists to apply standardized methods and a considerable amount of the sample. Since only a few
samples can be evaluated in each session, panelists must meet several times, making it impracticable
to analyze large numbers of samples [4]. These limitations discourage breeders from including
Agronomy 2020, 10, 828 2 of 12
sensory traits in breeding programs and limit the scope of the regulating authority’s efforts at quality
control. Therefore, other approaches are needed to replace or complement traditional sensory
analysis.
Chemical analysis has been used to estimate sensory attributes in fruit and vegetables, including
melons (Cucumis melo L.) [5], onions [6,7], tomatoes (Solanum lycopersicum L.) [8] or red raspberry
(Rubus idaeus L.) [9], among others. Correlations between sensory attributes and chemical parameters
have been established also for ‘calçots’ [10]. Nevertheless, standard chemical analyses are expensive,
laborious, and time‐consuming. Besides, organoleptic properties can be difficult to predict from
isolated chemical data because these properties result from interactions among various compounds
[11].
In recent years, near‐infrared spectroscopy (NIRS) has attracted attention because it is a fast
technique and easy to apply, inexpensive, and enables the simultaneous estimation of different
properties from a single spectrum. NIRS has been widely used in the agri‐food industry, for example
it is often used to evaluate food quality [12], to control food safety [13], and to detect food
adulterations [14]. Albeit to a lesser extent, NIRS has been used to estimate sensory attributes in
products such as wine [15], green tea [16], coffee [17,18], chicory [19], beans [20], potatoes [21], and
meat and fish products [22,23], among others. These studies have shown that NIRS is a useful tool
for sensory evaluation when combined with chemometrics.
In ‘calçots’, NIRS has been applied to determine some chemical properties (dry matter content,
soluble solid content, titratable acidity, and ash content), providing good results [24]. The present
study aims to investigate the usefulness of NIRS in the determination of sensory attributes of cooked
‘calçots’ as a further step in quality evaluation of ‘calçots’. To this end, we developed models to
estimate sweetness, fiber perception, and off‐flavors, the sensory attributes included in the ideotype
of ‘calçots’ promoted by the PGI.
2. Materials and Methods
2.1. Samples
The experiment used 85 samples of cooked ‘calçots’. Each sample comprised a set of 80
commercial ‘calçots’ (PGI regulations define commercial ‘calçot’ as having a compact white edible
base measuring 15–25 cm in length and 1.7–2.5 cm in diameter 5 cm from the root). To ensure
variation in sensory attributes and to take into account the influence of environmental factors on
quality traits [10], samples were harvested in different environments (inside and outside the PGI area)
at different harvesting times during three consecutive seasons: 2014–15, 2015–16, and 2016–17.
2.2. Sample Preparation
Samples were prepared as described by Simó et al. [3] Leaves were cut 4 cm above the ligule and
roots were removed. Then ‘calçots’ were cleaned with tap water to remove adhering soil. Samples
were roasted at 270 °C for 18 min using a convection oven (SALVA Kwik‐co). After cooking, the two
most external leaves were removed, and the lower, edible part was cut off and pureed with a mixer
(Taurus BAPI 850). Half the pureed samples were dried for 72 h at 60 °C and then ground to an
average particle size < 0.4 mm to obtain ground dried puree. The remaining pureed samples were
frozen with liquid nitrogen and stored at −20 °C until their sensory analysis and NIR registration.
2.3. Sensory Analysis
A panel of 8 trained judges used previously reported protocols for quantitative descriptive
sensory analysis [3] to analyze samples of ‘calçot’ puree. Briefly, in each session, judges used a semi‐
structured visual scale labeled from 0 to 10 to evaluate organoleptic descriptors (sweetness, fiber
perception, and off‐flavors) in 5 different samples. All tests were carried out in a room designed for
sensory tests that fulfilled the standards specified by the International Organization for
Standardization [25]. All samples were evaluated in duplicate.

Agronomy 2020, 10, 828 3 of 12
2.4. Spectral Measurement
NIR spectra of cooked ‘calçots’ were recorded from two types of preprocessed samples: puree
and ground dried puree as described by Sans et al. [24]. Spectra were registered with a
spectrophotometer (Foss NIRSystems model 5000, Silver Spring, MD, USA) equipped with a rapid
content analyzer module and Vision software, version 2.51. Spectra were recorded every 2 nm
between 1100 nm to 2500 nm and averaged from 32 scans. Puree samples were measured in
reflectance mode and ground dried puree was measured in transflectance mode. The spectrum was
expressed as log (1/R). Three spectra were registered for each sample and the average spectrum was
used for computations.
2.5. Data Analysis
Data were analyzed with the PLS_Toolbox v.8.21 (Eigenvector Research Inc., Wenatchee, USA)
and in‐house routines running under MATLAB R2017a (The MathWorks™ Inc., Natick, MA, USA).
In all cases, spectra from puree and ground dried puree were treated independently.
To ensure that significant variation had been detected for the three sensory attributes (sweetness,
fiber perception, and off‐flavors) evaluated by the tasting panel, sensory data were analyzed using
the analysis of variance (ANOVA) according to the following linear model:
𝑋 𝜇 𝑠 𝑝 𝑠𝑝 𝜀 (1)
where s is the sample factor and p the panelist factor. Both factors were considered fixed.
Prediction models were built using partial least squares (PLS) regression with the NIPALS
algorithm as implemented in PLS_Toolbox v.8.21 software. After exploring spectra by principal
component analysis (PCA) to detect clustering due to season or origin and outliers, samples were
randomly divided into 2 groups so that about 75% of the samples could be used for calibration and
25% for external validation.
To obtain the best PLS models, the following spectral pretreatments were tested to reduce
unwanted variation due to sources unrelated to the properties of interest: multiplicative scatter
correction (MSC), standard normal variate (SNV), Savitzky‐Golay (SG) first‐ and second‐order
derivatives with second order polynomial approximation, and different point window size. The
pretreated spectra and the values of the sensory attributes were mean‐centered before being
submitted to the regression algorithm. To increase the predictive accuracy of the models, the results
using both the full spectrum and specific spectral regions were compared. To select variables, interval
PLS (iPLS) was used [26], configuring the iPLS algorithm in stepwise forward mode, with interval
size of 1 variable and using between 10 and 50 intervals.
PLS regression models were evaluated using a venetian blind cross‐validation with 10 data
splits. Combinations of data pretreatments and different numbers of factors were tried out with the
aim of constructing a model with a good enough compromise among a low root mean square error
of calibration (RMSEC), low root mean square error of cross‐validation (RMSECV), high coefficient
of determination (R2), and low bias. The optimal PLS models were finally tested with the external
validation set (25% of the original samples) that had not been used for calibration. To estimate the
performance of the calibration model, the root mean square error of prediction (RMSEP) evaluated
with these samples was used. Also, the model’s predictive ability was assessed with the ratio of
performance to deviation (RPD) and the relative ability of prediction (RAP), calculated as follows:
RPDSDx
RMSEP (2)
RAP SD RMSEP
SD S (3)
where SDx is the standard deviation of the validation reference data and Sref is the standard error of
the reference method, which indicates the uncertainty of the analysis due to the panelist.

Agronomy 2020, 10, 828 4 of 12
The RPD is a dimensionless index widely used to evaluate NIRS models in agricultural products
[27]. The RAP takes into account both the error of NIRS prediction and the uncertainty of the
panelists’ evaluations; it has a value between 0 and 1 [28].
3. Results and Discussion
3.1. Sensory Analysis
In the ANOVA, both the sample and panelist factors, but not the interaction between them, were
significant (p < 0.05) for the three sensory attributes. The significance of the panelist factor indicates
that panelists were using the scales differently in their evaluations; this finding is common in
descriptive sensory analyses, and it is related to slight differences in the reference values that
panelists learn [29]. However, the lack of a significant interaction between the panelist and sample
factors indicates that the panel adequately discriminated between phenotypic differences.
Table 1 shows the means, standard deviations, and ranges of the sensory attributes scored by
the panel and divided into calibration and validation sets. To develop robust calibration models, it is
critical to obtain a wide range of values for each attribute to be correlated with the NIR measurements.
The values of the attribute sweetness were widely dispersed, reflecting the variability commonly
found in ‘calçots’. The values of the attributes fiber perception and off‐flavors were mostly at the
lower end of the scale, resulting in a narrower range, especially for the attribute off‐flavors; however,
these findings were expected because ‘calçots’ from BTL varieties usually have low values of these
attributes in comparison with ‘calçots’ from other onion varieties [3].
Table 1. Statistics (range, mean, and standard deviation) for the sensory attributes measured by the
trained panel in the calibration and validation sets.
Sensory Attribute Calibration Set (n = 64) Validation Set (n = 21)
Range Mean SD Range Mean SD Sref
Sweetness 3.40–8.11 6.41 1.02 3.59–8.15 6.48 1.30 0.32
Fiber perception 0.23–7.73 1.60 1.27 0.39–3.74 1.75 0.90 0.28
Off‐flavors 0.36–5.86 1.73 1.13 0.68–4.25 1.89 1.14 0.37
SD: standard deviation; Sref: standard error.
3.2. NIRS to Estimate Sensory Attributes
PCA of SNV‐pretreated spectra showed no clustering due to season or origin in the score plots
(results not shown). The first two principal components explained 92.09% and 89.70% of the variation
for puree and ground dried puree samples, respectively. No outliers were detected.
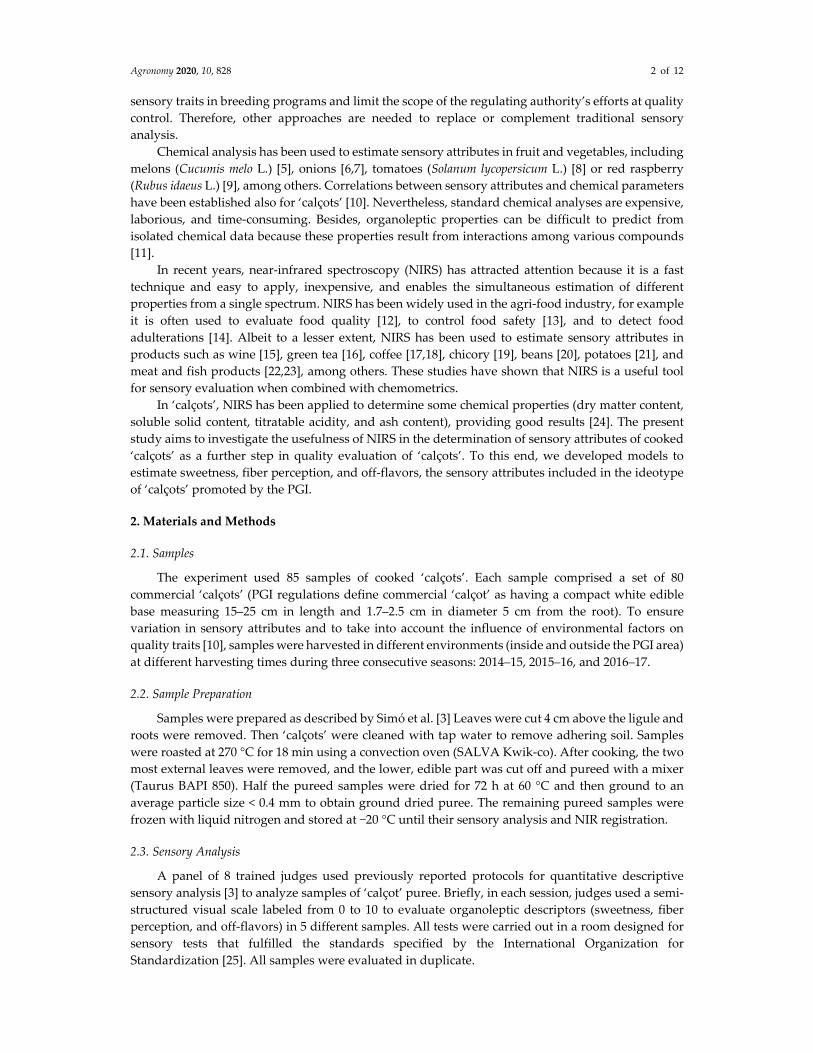
Figure 1 shows the raw and pretreated spectra measured from puree and ground dried puree
samples. As stated in a previous study [24], it is difficult to assign specific absorption bands to specific
functional groups, due to the complex composition of vegetables. The main difference between the
spectra from puree and ground dried samples is that the spectra from puree are strongly influenced
by water bands, have two characteristic absorption peaks around 1450 nm (stretch of the O–H bonds,
first overtone) and 1940 nm (stretch of the O–H bonds and O–H deformation). Water is a major
constituent of ‘calçots’, ranging its content between 79.9–87.3% for the samples registered. Since the
high water content in the samples could limit the use of NIRS due to the strong absorption bands that
predominate in the spectrum, we considered the alternative of using the spectra from ground dried
puree samples.
Agronomy 2020, 10, 828 5 of 12
Figure 1. (A) Raw spectra from puree and ground dried puree; (B) pretreated spectra (SNV) from
puree and ground dried puree.
First, PLS regression models to estimate the sensory attributes were developed, using the entire
spectral range and separately using spectra from either puree or ground dried puree samples. The
optimal number of PLS factors was established as that which did not significantly reduce the
RMSECV when the number of factors increased. Nevertheless, to prevent overfitting, the upper limit
of optimal PLS factors was set at one PLS factor per ten calibration samples, plus two [30]. The
performance of the models varied for each sensory attribute and for the two sample preparations. In
general, using the entire spectral range, the best prediction was for the attribute sweetness found
using spectra from puree (R2pred = 0.66 and RMSEP = 0.78). By contrast, PLS models yielded poor
results for the attribute off‐flavors, both using puree spectra (R2pred = 0.31 and RMSEP = 0.93) and
ground dried puree spectra (R2pred = 0.27 and RMSEP = 0.96), and for the attribute fiber perception
using ground dried puree spectra (R2pred = 0.26 and RMSEP = 0.87) (Table 2).

Agronomy 2020, 10, 828 6 of 12
Table 2. Statistical descriptors for near‐infrared spectroscopy (NIRS) determinations using all the
spectra.
Trait Spectra Pretreatment LVs R2cal RMSEC R2CV RMSECV R2pred RMSEP RPD RAP
Sweetness Puree m.c. 8 0.56 0.68 0.34 0.84 0.66 0.78 1.67 0.68
GD puree SG‐1D (15) + m.c. 9 0.75 0.51 0.49 0.74 0.57 0.98 1.32 0.46
Fiber perception Puree SG‐2D (21) + m.c. 5 0.69 0.71 0.43 0.99 0.55 0.63 1.43 0.57
GD puree SG‐2D (15) + m.c. 8 0.80 0.57 0.54 0.87 0.26 0.87 1.04 0.08
Off‐flavors Puree SNV + m.c. 8 0.53 0.77 0.24 1.03 0.31 0.93 1.22 0.37
GD puree m.c. 3 0.43 0.84 0.36 0.90 0.27 0.96 1.19 0.32
LVs: number of latent variables; R2cal: coefficient of determination of calibration; RMSEC: root mean
square error of calibration; R2CV: coefficient of determination of cross‐validation; RMSECV: root mean
square error of cross‐validation; R2pred: coefficient of determination of prediction; RMSEC: root mean
square error of prediction; GD puree: ground dried puree; m.c.: mean centering; SNV: standard
normal variate; SG‐1D: Savitzky‐Golay first‐order derivative; SG‐2D: Savitzky‐Golay second‐order
derivative; between parentheses: window size.
To improve the models developed using the entire spectral range, iPLS variable selection was
used (Figure 2, Table 3). Once again, sweetness was the parameter best predicted, in both puree
(R2pred = 0.66 and RMSEP = 0.76) and ground dried puree samples (R2pred = 0.72 and RMSEP = 0.73). In
general, iPLS improved the prediction of all the attributes, especially sweetness (ground dried puree)
and off‐flavors (Puree) (Tables 2 and 3).
Figure 3 plots NIRS‐predicted values for puree and ground dried puree versus reference values
of sensory attributes for the models developed using iPLS variable selection, which generally yielded
better predictions than the models calculated from the entire spectra. In general, for the sensory
attributes, PLS models developed from puree spectra yielded better predictions than those developed
from ground dried puree, with the exception of sweetness, where scant differences were found
between the two (Table 3). As stated before, we used ground dried puree samples spectra to develop
the regression models as an alternative considering the high water content of puree samples. In a
previous study, we found better prediction models using ground dried puree spectra for some
chemical parameters [24]. In this case, the better performance of the models developed from puree
can be explained because panelists evaluated the samples as a puree and the process of drying and
grounding probably changed the properties of the samples.

Agronomy 2020, 10, 828 7 of 12
Figure 2. The optimal combination (low RMSECV) of spectral intervals determined by iPLS variable
selection (dark gray) for puree (A–C) and ground dried puree (D–F).

Agronomy 2020, 10, 828 8 of 12
Table 3. Statistical descriptors for NIRS determinations using interval partial least squares (iPLS) variable selection.
Trait Spectra Pretreatment No. of Intervals LVs R2cal RMSEC R2CV RMSECV R2pred RMSEP RPD RAP
Sweetness Puree m.c. 15 9 0.65 0.60 0.54 0.70 0.66 0.76 1.71 0.70
GD puree SG‐1D (15) + m.c. 15 10 0.74 0.51 0.63 0.62 0.72 0.73 1.78 0.73
Fiber perception Puree SG‐2D (21) + m.c. 10 4 0.69 0.71 0.56 0.85 0.58 0.64 1.41 0.55
GD puree SG‐2D (15) + m.c. 15 8 0.88 0.44 0.82 0.53 0.42 0.82 1.10 0.20
Off‐flavors Puree SNV + m.c. 30 10 0.68 0.64 0.43 0.88 0.57 0.77 1.48 0.61
GD puree m.c. 20 2 0.45 0.83 0.40 0.86 0.20 1.02 1.12 0.22
LVs: number of latent variables; R2cal: coefficient of determination of calibration; RMSEC: root mean square error of calibration; R2CV: coefficient of determination of
cross‐validation; RMSECV: root mean square error of cross‐validation; R2pred: coefficient of determination of prediction; RMSEC: root mean square error of
prediction; GD puree: ground dried puree; m.c.: mean centering; SNV: standard normal variate; SG‐1D: Savitzky‐Golay first‐order derivative; SG‐2D: Savitzky‐
Golay second‐order derivative; between parentheses: window size.

Agronomy 2020, 10, 828 9 of 12
Figure 3. NIRS‐predicted versus panel score of sweetness, fiber perception, and off‐flavors, using iPLS
regression models for puree (A–C) and ground dried puree (D–F). Black symbols: validation samples,
white symbols: calibration samples.
The dimensionless parameter RPD is commonly used to evaluate the predictive ability of NIRS,
and the reliability of the model is commonly classified into three quality categories: excellent
(RPD > 2), fair (1.4 < RPD < 2), or poor (RPD < 1.4) [27,31]. According to these thresholds, the models
Agronomy 2020, 10, 828 10 of 12
developed could be considered useful for predicting sweetness from NIRS on puree and ground
dried puree and for predicting fiber perception and off‐flavors from NIRS on puree (Table 3).
However, these thresholds are not based on statistical analyses, and some researchers have used
much higher thresholds [27]. On the other hand, RPD values for sensory attributes are usually lower
than those for chemical or physical properties. For example, in the application of NIRS to estimate
sensory attributes in common beans, the best models developed presented RPD values between
1.19–1.90 [20]. In different meats, RPD values in almost all the cases were also lower than 1.5 [32].
Higher values of RPD (i.e., RPD > 2) were reported for some properties in sensory evaluation using
NIRS in cheese [33,34], wine [15], and chicory hybrids [19]. However, in some cases, RPD values were
calculated as the ratio of the SD to RMSECV, rather than by external validation of the models.
It is also important to remember that the use of RPD assumes that the errors of the reference
method are negligible, which is not the case with sensory analysis [15]. For this reason, previous
studies used the parameter RAP to relate the predictive ability of NIRS to the precision of the
panelistsʹ evaluation [20]. The models developed using iPLS variable selection for sweetness showed
values of RAP greater than 0.70 (Table 3), suggesting these models are reliable in predicting this
sensory attribute. The best models developed to estimate fiber perception and off‐flavors had RAP
values greater than 0.5, which are comparable to RAP values reported for other products, such as
beans [20], peas [35], or rice [36].
In balance, these results demonstrate the potential of NIRS in the evaluation of complex sensory
properties in cooked ‘calçots’, with a pretreatment as simple as pureeing the samples, which makes
it possible to homogenize many specimens representative of a stock, thus enabling a good average
evaluation with a limited number of registers. Although models developed to estimate sensory
attributes are less accurate than those developed to estimate chemical properties [24], used together
with PLS regression, NIRS promises to be useful for evaluating the sensory attributes of cooked
‘calçots’ in plant breeding or quality control.
4. Conclusions
Quality control and plant breeding programs need to analyze large numbers of samples and
rapid, inexpensive phenotyping methods are needed to enable the analysis of sensory attributes. Our
results show that it is feasible to use NIRS to estimate the most important sensory attributes in cooked
‘calçots’: sweetness, fiber perception, and off‐flavors. The best approach to predict these attributes
was using iPLS variable selection to develop predictive models from spectra from pureed cooked
‘calçots’, which yielded RPD values greater than 1.4 in all cases.
Although NIRS models are less robust for sensory attributes than for other properties such as
chemical composition, they can be used in the initial screening of samples of cooked ‘calçots’,
allowing the more time‐consuming and costly panel sensory analysis to be reserved for only when
more accuracy is needed. In the same way, NIRS can help detect materials that would clearly fail to
meet the standards of the PGI label, facilitating quality control and helping ensure customer loyalty.
In summary, NIRS promises to be a key tool to enable the analysis of sensory properties in ‘calçots’.
Author Contributions: Conceptualization, S.S. and J.S. (Joan Simó); formal analysis, J.F. and R.B.; investigation,
S.S. and J.S. (José Sabaté); methodology, S.S.; project administration, J.C.; supervision, J.S. (Joan Simó);
visualization, J.S. (Joan Simó); writing—original draft, S.S.; writing—review and editing, J.F., R.B., J.S. (José
Sabaté), J.C and J.S. (Joan Simó). All authors have read and agreed to the published version of the manuscript.
Funding: This research work was supported by the Secretaria d’Universitats i Recerca del Departament
d’Empresa i Coneixement (FI‐DGR 2015), ACCIÓ (Generalitat of Catalonia, RD14‐1‐004), ‘Cooperativa de Valls’,
‘Cooperativa de Cambrils’ and PGI ‘Calçot de Valls’.
Acknowledgments: The authors thank Manel Alcalà and his team for letting us use the laboratory equipment.
Conflicts of Interest: The authors declare no conflicts of interest.

Agronomy 2020, 10, 828 11 of 12
References
1. Simó, J.; Pascual, L.; Cañizares, J.; Casañas, F. Spanish onion landraces (Allium cepa L.) as sources of
germplasm for breeding calçots: A morphological and molecular survey. Euphityca 2014, 95, 287–300,
doi:10.1007/s10681‐013‐0995‐y.
2. EC No 905/2002. Commission Regulation (EC) No 905/2002 of 30 May 2002 Supplementing the ANNEX
to Regulation (EC) No 2400/96 on the Entry of Certain Names in the ‘Register of Protected Designations
of Origin and Protected Geographical Indications’ OJ L 142/2; European Commission: Brussels,
Belgium, 2002.
3. Simó, J.; Romero del Castillo, R.; Casañas, F. Tools for breeding “calçots” (Allium cepa L.), an expanding
crop. Afr. J. Biotechnol. 2012, 11, 11065–11073, doi:10.5897/ajb12.904.
4. Dawson, J.; Healy, G. Flavour evaluation for plant breeders. In Plant Breeding Reviews; Goldman, I.,
Ed.; John Wiley & Sons, Inc.: Hoboken, NJ, USA, 2018; pp. 15–261, doi:10.1002/9781119414735.ch5.
5. Escribano, S.; Sanchez, F.J.; Lazaro, A. Establishment of a sensory characterization protocol for melon
(Cucumis melo L.) and its correlation with physical‐chemical attributes: Indications for future genetic
improvements. Eur. Food Res. Technol. 2010, 231, 611–621, doi:10.1007/s00217‐010‐1313‐8.
6. Wall, M.M.; Corgan, J.N. Relationship between pyruvate analysis and flavor perception for onion
pungency determination. Hortscience 1992, 27, 1029–1030, doi:10.1021/jf011509w.
7. Crowther, T.; Collin, H.A.; Smith, B.; Tomsett, A.B.; O’Connor, D.; Jones, M.G. Assessment of the
flavour of fresh uncooked onions by taste‐panels and analysis of flavour precursors, pyruvate and
sugars. J. Sci. Food Agr. 2005, 85, 112–120, doi:10.1002/jsfa.1966.
8. Tieman, D.; Bliss, P.; McIntyre, L.M.; Blandon‐Ubeda, A.; Bies, D.; Odabasi, A.Z.; Rodríguez, G.R.; Van
Der Knaap, E.; Taylor, M.G.; Goulet, C.; et al. The chemical interactions underlying tomato flavor
preferences. Curr. Biol. 2012, 22, 1035–1039, doi:10.1016/j.cub.2012.04.016.
9. Aaby, K.; Skaret, J.; Roen, D.; Sonsteby, A. Sensory and instrumental analysis of eight genotypes of red
raspberry (Rubus idaeus L.) fruits. J. Berry Res. 2019, 3, 483–498, doi:10.3233/JBR‐190387.
10. Sans, S.; Casals, J.; Simó, J. Improving the Commercial Value of the ‘Calçot’ (Allium cepa L.) Landrace:
Influence of Genetic and Environmental Factors in Chemical Composition and Sensory Attributes.
Front. Plant Sci. 2018, 9, 1465, doi:10.3389/fpls.2018.01465.
11. Bayarri, S.; Costell, E. Sensory evaluation of fruit and vegetable Flavors. In Handbook of Fruit and
Vegetable Flavors; Hui, Y.H., Eds.; John Wiley & Sons, Inc.: Hoboken, NJ, USA, 2010; pp. 45–58.
12. Su, W.H.; He, H.J.; Sun, D.W. Non‐Destructive and rapid evaluation of staple foods quality by using
spectroscopic techniques: A review. Crit. Rev. Food Sci. 2017, 57, 1039–1051,
doi:10.1080/10408398.2015.1082966.
13. Qu, J.H.; Liu, D.; Cheng, J.H.; Sun, D.W.; Ma, J.; Pu, H.; Zeng, X.A. Applications of Near‐infrared
Spectroscopy in Food Safety Evaluation and Control: A Review of Recent Research Advances. Crit.
Rev. Food Sci. 2015, 55, 1939–1954, doi:10.1080/10408398.2013.871693.
14. Kamal, M.; Karoui, R. Analytical methods coupled with chemometric tools for determining the
authenticity and detecting the adulteration of dairy products: A review. Trends Food Sci. Tech. 2015, 46,
27–48, doi:10.1016/j.tifs.2015.07.007.
15. Cayuela, J.A.; Puertas, B.; Cantos‐Villar, E. Assessing wine sensory attributes using Vis/NIR. Eur. Food
Res. Technol. 2017, 243, 941–953, doi:10.1007/s00217‐016‐2807‐9.
16. Li, C.; Guo, H.; Zong, B.; He, P.; Fan, F.; Gong, S. Rapid and non‐destructive discrimination of special‐
grade flat green tea using Near‐infrared spectroscopy. Spectrochim. Acta A 2019, 206, 254–262,
doi:10.1016/j.saa.2018.07.085.
17. Ribeiro, J.S.; Ferreira, M.M.C.; Salva, T.J.G. Chemometric models for the quantitative descriptive
sensory analysis of Arabica coffee beverages using near infrared spectroscopy. Talanta 2011, 83,
1352–1358, doi:10.1016/j.talanta.2010.11.001.
18. Rocha‐Baqueta, M.; Coqueiro, A.; Valderrama, P. Method by near‐infrared spectroscopy for the
determination of the sensory attributes elicitedin professional coffee cupping. J. Food Sci. 2019, 84,
1247–1255, doi:10.1111/1750‐3841.14617.
19. François, I.M.; Wins, H.; Buysens, S.; Godts, C.; Van Pee, E.; Nicolai, B.; De Proft, M. Predicting sensory
attributes of different chicory hybrids using physico‐chemical measurements and visible/near infrared
spectroscopy. Postharvest Biol. Tec. 2008, 49, 366–373, doi:10.1016/j.postharvbio.2008.02.011.

Agronomy 2020, 10, 828 12 of 12
20. Plans, M.; Simó, J.; Casañas, F.; Romero del Castillo, R.; Rodriguez‐Saona, L.E.; Sabaté, J. Estimating
sensory properties of common beans (Phaseolus vulgaris L.) by near infrared spectroscopy. Food Res. Int.
2014, 56, 55–62, doi:10.1016/j.foodres.2013.12.003.
21. Van Dijk, C.; Fischer, M.; Holm, J.; Beekhuizen, J.G.; Stolle‐Smits, T.; Boeriu, C. Texture of cooked
potatoes (Solanum tuberosum). 1. Relationships between dry matter content, sensory‐perceived texture,
and near‐infrared spectroscopy. J. Agr. Food Chem. 2002, 50, 5082–5088, doi:10.1021/jf011509w.
22. González‐Mohino, A.; Antequera, T.; Ventanas, S.; Caballero, D.; Mir‐Bel, J.; Perez‐Palacios, T. Near‐
infrared spectroscopy‐based analysis to study sensory parameters on pork loins as affected by cooking
methods and conditions. J. Sci. Food Agric. 2018, 98, 4227–4236, doi:10.1002/jsfa.8944.
23. Nilsen, H.; Esaiassen, M. Predicting sensory score of cod (Gadus morhua) from visible spectroscopy.
LWT‐Food Sci. Technol. 2005, 38, 95–99, doi:10.1016/j.lwt.2004.05.001.
24. Sans, S.; Ferré, J.; Boqué, R.; Sabaté, J.; Casals, J.; Simó, J. Determination of chemical properties in
‘calçot’ (Allium cepa L.) by near infrared spectroscopy and multivariate calibration. Food Chem. 2018,
262, 178–183, doi:10.1016/j.foodchem.2018.04.102.
25. ISO 8589. Sensory analysis–General Guidance for the Design of Test Rooms; I. O. for Standardization:
Geneva, Switzerland, 2007.
26. Norgaard, L.; Wagner, J.; Nielsen, J.P.; Munc, L.; Engelsen, S.B. Interval partial least‐squares regression
(iPLS): A comparative chemometric study with an example from near‐infrared spectroscopy. Appl.
Spectrosc. 2000, 54, 413–419, doi. org/10.1366/0003702001949500.
27. Bellon‐Maurel, V.; Fernandez‐Ahumada, E.; Palagos, B.; Roger, J.M.; McBratney, A. Critical review of
chemometric indicators commonly used for assessing the quality of the prediction of soil attributes by
NIR spectroscopy. TrAC Trend. Anal. Chem. 2010, 29, 1073–1081, doi:10.1016/j.trac.2010.05.006.
28. Martens, M.; Martens, H. Near‐infrared reflectance determination of sensory quality of peas. Appl.
Spectrosc. 1986, 40, 303–310, doi:10.1366/0003702864509114.
29. Romano, R.; Brockhoff, P.B.; Hersleth, M.; Tomic, O.; Naes, T. Correcting for different use of the scale
and the need for further analysis of individual differences in sensory analysis. Food Qual. Prefer. 2008,
19, 197–209, doi:10.1016/j.foodqual.2007.06.008.
30. Ruiz‐Jimenez, J.; Priego‐Capote, F.; de Castro, M.D.L. FT‐midIR determination of fatty acid profiles,
including trans fatty acids, in bakery products after focused microwave‐assisted Soxhlet extraction.
Anal. Bioanal. Chem. 2006, 385, 1532–1537, doi:10.1007/s00216‐006‐0565‐4.
31. Jiang, H.; Chen, Q. Chemometric Models for the Quantitative Descriptive Sensory Properties of Green
Tea (Camellia sinensis L.) Using Fourier Transform Near Infrared (FT‐NIR) Spectroscopy. Food Anal.
Method. 2015, 8, 954–962, doi:10.1007/s12161‐014‐9978‐4.
32. Prieto, N.; Roehe, R.; Lavin, P.; Batten, G.; Andres, S. Application of near infrared reflectance
spectroscopy to predict meat and meat products quality: A review. Meat Sci. 2009, 83, 175–186,
doi:10.1016/j.meatsci.2009.04.016.
33. Karoui, R.; Pillonel, L.; Schaller, E.; Bosset, J.‐O.; De Baerdemae‐ ker, J. Prediction of sensory attributes
of European Emmental cheese using near‐infrared spectroscopy: A feasibility study. Food Chem. 2007,
101, 1121–1129, doi:10.1016/j.foodchem.2006.03.012.
34. Gonzalez‐Martin, M.I.; Severiano‐Perez, P.; Revilla, I.; Vivar‐Quintana, A.M.; Hernandez‐Hierro, J.M.;
Gonzalez‐Perez, C.; Lobos‐Ortega, I.A. Prediction of sensory attributes of cheese by near‐infrared
spectroscopy. Food Chem. 2011, 127, 256–263, doi:10.1016/j.foodchem.2010.12.105.
35. Kjolstad, L.; Isaksson, T.; Rosenfeld, H.J. Prediction of sensory quality by near‐infrared reflectance
analysis of frozen and freeze‐dried green peas (Pisum sativum). J. Sci. Food Agr. 1990, 51, 247–260,
doi:10.1002/jsfa.2740510212.
36. Windham, W.R.; Lyon, B.G.; Champagne, E.T.; Barton, F.E.; Webb, B.D.; McClung, A.M.;
Moldenhauer, K.A.; Linscombe, S.; McKenzie, K.S. Prediction of cooked rice texture quality using near‐
infrared reflectance analysis of whole‐grain milled samples. Cereal Chem. 1997, 74, 626–632,
doi:10.1094/CCHEM.1997.74.5.626.
© 2020 by the authors. Licensee MDPI, Basel, Switzerland. This article is an open access
article distributed under the terms and conditions of the Creative Commons Attribution
(CC BY) license (http://creativecommons.org/licenses/by/4.0/).