Embed Size (px)
Citation preview
Estimating Sand Bedload in Rivers by Tracking Dunes: acomparison of methods based on bed elevation time-seriesKate C.P. Leary1,2 and Daniel Buscombe3
1Department of Geography, University of California Santa Barbara, Santa Barbara, CA, USA.2Department of Earth and Environment Sciences, New Mexico Tech, Socorro, NM, USA.3Sch. Earth & Sustainability, Northern Arizona University, Flagstaff, USA, AZ.
Correspondence: Kate Leary ([email protected])
Abstract. Quantifying bedload transport is paramount to the effective management of rivers with sand or gravel-dominated
bed material. However, a practical and scalable field methodology for reliably estimating bedload remains elusive. A popular
approach involves calculating transport from the geometry and celerity of migrating bedforms, extracted from time-series
of bed elevation profiles acquired using echosounders. Various echosounder sampling methodologies of how to extract bed
elevations::::::::elevation profiles exist. Using two sets of repeat multibeam sonar surveys with large
:::high
:spatio-temporal resolution5
and coverage, we compute bedload using three field techniques (one actual and two simulated) for acquiring bed elevation
profiles: repeat multi-, single-, and multiple single-beam sonar. Significant differences in flux arise between repeat multibeam
and single beam sonar. Mulitbeam and multiple single beam sonar systems can potentially yield comparable results, but the
latter relies on knowledge of bedform geometries and flow that collectively inform optimal beam spacing and sampling rate.
These results serve to guide::as
:a:::::guide
:::for
:design of optimal sampling , and for comparing transport estimates from different10
sonar configurations.
Copyright statement. TEXT
1 Introduction
Bedload is usually a significant proportion of total load in rivers with sand and/or gravel-dominated bed material, and the
relative importance of suspended load and bedload often changes with flow and the location within the channel (e.g. ?)15
:::::::::::::::(e.g. Gomez, 1991). Whereas instrumentation and protocols for sampling suspended sediment loads are relatively well es-
tablished (e.g. Nolan et al., 2005; Wren et al., 2000; Edwards and Glysson, 1999), reliable estimates of bedload are more
difficult to obtain because bedload in transport is difficult to sample directly (e.g. Emmett, 1980; Gomez, 1991), define (e.g.
Church, 2006; Yang, 1986), or estimate with empirical formulas (e.g. Van Rijn, 1984; Martin and Church, 2000). Therefore, the
effectiveness of sediment management in river systems is often predicated on the accuracy and representativeness of available20
bedload measurements.
1

Reliable estimates of bedload transport have been shown to result from application of the Exner equation (Simons et al.,
1965; Engel and Lau, 1980) to time-series of bed elevation profiles (Simons et al., 1965; Van Den Berg, 1987; Dinehart, 2002;
Villard and Church, 2003; Wilbers and Ten Brinke, 2003; Claude et al., 2012; Guala et al., 2014) acquired with an echosounder.
Simons et al. (1965) first showed that bedload flux can be estimated by tracking the average celerity, Vc, of the downstream
migration of dunes with a known average height, H, and average length, λ. These variables are averaged over a field of dunes5
to satisfy the necessary assumptions that suspended sediment load, qs, is in equilibrium (dqs/dx= 0), and with continuity of
mass (dqb/dx+dη/dt= 0), where x and η are downstream distance and bed elevation, respectively (Simons et al., 1965). The
Simons et al. (1965) approach therefore quantifies only the first-order bedload flux due to dune translation, not accounting for
any exchanges in bed material load between suspended and bedload fractions that deform the dune and may contribute to net
transport (McElroy and Mohrig, 2009).10
Complicating matters, however, is the inherent variability of bedform size a::and
:shape in natural river systems (?). Sediment
and water discharge conditions , vary continuously in natural rivers causing bed morphology to be out of equilibrium with pre-
vailing flow conditions. Numerous field studies suggest that bedform disequilibrium is likely the norm rather than an exception
in natural river systems (e. g., Frings and Kleinhans, 2008; Julien et al., 2002; Ten Brinke et al., 2009; Wilbers and Ten Brinke,
2003; Fielding et al., 2009).::::::::::::::::::::::::::::::::::::::::::::::::::::::::::::::::(e.g. ?Julien et al., 2002; Wilbers and Ten Brinke, 2003; Ten Brinke et al., 1999)
:. Even with these15
complications, bedload flux estimated from translating dunes remains one of the most accurate bedload estimate techniques
for sand-bedded rivers::::::::::::::::::::::::::::::::::::::::::::::(Nittrouer et al., 2008; Wilbers and Ten Brinke, 2003; ?) and as such bed elevation measurements are
of great importance.
In practice, bed elevation profiles might be acquired in three ways using echosounders: repeat multibeam, single-beam, and
multiple single-beam sonar (Fig. 1A). Repeat multibeam measures::::::surveys
:::::::measure
:a spatially extensive three-dimensional20
bed, η(x,y, t), from a moving vessel, from which it is possible to independently and simultaneously estimate Vc, H , and
λ. Single beam systems measure a one-dimensional bed, η(t), at a single (x,y) location using a stationary (fixed reference
frame) sonar. Single-beam echosounder::::::::::echosounders
:have also been used to acquire data from a moving vessel (specifically
for longitudinal profiles in shallow environments). The study presented herein does not address bed elevation profiles and
resulting flux estimates calculated from moving vessel single beam methods. Lastly, multiple single-beam measures::::::surveys25
:::::::measure a spatially limited three-dimensional bed, η(x,y, t), at a few (x,y) locations using stationary sonar. All three sampling
methodologies have been and are currently employed to collect bed elevation data in experimental (Blom et al., 2003; Van der
Mark et al., 2008; Guala et al., 2014; Curran et al., 2015),:::::natural
:fluvial (Simons et al., 1965; Ten Brinke et al., 1999; Ashworth
et al., 2000; Julien et al., 2002; Parsons et al., 2005; Gaeuman and Jacobson, 2007; Nittrouer et al., 2008; Claude et al., 2012;
Shugar et al., 2010; Rodrigues et al., 2015; Wintenberger et al., 2015; Huizinga, 2016; Kaplinski et al., 2017; Buscombe et al.,30
2017; Hackney et al., 2018), and estuarine/coastal environments (Villard and Church, 2003; Hoekstra et al., 2004; Schmitt and
Mitchell, 2014).
There are practical benefits and drawbacks to each data collection method. Repeat multibeam is spatially extensive, but
relatively expensive, only practical in relatively deep, safely navigable rivers, and limited in temporal coverage. Therefore, the
use of in situ stationary echosounders (also called altimeters, here referred to as single beam and multiple single beam systems)35
2
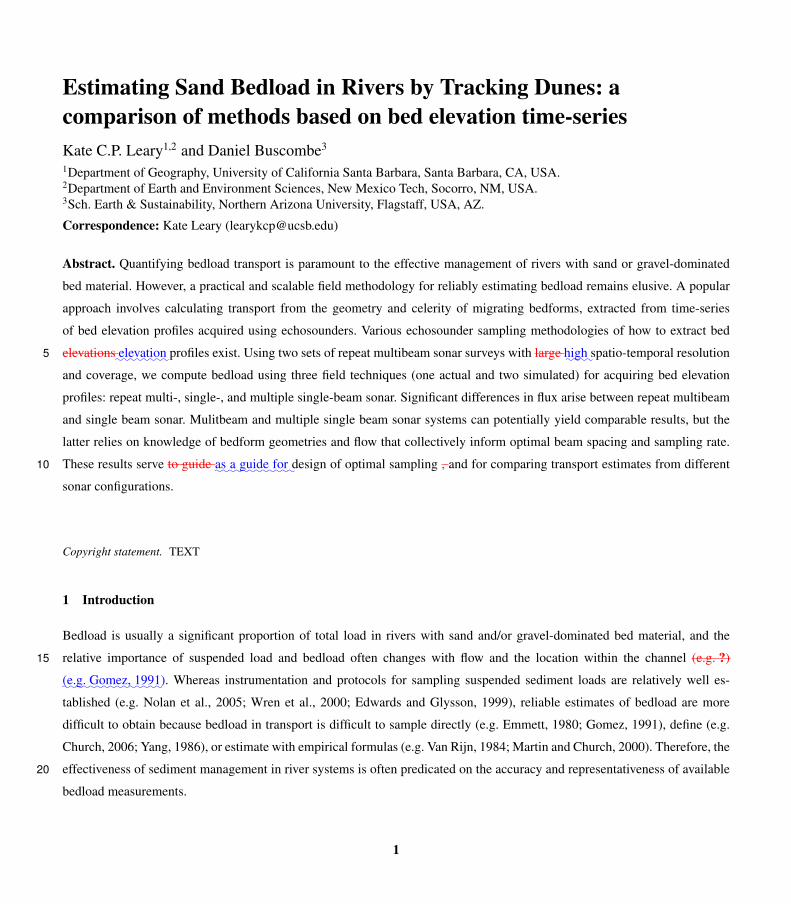
is becoming an increasingly popular alternative (Gray et al., 2010). These systems are especially useful in shallow water, are
less expensive than multibeam systems, and generating::::::generate
:longer time-series (e.g. Moulton et al., 2014). However, only
measuring the bed elevation at a single location means it is not possible to resolve Vc, H , and λ simultaneously .:::and,
:::::since
::::space
::::and
::::time
:::are
::::not
:::::::linearly
::::::::::substitutable
:::::::(Guala
::et
:::al.,
::::::2014),
:::not
:::::trivial
:::to
:::::::estimate
::λ
:::::from
::Vc:::
or::::vice
:::::versa.
:This has
implications for bedload estimates that are explored in this paper.5
Since different methodologies may be employed to collect bed elevation profiles, and thus calculate bedload transport rates, it
is important that resulting bedload flux estimates are compared to test for consistency. Do differences in sampling methodology
cause systematic differences in bed elevation profiles and bedload flux estimates? Are different sampling methods equally able
to measure/account for bedform disequilibrium dynamics? How does bedform disequilibrium:::::::changes
::in
:::::::bedform
::::size
::::and
:::::shape
::::with
:::::::changing
:::::flow
:::::::::conditions?
::If::::not,
::::how
::do
:::::::changes
::in
::::::::bedform
:::size
:affect the bed elevation measurements made by10
different types of echosounders?
Presently, it is unclear how differences in bed elevation data acquired with different methodologies translate to the fidelity
with which dune migration is captured, and finally to bedload transport estimates. Furthermore, multibeam, single beam, and
multiple single beam datasets do not generally exist in the same location and time, making direct comparison of these datasets
difficult. In order to examine these issues, we establish a virtual experiment using a repeat multibeam dataset to directly15
compare bedload transport estimates calculated from bed elevation profiles extracted to mimic the three different field survey
methodologies outlined above.
2 Methods
2.1 Study Area and Survey Data
We use an extensive repeat multibeam dataset consisting of bed elevation from a large area of migrating dunes at high spatio-20
temporal resolution. Data come from a approx. 300 m long by 40 m wide reach upstream of the Diamond Creek USGS gage
site on the Colorado River in Grand Canyon National Park (Fig. 1B, 1C), where flows are regulated by releases through Glen
Canyon Dam 385 km upstream.::::Flow
::::::depths
::at
:::the
::::::::::downstream
::::::extent
::::::ranged
::::from
:::::6.8m
:::on
:::the
::::::lowest
::::flow
::of
::::310
::::::m3/s,
:::and
::::7.9m
:::on
:::the
::::::highest
::::flow
:::of
:::590
::::::m3/s,
:::::::although
:::::there
:::are
::::::deeper
::::holes
::::::within
:::the
::::::::surveyed
:::::reach.
:We simulate data from
simultaneous single beam and multiple single beam deployments by extracting time-series of bed elevations from the repeat25
multibeam datasets (Fig. 1D). This ‘virtual echosounder’ experiment allows us to directly compare flux estimates from all
three methodologies. We assess the relative accuracy of the single beam and multiple single beam techniques at estimating
bedload transport compared to repeat multibeam-derived bedload, and suggest practical guidelines for developing sampling
and processing protocols that maximize accuracy.
Repeat multibeam surveys were collected at two different discharges (Fig. 2A) from just upstream of the Diamond Creek30
USGS gage site (Fig. 1C). All bathymetric data were collected using a Teledyne-Reson 7125 multibeam echosounder, with
sensor attitudes provided by a vessel-mounted inertial navigation system, and positions telemetered to the survey vessel at 20
Hz using a robotic total station situated onshore on monumented control. Data were collected with a 50% overlap between
3

adjacent sweeps, providing up to 1000 individual soundings per meter-squared. Each sounding was edited manually. Further
details of this system, survey, and processing methods are given by Buscombe et al. (2014; 2017) and Kaplinski et al. (2017).
The channel bed was entirely composed of fine to medium sand with no gravel patches (Buscombe et al., 2017). At each
discharge, data were collected every 6-10 minutes for 12 hours. A digital elevation model of the riverbed was produced for
each survey, using coincident 0.25x0.25 m grids. The March 2015 (around 283 m3s-1) and July 2015 (around 566 m3s-1)repeat5
multibeam surveys occured during mostly increasing and decreasing hydrographs, respectively(Fig. 2A). The precision of the
repeat surveys was high, with mean cell elevation standard deviation of 0.012m computed over rocks known to be immobile
(Kaplinski et al., 2017).
2.2 Extraction of Bed Elevation Profiles
A 35 x 30 m subsection in approximately the middle of the area surveyed by the repeat multibeam was selected for detailed10
bedload analyses using repeat multibeam, single beam, and multiple single beam bed elevation profiles (Fig. 1C). This sub-
section was then divided into 40 different repeat multibeam bed elevation profiles (8.67 m in length, 3.67 m lateral spacing
from one another; Fig. 1D) for March and 20 different repeat multibeam bed elevation profiles for July (17.34 m in length,
3.67 m lateral spacing from one another; Fig. 1D). The length of the bed elevation profiles was determined by considering
the maximum dune wavelength. All repeat multibeam bed elevation profiles were detrended using the bedform tracking tool15
(BTT) developed by van der Mark et al. (2008). This tool detrends each BEP:::bed
::::::::elevation
:::::::profiles
:::::(BEP)
:using a weighted
moving averageand extracts bedform height and wavelength data. This produced 2, 720 individual repeat multibeam bedload
transport estimates (and daily averages from the 40 bed elevation profiles)for March and 1, 740 individual bedload transport
estimates (and 20 daily averages) for July.:.::::After
:::the
:::::BEPs
:::are
:::::::::detrended,
:::the
::::BTT
::::::::::determines
:::the
::::zero
:::::::::upcrossing
:::(i.e.
::::::points
:at::::::which
:::the
:::::profile
::::::::positively
:::::::crosses
::::zero)
::::and
:::zero
::::::::::::downcrossing
:::(i.e.
::::::points
::at
:::::which
:::the
:::::profile
:::::::::negatively
::::::crosses
:::::zero).
::::The20
:::::::locations
::of
:::::crests
::::and
::::::troughs
:::are
::::::::::determined
::in
:::the
::::::original
:::::BEP
::as
:::::::follows:
:a::::crest
::is
::::::located
::at:::the
:::::::::maximum
:::::value
:::::::between
:a::::zero
:::up-
::::and
::::zero
::::::::::::downcrossing;
:::and
::::vice
::::::versa,
:a::::::trough
::is
::::::located
::at:::the
:::::::::minimum
:::::value
:::::::between
:a:::::
zero:::::down-
::::and
::::zero
:::::::::upcrossing.
::::::::Bedform
:::::height
::is:::::::::calculated
::at
:::the
:::::::vertical
:::::::distance
:::::::between
::::crest
::::and
::::::::::downstream
::::::trough.
::::::::Bedform
::::::::::wavelength
:is:::::::::calculated
::as
:::the
:::::::distance
:::::::between
::::two
:::::::::successive
:::::crests.
:::For
::a::::more
:::::::detailed
::::::::::explanation
::of
:::the
::::BTT
::::::please
::::refer
::to
::::van
:::der
::::Mark
::et:::al.
::::::(2008)
:::and
:?:.25
Whereas repeat multibeam analyses can be carried out in two dimensions (Nittrouer et al., 2008; Abraham and Pratt, 2010;
Abraham et al., 2011; Shelley et al., 2013), analyses were deliberately carried out using one-dimensional transects oriented
with flow direction, so any anisotropic effects in flux (caused by dunes not aligned perpendicular to the flow) affected repeat
multibeam, single beam and multiple single beam results equally.We have chosen not to incorporate the ISDOTTv2 dune
differencing method (Abraham and Pratt, 2010; Abraham et al., 2011; Shelley et al., 2013) into the analyses presented herein30
as the resources to do so are not currently publicly available. We do, however, incorporate the missing triangles correction
formulated by Shelley et al. (2013) into our calculations of bedload flux (see section 2.3, Equation 2).
Virtual single beam and multiple single beam echosounders were placed at the downstream end of each repeat multibeam
BEP (Fig. 1D). multiple:::::::Multiple single beams have four virtual beams, one of which is the same beam location as the single
4

beam virtual echosounders. Two different beam spacings were explored: 1) 0m-0.56m-1.16m-1.74m and 2) 0m-1.74m-3.48m-
5.22m.
2.3 Calculating Bedload Transport
Bedload transport, qb (m3s-1), was calculated using the Simons et al. (1965) formulation based on the two-dimensional Exner
equation (Paola and Voller, 2005) for bed sediment mass conservation, assuming triangular dunes:5
qb = (1− p)VcH
2− qe − q0 (1)
where p is the porosity of the sand (0.35 was used here) and q0 is a constant of integration (set to zero here; see McElroy
and Mohrig (2009) for a discussion of the potential physical meaning of this term). The original formulation of (1) has been
validated and extended by numerous studies (e.g. Willis and Kennedy, 1975; Engel and Lau, 1980; Havinga, 1983), most
recently by Shelley et al. (2013) who proposed the addition of the qe term, defined as:10
qe =V 2c ∆tH
2λ(2)
where ∆t is the change in time between successive surveys.:::::::::Physically,
::qe::::::::
represents:::an
::::area
::of
::::::::::::underpredicted
::::::::transport
::in
:::the
::::::original
:::::::Simons
::et
::al.
::::::(1965)
::::::::::formulation.
:::::::Shelley
:et:::al.
::::::(2013)
::::::::developed
::qe::
to:::::::account
:::for
:::that
:::::::missing
::::area,
::::::which
:is::::::::typically
:a:::::small
:::part
::of
:::the
::::flux,
:::::::perhaps
:::::::::negligible
:::::within
::::::overall
:::::error
::in
::::flux..
:Note that Eq. (1) is averaged over a field of dunes .
:::(i.e.
::the
::::bed
::::::::elevation
::::::profile).
:15
The primary variables in the above equations are calculated differently for each type of bed elevation profile. For repeat
multibeam, H and λ are calculated directly using the BTT. Vc is calculated using a cross-correlation of two consecutive bed
elevation profiles (McElroy and Mohrig, 2009; Engel and Lau, 1980).::::Using
::::Eq.
::1,
:::we
:::::::::calculated
:::::2,720
:::::::::individual
::::::repeat
:::::::::multibeam
::::::bedload
::::::::transport
::::::::estimates
:::for
::::::March
:::and
:::::1,740
:::::::::individual
:::::::bedload
::::::::transport
::::::::estimates
::for
:::::July.
:::::These
:::::::::individual
::::::bedload
::::::::transport
::::::::estimates
:::::were
::::then
::::::::averaged
::to
::::::::generate
::40
:::::::average
:::::daily
:::::::bedload
::::::::transport
::::::::estimates
::in::::::
March::::
and:::2020
::::::average
:::::daily
::::::::discharge
::::::::estimates
::in
::::July.
Single beam data consists::::::consist of time-varying elevation only (Fig. 1A, 1F) therefore λ must be estimated independently.
This might be done by measuring dune wavelengths in the field (for example, by wading, SCUBA, or using a boat-mounted
sonar or ADCP) while installing or maintaining the echosounder. To simulate such an exercise, we use the daily average
wavelength calculated by the BTT from the repeat multibeam survey directly upstream of the virtual single beam echosounder.25
Celerity (Vc) is:
Vc =λ′
T(3)
where T is the period, and λ′ is the estimated average wavelength.
For multiple single beam data, average period and height can be measured directly from the bed elevation profiles, whereas
(Vc) may be estimated in one of three different ways. The first, “original method":”, is the same as Eq. (3), in which each30
beam is treated as a separate BEP to produce four estimates of transport that are then averaged. The second “cross-correlation
5

method":”:is to use a cross-correlation of bed elevation profiles measured by two different beams to find the spatial offset or
‘lag’, l, between translated dunes:
Vc =D
l ∗∆t(4)
where D is the distance between sensors. In a field situation, this is constrained by practical considerations, but here we are
free to vary D to evaluate its effects. This method produces six estimates of bedload transport (from six pairs of four beams),5
as does the third, “manual method", in which velocity is:
Vc =D
tm2 − tm1(5)
where tm1 and tm2 are manually picked times at which a crest appears at each beam.
2.4 Sinusoid Model of Growing::::::::Bedform
:::::::Growth
:and Shrinking Bedforms
:::::Decay
To test the affects of bedform disequilibrium (i.e.:::the adjustment of bedform height and length to changing flow conditions),10
a simple sinusoid model was used to simulate time-varying dune height and wavelength. Each detrended bed elevation series
was approximated by:
η =Asin(B+Cx) (6)
Dune growth/decay was controlled by varying A (amplitude) and C (wavelength). Dune translation was controlled by B (shift).
Dune wavelength was estimated from dune height according to the regressions of the relationship between bedform height and15
wavelength for each survey day (Figure 2C). Using Eq. (6), sinusoid single beam bed elevation profiles are constructed from
the synthetic elevation series, η, at a single location, x. These profiles were then used to calculate synthetic single beam bedload
transport estimates using Eq. (1) and (3). The average λ and H were used in these calculations to replicate the methods used
for the virtual echosounder experiment. Synthetic repeat multibeam bedload transport rates are then calculated using Eq. (1).
:::We
::::then
:::take
:::the
::::ratio
:::of
:::::::synthetic
:::::::::multibeam
:::::::bedload
::::::::transport
::::::::estimates
::to
:::::::synthetic
::::::single
::::beam
:::::::bedload
::::::::transport
::::::::estimates20
:::and
:::use
::::that
::::ratio
::as
::a
::::::::correction
::::fact
:::for
:::our
:::::actual
::::::::::::measurements
::::(i.e.
:::::::multiply
:::the
::::::actual
:::::single
:::::beam
::::::::estimates
::by
:::the
:::::ratio
:::::::::determined
::in
:::the
:::::::sinusoid
:::::::model).
3 Results
3.1 Dune Field Characteristics
Bedform height (wavelength) averaged 0.17m (2.38m) and 0.36m (::in
::::::March
::::and
::::July,
:::::::::::respectively.
::::::::Bedform
::::::::::wavelength25
:::::::averaged
::::::2.38m
::::and 5.1m ) in March and July, respectively. Dune geometry was highly variable during both survey days,
with standard deviations of bedform height (wavelength) of 0.05m (0.4m) in March and 0.2m (2.7m) in July. Discharge along
the Colorado River in Grand Canyon fluctuates daily as a result of daily release flows from Glen Canyon Dam. In response to
6

changes in discharge, bedform size almost doubled over the course of the survey in March and almost halved over the course
of the survey in July (Fig. 2B). Due to the greater discharge, the bedforms in July are larger in height and wavelength (Fig. 2C)
compared to those in March. A space-time plot of bed elevations shows bedform heights and wavelengths increasing over the
duration of sampling in March (Figure 2D). Bedform crest traces become less frequent as bedform troughs deepen. In contract,
a space time:::::::contrast,
::a
:::::::::space-time plot of bed elevations in July shows bedfrom
:::::::bedform heights and wavelengths decreasing5
throughout the survey period (Figure 2D).
3.2 Repeat Multibeam v. Single Beam
We consider the repeat multibeam-derived bedload estimates to be the most accurate because the superior spatio-temporal
coverage of these data allow for simultaneous resolution of Vc, H, and λ. Single beam-derived daily bedload transport rates
are underestimated relative to repeat multibeam in March, and overestimated in July (Fig. 2E). This could be caused either by10
mischaracterization of Vc, H, or λ in either repeat multibeam or single beam calculations, or in both.
The most likely source of error in the repeat multibeam calculations occurs when calculating Vc. To investigate whether
cross-correlation correctly measured translation of dunes, l was manually calculated from repeat multibeam bed elevation
profiles and::by
:::::::picking
:::the
::::::::locations
::of
::::::crests
:::and
:::::::tracking
:::::them
::::and then used to calculate bedform celerity. This showed
that cross-correlation-derived Vc were underestimated in both March and July (Fig. 3A). This underestimation is much larger15
in July, when dunes were adjusting to decreasing flow conditions and deforming at a greater rate. This result indicates that
caution should be exercised when using cross-correlation to derive Vc, especially during higher transport stages. The regressions
between manual and cross-correlation computed Vc (Fig. 6:::3A) are used to calculate a lag-corrected celerity and lag-corrected
bedload transport rates::for
:::the
:repeat multibeam data (Fig. 5
::2E). Correcting repeat multibeam estimates for cross-correlation
lag errors results in 1.6% and 33.9% error for March and July, respectively. Percent error will be expressed relative to repeat20
multibeam-corrected lag flux estimates for the remainder of this paper.
Even with the lag-correction applied, discrepancies exist between repeat multibeam and single beam flux::::::bedload
::::::::transport
estimates due to errors estimating Vc from estimated wavelength and observed period. In March, period computed from single
beam data is overestimated relative to repeat multibeam period, causing Vc, and therefore transport, to be underestimated. The
opposite is true for the July data (Fig. 3B).25
These discrepancies in observed period are likely linked to the bed responding rapidly to unsteady flows during each survey
(Fig. 2A), with changes in discharge causing commensurate changes in H (Fig. 2B) and λ (Fig. 2C). This suggests that dunes
in disequilibrium (i.e. growing/shrinking):::::::adjusting
:::to
:::::::unsteady
::::flow
:::::::::conditions
:apparently distort the period observed in the
single beam data, which would invalidate the assumption made in Eq. (3) that the daily average wavelength (or any invariant
measure of wavelength) is representative.30
3.3 Single Beam Correction from Sinusoid Model
To test the above hypothesis, synthetic repeat multibeam and single beam flux::::::bedload
::::::::transport estimates calculated from the
growing::::::bedform
::::::growth/shrinking sinusoid models
:::::decay
::::::madels
:are compared. Single beam bed elevation profiles of growing
7
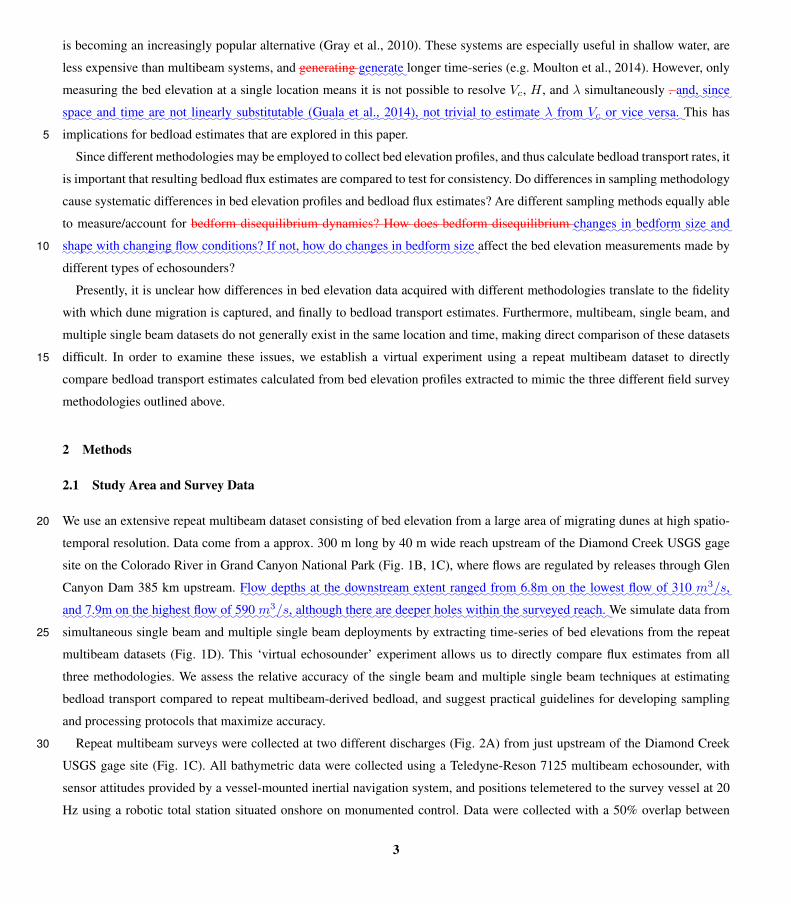
and shrinking::::::::decaying sinusoids display significantly different distributions of period compared to the assumption of constant
bedform wavelength (Fig. 3C). When bedforms are in disequilirbium the period recored by the signle::::::::adjusting
::to
:::::::changes
::in
::::flow
::::::::conditions
::::the
:::::period
::::::::recorded
:::by
:::the
:::::single
:beam profile changes to either be longer or shorter depending on whether
the dunes are growing or shrinking::::::::decaying, which effects bedload transport measurements. As dunes grow or shrink
::::decay,
the ratio of synthetic repeat multibeam to synthetic single beam bedload transport increases or decreases, respectively. The5
maximum sinusoid repeat multibeam-to-single beam ratio for growing (shrinking):In:::
the::::::::
sinusoid::::::model,
:::the
::::::::maximum
:::::ratio
::of
::::::::synthetic
:::::repeat
:::::::::multibeam
:::to
:::::::synthetic
::::::single
:::::beam
:::::::bedload
::::::::transport
::::rates
:::for
::::::::growing
:::and
::::::::decaying
:dunes is 1.2 (
:::and
0.75):,::::::::::respectively. Applying these ratios as correction factors to the single beam estimates
:::(i.e.
::::::::::multiplying
:::the
::::::single
:::::beam
:::::::estimates
:::by
:::::these
::::::ratios) generates sine-corrected single beam transport estimates (Fig. 2E), resulting in a decrease of the
discrepancy between repeat multibeam and single beam derived bedload::::::::transport
::::rates
:from 45.3% to 27.7% in March and10
from 38.9% to 10.7% in July.
3.4 Repeat Multibeam v. Multiple Single Beam
Another potential practical solution to minimizing the distortion of period in single beam surveys is to use a multiple single
beam echosounders in a spatial array (Figure 1). By increasing the spatial resolution of bed elevation data, multiple estimates
of bedload may be obtained, as well as multiple options for computing Vc (Eq. (3) through (5)), two of which (Eq. (4) and (5))15
do not require a priori estimation of:::::::bedform
::::::::::wavelength (λ′). We expect the period recorded by each beam to be similarly
affected by growing/shrinking:::::::decaying
:dunes as were the single beam periods. We therefore apply the same sine correction
from above to multiple single beam flux estimates calculated with the “original method":”. Fig. 4A shows these results for the
beam spacing of 0, 0.56, -1.16, and -1.74::::1.16,
:::and
::::1.74
:m for the three methods for computing celerity, and Fig. 4B shows the
bedload transport estimates using a larger beam spacing and Eq. (5) only. The original method of calculating celerity (Eq. (3))20
produces an average percent error of 13.3% and 15.8% in March and July, respectively; suggesting that increasing the number
of beams and incorporating a sinusoid correction can mitigate discrepancies with repeat multibeam estimates.
The cross-correlation method (Eq. (4)) systematically over-estimates bedload transport in both March (43.4% error) and
July (108.4% error), suggesting that the lag is systematically underestimated, and hence overestimating celerity. The manual
method (Eq. (5)) yields a small mismatch between multiple single beam and repeat multibeam derived bedload in March (1.3%25
error) but a 62.9% error in July. This could be related to beam spacing, because the bedforms (and bedload mismatches) in
the July data are much larger than those in March. This could cause greater celerity because only between 10 and 30% of the
dune wavelength is being captured by the multiple single beam with the smaller sonar spacing, increasing to 30-100% with
the larger spacing of 0-1.74-3.48-5.22 m (Fig. 4B). However, increasing beam spacing does not fully resolve discrepancies
between repeat multibeam and multiple single beam bedload estimates (36.6% error; Fig. 4B), suggesting another factor is30
contributing to the observed discrepancies, most likely temporal resolution.
Using a linear interpolation we increase the temporal resolution of the data from 6 to 3 minutes. At this new sampling
frequency, the original method yields a 2% error in March, but continues to overestimate bedload transport in July (67.5%
error; Fig. 4C). Increasing the temporal resolution of the data results in more accurate estimates of lag. The cross-correlation
8

method yields a 6.8% error in March and a 16.3% error in July (Fig. 4D:::4C), suggesting that the temporal resolution of the
multiple single beam data will cause variation in cross-correlation-derived estimates of Vc.
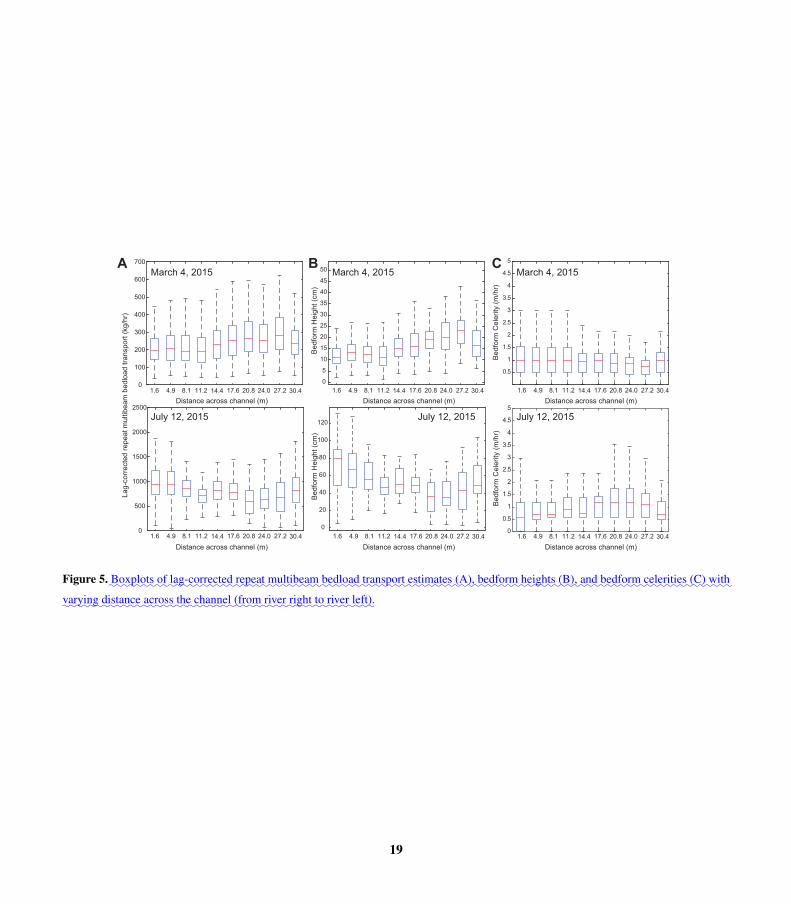
3.5::::::
Lateral:::::::::variations
::in
:::::::::calculated
:::::::bedload
:::::::::transport
:::::rates
:::We
:::also
::::::::consider
::::how
:::::::bedload
:::::::transport
:::::rates
::::vary
::::with
:::::::distance
::::::across
:::the
::::::channel
:::::(Fig.
:::5).
::::::During
:::the
::::::March
::::::survey,
:::::mean
::::::bedload
::::::::transport
::::rates
:::::were
:::::::slightly
:::::higher
:::on
::::river
:::left
:::::::::compared
::to
::::river
:::::right
::::(Fig.
::::5A).
::::We
:::see
:a::::::similar
:::::::pattern
::in
:::::mean5
:::::::bedform
:::::height
:::::(Fig.
:::5B)
::::but
::no
:::::::::::recognizable
::::::pattern
::in
:::::mean
::::::::bedform
::::::celerity
:::::(Fig.
::::5C).
::In
:::the
::::July
::::::survey,
:::::mean
::::::::bedform
:::::::transport
:::::rates
:::are
:::::::slightly
:::::larger
:::on
:::the
:::on
::::river
:::::right
::::than
:::on
::::river
::::left
::::(Fig.
:::::5A).
::::This
::is
:::::again
::::::::reflected
::in
:::the
::::::::bedform
:::::height
::::::::::distributions
:::::(Fig.
:::5B)
:::but
:::not
:::the
::::::::bedform
::::::celerity
:::::::::::distributions
::::(Fig.
::::5C).
:::We
::::also
:::::::observe
:::::::changes
::in
:::the
:::::shape
::of
:::the
::::::::::distributions
::of
::::::::bedform
:::::::transport
:::::rates
:::and
:::::::beform
::::::heights
::::with
:::::::distance
::::::across
:::the
:::::::channel.
:::::Near
:::the
:::::banks
::of
:::the
::::::::channel,
:::our
:::::::bedform
::::::::transport
:::rate
:::and
::::::::bedform
:::::height
:::::::::::distributions
::::have
:a:::::much
:::::larger
:::::range
:::::::whereas
:::::these
::::::::::distributions
::::have
::a:::::much10
:::::tighter
:::::range
::in:::the
::::::center
::of
:::the
:::::::channel.
:::::This
:is::::::mostly
::::::likely
::::::caused
::by
:::::::varying
:::::::amounts
::of
::::::::::::superimposed
::::::::bedforms
::::::across
::the
:::::::channel
::::and
:::::::suggests
:::that
:::the
::::::::bedform
:::::decay
::::::process
:::can
:::be
::::::::::::heterogeneous
::in
:::the
:::::::::::cross-channel
:::::::::direction.
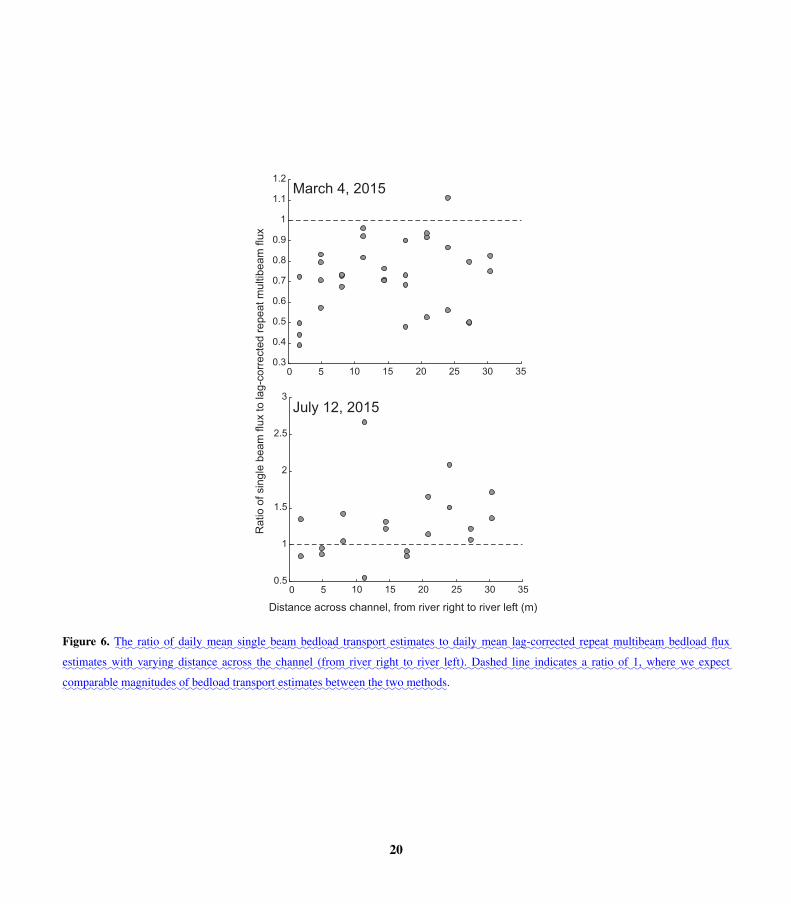
:::The
::::ratio
:::of
:::::single
:::::beam
::to
::::::repeat
:::::::::multibeam
:::::::bedload
::::::::transport
::::rates
::::also
:::::::changes
::::with
::::::lateral
:::::::position
:::::along
:::the
:::::::channel
::::(Fig.
::6).
::::For
:::this
:::::::analysis
:::we
:::::::compare
::::daily
:::::mean
:::::::::::lag-corrected
:::::repeat
:::::::::mutlibeam
:::::::bedload
::::::::transport
::::rates
:::and
:::::daily
:::::mean
:::::single
::::beam
:::::::bedload
::::::::transport
:::::rates.
::In
::::::March,
:::we
::::find
:::the
::::::highest
:::::::::agreement
:::::::between
:::the
:::two
::::::::methods
::in
:::the
:::::center
::of:::
the::::::::
channel,15
::::with
::::high
:::::::::::discrepancies
:::::::between
:::the
::::two
:::::::methods
::::near
::::both
::::::banks.
::In
::::July,
:::the
::::::highest
:::::::::agreement
:::::::between
:::the
::::two
:::::::methods
::is
:::also
::in
:::the
::::::center
::of
:::the
:::::::channel
:::::::although
:::::only
::::::::proximity
::to
::::one
::::bank
:::::(river
::::left)
::::::showed
:::::::::significant
::::::::::::discrepancies
::in
:::::::bedload
::::::::estimates.
4 Discussion
Bed elevation profiles recorded by repeat multi-, single-, and multiple single- beam::::::::::single-beam sonar methodologies produce20
different estimates of bedload transport, but practical steps can be taken to reduce the mismatch.
Significant errors in fluxes computed::::::bedload
::::::::transport
::::rates
:can arise for two main reasons: (1) cross-correlation derived
repeat multibeam bedform celerity estimates can show systematic bias, and (2) dunes can grow/shrink in response to unsteady
flow conditions or varying sediment supply (Martin and Jerolmack, 2013; Rodrigues et al., 2015). Caution should be exercised
when using cross-correlation to derive dune celerity, especially during higher transport stages and for relatively large time25
increments between successive measurements. It is good practice to check lags estimated using cross-correlation with manual
measurements in order to compile a relationship that can be used to correct for systematic bias in estimated lag (Fig. 3A).
Using single beam bed elevation profiles, as dunes grow, transport is underestimated because period is overestimated. As
dunes shrink:::::decay, transport is overestimated because period is underestimated (Fig. 3B). It is therefore important to under-
stand the time scales over which dunes size is responding to flow in order to assess the relative effect period distortion may be30
having on the bedload estimates. A sinusoidal growth model is proposed that accounts for geometric effects on bedload flux
:::::::transport
:in unsteady flows, using measured dune heights and translations and a scaling relationship to predict dune wavelength
9

from its::::dune height (Fig. 3C). Such a scaling relationship could be compiled over time for a specific single beam deployment
and applied retroactively to entire time-series of bed elevation profiles. The sinusoid model could be applied in any operational
setting where temporal variations in dune wavelength and a dune height-wavelength scaling relationship exist.
A less generally applicable extension to this procedure could involve modeling the spatio-temporal evolution of the bed
more explicitly using Fourier series (e.g. Guala et al., 2014).:::::::::::::::Guala et al. (2014)
::::::::::demonstrate
::a::::::::frequency
:::::::::dispersion
:::in
:::the5
:::::::::relationship
::::::::between
::::dune
:::::::celerity,
::::Vc,
:::and
:::::::::::wavelength,
::λ,
:::::::because
:::::small
:::::dunes
:::::tend
::to
:::::move
:::::faster
::::than
::::::larger
::::ones.
:::::This
::::does
:::not
:::bias
::::our
::::::::computed
:::::::bedload
:::::fluxes
:::::from
:::::::::multibeam
:::data
:::::since
:::we
:::use
:::::::::time-series
:::of
:::::::bedform
:::::::statistics
:::::from
::::::::η(x,y, t),
:::::::however
::it
::::does
:::::place
:::::limits
:::on
:::any
::::::::::calculation
::of
:::::::::equivalent
:::::::statistics
:::::from
::::η(t)
:::::::because
::it
:::::::requires
::::::::assuming
:a::::::
model::::that
:::::relates
:::::::average
:::Vc ::::
with::::::average
:::λ,
::or
:::::rather
::::that
:::the
:::::::::functional
::::form
:::::::between
:::::them
::::does
::::not
::::vary
::in
:::::time,
:::::which
::::may
:::not
:::be
::::::strictly
::::true.10
In this study, accounting for temporal changes in dune geometry accounted for 28.9 (March) and 134.8 (July) tons/day
in daily bedload rates computed using single beam, or 17.6% (March) and 28.3%:::::(July)
:compared to lag corrected repeat
multibeam-derived rates.:It
::is
:::::worth
::::::noting
:::that
::::real
:::::single
:::::beam
::::::::::::echosounders
:::can
:::::::operate
::at
:a::::finer
::::::::temporal
:::::scale
::::than
:::we
::are
::::able
::to
:::::::::::approximate
::in
:::our
::::::virtual
:::::::::experiment.
::::Our
:::::::analysis
:::::::indicates
::::that
:::::single
:::::beam
::::::::::::measurements
:::::made
::at
:a:::fine
:::::::enough
::::scale
:::::could
::::::greatly
::::::reduce
:::the
::::error
::in
:::::::bedload
::::flux
::::::::estimates.
:15
Increasing the spatial resolution of the bed elevation data by using a multiple single beam system does not necessarily
improve upon single beam transport estimates. Multiple single beam transport estimates do not suffer from distortions in
period caused by changing dune wavelength but are sensitive to both beam spacing and sample frequency (Fig. 4). Ideally,
sonar beams should be spaced such that a large proportion of the dune wavelength is sampled (Fig. 4B), although this is not
always practical, especially in shallow water. If dune wavelengths change significantly according to flow, designing sampling to20
be optimal for a particular wavelength would not be recommended. A more effective approach to maximizing multiple single
beam-derived bedload accuracy is to adjust sampling rate (Fig. 4C and D), calibrated in relation to a known range of dune
migration rates. This is especially helpful for dune celerity estimates based on cross-correlation (Fig. 4A). We found the most
accurate way to measure dune celerity from multiple single beam data is to measure time elapsed between successive dune
crests.25
:::Our
::::::::analyses
::::also
::::::suggest
::::that
::::::lateral
:::::::position
:::::along
::::the
:::::::channel
:::can
:::::::::::significantly
:::::affect
::::::single
:::::beam
:::::::bedload
::::::::transport
:::::::estimates
::::::(Figs.
::5
:::and
:::6).
::::::When
::::::::mounting
::::::single
:::::beam
::or
:::::::multiple
::::::single
:::::beam
::::::::systems,
::its
:::::::::important
::to
:::be
::::::::cognizant
:::of
::::::::proximity
::to
:::::::channel
:::::::margins.
::::We
:::::found
::::that
:::the
:::::center
:::of
:::the
:::::::channel
::::::yielded
:::the
:::::most
::::::::::comparable
:::::::::magnitudes
:::of
:::::::bedload
:::::::transport
::::rates
::::::::between
:::::::sampling
::::::::methods.
::In
::::our
::::study
:::::area,
:::the
:::::center
::of
:::the
:::::::channel
::is
::::very
::::near
:::the
::::::thalweg
:::of
:::the
:::::::channel.
::In
:::::rivers
::in
:::::which
:::the
:::::::thalweg
::::::differs
::::::::::significantly
:::::from
:::the
:::::center
::of:::
the::::::::
channel,:::we
::::::suggest
::::::::mounting
:::the
:::::::::::echosounder
::in
::a30
::::::position
::::near
:::the
:::::::thalweg
::if
:::::::possible.
:
5 Conclusions
10

In summary, repeat::All
::::::::practical
:::::::methods
::for
:::::::::estimating
:::::::bedload
::::from
:::::dune
::::::::::observations
::::::::suggested
::to::::date
::::::require
::a
:::::::::time-series
::of
:::bed
::::::::elevation
:::::::changes
:::::::::associated
::::with
:::::dune
:::::::::migration,
:::::either
::::η(t)
:::::using
::a:::::single
:::::beam
:::::::::::echosounder
::or
::::::::η(x,y, t)
:::::using
::a
:::::::::multibeam
:::::sonar.
::In
::::lieu
::of
::a
::::::::::::::parameterization
:::for
:::::::bedform
:::::::::migration
:::::speed
:::::::::appropriate
:::for
:::::field
:::::scales,
::::::forced
:::by
::::::::routinely
:::::::::measurable
:::::::::quantities
::::such
::as
:::::::::discharge,
:::::::::ambiguity
:::::::between
::::::::::wavelength
::::and
:::::period
::::can
:::::::::negatively
:::::affect
:::::::bedload
::::::::transport
:::::::estimates
:::::from
:::::single
:::::beam
::::::::::::echosounders.
::::Here,
::a::::::simple
:::::model
::to
:::::::simulate
:::::dune
:::::::::wavelength
:::::::changes
::::was
::::::::sufficient
::to
::::::resolve5
::::much
:::of
:::the
:::::::::ambiguity.
::::::Repeat
:multibeam-derived elevation time-series are a more accurate means with which to estimate
bedload than using single beam or multiple single beam, because the superior spatio-temporal coverage of these data allow
for simultaneous resolution of Vc, H , and λ. However, there are significant practical advantages to using single beam or
multiple single beam systems over repeat multibeam, and their capacity to monitor bedload over long periods may in some
situations outweigh any disadvantages to do with greater errors in instantaneous bedload flux. We have offered a case study10
and practical guidelines to maximizing the efficacy of comparing bedload transport estimates derived from different sampling
methodologies, which collectively will guide design of optimal bed sampling strategies for tracking dunes in rivers.
Code and data availability. Data and related codes are available at doi.org/10.5967/M02J6904.
Author contributions. Kate Leary designed the virtual experiments, developed code, and performed the simulations. Daniel Buscombe pro-
vided invaluable insight and helped with data analysis. Kate Leary prepared the manuscript with contributions from all co-authors.15
Competing interests. The authors declare that they have no conflict of interest.
Acknowledgements. This work was funded by the Glen Canyon Dam Adaptive Management Program administered by the U.S. Bureau of
Reclamation, through a cooperative agreement with the U.S. Geological Survey Grand Canyon Monitoring and Research Center. Any use of
trade, product, or firm names is for descriptive purposes only and does not imply endorsement by the U.S. government. Thanks to Matt ‘The
Colonel’ Kaplinski for leading the field surveys and processing all multibeam data, and to Bob Tusso, Erich Mueller, and Tom Ashley for20
field support. Dave Topping, Brandon McElroy, Paul Grams, Dave Dean, Mark Schmeeckle, and Kelin Whipple provided useful discussion.
11

References
Abraham, D. and Pratt, T.: Missouri River bed-load computations at Kansas City and Washington, ERDC-CHL Data Report, 2010.
Abraham, D., Kuhnle, R. A., and Odgaard, A. J.: Validation of bed-load transport measurements with time-sequenced bathymetric data,
Journal of Hydraulic Engineering, 137, 723–728, 2011.
Ashworth, P. J., Best, J. L., Roden, J. E., Bristow, C. S., and Klaassen, G. J.: Morphological evolution and dynamics of a large, sand braid-bar,5
Jamuna River, Bangladesh, Sedimentology, 47, 533–555, 2000.
Blom, A., Ribberink, J. S., and de Vriend, H. J.: Vertical sorting in bed forms: Flume experiments with a natural and a trimodal sediment
mixture, Water Resources Research, 39, 2003.
Buscombe, D., Grams, P., and Kaplinski, M.: Characterizing riverbed sediment using high-frequency acoustics: 1. Spectral properties of
scattering, J. Geophys. Res. Earth Surf., 119, 2647–2691, 2014.10
Buscombe, D., Grams, P., and Kaplinski, M.: Compositional signatures in acoustic backscatter over vegetated and unvegetated mixed sand-
gravel riverbeds., J. Geophys. Res. Earth Surf., 122, 1771–1793, 2017.
Church, M.: Bed material transport and the morphology of alluvial river channels, Annu. Rev. Earth Planet, 34, 325–354, 2006.
Claude, N., Rodrigues, S., Bustillo, V., Bréhéret, J., Macaire, J., and Jugé, P.: Estimating bedload transport in a large sand-gravel bed river
from direct sampling, dune tracking and empirical formulas, Geomorphology, 179, 40–57, 2012.15
Curran, J. C., Waters, K. A., and Cannatelli, K. M.: Real time measurements of sediment transport and bed morphology during channel
altering flow and sediment transport events, Geomorphology, 244, 169–179, 2015.
Dinehart, R.: Bedform movement recorded by sequential single-beam surveys in tidal rivers, J. Hydrol., 258, 25–39, 2002.
Edwards, T. and Glysson, G.: Field methods for measurement of fluvial sediment, 03-C2, U.S. Geological Survey: Information Survices,
1999.20
Emmett, W.: A field calibration of the sediment-trapping characteristics of the Helley-Smith bedload sampler, U.S. Geol. Surv. Prof. Pap.,
pp. 1–44, 1980.
Engel, P. and Lau, Y.: Computation of bedload using bathymetric data., Proc. Am. Soc. Civ. Eng., 106, 369–380, 1980.
Gaeuman, D. and Jacobson, R.: Field assessment of alternative bed-load transport estimators, Journal of Hydraulic Engineering, 133, 1319–
1328, 2007.25
Gomez, B.: Bedload Transport, Earth Sci. Rev., 31, 89–132, 1991.
Gray, J., Laronne, J., and Marr, J.: Bedload-surrogate monitoring technologies., U.S. Geological Survey Scientific Investigations Report
2010-5091, pp. 1–37, 2010.
Guala, M., Singh, A., BadHeartBull, N., and Foufoula-Georgiou, E.: Spectral description of migrating bed forms and sediment transport, J.
Geophys. Res. Earth Surf., 119, 123–137, 2014.30
Hackney, C. R., Darby, S. E., Parsons, D. R., Leyland, J., Aalto, R., Nicholas, A. P., and Best, J. L.: The influence of flow discharge variations
on the morphodynamics of a diffluence–confluence unit on a large river, Earth Surface Processes and Landforms, 43, 349–362, 2018.
Havinga, H.: Bedload discharge coefficient, J. Hydraul. Eng., 109, 157–160, 1983.
Hoekstra, P., Bell, P., van Santen, P., Roode, N., Levoy, F., and Whitehouse, R.: Bedform migration and bedload transport on an intertidal
shoal, Continental Shelf Research, 24, 1249–1269, 2004.35
Huizinga, R.: Bathymetric and velocimetric surveys at highway bridges crossing the Missouri River near Kansas City, Missouri, June 2–4,
2015, U.S. Geological Survey Scientific Investigations Report 2016–5061, pp. 1–93, 2016.
12

Julien, P., Klaassen, G., Ten Brinke, W., and Wilbers, A.: Case study: bed resistance of Rhine River during 1998 flood, Journal of Hydraulic
Engineering, 128, 1042–1050, 2002.
Kaplinski, M., Hazel, J.E., J., Grams, P., Kohl, K., Buscombe, D., and Tusso, R.: Channel mapping river miles 29-62 of the Colorado River
in Grand Canyon National Park, Arizona, May 2009, U.S. Geological Survey Open-File Report 2017-1030, pp. 1–35, 2017.
Martin, R. and Jerolmack, D.: Origin of hysteresis in bed form response to unsteady flows, Water Resour. Res., 49, 1314–1333, 2013.5
Martin, Y. and Church, M.: Re-examination of Bagnold’s empirical bedload formulae, Earth Surf. Proc. Land., 25, 1011–1024, 2000.
McElroy, B. and Mohrig, D.: Nature of deformation of sandy bed forms, J. Geophys. Res. Earth Surf., 114, 2009.
Moulton, M., Elgar, S., and Raubenheimer, B.: Improving the time resolution of surfzone bathymetry using in situ altimeters, Ocean Dynam-
ics, 64, 755–770, 2014.
Nittrouer, J. A., Allison, M. A., and Campanella, R.: Bedform transport rates for the lowermost Mississippi River., J. of Geophys. Res.: Earth10
Surf., 113, 2008.
Nolan, K., Gray, J., and Glysson, G.: Introduction to Suspended Sediment Sampling, USGS Scientific Investigations Report 2005-5077,
2005.
Paola, C. and Voller, V.: A generalized Exner equation for sediment mass balance, J. Geophys. Res, 110, F04 014, 2005.
Parsons, D., Best, J., Orfeo, O., Hardy, R., Kostaschuk, R., and Lane, S.: Morphology and flow fields of three-dimensional dunes, Rio Paraná,15
Argentina: Results from simultaneous multibeam echo sounding and acoustic Doppler current profiling, Journal of Geophysical Research:
Earth Surface, 110, 2005.
Rodrigues, S., Mosselman, E., Claude, N., Wintenberger, C. L., and Juge, P.: Alternate bars in a sandy gravel bed river: generation, migration
and interactions with superimposed dunes, Earth Surface Processes and Landforms, 40, 610–628, 2015.
Schmitt, T. and Mitchell, N. C.: Dune-associated sand fluxes at the nearshore termination of a banner sand bank (Helwick Sands, Bristol20
Channel), Continental Shelf Research, 76, 64–74, 2014.
Shelley, J., Abraham, D., and McAlpin, T.: Removing systemic bias in bed-load transport measurements in large sand-bed rivers, J. Hydraul.
Eng., 139, 1107–1111, 2013.
Shugar, D. H., Kostaschuk, R., Best, J. L., Parsons, D. R., Lane, S. N., Orfeo, O., and Hardy, R. J.: On the relationship between flow and
suspended sediment transport over the crest of a sand dune, Río Paraná, Argentina, Sedimentology, 57, 252–272, 2010.25
Simons, D. B., Richardson, E. V., and Nordin, C. F.: Bedload equation for ripples and dunes, US Goveernment Printing Office, Washington
D.C., 1965.
Ten Brinke, W., Wilbers, A., and Wesseling, C.: Dune Growth, Decay and Migration Rates during a Large-Magnitude Flood at a Sand and
Mixed Sand–Gravel Bed in the Dutch Rhine River System, Fluvial sedimentology VI, pp. 15–32, 1999.
Van Den Berg, J.: Bedform migration and bed-load transport in some rivers and tidal environments, Sedimentology, 34, 681–698, 1987.30
Van der Mark, C., Blom, A., and Hulscher, S. J.: Quantification of variability in bedform geometry, Journal of Geophysical Research: Earth
Surface, 113, 2008.
Van Rijn, L.: Sediment transport, Part I: bedload transport., J. Hydraul. Eng., 110, 1431–1456, 1984.
Villard, P. and Church, M.: Dunes and associated sand transport in a tidally influenced sand-bed channel: Fraser River, British Columbia,
Can. J. Earth Sci., 40, 115–130, 2003.35
Wilbers, A. W. E. and Ten Brinke, W.: The response of subaqueous dunes to floods in sand and gravel bed reaches of the Dutch Rhine,
Sedimentology, 50, 1013–1034, 2003.
13

Willis, J. and Kennedy, J.: Sediment discharge of alluvial streams calculated from bedform statistics., Tech. rep., Iowa Institute of Hydraulic
Research Report No. 202, University of Iowa, Iowa City, Iowa, 1975.
Wintenberger, C. L., Rodrigues, S., Claude, N., Jugé, P., Bréhéret, J.-G., and Villar, M.: Dynamics of nonmigrating mid-channel bar and
superimposed dunes in a sandy-gravelly river (Loire River, France), Geomorphology, 248, 185–204, 2015.
Wren, D. G., Barkdoll, B. D., Kuhnle, R. A., and Derrow, R. W.: Field techniques for suspended-sediment measurement., J. Hydraul. Eng.,5
126, 97–104, 2000.
Yang, C.-S.: On Bagnold’s sediment transport equation in tidal marine environments and the practical definition of bedload, Sedimentology,
33, 465–486, 1986.
14

x
y
x
−2
−1
01
2Elevation
0 20 40 60 80 100
t1 t2
0 20 40 60 80 100t
−2
−1
01
2
stationary
echosounder
z
direction of flow
0 20 40 60 80 100t
−2
−1
01
2
stationary
echosounder
z
(2) Single-beam (SB) (3) Multiple Single-beam
(MSB)
3 Different Approaches:
(1) Repeat Mutlibeam
(RMB)
MARC
H 4, 2015
JULY 12
, 2015
JULY 12
, 2015
MARC
H 4, 2015
Virtual SB and
MSB sampling
locations
Multibeam BEPs
beginning and end
locations
BA
C D
−0.20
0.00
0.20
0 5 10 15
Distance along BEP (m)
July 12, 2015
−0.10
0.00
0.10
0 2 4 6
March 4, 2015
Multibeam BEPs: t1 t2
0 2.5 5.0 7.5
−0.10
0.00
0.10
−0.20
0.00
0.20
0 5 10Time Elapsed (hr)
March 4, 2015
July 12, 2015
Single Beam BEPs:E FDirection of Flow Direction of Flow
Elevation (m)
Elevation (m)
Figure 1. (A) Schematic of three common field methodologies for collecting bed elevation profiles (repeat multibeam, single beam, and
multiple single beam) and the types of bed elevation profiles produced by each method. (B) Location of study area on the Colorado River in
Grand Canyon National Park. Map adapted from Kaplinski et al. (2017).:(C) Map of study reach. Yellow line indicates the location of the
Diamond Creek USGS gage. Grey section:::area indicates area mapped with single multibeam survey. Colored area indicates area over which
repeat multibeam surveys were collected (colors indicate elevations where red is high and blue is low). The blue lines that bisect the repeat
multibeam survey area indicate the track lines the boat drove along in order to obtain each survey. Black rectangle indicates area in which bed
elevation profiles were extracted. (D) BEP:::Bed
:::::::elevation
:::::profile
:extraction map for multibeamand ,
:virtual single-
:::::single
::::beam,
:and
:::::virtual
multiple single-::::single
:beam. Examples of repeat multibeam (E) and single-beam
::::single
:::::beam (F) bed elevation profiles for March and July
data sets.
15

0.00
0.25
0.50
0.75
1.00
100 200 300 400
Bedload Transport (kg/hr)
Pro
ba
bili
ty
0.00
0.25
0.50
0.75
1.00
0 500 1000 1500 2000
Bedload Transport (kg/hr)
SB
SB - Sinusoid
Model CorrectionRMB
RMB - Lag
Correction
+/- RMSE
wa
ve
len
gth
(m
)
March 4, 2015 July 12, 2015
300
400
500
600
30 40 50 60 70 80Time
Dis
ch
arg
e (
m3/s
)0.1
0.2
Ma
rch
he
igh
t (m
)
0
BEP5_2 0.3
Ju
ly h
eig
ht (m
)
400 800
0.4
0.6
0.8A
C
400 8000
B
D
E
time (minutes)
0
4
8
12
16
y = 2.9 + 9x r2 = 0.576
0 0.2 0.4 0.6 0.8 1.0 1.2 1.40
1
2
3
4
5
6
0 0.1 0.2 0.3 0.4 0.5 0.6
y = 1.2 + 7.4x r2 = 0.39
height (m)
time (minutes)
wa
ve
len
gth
(m
)
height (m)
300
200
100
400
500
0 2 4 6 8 10 12
300
200
100
400
500
600
700
5 10 15 252000
tim
e (
min
ute
s)
37
43
75
η
Distance (m) Distance (m)
March 4, 2015 July 12, 2015
March 4, 2015 July 12, 2015
Figure 2. (A) Discharge during the sample time period. Dashed line is July data, solid line is March data. (B) Example of bed form::::::bedform
height varying with time from BEP 5_2:a:::::single
:::bed
:::::::elevation
:::::profile. Open circles indicate July data, closed circles indicate March data. (C)
Height:::::::::Wavelength versus wavelength
::::height. Red line indicates linear regression of the data. (D
::E) Cumulative density plots of single beam
and repeat multibeam bedload transport estimates with added corrections for mischaracterized lag (repeat multibeam) and period (single
beam).
16
0 20 40 60 80 100
Be
d E
lev
ati
on
−2
−1
01
2
0 20 40 60 80 100
−2
−1
01
2
Growing Dunes Shrinking DunesC = 7.4 * A C = 9 * AC
0.00
0.25
0.50
0.75
1.00
5 10 15Period (hours)
0.00
0.25
0.50
0.75
1.00
0 2 4 6 8
Pro
ba
bilit
y
B March 4, 2015 July 12, 2015
0.6 0.7 0.8 0.9 1 1.1 1.2 1.3 1.4
Manual Bedform Celerity (m/hr)
0.6
0.7
0.8
0.9
1
1.1
1.2
1.3
1.4
XC
orr
Be
dfo
rm C
ele
rity
(m
/hr) July
y=0.32x+0.53
RMSE = 0.13
March
y=0.77x+0.24
RMSE = 0.11Single BeamRepeat Multibeam
A
Time Time
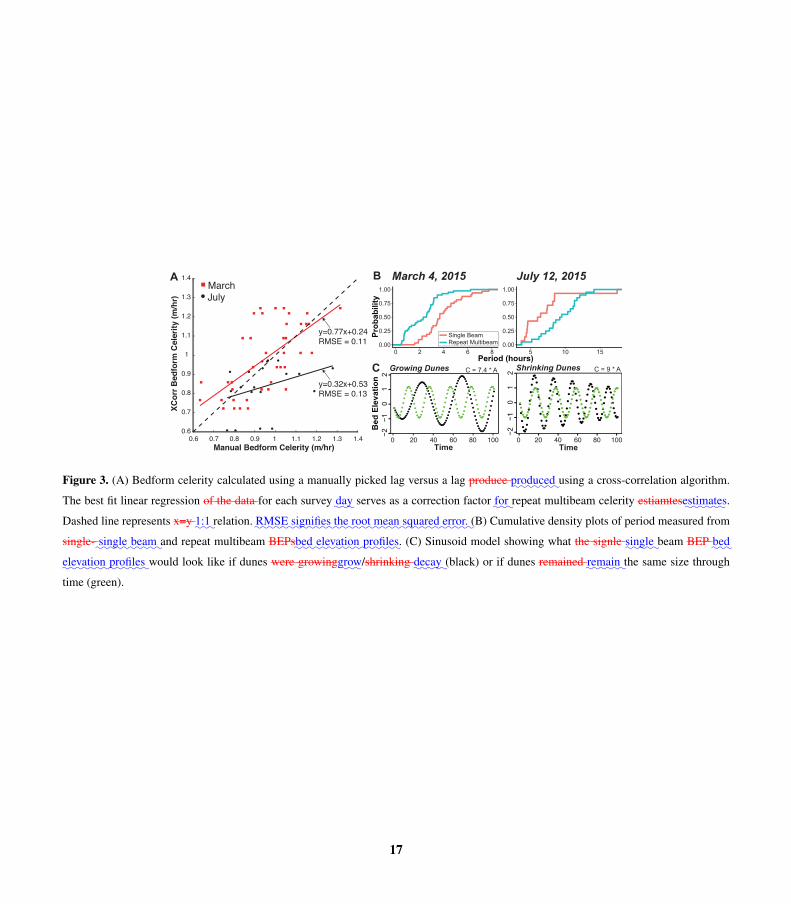
Figure 3. (A) Bedform celerity calculated using a manually picked lag versus a lag produce::::::produced
:using a cross-correlation algorithm.
The best fit linear regression of the data for each survey:::day serves as a correction factor
::for
:repeat multibeam celerity estiamtes
::::::estimates.
Dashed line represents x=y::1:1
:relation.
:::::RMSE
:::::::signifies
::the
::::root
::::mean
::::::squared
::::error.
:(B) Cumulative density plots of period measured from
single-:::::single
::::beam
:and repeat multibeam BEPs
:::bed
:::::::elevation
::::::profiles. (C) Sinusoid model showing what the signle
::::single
:beam BEP
:::bed
:::::::elevation
:::::profiles
:would look like if dunes were growing
:::grow/shrinking
::::decay
:(black) or if dunes remained
:::::remain
:the same size through
time (green).
17

0.00
0.25
0.50
0.75
1.00
0 500 1000 1500 2000
0.00
0.25
0.50
0.75
1.00
100 200 300 400
Original Method
Xcorr Method
0.00
0.25
0.50
0.75
1.00
200 400 6000.00
0.25
0.50
0.75
1.00
0 2000 4000
Manual Method
Multiple Single Beam Spacing: 0.56, 1.16, 1.74 m
0.00
0.25
0.50
0.75
1.00
100 200 300 400
0.00
0.25
0.50
0.75
1.00
0 500 1000 1500 2000
A
March 4, 2015 July 12, 2015
RMBMSB
RMBMSB
RMBMSB
Multiple Single
Beam Spacing:
0.00
0.25
0.50
0.75
1.00
0 500 1000 1500
Manual Method
B
July 12, 20150.00
0.25
0.50
0.75
1.00
100 200 300 400Pro
ba
bilit
y
March 4, 2015
RMBMSB
0.56, 1.16, 1.74 m (March)
1.74, 3.48, 5.22 m (July)
Sampling Frequency: 3 minutesOriginal Method
0.00
0.25
0.50
0.75
1.00
200 300 4000.00
0.25
0.50
0.75
1.00
0 1000 2000 3000
Bedload Transport (kg/hr)
RMBMSB
C
Xcorr Method
0.00
0.25
0.50
0.75
1.00
200 400 600 800 0 1000 2000 30000.00
0.25
0.50
0.75
1.00RMBMSB
Pro
ba
bilit
yP
rob
ab
ilit
y
July 12, 2015March 4, 2015
Figure 4. CDFs of lag-corrected repeat multibeam (:::::RMB;
:black) and multiple single beam
:::::(MSB) bedload transport estimates using the
original (red), cross-correlation (::::Xcorr;
:purple), and manual methods (blue) to calculate bedform celerity for the MSB
::::::multiple
::::single
:::::beam
profiles. Dashed red lines are sine-corrected estimates. (A) Multiple single beam beam-spacing of 0 - 0.56 - 1.16 -1.74 meters for both March
and July. (B) Multiple single beam beam-spacing of 0 - 1.74 - 3.48 - 5.22 meters for July. (C) Bedload transport estimates with 3 minute
sampling frequency.
18
1.6 4.9 8.1 11.2 14.4 17.6 20.8 24.0 27.2 30.40
100
200
300
400
500
600
700
0
500
1000
1500
2000
2500
1.6 4.9 8.1 11.2 14.4 17.6 20.8 24.0 27.2 30.4
La
g-c
orr
ecte
d r
ep
ea
t m
ultib
ea
m b
ed
loa
d tra
nsp
ort
(kg
/hr)
March 4, 2015
Distance across channel (m)
July 12, 2015
0
5
10
15
20
25
30
35
40
45
50
0.5
1
1.5
2
2.5
3
3.5
4
4.5
5
Be
dfo
rm H
eig
ht (c
m)
Be
dfo
rm C
ele
rity
(m
/hr)
0
20
40
60
80
100
120
0
0.5
1
1.5
2
2.5
3
3.5
4
4.5
5
Be
dfo
rm H
eig
ht (c
m)
Be
dfo
rm C
ele
rity
(m
/hr)
1.6 4.9 8.1 11.2 14.4 17.6 20.8 24.0 27.2 30.4 1.6 4.9 8.1 11.2 14.4 17.6 20.8 24.0 27.2 30.4
1.6 4.9 8.1 11.2 14.4 17.6 20.8 24.0 27.2 30.4 1.6 4.9 8.1 11.2 14.4 17.6 20.8 24.0 27.2 30.4
Distance across channel (m) Distance across channel (m)
March 4, 2015
July 12, 2015
March 4, 2015
July 12, 2015
Distance across channel (m) Distance across channel (m) Distance across channel (m)
A B C
Figure 5.:::::::Boxplots
::of
::::::::::lag-corrected
:::::repeat
::::::::multibeam
::::::bedload
:::::::transport
:::::::estimates
:::(A),
:::::::bedform
:::::heights
::::(B),
:::and
::::::bedform
:::::::celerities
:::(C)
::::with
:::::varying
:::::::distance
:::::across
::the
::::::channel
:::::(from
::::river
::::right
:to::::
river::::left).
19
0.5
1
1.5
2
2.5
3
10 15 20 25 30 350 5
10 15 20 25 30 350.3
0.4
0.5
0.6
0.7
0.8
0.9
1
1.1
1.2
0 5
Distance across channel, from river right to river left (m)
Ra
tio
of sin
gle
be
am
flu
x to
la
g-c
orr
ecte
d r
ep
ea
t m
ultib
ea
m flu
x
March 4, 2015
July 12, 2015
Figure 6.:::The
::::ratio
::of
::::daily
:::::mean
:::::single
::::beam
:::::::bedload
:::::::transport
:::::::estimates
::to:::::
daily::::mean
::::::::::lag-corrected
:::::repeat
:::::::::multibeam
::::::bedload
::::flux
:::::::estimates
::::with
::::::varying
::::::distance
::::::across
::the
:::::::channel
:::::(from
::::river
::::right
::to
::::river
::::left).
::::::Dashed
::::line
:::::::indicates
:a::::ratio
::of::
1,::::::
where::we
::::::expect
::::::::comparable
:::::::::magnitudes
::of
::::::bedload
:::::::transport
:::::::estimates
:::::::between
::the
:::two
:::::::methods.
20

Wewouldfirstliketothanktheanonymousreviewerfortheirthoughtfulreview.Inthebelowdocument,thereviewerscommentsareinblack;ourresponsestoreviewsareinblueitalics.Thismanuscriptcomparesthreedifferenttechniquestotrackbedformsandestimatebedloadtransportrates.Thispapercouldbeveryusefulforscientistswhoconsiderestimatingbedloadtransportratesbybedformtracking,eventhoughthepaperdoesnotincludenewmethods.Ingeneral,theintroduction,discussionandconclusionareveryclearandinformative.However,themethodsandresultsaresometimesmoredifficulttoreadandneedextrasentencestoexplaintheconceptsandhowtheconclusionsarederivedfromtheresults.Seemycommentsbelow. Specificcomments:-P2,L30:“(alsocalledaltimeters...)”,dependingontheimportanceofthismessage,shouldthisbementionedearlierinthetextandnotbetweenbrackets?Wehaveremovedthisinformationfromthetext,becausewefeel“stationarysinglebeamechosounder”iswellunderstood.-Whatisthedifferencebetweenthesecondandthirdresearchquestionattheendoftheintroduction?Itreadslikeitisthesamequestion,butthentheotherwayaround.Thesecondquestionasksifchangesinbedformsizeandshapeaffectmeasurementsfromdifferentsamplingmethods.Thethirdquestionaskshowitaffectsthemeasurements.Wehaverewordedtheseinthetextforclarity. -Whatisthepossibleinfluenceofthestudyareaontheresults?Intheintroductionthereisadistinctionbetweenshallowanddeepriverswhenmentioningthepracticaluseofthemultibeamandsinglebeam,isthestudyareashallowordeep?Thestudyareaisquitedeep(6-9mdependingondischarge)somultibeamisapracticalchoice.Thisinformationhasbeenaddedtotherevisedmanuscript.Intheresults,itismentionedthatthereisadailydischargevariationthatinfluencesthebedformdimensions,howextremearethesedischargevariationscomparedtootherriversandwouldthisinfluencetheadviceinthediscussion?Onadailytimescale,thesechangesareprettysignificantcomparedtootherrivers.Thatbeingsaid,sedimentandwaterdischargeconditionsvarycontinuouslyinnaturalriverscausingbedmorphologytooftenbeoutofequilibriumwithprevailingflowconditions.Aswestateinourintroduction,numerousfieldstudiessuggestthatbedformdisequilibriumislikelythenormratherthananexceptioninnaturalriversystems(e.g.,FringsandKleinhans,2008;Julienetal.,2002;TenBrinkeetal.,2009;WilbersandTenBrinke,2003).Itisforthisreasonthatthesinusoidmodelwasdeveloped,toaccountfornon-stationarityintheflowcausingincreasesordecreasesinbedformdimensionsintime.Thesinusoidmodelissuggestedasautilityforsuchsituationstominimizetheerrorinsinglebeamstyleestimatesofbedloadfluxfromstationaryechosoundersinunsteadyflow. -Isthereaneffectexpectedofusingvirtualsingleandmultiplesinglebeamprofilesbasedonthemultibeamdata,insteadofmeasuringitseparatelyandthusindependentlyinthefield?Thereareargumentsbothways:(1)Thebenefitofthisvirtualexperimentisthatweknowthevirtualsinglebeamechosoundersaremeasuringtheexactsamebedformsthemultibeamismeasuring,soindependentmeasurementsmighthavemoreerror.(2)Thatbeingsaid,realsinglebeamechosounderscanoperateatafinertemporalscalethanweareabletoapproximateinourvirtualexperiment.Asshownbyourvirtualexperiment,temporalresolutionmakesabigdifferenceinbedloadfluxestimates.Ifindependentsinglebeammeasurementsweremadeafineenoughscale,thiscouldgreatlyreducetheerror.Wealsowerelimitedbyourfieldsite,whichhasnobridgeaccess.Soatthislocationwewerenotabletotakeindependentsinglebeammeasurements.Wehaveaddedtexttothediscussioninregardstothisquestion. -Section2.2,L11-14:fluxescausedbydunesthatarenotalignedperpendiculartotheflowareignoredtobeabletocomparetheresultsbetweenmultibeamandsinglebeam.Howmuchisthisexpectedtoinfluencetheestimatedbedloadtransport?Isthistakenintoaccountinothermultibeamstudies?Theeffectofvaryingdunedimensionsduetodisequilibriumwiththeflowistakenintoaccount,shouldtransportdirectionbetakenintoaccountaswell?Singlebeamechosounderswouldnotbeabletoassesstransportinotherdirectionsbesidesstreamwise.However,themultibeamdataarechosenspecificallytobecomparabletosinglebeamdata.Assuch,itisn’tinthescopeofanypapertolookfordirectionalityinasinglebeamtrace.-Section2.2,L14:“wehavechosennottoincorporatetheISDOTTv2”:addashortexplanationofwhatthismethodentails.Wehaveremovedthissectionofthetextontheadviceofanotherreviewer.

-Section2.2:Ithinkthereadabilityofthissectioncouldbeimprovedbyremovingsomeoftheinformationbetweenbracketsandincorporateitinthesentence.E.g.line9-10,line13.Thismightbeapersonalpreference,butingeneralitfeelslikethereisimportantinformationbetweenbracketsthroughoutthepaperandthereforethisinformationseemslessimportantandlessclear.Anotherexampleisthedefinition/causeofbedformequilibriuminthefirstsentenceofsection2.4.Ithinksomedefinitionsandexplanationswillbeclearerwhenthisisexplainedinextrasentences.Wehaverewordedandreorganizedthissectionforclarity. -Section2.3,L28:whatisthephysicalmeaningofqeandwhydoesitneedtobeadded?Couldyouaddashortexplanation?QerepresentsanareaofunderpredictedtransportdiscussedbyShelleyetal.(2013).ThearearepresentedbyCinShelleyetal.(2013)figure1(seebelow)isnotaccountedforusingtheoriginalmethodofSimonsetal.(1965).qeistheareaoftriangleDandthereforeaccountsforthatmissingportion.Wehaveaddedashortexplanationofqetothetext.Itisaverysmallcontributiontototalcomputedflux.
-Section2.3:Isitpossibletocalculateanestimatedaveragewavelengthfromthetimeseriessinceyoucanestimatecelerityfromthis?Woulditdifferalotfromthespatialestimate?It’snotpossibletocalculateanaveragewavelengthfromthesingle-beamtimeseriesbecauseitonlymeasureselevationthroughtime.Gualaetal(2014)showedthatbedformspace-timesubstitutioninthiswaycannotwork;imposingarelationshipbetweenthewavenumberandfrequencyspectrabreaksdownbecausesmallbedformstravelfasteronaveragethanlargebedforms. -Section2.4:thissectionmissesanexplanationofwhythebedformdisequilibriumisdeterminedEventhoughthisismentionedbefore,itwouldhelpthereadertorepeatthishereshortly.Furthermore,itisexplainedhowequation6isusedtocalculatesyntheticbedloadtransportestimates,butnothowthisisusedtodeterminebedformdisequilibrium.Weareempiricallyaccountingforbedformadjustmenttochanginginflow(i.e.bedformgrowthandbedformdecay).Wehaveupdatedthetexttoreflectthis. -Wherearefigures5and6?Thosefigurereferenceswereforapreviousversionandweremistakenlyleftinthisversion.Weapologizefortheconfusionandhavecorrectedthemanuscripttoreflectthecorrectfigurereferences. -Section3.2,L24-26:howarethelag-correctedbedloadtransportandceleritycalculated?Andtheerrors?Thismightbevisibleinfigure5and6,butthepdfonlyshowsfigures1to4.Pleaseseefigure3Afortheregressionsandr-squaredvaluesmentionedinpage6lines22-23.-Section3.3:Idon’treallyunderstandyethowthesinusoidmodelisusedtocorrectthedata.Ithinkthiswouldbeclearerifthemethodsection2.4explainsthisbetter.Whatdoyoumeanwiththeratiobetweensyntheticmultibeamandsyntheticsinglebeam?Wetaketheratioofsyntheticmultibeambedloadtransportestimatestosyntheticsinglebeambedloadtransportestimatesandusethatratioasacorrectionfactforouractualmeasurements(i.e.multiplytheactualsinglebeamestimatesbytheratiodeterminedinthesinusoidmodel).We’veaddedandrewordedthetexttomakethismoreclear. -Section3.3,L16:isthiscomparedtothemultibeamthatiscorrectedforcross-correlationlagerrors?Thisisinthesinusoidmodel.Wehaverewordedforclarity.-Figure4B:Thereisonlyonelineforthemultiplesinglebeam?Shouldn’ttherebemorelinesfordifferentspacings?

WeonlyuseadifferentspacingfortheJulydata.YoucancomparetheCDFstoFigure4Aforthesmallerbeamspacing.TechnicalcorrectionsWehavecorrectedthebelowtechnicalcorrectionsinthemaintext.-P1,L14:Thereisa“?”insteadofasource -Figure1C:Idonotseethegreysectionthatindicatestheareathatismappedwiththesinglemultibeamsurvey. -Section2.2,L8:DidyoudefineBEPbeforethis?Youcanforexampleadd“(BEP)”atline2ofthissection -Figure2:thereseemstobeacaptionmissingtopanelD.-Figure2B:whatisBEP5_2?-Figure2C:“heightvswavelength”shouldn’tthisbe“wavelengthvsheight”(YvsX)?-Figure3Acaption:“estimates”-Figure3Ccaption:“”single”-Section3.3,Line11:“disequilibrium”and“single”-Discussionline30:is“(July)”missingafterthe28.3%?

We would first like to thank Robert Mahon for their thoughtful review. In the below document, the reviewers comments are in black; our responses to reviews are in blue italics. The authors present a systematic comparison of bedform bedload measurement techniques using a unique dataset. Using field data, as opposed to flume data as is often the case, the authors are able to investigate some of the complexities associated with systems evolving under unsteady flow conditions. The ultimate outcome of this paper can inform decisions on both multibeam sampling and processing strategies as well as the placement of single beam echosounder instrumentation on rivers to monitor bed- load flux. Thus the results of this paper are broadly relevant to river managers as well as to academic geomorphologists. The overall flow and structure of the manuscript are quite clear. Figures are well placed into the manuscript context and are appropriate for fully describing the nature of the work. While I have no concerns that fundamentally call into question the nature of the science being done, there are a number of points which the authors could clarify or analyses that could be bolstered by more complete discussion. These comments are below: I would like to see a description of the methods used to extract height and wavelength data from the BTT toolbox as it is a fundamental operation to the analysis in the paper. There are several methods for calculating these parameters, each of which have their respective advantages and disadvantages so it would be good for the authors to describe why the calculations employed in this toolkit are appropriate to their system. We have added the following to our description of the BTT: “After the BEPs are detrended, the BTT determines the zero upcrossing (i.e. points at which the profile positively crosses zero) and zero downcrossing (i.e. points at which the profile negatively crosses zero). The locations of crests and troughs are determined in the original BEP as follows: a crest is located at the maximum value between a zero up- and zero downcrossing; and vice versa, a trough is located at the minimum value between a zero down- and zero upcrossing. Bedform height is calculated at the vertical distance between crest and downstream trough. Bedform wavelength is calculated as the distance between two successive crests. For a more detailed explanation of the BTT please refer to van der Mark et al. (2008) and van der Mark et al. (2007).” Were bed elevation surveys corrected for apparent dilation as a function of the time between start and end of each multibeam survey? If not, was this considered and determined to be a negligible effect? See McElroy dissertation 2009, p. 44 (URI: http://hdl.handle.net/2152/1511). The average difference in time between surveys was around 10 minutes and departures from this were also order 10 minutes, therefore, while we acknowledge that the effect noted by the reviewer and McElroy (2009) is real, we determine it to be a negligible effect in the present study. A figure demonstrating the cross-correlation results would be good to show, as a lot of discussion is based on issues resulting from velocity calculations. See figure 3A. In Page 5 Line 6 the method for estimating wavelengths for the singlebeam experiment is described as the daily average from the repeat multibeam. I wonder if this introduces potential

for extra accuracy for this method that may not be possible in a situation in which a single beam fixed echosounder would be employed. Yes, this is most likely the case. Our single beam flux estimates are probably more accurate than what one might get using a different estimate of bedform wavelength. I would suggest more discussion of when a situation would arise where you have a measurement or a daily average of bedform wavelengths but only a single beam profile to estimate flux from. An alternative formulation might be to estimate wavelength using a height-wavelength relationship such as Bradley and Venditti, 2017 as this might be a more realistic representation of a likely application (i.e. a deployed single beam sensor established for continuous monitoring). Analyses of bedform fields throughout the Colorado river in Grand Canyon reveals that the Bradley and Venditti (2017) relations are a poor fit to observations. Because the bedform field is likely not in equilibrium with the flow due to daily fluctuations in discharge, i.e. because the dunes are always adjusting to flow, correlations between instantaneous bedform height or length and flow are not as robust as they otherwise would be. A better approach is to use mulitbeam measurements at multiple flows to develop a site-specific model for bedform dimensions as predicted by flow. What did the manual process entail for determining bedform velocity? Were you picking crests and tracking them? Looking at the slopes of the forms in the η(x,t) field (e.g. in Figure 2D)? It would be critical to determine whether the manual method itself includes any potential sources of bias in order to interpret its relation to the cross-correlation results. We picked crest locations and tracked them. We have added this information to the main text. I wonder if other methods for calculating bed velocity might be more appropriate than the cross-correlation method for this application, particularly given the unsteady flow conditions investigated. One example from Ganti et al., 2013 (doi:10.1002/jgrf.20094), their eq. 5 to compute the local velocity based on dividing the temporal change in local elevation by local slope at all points on the bed. The above mentioned method from Ganti et al. (2013) would most likely not apply to this data set. While computing local velocities is appropriate in flume experiments where the change in time between each successive bed elevation profile is 45 seconds, applying this method to field data with both a coarser spatial and temporal resolution would likely result in large errors (likely larger than those associated with the cross-correlation method). Were any physical bedload samples collected during the multibeam campaigns to compare with the ranges of flux measurements? No physical bedload samples were collected. We rather doubt the reliability of measurements from a bedload sampler lowered from a cableway suspended high above the water surface through 7m of the water column, into a field of dunes up to a meter high moving up to a meter per second. Some discussion is warranted of whether the bedform bedload equation of Simons et al., is even geometrically appropriate in situations where bedform growth/decay is occurring. I don’t believe they considered this in their original work, and I am not aware of any later publications that show the validity of this method for non-steady bedform fields.

Aside from the assumption that dunes are appropriately triangular, there is nothing in the Simons et al derivation that suggests it is not appropriate for application in time-discerete fashion such as here. That is to say, despite the growth and decay in dunes, the instantaneous bedform flux as predicted by their instantaneous geometry and celerity is appropriate and has been applied before to unsteady flows. While it is true that inferring wavelength from time-series of bed elevation measurements is made more difficult by spatially accelerating and decelerating dunes, the issue is a more in the implementation of the theory governing Simons et al, rather than the theory itself. Along similar lines I would encourage the authors to consider incorporating, or at least explaining the inappropriateness for their application, the insights from Guala et al. (2014, their Section 4 paragraph 2 in particular; doi: 10.1002/2013JF002759) in joint averaging of the elevation and velocity values. We agree the study of Guala et al is pertinent so we have added the following to the revised Discussion: “Guala et al. (2014) demonstrate a frequency dispersion in the relationship between dune celerity, Vc, and wavelength, λ, because small dunes tend to move faster than larger ones. This doesn't bias our computed bedload fluxes from multibeam data since we use time-series of bedform statistics from η(x,y,t), however it does place limits on any calculation of equivalent statistics from η(t) because it requires assuming a model that relates average Vc with average λ, or rather that the functional form between them doesn’t vary in time, which may not be strictly true.” While somewhat outside the scope of the review of the paper itself, I should note that the license type given to the dataset and code hosted in the SEAD repository is potentially quite restrictive to some river management uses and researchers, given that it does not allow commercial use or any derivatives. This may be less important for the data itself, but it may heavily limit the use of this work to have code that cannot be modified. A share alike restriction, for example, would make this more accessible. We have updated the license to allow for commercial use and derivatives. Line Comments: The following line specific comments are non-critical to the science of the manuscript and are meant to help improve readability or clarity. We have corrected the below Line Comments in the manuscript. Page 1 Line 2: “remains elusive” is relatively non-concrete and feels dismissive of the wealth of literature and practice on field-scale bedload measurement techniques spanning half a century or more. Page 1 Line 14: references are missing at “(e.g. ?)” Page 1 Line 20: References such as Simons et al., 1965 and others don’t explicitly derive from the exner equation, per se. They are derivations of mass conservation but not necessarily predicated on Exner’s formulations. Page 2 Line 1: Simons wasn’t the first to show this, as written. For example, Bagnold 1941, Chapter 13 derives a similar formulation, albeit with some geometric inaccuracies. I suggest simply removing the word “first” from the sentence.

Page 2 Line 9: remove comma after “. . .discharge conditions,” Page 2 Line 12: is there a reference for “. . .bedload flux estimated from translating dunes remains one of the most accurate. . .”? This claim has previously been made by Wilbers and Ten Brink (2003) and Nittrouer et al. (2008) who said the measurements came with “… relatively high accuracy so long as the dune geometry and translation distances are large relative to the positioning error” which is the case here. The relative disadvantages of direct sampling are well documented (e.g. Holmes and Holmes, 2010), for example direct sampling disturbs the flow and therefore the rate of bedload, and the sampler must be placed squarely on the bed surface to adequately sample, therefore the presence of dunes causes error. Page 4 Line 14: ISDOTTv2 is not a familiar/common tool since it is not public. If you wish to include this statement, it would be good to describe what that tool is and why it would be useful here. Otherwise I would suggest removing it. We have removed this statement. Page 4 Line 16: please describe the “missing triangles” correction. Page 4 Line 22: consider rewording as it states a 1965 reference is based on a 2005 reference. Page 7 Line 14: “. . .for growing (shrinking) dunes is 1.2 (0.75).” I suggest rewording to “. . .for growing and shrinking dunes is 1.2 and 0.75, respectively.” Figures: for figures 1, 2 and 4 there are abbreviations used which would be helpful to have defined in figure captions so the reader doesn’t have to remember or find from the text. BEP, RMB, SB and MSB are all used. Additionally, Xcorr and RMSE are used but not defined in captions or in the text body.

WewouldfirstliketothankKoryKonsoerfortheirthoughtfulreview.Inthebelowdocument,thereviewerscommentsareinblack;ourresponsesareinblueitalics.In"EstimatingSandBedloadinRiversbyTrackingDunes:acomparisonofmethodsbasedonbedelevationtime-series",theauthorspresentasystematiccomparisonfordifferentapproachesforestimatingbedloadtransportbasedondunemigration.ThemethodscomparedrelyonrepeatmultibeamechosoundingsurveysfromareachoftheColoradoRiverduringtwodifferentfieldcampaignsthatexhibitdifferentdischarges.Themultibeamsurveysprovidethebasedata,andthreedifferentsubsetsfromthedataareselected.Thethreedatasetsusedinthecomparisonare,1)longitudinaltransectsofbedelevationfromthefullmultibeamsurveys,whichprovidespatialdataseries,2)extractionofbedelevationatasinglepointovertime(temporal),and3)extractionofbedelevationatmultiplepointsovertime(temporal).Theauthorsalsoincludesyntheticsinusoidalsignalsthatareusedtoevaluatebedformdynamicofgrowing/shrinkingsizethatwouldoccurduringunsteadyflows.
Overallthepaperiswellwrittenandorganized,andthepresentationoftheresultsisveryclear.Thetopicofthispaperisalsoofgreatimportanceasriverscientistsstillstrugglewithdeterminingbestpracticesforquantifyingbedloadtransportrates.However,Iwouldrecommendaddressingafewissuesrelatedtothemethodsanddiscussionbeforethemanuscriptshouldbeacceptedforfinalpublication.Ioutlinethesebelow.
Althoughthedataaremeasuredusingamultibeamechosounder,thedatasetisnotfullyutilizedandinsteadonlybedelevationprofilesareextracted.Thus,thecomparisonsareessentiallyspatialseriesofsinglebeam,stationarysinglebeam,andstationarymulti-singlebeam.Itisstatedthatthereasonforthisistoaccountforanisotropyamongthedifferentmethodsequally(page4,lines11-14),whichisunderstandable.However,asisstatedmorethantwicethroughoutthemanuscript,multibeamsurveysareconsideredthemostaccurateduetothehighspatiotemporalresolution,yetarenotbeingusedtotheirfullpotential.Whyhaveyoudecidednottoincludethefullthree-dimensionalityofthemultibeamsurveywhenconsideringsedimenttransport?Ifyouconsiderthistobemostaccurate,thenyoucouldconceivablyhaveafourthmethodusingtherepeatmultibeamsurveysastwodimensionaldifferencingcomparedtothethree"singlebeam"methodspresentedinthepaper.This is essentially the ISDOT method (Abraham et al., 2011), which requires there to be conservation of mass over the survey area (all sediment eroded from the area is deposited in the same area). Additionally, this method is designed for bedforms moving at a constant speed, with little to no deformation, and little to no suspended sediment. In our field data, the dunes change speed throughout the day, change shape significantly, and suspended sediment is available. Although the ISDOT method works well in a flume setting, we don’t feel that it is applicable to our field data. Similarly,itappearsasthoughalltherepeatmultibeambedelevationprofileshavebeenaveragedintoasinglevaluefortheareaofinterest.Whynotkeeptheseseparateandevaluatethecomparisonsspatially?Therepeatmultibeamprofilesareonlyaveragedateachlocation,sowithintheareaofinterestthereare40dailybedloadtransportestimates.Wecomputeadailyaverageateachlocationbecauseitisdirectlycomparabletothemeasurementsmadebysinglebeamandmultiple-singlebeamechosounders.TheCDFsinthispaperillustratethedistributionofdailyaveragebedloadtransportestimatesfortheentireareaofinterest.Fromthebedelevationrastershowninfigure1thereappearstobequiteadifferenceinelevationandbedformsizefromtheleftbank(higherbedelevation)torightbank(lowerbedelevation).Isthereasystematicdifferenceinthecomparisonsfromlefttoright?Ifso,isitrelatedtobedformdimensions?Wehaveaddedasectiontotheresultstoaddressthispoint.Pleaseseesection3.5intheupdatedmanuscript.Thisspatialinformationwouldbeextremelyrelevantforthediscussionsection.Inparticular,oneofthetopicsIfeltwasmissingfromthediscussionwashowthefindingsofthisstudycanbeusedtoprovideinsightonwherestationarysinglebeamsensorscouldbeinstalled.Myunderstandingisthatmostsinglebeamsonarsareattachedtobridgepiersoroffbanks/docks.Ifaspatialcomponentofcomparisonisincludedinthispaper,itwouldbepossibletoinformdeploymentsinfuturestudies.Doyourcomparisonsshowlessagreementbetweenthemethodsclosertothebank?Thesearequestionseasilyansweredfromyourdatasetwithoutmuchadditionalanalyses.Wehaveaddedaparagraphtothediscussionsectiontoaddressthispoint.Pleaseseepage10,lineX6 Couldyouprovidemoreinformationonhowthecumulativedensityplotsareprepared?Itisstatedonpage4line30thatEq.1isaveragedoveradunefield.ThereisnomentionofhowtheCDFareprepared.Howmanybedelevationprofilesareneededbeforea‘stationary’averagebedloadtransportrateisobtained?Howfarapartdothelinesneedtobe?Answerstothesequestionscouldhelpguidesurveysusingboat-mountedsinglebeamsonars.(itisstatedthatthisisnotofconcernforthepaper,howevertheextractedprofilesfromthemultibeamsurveyisessentialthat).Equation1producesabedloadtransportestimatethatistheaveragefortheentirebedelevationprofile.Thisisbecauseweareusinganaveragebedformheightandaveragedunecelerity.Therefore,eachtimestepateachlocationhasonebedloadtransportestimate.Wethenaveragealltimestepsateachlocationforadailyaveragebedloadtransportrate.ThusCDFsfor

repeatmultibeamJulydatacontain20estimatesofdailybedloadtransportwhilerepeatmultibeamCDFsforMarchcontain40dailybedloadtransportestimate.SinglebeamCDFscontain20and40bedloadtransportestimatesforJulyandMarchdatarespectively.Thereisreferencetoafigure5andfigure6onpage6,butfiguresareonly1-4.Ihaveattachedanannotatedpdfwithothertechnicalissues.Pleaseseeforgrammarandothercomments.Thankyouandapologiesfortheconfusion.Thosefigurereferenceswereforapreviousversionandweremistakenlyleftinthisversion. Pleasealsonotethesupplementtothiscomment:https://www.earth-surf-dynam-discuss.net/esurf-2019-38/esurf-2019-38-RC3-supplement.pdfWehavecorrectedthegrammaticalandspellingerrorshighlightedinthissupplement.