Embed Size (px)
Citation preview

Harvard Data Science Review
Estimating Probabilities ofSuccess of Vaccine andOther Anti-InfectiveTherapeutic DevelopmentProgramsAndrew W. Lo1, Kien Wei Siah2, Chi Heem Wong2
1MIT Sloan School of Management & Laboratory for Financial Engineering,2MIT Department of Electrical Engineering and Computer Science & MIT Computer Science andArti�cial Intelligence Lab (CSAIL)
Published on: May 14, 2020

Harvard Data Science Review Estimating Probabilities of Success of Vaccine and Other Anti-Infective Therapeutic Development Programs
2
ABSTRAC T
A key driver in biopharmaceutical investment decisions is the probability of success of a drug
development program. We estimate the probabilities of success (PoSs) of clinical trials for vaccines
and other anti-infective therapeutics using 43,414 unique triplets of clinical trial, drug, and disease
between January 1, 2000, and January 7, 2020, yielding 2,544 vaccine programs and 6,829 nonvaccine
programs targeting infectious diseases. The overall estimated PoS for an industry-sponsored vaccine
program is 39.6%, and 16.3% for an industry-sponsored anti-infective therapeutic. Among industry-
sponsored vaccines programs, only 12 out of 27 disease categories have seen at least one approval, with
the most successful being against monkeypox (100%), rotavirus (78.7%), and Japanese encephalitis
(67.6%). The three infectious diseases with the highest PoSs for industry-sponsored nonvaccine
therapeutics are smallpox (100%), cytomegalovirus (CMV) infection (31.8%), and onychomycosis
(29.8%). Non-industry-sponsored vaccine and nonvaccine development programs have lower overall
PoSs: 6.8% and 8.2%, respectively. Viruses involved in recent outbreaks—Middle East respiratory
syndrome (MERS), severe acute respiratory syndrome (SARS), Ebola, and Zika—have had a combined
total of only 45 nonvaccine development programs initiated over the past two decades, and no
approved therapy to date. These estimates offer guidance both to biopharma investors as well as to
policymakers seeking to identify areas most likely to be underserved by private sector engagement
and in need of public sector support.
Keywords: vaccines, infectious diseases, probabilities of success, randomized clinical trials, health
care finance
Media SummaryThe economic value of a drug or medical device development program is typically computed by
assessing the program’s cumulative revenues if successful. Therefore, the probability of success (PoS)
is a key input into every major decision of every biopharmaceutical company about whether or not to
undertake or continue a given program and how much resources to devote to it. And because
cumulative revenues are often measured in the tens of billions of dollars, small differences in PoS
estimates can lead to very large differences in estimated profitability, which, in turn, can lead to very
different investment decisions and funding levels. Therefore, having timely measures of PoS that are
as accurate as the data will allow is a prerequisite for managing biopharma assets. These issues are
particularly relevant for deciding among the many responses to the COVID-19 pandemic currently
being contemplated by all biomedical stakeholders.

Harvard Data Science Review Estimating Probabilities of Success of Vaccine and Other Anti-Infective Therapeutic Development Programs
3
In this article, we provide PoS estimates of clinical trial outcomes for vaccines and other anti-infective
therapeutics using 43,414 unique triplets of clinical trial, drug, and disease between January 1, 2000,
and January 7, 2020, yielding 2,544 vaccine programs and 6,829 nonvaccine programs targeting
infectious diseases, the largest data set of its kind.
The overall estimated PoS for an industry-sponsored vaccine program is 39.6%, and 16.3% for an
industry-sponsored anti-infective therapeutic. Among industry-sponsored vaccines programs, only 12
out of 27 disease categories have seen at least one approval, with the most successful being against
monkeypox (100%), rotavirus (78.7%), and Japanese encephalitis (67.6%). The three infectious diseases
with the highest PoSs for industry-sponsored nonvaccine therapeutics are smallpox (100%),
cytomegalovirus (CMV) infection (31.8%), and onychomycosis (29.8%). Non-industry-sponsored vaccine
and nonvaccine development programs have lower overall PoSs: 6.8% and 8.2%, respectively. Viruses
involved in recent outbreaks—Middle East respiratory syndrome (MERS), severe acute respiratory
syndrome (SARS), Ebola, and Zika—have had a combined total of only 45 nonvaccine development
programs initiated over the past two decades, and no approved therapy to date.
As governments around the world begin to formulate a more systematic strategy for dealing with
pandemics beyond COVID-19, these estimates can be used by policymakers to identify areas most likely
to be underserved by private sector engagement and in need of public sector support.
1. IntroductionIn this article, we provide estimates of the historical probabilities of success (PoSs) of clinical trials for
vaccines and other therapeutic drugs for infectious diseases to inform discussions on the planning and
financing of the fight against one of humanity’s oldest foes. This is of particular importance in light of
the recent havoc wreaked by severe acute respiratory syndrome coronavirus 2 (SARS-CoV-2), the virus
that causes coronavirus disease (COVID-19).
While the PoSs of therapeutic drugs for various disease groups like oncology are well-documented
(Abrantes-Metz et al., 2004; DiMasi et al., 2010; Hay et al., 2014; MIT Laboratory for Financial
Engineering, 2020; Smietana et al., 2016; Thomas et al., 2016; Wong et al., 2019a, 2019b), relatively little
has been published on treatments for infectious diseases and vaccine development despite their
importance (Davis et al., 2011; Pronker et al., 2013). Prior studies have focused on narrower subsets
relevant to their specific interests and have relied on much more limited data sets. For example, Young
et al. (2020) employed 10 to 25 data points per estimated value from the Bill and Melinda Gates
Foundation to estimate the PoS of vaccines for neglected diseases, and DiMasi et al. (2020) reported
PoS estimates on a per-drug basis using 2,575 trials for diseases of interest to the Gates Foundation. In

Harvard Data Science Review Estimating Probabilities of Success of Vaccine and Other Anti-Infective Therapeutic Development Programs
4
contrast, we employ a much larger and broader data set of 16,328 unique clinical trials to estimate the
PoSs of vaccines and nonvaccine therapeutics targeting 29 different infectious diseases using all
available drug-indication pairs—a methodology that has been argued to be more relevant for
evaluating drug development R&D risk and productivity (Wong et al., 2019b).
Vaccination is commonly recognized as one of the most cost-effective public health measures for
combatting infectious diseases (André, 2002; Ehreth, 2003; Kieny & Girard, 2005; Organisation for
Economic Co-operation and Development [OECD], 2013; Pronker et al., 2013; Rémy et al., 2015). In
developed countries, routine prophylactic vaccination and effective treatment options have led to the
control or complete elimination of several deadly infectious diseases through individual and herd
immunity, preventing millions of deaths and untold suffering each year. This prophylaxis dramatically
reduces the burden on the health care system and society as a whole. In addition, the deaths,
hospitalizations, and treatment costs avoided by these measures have led to significant economic
savings (Ehreth, 2003; Rémy et al., 2015; U.S. Department of Health and Human Services, 2017).
As technology continues to advance, one expects that the human species will be better able to cope
with these diseases. The fact remains, however, that we still do not have effective treatments or
vaccines for many infectious diseases. While the discovery of antibiotics has reduced the mortality rate
of bacterial infection, and the development of the smallpox vaccine has led to the eradication of the
devastating disease (World Health Organization, 1980), other infectious diseases, such as acquired
immunodeficiency syndrome (AIDS) and malaria, still take the lives of tens of millions every year.
According to the World Health Organization, there are currently only 26 infectious diseases that are
preventable by available vaccines (World Health Organization, 2020).
By developing better risk measures for therapeutic development, we hope to facilitate greater
investment, identification of underserved areas that require public sector support, and more efficient
business and financing models in this critical field.
2. MethodsWe apply the method of Wong et al. (2019b) to estimate the PoSs of drug development programs using
historical clinical trial data. This method was also applied in Wong et al. (2019a) to investigate the
clinical success rates of oncology development programs. We briefly describe this method, with parts
reproduced from the aforementioned articles for expositional convenience.
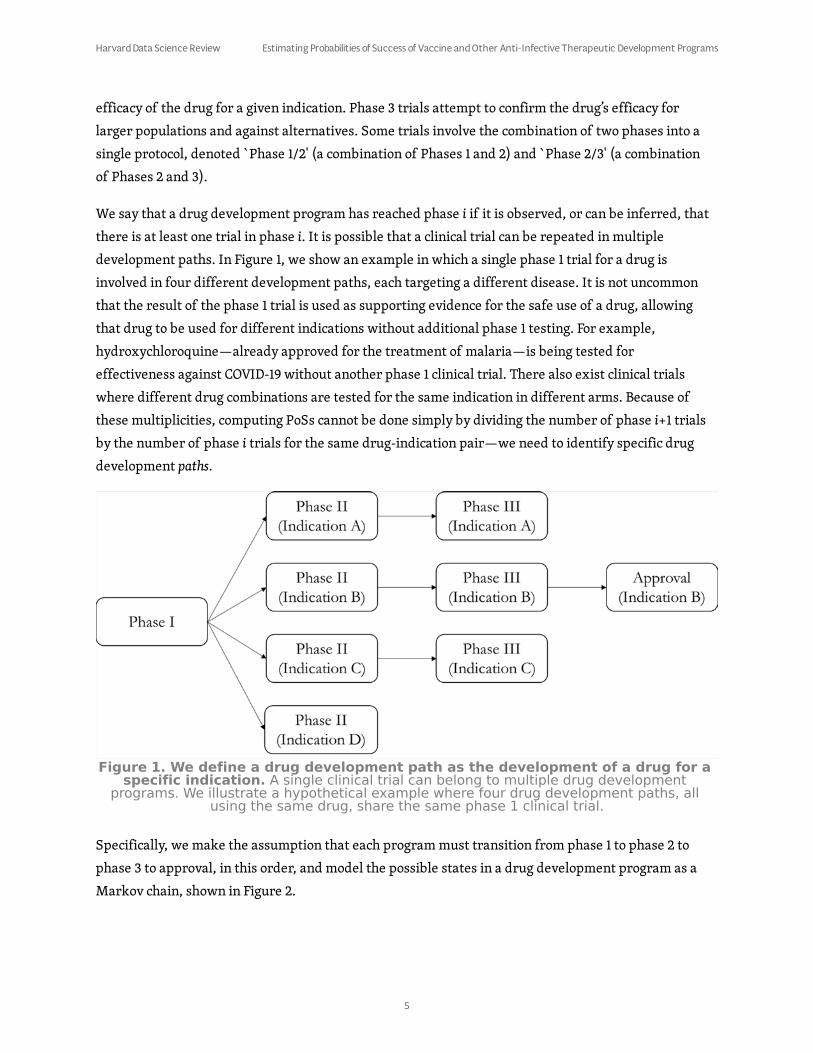
A drug development program, also known as a drug development path, is the clinical investigation of
the use of a drug for a disease. It typically consists of a sequence of clinical trials, separated into three
phases. Phase 1 trials test mainly the safety and tolerance of a drug while phase 2 trials test the
Harvard Data Science Review Estimating Probabilities of Success of Vaccine and Other Anti-Infective Therapeutic Development Programs
5
efficacy of the drug for a given indication. Phase 3 trials attempt to confirm the drug’s efficacy for
larger populations and against alternatives. Some trials involve the combination of two phases into a
single protocol, denoted `Phase 1/2' (a combination of Phases 1 and 2) and `Phase 2/3' (a combination
of Phases 2 and 3).
We say that a drug development program has reached phase i if it is observed, or can be inferred, that
there is at least one trial in phase i. It is possible that a clinical trial can be repeated in multiple
development paths. In Figure 1, we show an example in which a single phase 1 trial for a drug is
involved in four different development paths, each targeting a different disease. It is not uncommon
that the result of the phase 1 trial is used as supporting evidence for the safe use of a drug, allowing
that drug to be used for different indications without additional phase 1 testing. For example,
hydroxychloroquine—already approved for the treatment of malaria—is being tested for
effectiveness against COVID-19 without another phase 1 clinical trial. There also exist clinical trials
where different drug combinations are tested for the same indication in different arms. Because of
these multiplicities, computing PoSs cannot be done simply by dividing the number of phase i+1 trials
by the number of phase i trials for the same drug-indication pair—we need to identify specific drug
development paths.
Specifically, we make the assumption that each program must transition from phase 1 to phase 2 to
phase 3 to approval, in this order, and model the possible states in a drug development program as a
Markov chain, shown in Figure 2.
Figure 1. We define a drug development path as the development of a drug for a
specific indication. A single clinical trial can belong to multiple drug development
programs. We illustrate a hypothetical example where four drug development paths, all
using the same drug, share the same phase 1 clinical trial.

Harvard Data Science Review Estimating Probabilities of Success of Vaccine and Other Anti-Infective Therapeutic Development Programs
6
We infer missing transitions in the development paths arising from incomplete records. This is
plausible since each of these stages involves distinct predefined tests, all of which are required by
regulators in any new drug application (NDA). If we observe data for phases 1 and 3 but not phase 2 for
a given drug-indication pair, our idealized process implies that there was at least one phase 2 trial that
occurred, but is missing from our data set. Accordingly, we impute the successful completion of phase
2 in these cases. There exist some rare cases where phase 2 trials are skipped, as with the example of
aducanumab (BIIB037), Biogen’s Alzheimer’s candidate, as reported by Root (2014). Since skipping
phase 2 trials is motivated by compelling phase 1 data and is approved by the regulatory authorities,
imputing the successful completion of phase 2 trials in these cases to trace drug development paths is a
reasonable approximation. We make the standard assumption that phase 1/2 and phase 2/3 trials are
to be considered as phase 2 and phase 3 trials, respectively.
We call the estimated probability of a drug development program transitioning from phase i to phase i
+ 1 the “phase i PoS,” and the “estimated overall PoS” is defined as the estimated probability of a drug
development program going from phase 1 to regulatory approval in at least one country. To simplify
terminology, we will henceforth omit the qualifier ‘estimated’ when referring to the PoS, so it should
be understood that all PoS values reported in this article are statistical estimates of unobservable
population parameters.
The probability of a drug development program transitioning from phase i to phase j (PoSij) can be
computed using the simple ratio Nj/Ni, where Ni is the number of drug development programs that
have reached phase i (where i = 1, 2, or 3) of the drug development process and are not in active
Figure 2. Observed and unobserved states of a drug development program, from
phase 1 to approval. A drug development program is in phase i if it has at least one trial
in phase i. The “missing” states represent phases where we do not observe any clinical trial
in that phase for the drug-indication pair, but where we know it must have occurred. Every
drug development path in our study must start from phase 1 (or “missing” phase 1) and
end up in one of the nodes labeled as “in progress,” “terminated,” or “approval.”

Harvard Data Science Review Estimating Probabilities of Success of Vaccine and Other Anti-Infective Therapeutic Development Programs
7
development between phase i and phase j (where j = 2, 3, or “A,” which denotes regulatory approval, i <
j), and Nj is the number of drug development programs among the former that made it to phase j. PoS1A
is also known as the “overall PoS.” We provide simple numerical examples in the Appendix (Section
A1) to clarify our algorithms.
The estimated probability of a drug development program transitioning from phase 1 to approval—
estimated directly using the method described above—is called the ‘path-by-path’ estimate of the
overall PoS, and is reported for all PoS calculations. Our method of inferring unobserved states and
computing the PoS using the simple ratio defined above applies to both vaccines and nonvaccine
therapeutics. In fact, since it is common for vaccine candidates to skip phase 1 and move directly to
phase 2 or 3 based on initial safety of the vaccine base (e.g., egg, etc.) after changing the virus within it,
filling in unobserved phases will lead to a more accurate PoS.
It should be emphasized that because of the treatment of in-progress drug development programs,
path-by-path PoS estimates are not multiplicative, that is, . In
contrast, the phase-by-phase estimates used in prior studies (DiMasi et al., 2010, 2020; Hay et al.,
2014; Thomas et al., 2016) do multiply, that is, . The latter two
studies do not fill in unobserved clinical development phases. We elaborate on the differences between
the path-by-path and phase-by-phase methods in the Appendix (see Section A2).
We compute the path-by-path PoSs using an algorithm that recursively considers all possible drug-
indication pairs and determines the maximum observed phase. As the Markov chain model implies,
reaching phase i would imply that all prior phases were completed. To determine if a drug
development program has been terminated in the last observed phase or is still ongoing, we use a
simple heuristic: If the time elapsed between the end date of the most recent phase i and the end of
our sample exceeds a certain threshold ti, we conclude that the trial has terminated. Based on practical
considerations, we set ti, to be 360, 540, and 900 days for phases 1, 2, and 3, respectively. For example,
we assume that it takes approximately 6 months to prepare documents for an NDA filing after a phase
3 trial has been completed. Since the U.S. Food and Drug Administration (FDA) has a 6-month period to
decide if it wishes to follow up on a filing, and an additional 18 months to deliver a verdict, this places
the overall time between phase 3 and approval to about 30 months, hence we set t3 = 900 days. Based
on these criteria, we will consider only drug development programs that have seen at least one trial
with a definite outcome in the PoS computations. More detailed exposition of and pseudocode for this
algorithm can be found in Wong et al. (2019b).
PoS ×12 PoS ×23 PoS =3A PoS1A
PoS ×12 PoS ×23 PoS =3A PoS1A

Harvard Data Science Review Estimating Probabilities of Success of Vaccine and Other Anti-Infective Therapeutic Development Programs
8
3. DataWe extracted clinical trials metadata from the January 7, 2020, snapshots of Citeline’s PharmaProjects
and TrialTrove databases, provided by Informa Pharma Intelligence. These data are widely available
commercially as well as through an academic license. Clinical trial metadata was retrieved from the
TrialTrove database while the approval data was obtained from the PharmaProjects database, both of
which are required to identify the drug development programs. In addition to incorporating multiple
data streams, including nightly feeds from official sources such as ClinicalTrials.gov, Citeline contains
data from primary sources such as institutional press releases, financial reports, study reports, drug
marketing label applications, and secondary sources such as analyst reports by consulting companies.
Secondary sources are particularly important for reducing potential biases that may arise from the
tendency of organizations to report only successful trials, especially those prior to the FDA
Amendments Act of 2007, which requires all clinical trials conducted in the U.S. to be registered and
tracked via ClinicalTrials.gov. The databases we use contain information from both U.S. and non-U.S.
sources. We consider a drug approved if it is approved in any country. All clinical trials used in this
analysis have end dates after January 1, 2000, and start dates before January 7, 2020.
We filter our data to include only trials that have been tagged by Citeline as being in the “Infectious
Disease” or “Vaccines (Infectious Diseases)” therapeutic areas. The vaccine types and diseases are
provided by the databases. The database encodes each unique triplet of trial identification number,
drug, and disease as a datapoint. Therefore, a single trial may appear as multiple datapoints. Since the
two therapeutic areas may overlap in datapoints, we define clinical trials that are involved in any
vaccine development as part of a vaccine development program. In addition, we process the data such
that more specific diseases (e.g., rabies) can be identified instead of broad vaccine classes (e.g., vector
borne disease vaccines). Clinical trials that are not involved in any vaccine development program will
be deemed to be part of a nonvaccine drug development program. We derive 43,414 datapoints in total.
We define an industry-sponsored development program as one where there is at least one commercial
company involved in any stage of clinical development. The complement—in which there is no
commercial company involved in any stage of the vaccine or drug development program—shall be
referred to as non-industry-sponsored. Given these definitions, a drug or vaccine development
program (and the clinical trials in the program) can belong to only one of these mutually exclusive sets:
industry-sponsored vaccines, industry-sponsored nonvaccine therapeutics, non-industry-sponsored
vaccines, and non-industry-sponsored nonvaccine therapeutics.
The vaccines in TrialTrove are identified by broad categories such as “respiratory vaccines,” “other
viral vaccines,” or “hepatitis vaccines.” We attempt to infer the diseases targeted by the vaccines by
cross-referencing the disease tags for each clinical trial. For example, a clinical trial may be tagged
with both “hepatitis vaccines” and “HBV,” allowing us to conclude that the vaccine is indicated for HBV

Harvard Data Science Review Estimating Probabilities of Success of Vaccine and Other Anti-Infective Therapeutic Development Programs
9
(hepatitis B virus). Those clinical trials that have only vaccine tags will have their disease labeled as
“others.” Manual inspection of some of the clinical trial titles shows that this category includes
diseases such as measles and tuberculosis.
We plot the number of development programs known to start in each month from January 2000
through December 2019 in Figure 3. There are 1,838 and 706 industry-sponsored and non-industry-
sponsored vaccine development programs, respectively, and, 3,851 and 2,978 industry-sponsored and
non-industry-sponsored nonvaccine drug development programs targeting infectious diseases,
respectively. As can be seen in Figure 3A, the number of industry-sponsored clinical programs
attempting to treat infectious diseases is often greater than the number of vaccine development
programs. We see a precipitous fall in the number of infectious disease treatment development
programs initiated between late 2018 and mid-2019, which is likely related to declining investment in
the research and development (R&D) of novel antibiotics, precipitated by the closure of antibiotics
biotechnology firms and the withdrawal of pharmaceutical companies from the antibiotics business
(Hu, 2018; Langreth, 2019).
Between January 2000 and June 2011, the number of non-industry-sponsored vaccine development
programs initiated is on par with the number of non-industry-sponsored, nonvaccine anti-infective
drug development programs initiated (see Figure 3B). However, the number of nonvaccine drug
development programs initiated begins to outpace the number of vaccine development programs after
January 2012, and such programs experience a rapid boom between mid-2015 and mid-2018 before
declining rapidly between October 2018 and January 2019.
Figure 3A

Harvard Data Science Review Estimating Probabilities of Success of Vaccine and Other Anti-Infective Therapeutic Development Programs
10
Figure 3. The number of development programs initiated per month from January 2000 through December 2019 in
the areas of vaccine and nonvaccine treatment for infectious diseases (thin, light colored lines). The darker, thicker
lines represent the 6-month moving average of the individual series. A. Number of industry-sponsored development
programs initiated. B. Number of non-industry-sponsored development programs initiated.
4. Results
4.1 VaccinesOverall, 2,544 vaccine development programs are observed in our data set, of which 1,838 are
sponsored by industry and 706 do not involve any industry sponsor in any stage of development. For
industry-sponsored drug development programs, respiratory infections is the most actively
researched vaccine category, comprising 34.8% (n = 640) of all vaccine development programs (see
Figure 4). HBV and human immunodeficiency virus (HIV) vaccines represent 11.6% (n = 213) and 9.8% (n
= 181) of all vaccine development programs, respectively, whereas intra-abdominal infections,
monkeypox, and severe acute respiratory syndrome (SARS) vaccines are the least researched fields,
with only one development path observed per disease.
A similar pattern can be seen for the non-industry-sponsored vaccine development programs;
excluding the others category, the top three most researched vaccine categories are also respiratory
infections (24.8%), HIV (20.4%), and HBV (8.2%), whereas Middle East respiratory syndrome (MERS)
and SARS are the least researched diseases with one development program each.
Figure 3B

Harvard Data Science Review Estimating Probabilities of Success of Vaccine and Other Anti-Infective Therapeutic Development Programs
11
Figure 4. Number of vaccine development programs observed for each vaccine type. A. Number of industry-
sponsored vaccine development programs. B. Number of non-industry-sponsored vaccine development programs.
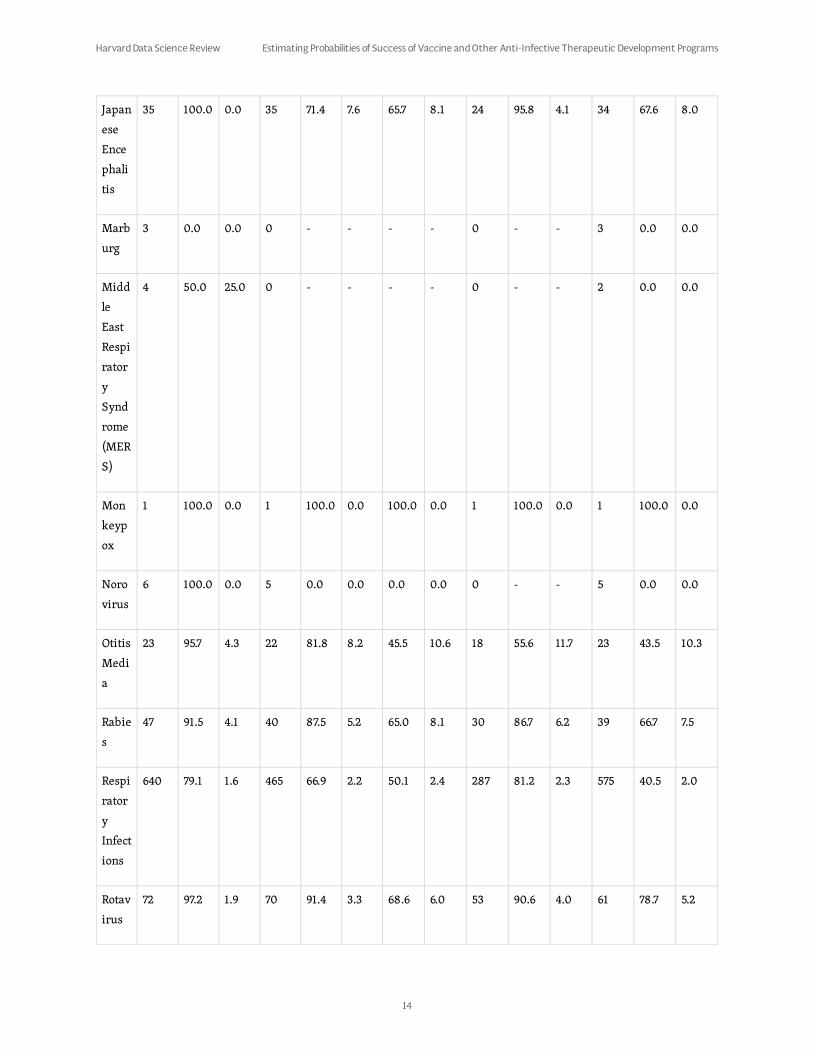
From Table 1, we can see that the overall PoS for industry-sponsored vaccine development programs is
39.6% (SE = 1.2%), which is substantially higher than the average overall PoS of 11.0% (SE = 0.2%) across
all industry-sponsored drug development programs (see Table A2 in the Appendix). These findings are
largely in line with the results of Wong et al. (2019b), who first observed this trend, and of DiMasi et al.
(2020), despite the fact that the latter computed their estimates using a different method (a phase-by-
phase approach) and considered only lead indications. We estimate PoS12, PoS23, and PoS3A to be
82.5% (SE = 0.9%), 65.4% (SE = 1.3%), and 80.1% (SE = 1.4%), respectively.
Figure 4A
Figure 4B

Harvard Data Science Review Estimating Probabilities of Success of Vaccine and Other Anti-Infective Therapeutic Development Programs
12
Across all industry-sponsored vaccine development programs, we can see that monkeypox vaccines
have had the most developmental success, followed by rotavirus and Japanese encephalitis vaccines
(see Table 1). Their overall success rates are 100% (SE = 0.0%), 78.7% (SE = 5.2%), and 67.6% (SE = 8.0%),
respectively. The overall PoS for monkeypox is based on only one sample. Only 12 diseases out of the 27
disease categories with at least one development path observed have seen at least one approved
vaccine.
Table 1. The Probabilities of Success (PoSs) of Industry-Sponsored Vaccine Drug Development
Programs.1
Disea
se
P1
Path
s
PoS12 SE P2
Path
s
PoS23 SE PoS2
A
SE P3
Paths
PoS3
A
SE Paths PoS1A SE
Bacte
rial
Skin
Infect
ion
12 83.3 10.8 7 14.3 13.2 0.0 0.0 1 0.0 0.0 9 0.0 0.0
Chik
ungu
nya
6 83.3 15.2 0 - - - - 0 - - 1 0.0 0.0
Clostr
idiu
m
diffic
ile
6 100.0 0.0 6 33.3 19.2 0.0 0.0 0 - - 4 0.0 0.0
Cyto
mega
lovir
us
(CMV
)
Infect
ion
14 57.1 13.2 3 33.3 27.2 0.0 0.0 0 - - 8 0.0 0.0
Ebola 13 53.8 13.8 7 57.1 18.7 28.6 20.2 2 100.0 0.0 11 18.2 11.6

Harvard Data Science Review Estimating Probabilities of Success of Vaccine and Other Anti-Infective Therapeutic Development Programs
13
Hepa
titis
B
Virus
(HBV
)
213 94.8 1.5 187 74.9 3.2 54.5 3.7 132 77.3 3.6 190 53.7 3.6
Hepa
titis
C
Virus
(HCV
)
27 70.4 8.8 15 0.0 0.0 0.0 0.0 0 - - 23 0.0 0.0
Hum
an
Imm
unod
eficie
ncy
Virus
(HIV)
181 65.2 3.5 95 36.8 4.9 0.0 0.0 21 0.0 0.0 144 0.0 0.0
Hum
an
Papill
omav
irus
(HPV
)
120 88.3 2.9 69 52.2 6.0 36.2 6.1 30 83.3 6.8 77 32.5 5.3
Intra
-
abdo
minal
Infect
ions
1 100.0 0.0 1 100.0 0.0 0.0 0.0 1 0.0 0.0 1 0.0 0.0
Harvard Data Science Review Estimating Probabilities of Success of Vaccine and Other Anti-Infective Therapeutic Development Programs
14
Japan
ese
Ence
phali
tis
35 100.0 0.0 35 71.4 7.6 65.7 8.1 24 95.8 4.1 34 67.6 8.0
Marb
urg
3 0.0 0.0 0 - - - - 0 - - 3 0.0 0.0
Midd
le
East
Respi
rator
y
Synd
rome
(MER
S)
4 50.0 25.0 0 - - - - 0 - - 2 0.0 0.0
Mon
keyp
ox
1 100.0 0.0 1 100.0 0.0 100.0 0.0 1 100.0 0.0 1 100.0 0.0
Noro
virus
6 100.0 0.0 5 0.0 0.0 0.0 0.0 0 - - 5 0.0 0.0
Otitis
Medi
a
23 95.7 4.3 22 81.8 8.2 45.5 10.6 18 55.6 11.7 23 43.5 10.3
Rabie
s
47 91.5 4.1 40 87.5 5.2 65.0 8.1 30 86.7 6.2 39 66.7 7.5
Respi
rator
y
Infect
ions
640 79.1 1.6 465 66.9 2.2 50.1 2.4 287 81.2 2.3 575 40.5 2.0
Rotav
irus
72 97.2 1.9 70 91.4 3.3 68.6 6.0 53 90.6 4.0 61 78.7 5.2

Harvard Data Science Review Estimating Probabilities of Success of Vaccine and Other Anti-Infective Therapeutic Development Programs
15
Note. A = regulatory approval; P1 = phase 1; P2 = phase 2; P3 = phase 3.
Sepsi
s
13 38.5 13.5 5 80.0 17.9 0.0 0.0 4 0.0 0.0 13 0.0 0.0
Sever
e
Acute
Respi
rator
y
Synd
rome
(SAR
S)
1 0.0 0.0 0 - - - - 0 - - 1 0.0 0.0
Small
pox
11 81.8 11.6 8 62.5 17.1 50.0 17.7 5 80.0 17.9 10 40.0 15.5
Urina
ry
Tract
Infect
ions
3 100.0 0.0 3 100.0 0.0 0.0 0.0 1 0.0 0.0 1 0.0 0.0
West
Nile
Virus
(WN
V)
4 25.0 21.7 1 100.0 0.0 0.0 0.0 1 0.0 0.0 4 0.0 0.0
Yello
w
Fever
30 90.0 5.5 26 73.1 8.7 57.7 10.5 15 100.0 0.0 25 60.0 9.8
Zika 2 0.0 0.0 0 - - - - 0 - - 2 0.0 0.0
Other
s
350 87.1 1.8 268 63.4 2.9 47.0 3.2 142 88.7 2.7 285 44.2 2.9
Total 1,838 82.5 0.9 1,339 65.4 1.3 45.9 1.4 768 80.1 1.4 1552 39.6 1.2

Harvard Data Science Review Estimating Probabilities of Success of Vaccine and Other Anti-Infective Therapeutic Development Programs
16
In contrast, non-industry-sponsored vaccine development programs have an overall PoS of only 6.8%
(SE = 1.0%), with PoS12, PoS23, and PoS3A estimates of 63.3% (SE = 1.8%), 37.3% (SE = 2.6%), and 39.8%
(SE = 4.9%), respectively (Table 2). The top three indications with the highest overall success rates for
non-industry-sponsored drug development programs are otitis media (28.6%, SE = 17.1%), rabies
(25.0%, SE = 10.8%), and Japanese encephalitis (25.0%, SE = 21.7%). The latter estimates are derived
from only a handful of samples and must be interpreted with caution as their large standard errors
suggest.
Table 2. The Probabilities of Success (PoSs) of Non-Industry-Sponsored Vaccine Development
Programs.2
Disea
se
P1
Path
s
PoS12 SE P2
Path
s
PoS23 SE PoS2
A
SE P3
Paths
PoS3
A
SE Paths PoS1A SE
Bacte
rial
Skin
Infect
ion
3 100.0 0.0 0 - - - - 0 - - 0 0.0 0.0
Clostr
idiu
m
diffic
ile
3 66.7 27.2 0 - - - - 0 - - 1 0.0 0.0
Cyto
mega
lovir
us
(CMV
)
Infect
ion
14 50.0 13.4 5 40.0 21.9 40.0 21.9 2 100.0 0.0 12 16.7 10.8
Ebola 8 12.5 11.7 0 - - - - 0 - - 7 0.0 0.0

Harvard Data Science Review Estimating Probabilities of Success of Vaccine and Other Anti-Infective Therapeutic Development Programs
17
Hepa
titis
B
Virus
(HBV
)
58 91.4 3.7 48 47.9 7.2 8.3 4.3 16 25.0 10.8 46 8.7 4.2
Hepa
titis
C
Virus
(HCV
)
10 70.0 14.5 5 0.0 0.0 0.0 0.0 0 - - 8 0.0 0.0
Hum
an
Imm
unod
eficie
ncy
Virus
(HIV)
144 48.6 4.2 62 3.2 2.2 0.0 0.0 2 0.0 0.0 136 0.0 0.0
Hum
an
Papill
omav
irus
(HPV
)
32 87.5 5.8 16 56.3 12.4 6.3 6.5 7 14.3 13.2 18 5.6 5.4
Intra
-
abdo
minal
Infect
ions
3 100.0 0.0 0 - - - - 0 - - 0 0.0 0.0

Harvard Data Science Review Estimating Probabilities of Success of Vaccine and Other Anti-Infective Therapeutic Development Programs
18
Japan
ese
Ence
phali
tis
4 100.0 0.0 4 100.0 0.0 25.0 21.7 4 25.0 21.7 4 25.0 21.7
Midd
le
East
Respi
rator
y
Synd
rome
(MER
S)
1 100.0 0.0 0 - - - - 0 - - 0 0.0 0.0
Otitis
Medi
a
7 100.0 0.0 7 28.6 17.1 28.6 17.1 2 100.0 0.0 7 28.6 17.1
Rabie
s
16 81.3 9.8 13 53.8 13.8 30.8 12.8 7 57.1 18.7 16 25.0 10.8
Respi
rator
y
Infect
ions
175 66.9 3.6 101 51.5 5.0 16.8 3.9 41 41.5 7.7 148 11.5 2.6
Rotav
irus
5 80.0 17.9 4 50.0 25.0 0.0 0.0 1 0.0 0.0 4 0.0 0.0
Sepsi
s
7 42.9 18.7 2 0.0 0.0 0.0 0.0 0 - - 6 0.0 0.0

Harvard Data Science Review Estimating Probabilities of Success of Vaccine and Other Anti-Infective Therapeutic Development Programs
19
Note. A = regulatory approval; P1 = phase 1; P2 = phase 2; P3 = phase 3.
Sever
e
Acute
Respi
rator
y
Synd
rome
(SAR
S)
1 0.0 0.0 0 - - - - 0 - - 1 0.0 0.0
Small
pox
11 63.6 14.5 6 16.7 15.2 16.7 15.2 1 100.0 0.0 10 10.0 9.5
Urina
ry
Tract
Infect
ions
3 100.0 0.0 1 0.0 0.0 0.0 0.0 0 - - 1 0.0 0.0
West
Nile
Virus
(WN
V)
4 0.0 0.0 0 - - - - 0 - - 4 0.0 0.0
Yello
w
Fever
9 66.7 15.7 6 33.3 19.2 0.0 0.0 1 0.0 0.0 8 0.0 0.0
Zika 5 40.0 21.9 0 - - - - 0 - - 3 0.0 0.0
Other
s
183 57.9 3.6 71 35.2 5.7 9.9 3.8 14 50.0 13.4 137 5.1 1.9
Total 706 63.3 1.8 351 37.3 2.6 11.1 1.8 98 39.8 4.9 577 6.8 1.0

Harvard Data Science Review Estimating Probabilities of Success of Vaccine and Other Anti-Infective Therapeutic Development Programs
20
4.2 Nonvaccine Anti-Infective TherapeuticsIn contrast to vaccines, which are intended to prevent disease, a number of alternatives have been
developed to treat—and, in some cases, cure—patients afflicted with an infectious disease. According
to our data set, 3,851 and 2,978 industry-sponsored and non-industry-sponsored nonvaccine drug
development programs, respectively, have been initiated in the area of infectious disease (see Figure
5). The top three diseases with the greatest number of industry-sponsored drug development
programs are respiratory infections (21.8%), HIV (15.7%) and hepatitis C virus, or HCV (14.1%).
Together, they comprise 51.6% of all industry-sponsored nonvaccine development programs. Non-
industry anti-infectious-disease drug development programs focus on treating respiratory infections
(20.5%), HIV (13.9%), and bacterial skin infection (12.1%).
With respect to addressing the most recent virus outbreaks—MERS, SARS, Ebola, and Zika—a total of
nine industry-sponsored and 36 non-industry-sponsored nonvaccine drug development programs
were initiated over the past 20 years, and there have been no approved therapies to date.
Figure 5A

Harvard Data Science Review Estimating Probabilities of Success of Vaccine and Other Anti-Infective Therapeutic Development Programs
21
Figure 5. Number of nonvaccine drug development programs for each disease in the “Infectious Disease” category.
A. Number of industry-sponsored, nonvaccine drug development programs. B. Number of non-industry-sponsored,
nonvaccine drug development programs.
From Table 3, we can see that the overall PoS across all industry-sponsored drug development
programs treating infectious diseases is 16.3% (SE = 0.7%). The PoS12, PoS23, and PoS3A are 65.0% (SE =
0.8%), 64.3% (SE = 1.0%), and 51.1% (SE = 1.6%), respectively. Based on our data, the highest success
rates for industry-sponsored nonvaccine development programs have been for smallpox (100.0%, SE =
0.0%), cytomegalovirus (CMV) infection (31.8%, SE = 7.0%), and onychomycosis (29.8%, SE = 6.7%).
There are currently no nonvaccine therapies approved for rotavirus, SARS, rabies, Ebola, West Nile
virus, Marburg, yellow fever, chikungunya, MERS, monkeypox, or norovirus. With the exception of
norovirus and MERS, these diseases without any vaccine are predominantly prevalent in
nonindustrialized nations, and thus represent neglected diseases. It is also interesting that for the
latter eight diseases, even the PoS12 is low. Since phase 1 trials in the development of anti-infective
therapies focus primarily on safety, understanding the pharmacokinetics of the compound, and
maximum tolerable dose levels, it can be inferred that the drugs tested are either of high toxicity or
lack the necessary characteristics required for optimal absorption, distribution, metabolism, and
excretion (ODME), or perhaps failed to advance due to financial constraints.
Table 3. The Probabilities of Success (PoSs) of Industry-Sponsored, Nonvaccine Anti-Infective
Drug Development Programs for the Treatment of Infectious Diseases.3
Figure 5B
Disea
se
P1
Path
s
PoS12 SE P2
Path
s
PoS23 SE PoS2
A
SE P3
Paths
PoS3
A
SE Paths PoS1A SE

Harvard Data Science Review Estimating Probabilities of Success of Vaccine and Other Anti-Infective Therapeutic Development Programs
22
Bacte
rial
Skin
Infect
ion
406 54.9 2.5 207 72.9 3.1 19.8 3.2 104 39.4 4.8 343 12.0 1.8
Chik
ungu
nya
1 0.0 0.0 0 - - - - 0 - - 1 0.0 0.0
Clostr
idiu
m
diffic
ile
91 83.5 3.9 66 53.0 6.1 4.5 2.8 25 12.0 6.5 71 4.2 2.4
Cyto
mega
lovir
us
(CMV
)
Infect
ion
64 87.5 4.1 43 60.5 7.5 32.6 7.8 19 73.7 10.1 44 31.8 7.0
Ebola 7 28.6 17.1 1 0.0 0.0 0.0 0.0 0 - - 6 0.0 0.0
Hepa
titis
B
Virus
(HBV
)
186 77.4 3.1 105 68.6 4.5 36.2 5.2 54 70.4 6.2 129 29.5 4.0
Hepa
titis
C
Virus
(HCV
)
542 68.8 2.0 348 52.3 2.7 23.6 2.4 155 52.9 4.0 490 16.7 1.7

Harvard Data Science Review Estimating Probabilities of Success of Vaccine and Other Anti-Infective Therapeutic Development Programs
23
Hum
an
Imm
unod
eficie
ncy
Virus
(HIV)
604 63.2 2.0 326 59.8 2.7 39.3 2.8 167 76.6 3.3 520 24.6 1.9
Hum
an
Papill
omav
irus
(HPV
)
63 85.7 4.4 34 23.5 7.3 11.8 5.7 6 66.7 19.2 41 9.8 4.6
Intra
-
abdo
minal
Infect
ions
182 68.7 3.4 113 72.6 4.2 2.7 2.0 35 8.6 4.7 123 2.4 1.4
Marb
urg
3 0.0 0.0 0 - - - - 0 - - 3 0.0 0.0
Midd
le
East
Respi
rator
y
Synd
rome
(MER
S)
1 0.0 0.0 0 - - - - 0 - - 1 0.0 0.0
Mon
keyp
ox
1 0.0 0.0 0 - - - - 0 - - 1 0.0 0.0

Harvard Data Science Review Estimating Probabilities of Success of Vaccine and Other Anti-Infective Therapeutic Development Programs
24
Non-
tuber
culou
s
Myco
bacte
ria
(NT
M)
Infect
ion
23 87.0 7.0 16 62.5 12.1 6.3 7.7 4 25.0 21.7 13 7.7 7.4
Noro
virus
1 0.0 0.0 0 - - - - 0 - - 1 0.0 0.0
Onyc
homy
cosis
60 85.0 4.6 44 63.6 7.3 31.8 7.6 22 63.6 10.3 47 29.8 6.7
Otitis
Medi
a
152 48.0 4.1 68 80.9 4.8 51.5 6.2 51 68.6 6.5 143 24.5 3.6
Rabie
s
4 75.0 21.7 0 - - - - 0 - - 1 0.0 0.0
Respi
rator
y
Infect
ions
841 64.2 1.7 476 70.0 2.1 22.9 2.2 222 49.1 3.4 666 16.4 1.4
Rotav
irus
2 100.0 0.0 2 0.0 0.0 0.0 0.0 0 - - 2 0.0 0.0
Sepsi
s
334 66.8 2.6 206 64.6 3.3 10.2 2.4 81 25.9 4.9 265 7.9 1.7

Harvard Data Science Review Estimating Probabilities of Success of Vaccine and Other Anti-Infective Therapeutic Development Programs
25
Note. A = regulatory approval; P1 = phase 1; P2 = phase 2; P3 = phase 3.
For non-industry-sponsored nonvaccine development programs, the overall PoS is 8.2% (SE = 0.6%)
while PoS12, PoS23, and PoS3A are 61.0% (SE = 0.9%), 65.2% (SE = 1.2%), and 30.0% (SE = 1.8%),
respectively (see Table 4). The top three indications with the highest overall success rates for non-
industry-sponsored nonvaccine development programs are CMV infection (23.5%, SE = 5.9%),
clostridium difficile (20.5%, SE = 6.5%), and sepsis (17.4%, SE = 2.6%).
Table 4. The Probabilities of Success (PoSs) of Non-Industry-Sponsored, Nonvaccine Anti-
Infective Drug Development Programs.4
Sever
e
Acute
Respi
rator
y
Synd
rome
(SAR
S)
1 100.0 0.0 1 0.0 0.0 0.0 0.0 0 - - 1 0.0 0.0
Small
pox
2 100.0 0.0 2 100.0 0.0 100.0 0.0 2 100.0 0.0 2 100.0 0.0
Urina
ry
Tract
Infect
ions
276 55.1 3.0 143 72.0 3.8 10.5 3.2 51 29.4 6.4 215 7.0 1.7
West
Nile
Virus
(WN
V)
2 50.0 35.4 1 0.0 0.0 0.0 0.0 0 - - 2 0.0 0.0
Yello
w
Fever
2 0.0 0.0 0 - - - - 0 - - 2 0.0 0.0
Total 3,851 65.0 0.8 2,202 64.3 1.0 23.2 1.0 998 51.1 1.6 3,133 16.3 0.7

Harvard Data Science Review Estimating Probabilities of Success of Vaccine and Other Anti-Infective Therapeutic Development Programs
26
Disea
se
P1
Path
s
PoS12 SE P2
Path
s
PoS23 SE PoS2
A
SE P3
Paths
PoS3
A
SE Paths PoS1A SE
Bacte
rial
Skin
Infect
ion
360 46.4 2.6 151 81.5 3.2 19.2 3.7 85 34.1 5.1 306 9.5 1.7
Chik
ungu
nya
2 100.0 0.0 2 50.0 35.4 0.0 0.0 1 0.0 0.0 2 0.0 0.0
Clostr
idiu
m
diffic
ile
83 94.0 2.6 51 76.5 5.9 15.7 6.2 22 36.4 10.3 39 20.5 6.5
Cyto
mega
lovir
us
(CMV
)
Infect
ion
77 83.1 4.3 51 51.0 7.0 23.5 6.9 13 92.3 7.4 51 23.5 5.9
Ebola 30 96.7 3.3 28 14.3 6.6 0.0 0.0 2 0.0 0.0 27 0.0 0.0
Hepa
titis
B
Virus
(HBV
)
171 49.1 3.8 73 47.9 5.8 1.4 1.4 31 3.2 3.2 156 0.6 0.6

Harvard Data Science Review Estimating Probabilities of Success of Vaccine and Other Anti-Infective Therapeutic Development Programs
27
Hepa
tits C
Virus
(HCV
)
139 84.2 3.1 112 43.8 4.7 8.9 2.9 33 30.3 8.0 118 8.5 2.6
Hum
an
Imm
unod
eficie
ncy
Virus
(HIV)
414 61.1 2.4 195 49.2 3.6 13.3 2.6 75 34.7 5.5 335 7.8 1.5
Hum
an
Papill
omav
irus
(HPV
)
71 88.7 3.8 42 42.9 7.6 2.4 2.7 8 12.5 11.7 40 2.5 2.5
Intra
-
abdo
minal
Infect
ions
189 66.1 3.4 112 76.8 4.0 12.5 3.8 51 27.5 6.2 141 9.9 2.5
Japan
ese
Ence
phali
tis
2 100.0 0.0 2 0.0 0.0 0.0 0.0 0 - - 2 0.0 0.0

Harvard Data Science Review Estimating Probabilities of Success of Vaccine and Other Anti-Infective Therapeutic Development Programs
28
Midd
le
East
Respi
rator
y
Synd
rome
(MER
S)
3 100.0 0.0 3 66.7 27.2 0.0 0.0 0 - - 1 0.0 0.0
Non-
tuber
culou
s
Myco
bacte
ria
(NT
M)
Infect
ion
13 84.6 10.0 9 44.4 16.6 11.1 11.9 2 50.0 35.4 9 11.1 10.5
Noro
virus
2 100.0 0.0 1 0.0 0.0 0.0 0.0 0 - - 1 0.0 0.0
Onyc
homy
cosis
20 75.0 9.7 15 66.7 12.2 0.0 0.0 6 0.0 0.0 16 0.0 0.0
Otitis
Medi
a
186 30.1 3.4 53 56.6 6.8 7.5 3.9 24 16.7 7.6 177 2.3 1.1
Rabie
s
1 0.0 0.0 0 - - - - 0 - - 1 0.0 0.0
Respi
rator
y
Infect
ions
610 58.5 2.0 323 72.8 2.5 11.5 2.1 141 26.2 3.7 482 7.7 1.2

Harvard Data Science Review Estimating Probabilities of Success of Vaccine and Other Anti-Infective Therapeutic Development Programs
29
Note. A = regulatory approval; P1 = phase 1; P2 = phase 2; P3 = phase 3.
5. Industry-Sponsored Development ProgramsIn an attempt to shed more light on the industry-sponsored vaccine and nonvaccine drug development
programs, we classify the diseases by their biological family and transmission type. The classifications
are presented in Table A1 in the Appendix. We then compute PoSs using these classifications.
Looking at the vaccine PoSs by transmission route (see Table 5), we see that vaccines for diseases
transmitted through animal bites have the highest overall PoS (61.3%, SE = 4.7%), whereas no vaccine
has been developed for diseases transmitted through contaminated food or water.
Sepsi
s
310 80.0 2.3 227 77.5 2.8 15.9 3.0 94 38.3 5.0 207 17.4 2.6
Sever
e
Acute
Respi
rator
y
Synd
rome
(SAR
S)
3 100.0 0.0 3 100.0 0.0 0.0 0.0 2 0.0 0.0 2 0.0 0.0
Urina
ry
Tract
Infect
ions
291 46.7 2.9 126 73.8 3.9 10.3 3.4 49 26.5 6.3 237 5.5 1.5
West
Nile
Virus
(WN
V)
1 100.0 0.0 1 0.0 0.0 0.0 0.0 0 - - 1 0.0 0.0
Total 2,978 61.0 0.9 1,580 65.2 1.2 12.2 0.9 639 30.0 1.8 2,351 8.2 0.6

Harvard Data Science Review Estimating Probabilities of Success of Vaccine and Other Anti-Infective Therapeutic Development Programs
30
Table 5. The Probabilities of Success (PoSs) of Industry-Sponsored Vaccine Development
Programs, Grouped by Transmission Route.5
Note. A = regulatory approval; P1 = phase 1; P2 = phase 2; P3 = phase 3.
Disea
se
P1
Path
s
PoS12 SE P2
Path
s
PoS23 SE PoS2
A
SE P3
Paths
PoS3
A
SE Paths PoS1A SE
Anim
al
bites
125 89.6 2.7 103 78.6 4.0 63.1 5.0 71 91.5 3.3 106 61.3 4.7
Conta
mina
ted
food
or
wate
r
6 100.0 0.0 5 0.0 0.0 0.0 0.0 0 - - 5 0.0 0.0
Hum
an-
huma
n
(Othe
rs)
643 82.4 1.5 446 62.8 2.3 39.7 2.4 238 74.4 2.8 517 34.2 2.1
Hum
an-
huma
n
(Airb
orne)
16 68.8 11.6 8 62.5 17.1 50.0 17.7 5 80.0 17.9 13 30.8 12.8
Multi
ple or
other
s
1,048 81.9 1.2 777 65.6 1.7 47.5 1.9 454 81.3 1.8 911 40.5 1.6
Total 1,838 82.5 0.9 1,339 65.4 1.3 45.9 1.4 768 80.1 1.4 1,552 39.6 1.2

Harvard Data Science Review Estimating Probabilities of Success of Vaccine and Other Anti-Infective Therapeutic Development Programs
31
We find that companies have been most successful in developing nonvaccine treatments for diseases
transmitted between humans through the air, with 50.0% (SE = 25.0%) of all drug development
programs making it from phase 1 to regulatory approval (see Table 6). Unfortunately, this is based on
only four drug development programs and may not be indicative of the general trend. Treatments for
diseases that transmit through “human to human (others)” have an overall PoS of 21.5% (SE = 1.2%)
while no approval is observed for diseases transmitted through animal bites or contaminated food or
water.
Table 6. The Probabilities of Success (PoSs) of Industry-Sponsored, Nonvaccine Anti-Infective
Drug Development Programs, Grouped by Transmission Route.6
Disea
se
P1
Path
s
PoS12 SE P2
Path
s
PoS23 SE PoS2
A
SE P3
Paths
PoS3
A
SE Paths PoS1A SE
Anim
al
bites
10 40.0 15.5 1 0.0 0.0 0.0 0.0 0 - - 7 0.0 0.0
Conta
mina
ted
food
or
wate
r
1 0.0 0.0 0 - - - - 0 - - 1 0.0 0.0
Hum
an-
huma
n
(Othe
rs)
1,471 68.9 1.2 859 56.2 1.7 31.0 1.7 401 66.3 2.4 1,235 21.5 1.2
Hum
an-
huma
n
(Airb
orne)
4 75.0 21.7 3 66.7 27.2 66.7 27.2 2 100.0 0.0 4 50.0 25.0

Harvard Data Science Review Estimating Probabilities of Success of Vaccine and Other Anti-Infective Therapeutic Development Programs
32
Note. A = regulatory approval; P1 = phase 1; P2 = phase 2; P3 = phase 3.
When we classify the vaccines by the biological family of the infectious agent (Table 7), we see that
reoviridae (e.g., rotavirus), rhabdoviridae (e.g., rabies), and hepadnaviridae (e.g., HBV) are the three
biological families with the highest overall PoSs for vaccines at 78.7%, (SE = 5.2%), 66.7% (SE = 7.5%),
and 53.7% (SE = 3.6%), respectively. We have yet to see a vaccine for diseases caused by agents in the
biological families of retroviridae (e.g., HIV), caliciviridae (e.g., norovirus), clostridiaceae (e.g.,
clostridium difficile), coronaviridae (e.g., SARS, MERS), herpesviridae (e.g., CMV infection), or
togaviridae (e.g., chikungunya).
Table 7. The Probabilities of Success (PoSs) of Industry-Sponsored Vaccine Development
Programs, Grouped by Biological Family.7
Multi
ple or
other
s
2,365 62.7 1.0 1,339 69.5 1.3 18.1 1.2 595 40.7 2.0 1,886 12.8 0.8
Total 3,851 65.0 0.8 2,202 64.3 1.0 23.2 1.0 998 51.1 1.6 3,133 16.3 0.7
Disea
se
P1
Path
s
PoS12 SE P2
Path
s
PoS23 SE PoS2
A
SE P3
Paths
PoS3
A
SE Paths PoS1A SE
Calici
virid
ae
6 100.0 0.0 5 0.0 0.0 0.0 0.0 0 - - 5 0.0 0.0
Clostr
idiac
eae
6 100.0 0.0 6 33.3 19.2 0.0 0.0 0 - - 4 0.0 0.0
Coro
navir
idae
5 40.0 21.9 0 - - - - 0 - - 3 0.0 0.0
Filovi
ridae
16 43.8 12.4 7 57.1 18.7 28.6 20.2 2 100.0 0.0 14 14.3 9.4

Harvard Data Science Review Estimating Probabilities of Success of Vaccine and Other Anti-Infective Therapeutic Development Programs
33
Note. A = regulatory approval; P1 = phase 1; P2 = phase 2; P3 = phase 3.
When we consider nonvaccine PoSs by biological family of the infectious agent (see Table 8), we see
that nonvaccine therapies for poxviridae (e.g., smallpox), herpesviridae (e.g., CMV infection), and
hepadnaviridae (e.g., HBV) have the highest overall PoSs at 66.7% (SE = 27.2%), 31.8% (SE = 7.0%), and
Flavi
virid
ae
218 86.2 2.3 146 55.5 4.1 43.2 4.3 70 90.0 3.6 165 38.2 3.8
Hepa
dnavi
ridae
213 94.8 1.5 187 74.9 3.2 54.5 3.7 132 77.3 3.6 190 53.7 3.6
Herp
esviri
dae
14 57.1 13.2 3 33.3 27.2 0.0 0.0 0 - - 8 0.0 0.0
Multi
ple or
other
s
1,042 81.8 1.2 771 65.9 1.7 47.9 1.9 454 81.3 1.8 907 40.7 1.6
Poxvi
ridae
12 83.3 10.8 9 66.7 15.7 55.6 16.6 6 83.3 15.2 11 45.5 15.0
Reovi
ridae
72 97.2 1.9 70 91.4 3.3 68.6 6.0 53 90.6 4.0 61 78.7 5.2
Retro
virid
ae
181 65.2 3.5 95 36.8 4.9 0.0 0.0 21 0.0 0.0 144 0.0 0.0
Rhab
dovir
idae
47 91.5 4.1 40 87.5 5.2 65.0 8.1 30 86.7 6.2 39 66.7 7.5
Togav
irida
e
6 83.3 15.2 0 - - - - 0 - - 1 0.0 0.0
Total 1,838 82.5 0.9 1,339 65.4 1.3 45.9 1.4 768 80.1 1.4 1,552 39.6 1.2

Harvard Data Science Review Estimating Probabilities of Success of Vaccine and Other Anti-Infective Therapeutic Development Programs
34
29.5% (SE = 4.0%), respectively. For viruses in the reoviridae (e.g., rotavirus), coronaviridae (e.g., SARS,
MERS), caliciviridae (e.g., norovirus), rhabdoviridae (e.g., rabies), and togaviridae (e.g., chikungunya)
families, there have been less than five development programs each, and no approved treatment.
Table 8. The Probabilities of Success (PoSs) of Industry-Sponsored, Nonvaccine Anti-Infective
Drug Development Programs, Grouped by Biological Family.8
Disea
se
P1
Path
s
PoS12 SE P2
Path
s
PoS23 SE PoS2
A
SE P3
Paths
PoS3
A
SE Paths PoS1A SE
Calici
virid
ae
1 0.0 0.0 0 - - - - 0 - - 1 0.0 0.0
Clostr
idiac
eae
91 83.5 3.9 66 53.0 6.1 4.5 2.8 25 12.0 6.5 71 4.2 2.4
Coro
navir
idae
2 50.0 35.4 1 0.0 0.0 0.0 0.0 0 - - 2 0.0 0.0
Filovi
ridae
10 20.0 12.6 1 0.0 0.0 0.0 0.0 0 - - 9 0.0 0.0
Flavi
virid
ae
609 70.3 1.9 383 49.6 2.6 22.5 2.2 161 53.4 3.9 535 16.1 1.6
Hepa
dnavi
ridae
186 77.4 3.1 105 68.6 4.5 36.2 5.2 54 70.4 6.2 129 29.5 4.0
Herp
esviri
dae
64 87.5 4.1 43 60.5 7.5 32.6 7.8 19 73.7 10.1 44 31.8 7.0
Poxvi
ridae
3 66.7 27.2 2 100.0 0.0 100.0 0.0 2 100.0 0.0 1,815 66.7 27.2

Harvard Data Science Review Estimating Probabilities of Success of Vaccine and Other Anti-Infective Therapeutic Development Programs
35
Note. A = regulatory approval; P1 = phase 1; P2 = phase 2; P3 = phase 3.
6. DiscussionCompanies producing vaccines and other therapeutics for infectious diseases have gradually been
retreating from these spaces in recent years. The number of companies producing vaccines has
dwindled over the past few decades, and the top four vaccine companies now make up more than 90%
of the global market (Evaluate, 2018). Similarly, the top four companies producing antiviral drugs
occupy about 80% of the global market (Evaluate, 2018). Antibiotic developers such Achaogen and
Melinta Therapeutics have filed for bankruptcy in the past year, while large pharmaceutical
companies such as Novartis and Sanofi have withdrawn from the space (Jacobs, 2019), leading the
Infectious Diseases Society of America to sound the alarm about the availability of effective antibiotics
(Infectious Diseases Society of America, 2019).
It should be no surprise that investors are unwilling to invest in companies producing vaccines and
treatments for infectious diseases given the economics of this market (Vu et al., 2020). These have
been generally regarded as low-margin products, and they have low expected growth potential
compared to chronic treatments in other therapeutic areas, such as oncology or cardiovascular
Reovi
ridae
2 100.0 0.0 2 0.0 0.0 0.0 0.0 0 - - 3 0.0 0.0
Retro
virid
ae
604 63.2 2.0 326 59.8 2.7 39.3 2.8 167 76.6 3.3 2 24.6 1.9
Rhab
dovir
idae
4 75.0 21.7 0 - - - - 0 - - 520 0.0 0.0
Togav
irida
e
1 0.0 0.0 0 - - - - 0 - - 1 0.0 0.0
Multi
ple or
other
s
2,274 61.9 1.0 1,273 70.3 1.3 18.8 1.3 570 41.9 2.1 1 13.2 0.8
Total 3,851 65.0 0.8 2,202 64.3 1.0 23.2 1.0 998 51.1 1.6 3,133 16.3 0.7
Harvard Data Science Review Estimating Probabilities of Success of Vaccine and Other Anti-Infective Therapeutic Development Programs
36
diseases. For example, Merck’s oncology assets are estimated to have contributed $11.8 billion in
incremental revenues from 2017 to 2020; for the same period, the incremental contribution of its
vaccines portfolio is estimated to be $2.7 billion (Trefis, 2020). And Merck is the second largest vaccine
maker in the world. This lack of investment has resulted in a relatively low number of development
programs for vaccines and treatments for infectious diseases; only 10.4% of all industry-sponsored
drug development programs launched in the past two decades are in these areas (see Table A2 in the
Appendix).
Our study indicates that the technical success rate is unlikely to be a barrier to investments in new
vaccines and treatments for infectious diseases, unlike cancer drugs, where the financial risk of new
R&D projects comes from the reduced chance of bringing a drug-indication pair from phase 1 to
market. The overall PoS of industry-sponsored vaccines and treatments for infectious diseases are
above the average for all therapeutic groups (see Table A2 in the Appendix).
It is often suggested that the fundamental issue behind this lack of investment is that the market for
vaccines and treatments for infectious diseases is simply not lucrative enough. Despite the expense of
R&D and the need for large-scale production (Weir & Gruber, 2016), anti-infective disease treatments
are used only occasionally, while vaccine companies face an avalanche of liability lawsuits (Hensley &
Wysocki, 2005). Furthermore, the companies are at the mercy of government pricing decisions (Hu,
2018).
Apart from financial considerations, the dearth of vaccines and other treatments for infectious
diseases may be due to the lack of available subjects for testing these therapeutics, especially during
non-epidemic periods. This may be alleviated by having faster preclinical and clinical pathways in
cases of severe infectious diseases with no existing treatments. One such pathway is the Animal Rule
(FDA Approval of New Drugs When Human Efficacy Studies Are Not Ethical or Feasible, 2019; FDA
Approval of Biological Products When Human Efficacy Studies Are Not Ethical or Feasible, 2019)
whereby the "FDA may grant marketing approval based on adequate and well-controlled animal
efficacy studies when the results of those studies establish that the drug is reasonably likely to
produce clinical benefit in humans” (FDA, 2015). This has been used to approve smallpox and
monkeypox vaccines, and can be expanded for the investigation of therapeutics for other potentially
deadly infectious diseases with low incidence rates, such as SARS.
Even though this pathway can expedite the development of vaccines and anti-infective treatments, it
still requires considerable development time as one needs to establish the equivalence of the drug
mechanism between animal models and humans. While it is desirable to hasten the development of
vaccines and medical products during an epidemic, biological breakthroughs and science will
ultimately drive the efficiency of our ability to fight pandemics of novel pathogens.

Harvard Data Science Review Estimating Probabilities of Success of Vaccine and Other Anti-Infective Therapeutic Development Programs
37
It remains to be seen if more non-industry-sponsored research can alleviate the issue. Our study
shows that only 6.8% (SE = 1.0%) and 8.2% (SE = 0.6%) of non-industry-sponsored vaccines and
nonvaccine infectious disease development programs transition from phase 1 to approval, respectively.
However, this may be a result of selection bias: promising vaccine and therapeutics initiated in
nonindustry settings are often pursued in conjunction with industry sponsors, whereas commercially
less-promising projects are more likely to be pursued by nonprofit organizations.
7. ConclusionThe world today has never been in greater need of effective vaccines and other anti-infectives. As the
COVID-19 crisis has shown, infectious diseases still have the potential to cause a catastrophically large
number of deaths and disrupt the daily lives of billions. We hope that our research into the probability
of successfully developing infectious disease therapeutics will inform all stakeholders and catalyze
innovation and greater investment in this critical and underserved field.
Disclosure StatementThe views and opinions expressed in this article are those of the authors only, and do not represent the
views, policies, and opinions any institution or agency, any of their affiliates or employees, or any of
the individuals acknowledged below.. W. Siah and C. H. Wong report no conflicts. A. Lo has personal
investments in biotechnology companies, biotech venture capital funds, and mutual funds, and is a co-
founder and partner of QLS Advisors, a healthcare analytics and consulting company. He is also an
advisor to BrightEdge and Thales; an advisor to and investor in BridgeBio Pharma; a director of Roivant
Sciences Ltd. and Annual Reviews; chairman emeritus and senior advisor to AlphaSimplex Group; and
a member of the Board of Overseers at Beth Israel Deaconess Medical Center. Finally, Lo is a member
of the NIH’s National Center for Advancing Translational Sciences Advisory Council and Cures
Acceleration Network Review Board. During the most recent six-year period, Lo has received
speaking/consulting fees, honoraria, or other forms of compensation from: AIG, AlphaSimplex Group,
BIS, BridgeBio Capital, Citigroup, Chicago Mercantile Exchange, Financial Times, Harvard University,
IMF, National Bank of Belgium, Q Group, Roivant Sciences, Scotia Bank, State Street Bank, University
of Chicago, and Yale University.

Harvard Data Science Review Estimating Probabilities of Success of Vaccine and Other Anti-Infective Therapeutic Development Programs
38
AcknowledgmentsWe thank Informa for providing us access to their data and expertise and are particularly grateful to
Will Akie, Christine Blazynski, Gabrielle Gessner, Mark Gordon, Michael Hay, Ian Lloyd, and Ryan
Sasaki. We also thank Christine Blazynski, John Tedrow, the editor, associate editor, and reviewers for
helpful comments on this manuscript. Research support from the MIT Laboratory for Financial
Engineering and funding support from The Rockefeller Foundation are gratefully acknowledged. The
views and opinions expressed in this article are those of the authors only, and do not necessarily
represent the views and opinions of any institution or agency, any of their affiliates or employees, or
any of the individuals acknowledged above.
ReferencesAbrantes-Metz, R. M., Adams, C. P., & Metz, A. (2004). Pharmaceutical development phases: A duration
analysis (Bureau of Economics No. 274). Federal Trade Commission.
https://www.ftc.gov/reports/pharmaceutical-development-phases-duration-analysis
André, F. E. (2002). How the research-based industry approaches vaccine development and establishes
priorities. Developments in Biologicals, 110, 25–29.
Davis, M. M., Butchart, A. T., Wheeler, J. R. C., Coleman, M. S., Singer, D. C., & Freed, G. L. (2011).
Failure-to-success ratios, transition probabilities and phase lengths for prophylactic vaccines versus
other pharmaceuticals in the development pipeline. Vaccine, 29(51), 9414–9416.
https://doi.org/10.1016/j.vaccine.2011.09.128
DiMasi, J. A., Feldman, L., Seckler, A., & Wilson, A. (2010). Trends in risks associated with new drug
development: Success rates for investigational drugs. Clinical Pharmacology & Therapeutics, 87(3), 272–
277. https://doi.org/10.1038/clpt.2009.295
DiMasi, J. A., Florez, M. I., Stergiopoulos, S., Pena, Y., Smith, Z., Wilkinson, M., & Getz, K. A. (2020).
Development times and approval success rates for drugs to treat infectious diseases. Clinical
Pharmacology & Therapeutics, 107(2), 324–332. https://doi.org/10.1002/cpt.1627
Ehreth, J. (2003). The global value of vaccination. Vaccine, 21(7–8), 596–600.
Evaluate. (2018, June 6). EvaluatePharma World Preview 2018, Outlook to 2024.
https://www.evaluate.com/PharmaWorldPreview2018

Harvard Data Science Review Estimating Probabilities of Success of Vaccine and Other Anti-Infective Therapeutic Development Programs
39
Food and Drug Administration Amendments Act of 2007, H.R. 3580, 110th Cong. (2007).
Food and Drug Administration Approval of Biological Products When Human Efficacy Studies Are Not
Ethical or Feasible, 21 C.F.R. §§ 90–95 (2019).
Food and Drug Administration Approval of New Drugs When Human Efficacy Studies Are Not Ethical
or Feasible, 21 C.F.R. §§ 600–650 (2019).
https://www.accessdata.fda.gov/scripts/cdrh/cfdocs/cfcfr/CFRSearch.cfm?
CFRPart=314&showFR=1&subpartNode=21:5.0.1.1.4.9
Food and Drug Administration [FDA]. (2015, October). Guidance for industry product development animal
rule. https://www.fda.gov/files/drugs/published/Product-Development-Under-the-Animal-Rule.pdf
Hay, M., Thomas, D. W., Craighead, J. L., Economides, C., & Rosenthal, J. (2014). Clinical development
success rates for investigational drugs. Nature Biotechnology, 32(1), 40–51.
https://doi.org/10.1038/nbt.2786
Hensley, S., & Wysocki Jr., B. (2005, November 8). As industry profits elsewhere, U.S. lacks vaccines,
antibiotics. The Wall Street Journal. https://www.wsj.com/articles/SB113141787830190837
Hu, C. (2018, July 21). Major pharmaceutical companies like Novartis dropping antibiotics projects and
future tools against superbugs. Business Insider. https://www.businessinsider.com/major-
pharmaceutical-companies-dropping-antibiotic-projects-superbugs-2018-7
Infectious Diseases Society of America. (2019, December 27). CORRECTION: Antibiotic company starts
bankruptcy proceedings; Highlights urgent need for investment in infection fighting drugs.
https://www.idsociety.org/news--publications-new/articles/2019/CORRECTION-Antibiotic-Company-
Starts-Bankruptcy-Proceedings-Highlights-Urgent-Need-for-Investment-in-Infection-Fighting-Drugs/
Jacobs, A. (2019, December 25). Crisis looms in antibiotics as drug makers go bankrupt. The New York
Times. https://www.nytimes.com/2019/12/25/health/antibiotics-new-resistance.html
Kieny, M. P., & Girard, M. P. (2005). Human vaccine research and development: An overview. Vaccine,
23(50), 5705–5707. https://doi.org/10.1016/j.vaccine.2005.07.077
Langreth, R. (2019, May 3). Antibiotics aren’t profitable enough for big pharma to make more.
Bloomberg Businessweek. https://www.bloomberg.com/news/articles/2019-05-03/antibiotics-aren-t-
profitable-enough-for-big-pharma-to-make-more
MIT Laboratory for Financial Engineering. (2020). Estimates of clinical trial probabilities of success (PoS)
- 2019Q4. Retrieved March 29, 2020, from https://projectalpha.mit.edu/pos/

Harvard Data Science Review Estimating Probabilities of Success of Vaccine and Other Anti-Infective Therapeutic Development Programs
40
Organisation for Economic Co-operation and Development. (2013). Health at a glance 2013: OECD
indicators. https://doi.org/10.1787/health_glance-2013-en
Pronker, E. S., Weenen, T. C., Commandeur, H., Claassen, E. H. J. H. M., & Osterhaus, A. D. M. E. (2013).
Risk in vaccine research and development quantified. PLoS ONE, 8(3), e57755.
https://doi.org/10.1371/journal.pone.0057755
Rémy, V., Zöllner, Y., & Heckmann, U. (2015). Vaccination: The cornerstone of an efficient healthcare
system. Journal of Market Access & Health Policy, 3(1), 27041. https://doi.org/10.3402/jmahp.v3.27041
Root, C. (2014, December 8). Biogen Idec moves aggressively, advances Alzheimer drug into phase 3.
Clinical Leader. https://www.clinicalleader.com/doc/biogen-idec-moves-aggressively-advances-
alzheimer-drug-into-phase-0001
Smietana, K., Siatkowski, M., & Møller, M. (2016). Trends in clinical success rates. Nature Reviews Drug
Discovery, 15(6), 379–380. https://doi.org/10.1038/nrd.2016.85
Thomas, D. W., Burns, J., Audette, J., Carroll, A., Dow-Hygelund, C., & Hay, M. (2016). Clinical
development success rates 2006–2015. Biotechnology Innovation Organization (BIO).
https://www.bio.org/sites/default/files/legacy/bioorg/docs/Clinical%20Development%20Success%20R
ates%202006-2015%20-%20BIO,%20Biomedtracker,%20Amplion%202016.pdf
Trefis. (2020). MRK revenues: How does Merck make money? Trefis. https://dashboards.trefis.com/no-
login-required/qVh09Fjc/MRK-Revenues-How-Does-Merck-Make-Money-
U.S. Department of Health and Human Services. (2017). Encouraging vaccine innovation: Promoting the
development of vaccines that minimize the burden of infectious diseases in the 21st century.
https://www.gpo.gov/fdsys/pkg/PLAW-114publ255/pdf/PLAW-114publ255.pdf
Vu, J., Kaplan, B., Chaudhuri, S., Mansoura, M., & Lo, A. W. (2020). Financing vaccines for global health
security. medRxiv. Cold Spring Harbor Laboratory Press. https://doi.org/10.1101/2020.03.20.20039966
Weir, J. P., & Gruber, M. F. (2016). An overview of the regulation of influenza vaccines in the United
States. Influenza and Other Respiratory Viruses, 10(5), 354–360. https://doi.org/10.1111/irv.12383
Wong, C. H., Siah, K. W., & Lo, A. W. (2019a). Estimating clinical trial success rates and related
parameters in oncology. SSRN Electronic Journal. https://ssrn.com/abstract=3355022
Wong, C. H., Siah, K. W., & Lo, A. W. (2019b). Estimation of clinical trial success rates and related
parameters. Biostatistics, 20(2), 273–286.
Harvard Data Science Review Estimating Probabilities of Success of Vaccine and Other Anti-Infective Therapeutic Development Programs
41
World Health Organization. (1980). The global eradication of smallpox: final report of the Global
Commission for the Certification of Smallpox Eradication, Geneva, December 1979.
https://apps.who.int/iris/handle/10665/39253
World Health Organization. (2020). Vaccines and diseases.
https://www.who.int/immunization/diseases/en/
Young, R., Bekele, T., Gunn, A., Chapman, N., Chowdhary, V., Corrigan, K., Dahora, L., Martinez, S.,
Permar, S., Persson, J., Rodriguez, B., Schäferhoff, M., Schulman, K., Singh, T., Terry, R. F., & Yamey, G.
(2020). Developing new health technologies for neglected diseases: A pipeline portfolio review and cost
model. Gates Open Research, 2, 23. https://doi.org/10.12688/gatesopenres.12817.3
Appendix
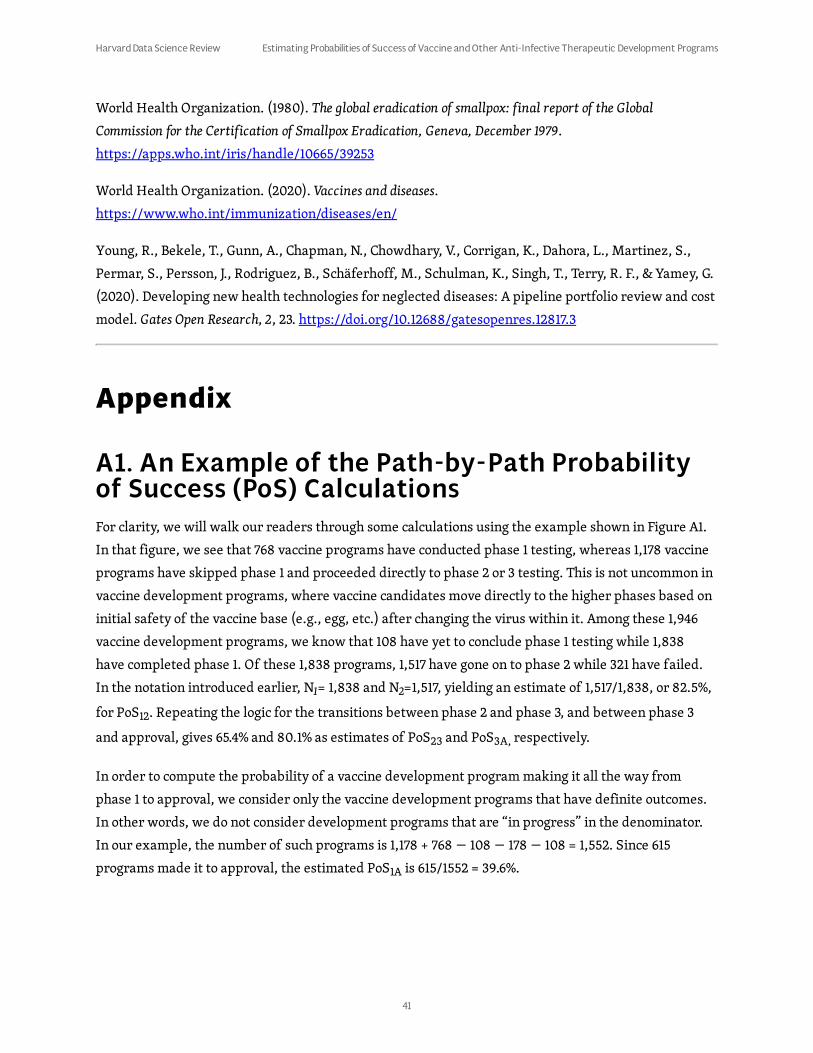
A1. An Example of the Path-by-Path Probability of Success (PoS) CalculationsFor clarity, we will walk our readers through some calculations using the example shown in Figure A1.
In that figure, we see that 768 vaccine programs have conducted phase 1 testing, whereas 1,178 vaccine
programs have skipped phase 1 and proceeded directly to phase 2 or 3 testing. This is not uncommon in
vaccine development programs, where vaccine candidates move directly to the higher phases based on
initial safety of the vaccine base (e.g., egg, etc.) after changing the virus within it. Among these 1,946
vaccine development programs, we know that 108 have yet to conclude phase 1 testing while 1,838
have completed phase 1. Of these 1,838 programs, 1,517 have gone on to phase 2 while 321 have failed.
In the notation introduced earlier, N1= 1,838 and N2=1,517, yielding an estimate of 1,517/1,838, or 82.5%,
for PoS12. Repeating the logic for the transitions between phase 2 and phase 3, and between phase 3
and approval, gives 65.4% and 80.1% as estimates of PoS23 and PoS3A, respectively.
In order to compute the probability of a vaccine development program making it all the way from
phase 1 to approval, we consider only the vaccine development programs that have definite outcomes.
In other words, we do not consider development programs that are “in progress” in the denominator.
In our example, the number of such programs is 1,178 + 768 − 108 − 178 − 108 = 1,552. Since 615
programs made it to approval, the estimated PoS1A is 615/1552 = 39.6%.

Harvard Data Science Review Estimating Probabilities of Success of Vaccine and Other Anti-Infective Therapeutic Development Programs
42
A2. Differences Between the Path-By-Path Approach and the Phase-By-Phase ApproachThe path-by-phase approach described in the main text carefully considers the drug development
programs that are under active development and excludes them from the PoS calculations when
necessary. As such, the overall probability of success, PoS1A, is not the multiplication of PoS12, PoS23,
and PoS3A, that is,
In contrast, the phase-by-phase computation simply computes PoSij using the equation:
In particular, the PoS1A is computed using the following formula:
The phase-by-phase approach is valid under some circumstances, such as when there are no active
development programs in any of the phases. This is easily seen if one simply sets the number of “in
progress” development programs in all phases in Figure A1 to zero and recomputes the PoSs.
The path-by-path approach can also obtain the same results as the phase-by-phase approach if one is
willing to make an additional assumption: programs that are “in progress” in phase i will transition to
phase i + 1 or to “terminated” with the same probability as going from phase i to phase i + 1, or from
phase i to “terminated,” without “in progress” programs.
Figure A1. An example of the number of transitions computed, based on the data
for industry-sponsored vaccine drug development programs.
PoS (path-by-path) = PoS ×1A 12 PoS ×23 PoS .3A
PoS =ij PoS .∏x=i,…,j−1 x,x+1
PoS (phase-by-phase) =1A PoS ×12 PoS ×23 PoS .3A

Harvard Data Science Review Estimating Probabilities of Success of Vaccine and Other Anti-Infective Therapeutic Development Programs
43
We illustrate this with Figure A2, which shows the different states of a drug development program
with hypothetical transitions from “in progress” states to the next phase or to the “terminated” state.
Without considering “in progress” programs, the probability of transitioning from phase 1 to phase 2 is
78.0/(78.0+16.5) = 82.5% and the probability of transitioning from phase 1 into the “terminated” state
is 17.5%. Similarly, without considering “in progress” programs between phase 2 and phase 3 or phase 3
and approval, the probabilities of transitioning from phase 2 to phase 3 or phase 3 to approval are
65.4% and 80.0%, respectively. If we set a, b, and c to be 82.5%, 65.4%, and 80.0%, respectively, we will
obtain a PoS1A of 43.2%, which is exactly In contrast, the path-by-path
approach obtains a PoS1A of 39.6% as it does not make any assumptions and ignores programs that are
“in progress” in phase 1, phase 2, or phase 3.
We believe that our method of inferring unobserved clinical development stages and then applying the
path-by-path approach is a better measure of the PoSs of clinical development programs as it does not
underestimate the PoSs, and makes no assumption about the programs that are in active development.
Table A1. List of Transmission Routes and Biological Family for Infectious Diseases
PoS ×12 PoS ×23 PoS .3A
Figure A2. A Markov chain that includes hypothetical transitions from “in
progress” states to the next phase or to the “terminated” state.
Disease Transmission Route Biological Family
Hepatitis B Virus (HBV) Human-human (Others) Hepadnaviridae
Other Multiple or others Multiple or others
Otitis Media Multiple or others Multiple or others
Bacterial Skin Infection Multiple or others Multiple or others
Sepsis Multiple or others Multiple or others

Harvard Data Science Review Estimating Probabilities of Success of Vaccine and Other Anti-Infective Therapeutic Development Programs
44
Human Papillomavirus (HPV) Human-human (Others) Flaviviridae
Human Immunodeficiency Virus
(HIV)
Human-human (Others) Retroviridae
Intra-abdominal Infections Multiple or others Multiple or others
Onychomycosis Multiple or others Multiple or others
Clostridium difficile Multiple or others Clostridiaceae
Cytomegalovirus (CMV) Infection Human-human (Others) Herpesviridae
Hepatitis C Virus (HCV) Human-human (Others) Flaviviridae
Respiratory Infections Multiple or others Multiple or others
Urinary Tract Infections Multiple or others Multiple or others
Rotavirus Human-human (Others) Reoviridae
Ebola Human-human (Others) Filoviridae
Marburg Human-human (Others) Filoviridae
Smallpox Human-human (Airborne) Poxviridae
Zika Animal bites Flaviviridae
Rabies Animal bites Rhabdoviridae
Yellow Fever Animal bites Flaviviridae
Chikungunya Animal bites Togaviridae
Norovirus Contaminated food or water Caliciviridae
Japanese Encephalitis Animal bites Flaviviridae
Non-tuberculous Mycobacteria
(NTM) Infection
Multiple or others Multiple or others
West Nile Virus (WNV) Animal bites Flaviviridae

Harvard Data Science Review Estimating Probabilities of Success of Vaccine and Other Anti-Infective Therapeutic Development Programs
45
Table A2. The Probabilities of Success (PoSs) of Industry-Sponsored Drug Development
Programs Across All Therapeutic Groups
Middle East Respiratory Syndrome
(MERS)
Human-human (Airborne) Coronaviridae
Severe Acute Respiratory Syndrome
(SARS)
Human-human (Airborne) Coronaviridae
Monkeypox Animal bites Poxviridae
Disea
se
P1
Paths
PoS12 SE P2
Paths
PoS23 SE PoS2A SE P3
Paths
PoS3A SE PoS1A SE
Oncol
ogy
27,600 65.5 0.3 10,65
0
37.7 0.5 6.9 0.3 2,597 28.2 0.9 3.9 0.1
Meta
bolic /
Endoc
rinolo
gy
4,360 74.2 0.7 2,767 60.0 0.9 21.3 0.8 1,293 45.6 1.4 16.7 0.6
Cardi
ovasc
ular
3,387 74.3 0.8 2,265 70.2 1.0 25.9 1.0 1,203 48.8 1.4 21.4 0.8
CNS 6,207 71.7 0.6 3,806 56.9 0.8 14.6 0.6 1,525 36.5 1.2 11.3 0.5
Autoi
mmu
ne /
Infla
mmat
ion
6,272 71.7 0.6 3,704 52.7 0.8 17.3 0.7 1,332 48.0 1.4 13.1 0.5
Genit
ourin
ary
1,103 71.4 1.4 737 61.6 1.8 25.0 1.7 352 52.3 2.7 19.3 1.3

Harvard Data Science Review Estimating Probabilities of Success of Vaccine and Other Anti-Infective Therapeutic Development Programs
46
Note. The classification of vaccines used in this table is based on broader categories such as “other viral vaccines” instead of
the finer ones such as “Ebola” used in this article, resulting in a slight difference in the computed PoSs. A= regulatory
approval; P1 = phase 1; P2 = phase 2; P3 = phase 3.
This article is © 2020 by Andrew W. Lo, Kien Wei Siah, and Chi Heem Wong. The article is licensed under a
Creative Commons Attribution (CC BY 4.0) International license
(https://creativecommons.org/licenses/by/4.0/legalcode), except where otherwise indicated with respect to
particular material included in the article. The article should be attributed to the author identified above.
Footnotes
Infect
ious
Disea
se
(ex.
vaccin
es)
3,851 65.0 0.8 2,202 64.2 1.0 23.1 1.0 996 51.0 1.6 16.2 0.7
Ophth
almol
ogy
697 89.1 1.2 510 55.7 2.2 17.1 1.8 191 45.5 3.6 17.6 1.7
Vacci
nes
(Infec
tious
Disea
se)
1,886 83.9 0.8 1,409 66.4 1.3 45.8 1.4 813 79.5 1.4 40.6 1.2
Total 55,363 69.1 0.2 28,05
0
51.6 0.3 16.1 0.2 10,302 44.0 0.5 11.0 0.2
All
excep
t
Oncol
ogy
27,763 72.7 0.3 17,400 60.1 0.4 21.8 0.3 7,705 49.3 0.6 17.1 0.3
�. Table scrolls horizontally for additional columns ↩

Harvard Data Science Review Estimating Probabilities of Success of Vaccine and Other Anti-Infective Therapeutic Development Programs
47
�. Table scrolls horizontally for additional columns ↩
�. Table scrolls horizontally for additional columns ↩
�. Table scrolls horizontally for additional columns ↩
�. Table scrolls horizontally for additional columns ↩
�. Table scrolls horizontally for additional columns ↩
�. Footnote scrolls horizontally for additional columns ↩
�. Table scrolls horizontally for additional columns ↩