Embed Size (px)
Citation preview

Estimating Market Penetration of Multi-Industrial Companies on a Global Market
- A Tool Development through a Case Study of Alfa Laval AB
Karin Romaeus Bertelman Mira Singer
Estimating Market Penetration of Multi-Industrial Companies on a Global Market
2
Copyright © Romaeus Bertelman, Karin; Singer, Mira Department of Business Administration School of Economics and Management, Lund University Box 7080, S-221 00 Lund Department of Automatic Control, Faculty of Engineering, Lund University Box 118, S221 00 Lund Master’s Thesis in Technology Management - Nr 198/2010 ISSN 1651-0100 ISRN LUTVDG/TVTM--2010/5198--/SE Printed in Sweden Tryckeriet, E-huset Lund 2010

Estimating Market Penetration of Multi-Industrial Companies on a Global Market
3
Abstract Title: Estimating Market Penetration of Multi-Industrial Companies
on a Global Market - A Tool Development through a Case Study of Alfa Laval AB.
Authors: Karin Romaeus Bertelman Mira Singer Supervisors: Charlotta Johnsson, Associate Professor, Department of
Automatic Control, Faculty of Engineering, Lund University
Carl-Henric Nilsson, Associate Professor, Department of Business Administration, School of Economics and Management, Lund University
Alex Syed, Vice President Corporate Development
Alfa Laval Group
Issue of study: The area of study is whether a company is maintaining its position and securing market share of new demand on growing markets and whether the penetration can be assessed over a range of markets, answering the question: How well is a certain company penetrating a set of markets across a wide range of industries in several countries?
Purpose: This thesis will examine the possibility of assessing market
penetration for global multi-industrial companies with the use of macro-economic data as an approximation of market size.
Method: A Case Study has been done on the company Alfa Laval and
the methodological steps can be explained in six steps: Research, Selecting Industry Proxies, Tool Design, Tool Application, Tool Result & Evaluation, and General Tool Evaluation. The study has an inductive approach in the way that it does not refer to an existing and recognized theory of how market penetration is measured. Instead, the method of calculating and estimating market penetration is developed in this study.
The study involves both quantitative and qualitative research analysis. Quantitative macro data and internal sales data are

Estimating Market Penetration of Multi-Industrial Companies on a Global Market
4
used when calculating the market penetration while qualitative research data of both secondary and primary kind are used for all other parts of the Case Study. Primary data in the form of semi-structured interviews, email correspondence, survey questions and a seminar presentation have been collected. Secondary data have been gathered from several intelligence companies and organizations, internal data from Alfa Laval and several magazines.
Conclusions: The general conclusion of this study is that it is possible for a
company that acts on a set of markets across a wide range of industries and countries to get an indication of its market penetration using the PMPT. However, it is only an indication and generalization of reality and in expense of obtaining this very general picture of how well a company is penetrated on extremely different markets, it has shortcomings. Regardless of the future potential development possibilities of the tool, the indications of market penetration is of use to a company manger as a complement to other information available for strategic decisions concerning the growth potential of the company.
Key words: Market Penetration, The Proxy-based Market Penetration
Tool, Multi-industrial Company, macro-economic data, proxies, industry drivers.
Estimating Market Penetration of Multi-Industrial Companies on a Global Market
5
Preface This Master’s Thesis has been written as a final step of our diploma in Technology Management at Lund University and has been a great and inspiring journey for us. We are very grateful to everyone who has helped us accomplish our results. We would like to express a special thank you to our supervisors at Alfa Laval: Alex Syed, Lars Henriksson and Ray Fields, who have dedicated their time and been a support to our work from beginning to end. Also, thank you to all employees at Alfa Laval who have met with us in Tumba, Lund, Shanghai and Moscow, and to those whom we have had email and telephone correspondence with from other parts of the world. Our supervisors at Lund University, Charlotta Johnsson from the Department of Automatic Control at Lund Technical Institute and Carl-Henric Nilsson from the Department of Business Administration at the School of Economics and Management have been a great support. Through the process of our study they have helped us with their input and ideas. Last but not least, we want to thank Märtha Sjögren and Paulina Nilsby for contributing with constructive feedback which has enabled us to improve and finalize our report. Lund, May 2010 Karin Romaeus Bertelman & Mira Singer

Estimating Market Penetration of Multi-Industrial Companies on a Global Market
6
Table of Contents
1 INTRODUCTION............................................................................................................ 9
1.1 BACKGROUND ............................................................................................................... 9 1.2 ISSUE OF STUDY ........................................................................................................... 10 1.3 PURPOSE OF THIS THESIS ............................................................................................... 10 1.4 PROJECT SCOPE AND DELIMITATIONS ............................................................................... 10 1.5 DEFINITIONS ............................................................................................................... 12 1.6 TARGET AUDIENCE........................................................................................................ 13 1.7 THESIS DISPOSITION ..................................................................................................... 14
2 METHODOLOGY ......................................................................................................... 15
2.1 METHOD WORKING STEPS ............................................................................................ 15 2.2 MODELLING & CASE STUDY RESEARCH ............................................................................ 17 2.3 INDUCTIVE APPROACH ................................................................................................... 18 2.4 QUALITATIVE AND QUANTITATIVE STUDY .......................................................................... 19 2.5 SECONDARY DATA ........................................................................................................ 20 2.6 VALIDITY .................................................................................................................... 21 2.7 RELIABILITY ................................................................................................................. 21
3 THEORETICAL FOUNDATION ...................................................................................... 23
3.1 THE MULTINATIONAL MATRIX CORPORATION ................................................................... 23 3.2 STRATEGY AND MARKET PENETRATION ............................................................................ 24 3.3 MARKET PROXIES......................................................................................................... 28 3.4 STATISTICAL ANALYSIS ................................................................................................... 28 3.5 MACRO-ECONOMIC ANALYSIS ......................................................................................... 29
4 CASE STUDY ............................................................................................................... 31
4.1 ALFA LAVAL ................................................................................................................ 31 4.2 THE BRICKS ............................................................................................................... 34 4.3 ALFA LAVAL IN THE BRICK COUNTRIES ............................................................................. 41
5 DRIVER ANALYSIS....................................................................................................... 43
5.1 SEGMENT SALES ANALYSIS .............................................................................................. 44 5.2 INTERVIEWS ................................................................................................................ 45 5.3 DATA AVAILABILITY ....................................................................................................... 46
6 TOOL DESIGN AND APPLICATION ............................................................................... 48
6.1 PENETRATION ............................................................................................................. 48 6.2 YEAR TO YEAR CORRELATION.......................................................................................... 50 6.3 BENCHMARKING .......................................................................................................... 51 6.4 PRESENTATIONAL STRUCTURE ......................................................................................... 51
7 RESULTS ..................................................................................................................... 55
7.1 PENETRATION ............................................................................................................. 55 7.2 CORRELATION ............................................................................................................. 56 7.3 COUNTRY OVERVIEW .................................................................................................... 57

Estimating Market Penetration of Multi-Industrial Companies on a Global Market
7
7.4 FUTURE OUTLOOK ....................................................................................................... 59
8 CASE DISCUSSION AND CONCLUSIONS ....................................................................... 64
8.1 DISCUSSION OF RESULTS ................................................................................................ 64 8.2 DISCUSSION OF ACCURACY ............................................................................................. 65 8.3 CONCLUSIONS ............................................................................................................. 68
9 GENERAL DISCUSSION AND CONCLUSIONS ................................................................ 69
9.1 DISCUSSION ................................................................................................................ 69 9.2 CONCLUSIONS ............................................................................................................. 71
10 BIBLIOGRAPHY ........................................................................................................... 72
10.1 INTERVIEWS ................................................................................................................ 72 10.2 EMAIL CORRESPONDENCES ............................................................................................ 73 10.3 LITERATURE ................................................................................................................ 73 10.4 ARTICLES .................................................................................................................... 74 10.5 COMPANY REPORTS ..................................................................................................... 76 10.6 WORLD WIDE WEB (WWW) .......................................................................................... 76 10.7 UNPUBLISHED DOCUMENTS ........................................................................................... 77 10.8 OTHER ....................................................................................................................... 77
11 APPENDIX .................................................................................................................. 78
11.1 APPENDIX A1 – DRIVER ANALYSIS THROUGH SALES DATA .................................................... 78 11.2 APPENDIX A2 - DRIVER ANALYSIS THROUGH INTERVIEWS ..................................................... 83 11.3 APPENDIX A3 – DRIVER ANALYSIS THROUGH DATA AVAILABILITY ........................................... 85 11.5 APPENDIX B1 – PENETRATION RESULTS ........................................................................... 87 11.6 APPENDIX B2- FUTURE OUTLOOK FROM INTERVIEWS .......................................................... 89 11.7 APPENDIX C1- DISCUSSION OF RESULTS PER SEGMENT ........................................................ 99 11.9 APPENDIX D1 – RESULTS: PENETRATION ........................................................................ 101 11.10 APPENDIX D2 – RESULTS: YEAR TO YEAR CHANGE ........................................................ 113 11.11 APPENDIX D3– OVERVIEW PER COUNTRY .................................................................. 125

Estimating Market Penetration of Multi-Industrial Companies on a Global Market
8
Abbreviations BRICK: Brazil, Russia, India, China and South Korea OR: Orders Received PMPT: Proxy-based Market Penetration Tool Alfa Laval Segments ECF: Comfort EFU: Fluids & Utility EMD: Marine & Diesel EOE: OEM Original Equipment ERC: Refrigeration & Cooling ESE: Sanitary PEE: Energy & Environment PFT: Food Technology PLS: Life Science PPI: Process Industry

Estimating Market Penetration of Multi-Industrial Companies on a Global Market
9
1 Introduction
In this chapter the background to this Master’s Thesis and the issues and problems it addresses are introduced as well as the purpose of the study. Furthermore, the scope and delimitations are clarified along with initial definitions of the terms used on the report.
1.1 Background
To stay competitive, most companies have to grow, either by establishing their business on new markets of by introducing new products and applications. Measuring market penetration can be a useful way to keep track of how well the company is doing, but as a business becomes bigger and more complex, this can be easier said than done. The actual potential can be hard to estimate, especially on new and growing markets and for a company that covers a broad spectrum of industrial markets it becomes even more difficult to collect an assembled picture of exactly how well the company is penetrating each market.1 Also, for companies where the product and customer structure is very intricate with many large custom projects, it is a challenge to identify and define the exact sales for competing products, making it tricky to measure the size of the market and thereby the penetration. As data becomes easier to collect, both through refined internal control systems for companies, and through an increased amount of databases offering macro-economical statistics, 2 there should be an opportunity to find new ways to measure market penetration also for complex international firms. The stock of available data today is unambiguously vast; however, there is an issue of collecting reliable, updated and useful data. 3 In a study by IBM, half the managers asked did not trust the data which they had to base decisions on.4 A problematic additional fact for developing countries is that it is even more difficult for companies to collect data that is up to date. Even though data can be collected to some extent, it becomes out of date 3-4 times faster than in more developed parts of the world.5 Still, “managed well, the data can be used to unlock new sources of economic value”6 and provide fresh insight for companies in a way that was not possible a few decades back. The
1 Alfa Laval, Project Specification (2010)
2 Gabarain, C (2010)
3 The Economist special reports (2010a)
4 Ibid
5 Paulson, M. Emerging Market Day Seminar (2010-02-02)
6 The Economist special reports (2010b)

Estimating Market Penetration of Multi-Industrial Companies on a Global Market
10
challenge is to lay hands on the most relevant bits of information quickly and easily and using it wisely.
1.2 Issue of study
Market penetration is a measurement of how well a company is moving forward on a market, in other words how well it is growing in relation to how much potential there is. The area of study is whether a company is maintaining its position and securing market share of new demand on growing markets and whether the penetration can be assessed over a range of markets. By being able to evaluate the market penetration over time, a company can assess whether or not it is maintaining an appropriate growth rate. Hence, the question this thesis will investigate is: How well is a certain company penetrating a set of markets across a wide range of industries in several countries?
1.3 Purpose of this thesis
This thesis will examine the possibility of assessing market penetration for global multi-industrial companies with the use of macro-economic data as an approximation of market size.
1.4 Project Scope and Delimitations
This Master’s Thesis project aims at fulfilling its purpose by developing a tool and applying it to a set of markets. This will be done through a Case Study on the company Alfa Laval AB and the five countries Brazil, Russia, India, China and South Korea (hereafter will be referred to as BRICK7). As Alfa Laval (hereafter referred to as AL) acts within a range of different industries in all the BRICK countries it is difficult to give an answer of a total penetration of the company. Therefore the authors have divided the study of AL according to the different segments within AL’s business. All segments are included in the study: Comfort, Fluids & Utility, Refrigeration & Cooling, Sanitary, Energy & Environment, Food Technology, Life Science, and Process Industry with the exception of Parts & Services as this segment handles the after-market and would require a different type of analysis. For each segment, a number of factors, so called proxies, are identified as industry drivers through thorough research both from primary and secondary sources. For each segment and each country, an estimation of the market penetration of AL is presented. In this report, the authors have chosen to present only the findings of three of the ten segments studied (Fluids & Utility, Refrigeration
7 The more common reference is “BRIC” without the “K”. In this case, South Korea is of particular
interest for the case company Alfa Laval and will therefore be added to the acronym.

Estimating Market Penetration of Multi-Industrial Companies on a Global Market
11
& Cooling and Process Industry). This is done to limit the vast amount of data that all ten segments convoys. What is emphasised instead, is the findings, discussions and conclusions of the Proxy-based Market Penetration Tool (PMPT) development and the method used to reach the market penetration measurements. Due to the limited time available for the project, the authors have visited only two of the five BRICK countries, China and Russia, in order to do interview experts. For the other countries, Brazil, India, and Korea, experts have been interviewed through telephone calls and email correspondence. The internal data available from Alfa Laval dates back to 2006, and due to this relatively short time span, external macro-economic data will only be statistically correlated to sales data in an indicative manner. The competitive landscape of these markets will not be considered, both due to time limit, lack of data availability and for reasons connected to characteristics and complexity of growing markets discussed in the Case Study chapter (Chapter 4). This thesis is limited to describing, explaining, understanding, and in some cases predicting the studied issues. It does not attempt to make any recommendations as to how Alfa Laval should act strategically based on the findings.

Estimating Market Penetration of Multi-Industrial Companies on a Global Market
12
1.5 Definitions
In order to understand the components of this study, certain definitions have to be clarified. Figure 1 shows an illustration of how a market and its different components are defined for this report.
Figure 1 – Market definition
8
The Market = Total of the sales of the company + the sales of competitors + unrealized market
Unrealized Market The unrealized Market consists of the customers who have not
yet discovered or who never will discover the possibility of buying the products that the company and its competitors offer.
Realized Market = Company Sales + Competitors’ Sales Market Proxies To define and quantify the Market, proxies of macro-economic
data is used, such as GDP, population, consumer consumption etc. 9
Market Penetration10 = Sales of the company / The Market
8 As defined by the Authors
9 Investopedia (2010) Market Proxy (www)
10 Investopedia (2010) Market Penetration (www)

Estimating Market Penetration of Multi-Industrial Companies on a Global Market
13
Market Share11 = Company Sales / Realized Market Figure 2 illustrates what is meant by Market penetration in terms of sales and proxies. When the proxy is assumed to represent market size, an increasing penetration occurs when sales grow faster than the proxy (shown to the left), while decreasing penetration occurs when the sales grow slower than the proxies (shown to the right).
1.6 Target audience
This thesis targets an audience of academics and professionals who are interested in methods to measure market penetration within different industries, in particular for the BRICK countries. The findings of the Case Study are especially aimed for the management and other staff at Alfa Laval, to offer them insights of the company’s market penetration on the BRICK markets.
11
Investopedia (2010) Market Share (www)
Figure 2 - Market penetration illustrated

Estimating Market Penetration of Multi-Industrial Companies on a Global Market
14
1.7 Thesis Disposition
1. Introduction In this chapter the background to this Master’s Thesis and the issues and problems it addresses are introduced as well as the purpose of the study. Furthermore, the scope and delimitations are clarified along with initial definitions of the terms used on the report.
2. Methodology This chapter describes the methodological process of the study. The thesis’ research approach is explained by theoretical reasoning as well as the different types of research data used. Finally, the aspects of validity and reliability are discussed.
3. Theoretical Foundation
The theories used in the thesis are presented and explained in this chapter.
4. Case Study
This chapter highlights the most important findings of the Case Study made of Alfa Laval. This Chapter gives the reader a wider understanding of what industries AL acts in and a general understanding of the BRICK countries.
5. Driver Analysis
In this chapter the proxies for the different industry segments are selected.
6. Tool Design
This chapter explains the different components and calculations of the PMPT.
7. Results
This chapter presents the results from the different tool components applied on the Case Study company for the segments of Fluids and Utility, Refrigeration and Cooling, and Process Industry and a general overview of the results for all segments.
8. Case Discussion & Conclusions
In this chapter, the findings from the case study are discussed and concluded. The shortcomings of the tool used for this particular case are also discussed.
9. General Discussion & Conclusions
This chapter will summarise the analysis findings and present the conclusions of the thesis. A discussion of possible future developments of the PMPT are be presented.

Estimating Market Penetration of Multi-Industrial Companies on a Global Market
15
2 Methodology
This chapter describes the methodological process of the Master’s Thesis and the research approach is explained in theoretical terms. Finally, the aspects of validity and reliability are discussed.
2.1 Method Working Steps
The initial step of this study has been to research theoretical grounds on the topic of market penetration and explore different methods of how it can be measured. This is presented and explained in Chapter 3. The following methodological process of this Master’s Thesis can be clarified in six main steps: 1.Research, 2 Selecting Industry Proxies, 3.Tool Design, 4.Tool Application, 5.Tool Result and Evaluation, and 6.General Tool Evaluation. The five first steps are included in the Case Study of the company Alfa Laval and as illustrated below in Figure 3, the final and sixth step has been done separately from the Case Study to make a general evaluation of the PMPT.
Figure 3 – Method steps

Estimating Market Penetration of Multi-Industrial Companies on a Global Market
16
Step 1. Research The initial step was to get a greater understanding of the case company, AL, and its organisational structure, different products and segments. Also, a thorough research of the BRICK countries has been done with the help of the PESTEL model as it is essential to understand their importance to the company’s future growth. The results of the company and country research are presented in Chapter 4. Step 2. Selecting Industry Proxies This step involved, first of all, the processing of AL´s internal sales data. Identifying industry drivers entails taking a closer look at AL’s different segments, and the industries in which they act within. By looking at what customer groups have the highest sales figures it has been possible to get an idea of which industries drive each segment. To be able to analyze what lies behind the growth of these industries, interviews have been made with Segment Managers, Sales Managers and country Presidents of AL. Through these interviews, the most important factors that drive the industries have been identified. Based on these, proxies have been chosen to represent the industry drivers. The final selection of what proxies to use for the PMPT is based on data availability. The choice of what database to use for collecting proxy data was influenced by an internal decision from the management of AL to take part in a temporary customer trial of The Economist Intelligence Unit database. Step 3. Tool Design This step involved creating the layout of the tool, as well as explaining and motivating the method of how market penetration is calculated. The calculations and graph arrangements used to extract penetration values and year to year correlations have been accounted for in Chapter 6 with examples to make the reader familiar with the format of the results. Step 4. Tool Application In this step, the tool has been applied to the case study company. The different calculations of the sales and proxy data are executed to create penetration and correlation values for each segment and each BRICK country. The results are found in Chapter 7 and in the appendixes B and D. Step 5. Tool Results and Evaluation This step has involved analysing the Alfa Laval PMPT-results after which conclusions of how well the company is penetrated in each BRICK country and segment has been made. Also, a future outlook analysis for each segment in each country has been made based on the interviews made with Segment Managers and other internal experts at Alfa Laval. The usefulness of the PMPT for Alfa Laval has then been evaluated and the shortcomings of the tool have been discussed.

Estimating Market Penetration of Multi-Industrial Companies on a Global Market
17
Step 6. General Tool Evaluation A general evaluation of the PMPT has been made in this final step and is presented in Chapter 9. The tool has been analysed from a general point of view regarding shortcomings, potential future development and recommendations, from which main conclusions were drawn. The steps above will be repeated in the beginning of the respective chapters through the following figure:
The step(s) discoursed in each chapter is (are) highlighted to make it easier for the reader to understand each methodological step and how it has contributed to the report.
2.2 Modelling & Case Study Research
Modelling has long since been used to simplify different market characteristics, and can be done in many different ways and although they can never mirror the exact reality, it is a useful tool for research.12 This thesis has intended to give a collected view of how well a company is acting within many industries at the same time, and how well it is penetrating a set of markets. There are many alternatives when it comes to the choice of research strategy. Each strategy represents a different way of collecting and analyzing empirical data. The authors of this thesis have chosen to do a Case Study, which is an empirical investigation of a current observable fact within its real-life context.13 The observable fact in this thesis is the market penetration of a company which in this case is Alfa Laval. The Case Study strategy of gathering information has been chosen for several reasons. First of all, the study is explorative14 and seeking to find the answer of how well a certain company is penetrating a complex market situation. The “how” question is asked about a contemporary set of events of which the authors have no control. For this circumstance, a Case Study strategy has a distinct advantage.15 Secondly, a Case Study research is a suitable method for creating theories for new areas of research, where the data is often both of qualitative and quantitative nature.16 The methodology of a Case Study has also been chosen because the flexibility of the method is suitable when studying the complexity of
12
Hägg, I. & Wiedersheim-Paul, F. (1984) 13
Yin, R K. (2002) 14
Patel, R. & Davidson, B. (1994) 15
Yin, R K. (2002) 16
Eisenhardt, K. (1989)
1 2 3 4 5 6
Estimating Market Penetration of Multi-Industrial Companies on a Global Market
18
multi-industrial markets.17 This is done in Step 2, where industries are analysed to identify measurable industry drivers. 2.2.1 Building Theory from Case Study Research
Using the research approach of a Case Study to build up and develop theory is a strategy used in this thesis. The research should involve using one or more cases to create theoretical ideas and propositions from case-based, empirical evidence.18 A Case Study can be used to accomplish various aims, and in this thesis it is used to develop the theory to assess a company’s growth potential on a set of markets, in other words whether a company is maintaining its position and securing market share of new demand on growing markets. Existing methods of measuring a market potential has been developed by for example using an opportunity index for emerging markets,19 and by looking at a company’s market performance by using sales against potential orders received.20 These two examples are explained in Chapter 3.1.1. The method of assessing market penetration for this thesis is to measure market potential. The result of the Case Study contributes with a theoretical proposition that it would be possible to assess market penetration using the PMPT by estimating the market size as the market potential. The choice of which case to include in the study is an important aspect of building theory from Case Studies.21 The Case Study strategy suggests a random selection of case or cases;22 however, Alfa Laval was not selected randomly. As the aim of this study is to create a tool for market penetration assessment for multi-industrial companies active across different geographic regions, the company was chosen for fulfilling these requirements. Through a suitable choice of company, the tool developed should be applicable also to other companies with similar businesses.23 Among other companies that fulfil the same criteria, Alfa Laval was chosen for their interest in the study and willingness to supply the authors with relevant information.
2.3 Inductive approach
This thesis has an inductive approach in the way that it does not refer to an existing and recognized theory of how market penetration is measured. Instead, the method of calculating and estimating market penetration is developed in this study. 24 The existing theoretical references of measuring market penetration are very limited and
17
Beverland, M. & Lindgreen, A. (2009) 18
Eisenhardt, K. (1989) 19
Cavusgil, S.T. (1997) 20
Tefler, K. R. (1962) 21
Eisenhardt, K. (1989) 22
Ibid 23
Ibid 24
Patel, R. & Davidson, B. (1994)

Estimating Market Penetration of Multi-Industrial Companies on a Global Market
19
methods practiced today by companies and consultants are estimation methods that vary between country and company. It has not been possible to find complete information of any method although those found have been taken into consideration and used as an inspirational reference.
2.4 Qualitative and Quantitative Study
This study involves both quantitative and qualitative research analysis. Quantitative macro-economic data and internal sales data are used when calculating the market penetration while qualitative research data of both secondary and primary kind are used for all other parts of the Case Study. 25 2.4.1 Primary data
Primary sources of data are those which have been eye witnessed or firsthand information collected by the authors.26 This thesis has collected primary data through interviews, e-mail correspondence, survey questions and a seminar. Interviews Interviews are done both in person and through telephone calls. Each interview is of semi-structured nature, that is, each interview held has been prepared for with questions regarding certain topics. These questions are not strictly followed chronologically during the interview and some questions are covered more than others, depending on the knowledge of the person being interviewed.27 Every interview has been done with both authors being present, one asking the questions and steering the dialog while the other writes down notes on a computer. The personal interviews have been with: - Eight out of nine Segment Managers of Alfa Laval - President of Alfa Laval China - Seven Sales Managers of different segments in Shanghai - External people from two Swedish banks and one person from the Swedish
Trade Council in Shanghai. - President of Alfa Laval Russia - Sales Managers of different segments in Moscow - External people from one Swedish in Moscow and an employee at the Swedish
Embassy in Moscow The telephone interviews have been with:
25
Patel, R. & Davidson, B. (1994) 26
Ibid 27
Bryman, A. & Bell, E. (2005)
Estimating Market Penetration of Multi-Industrial Companies on a Global Market
20
- Eight out of nine segment managers of Alfa Laval. - President of Alfa Laval Brazil - President of Alfa Laval Republic of Korea
The Alfa Laval employees interviewed have been selected due to their expertise and knowledge of the Alfa Laval segments. The external people are chosen by their knowledge and expertise of the certain country. E-mail correspondence Written interviews in the form of E-mail correspondence between key contacts at Alfa Laval and the authors has been continuous. External people from Swedish banks have also been contacted and answered questions regarding different industries and macro data. E-mail interviews have been with: - President of Alfa Laval Brazil - President of Alfa Laval Russia - President of Alfa Laval India - President of Alfa Laval China - President of Alfa Laval Korea Survey questions The topics covered in each interview are complex and extensive and therefore each interview was prepared for by sending a list of several questions that would be asked in the interview. This way the authors made sure that each person was aware of what kind of information was needed. It also gave the person being interviewed time to prepare answers. This way each interview could elaborate on the questions sent in advance and give a better qualitative result. Seminar The authors attended a Seminar on Emerging Markets organized by the Swedish Trade Council in Stockholm where different aspects of doing business especially in Brazil, Russia, India and China.
2.5 Secondary data
Secondary sources are defined as those which are not eyewitness reports or primary data.28 Secondary quantitative data has an important role in the empirics of this study. The tool is dependent on quantitative data which has been collected as raw data and collected through Alfa Laval’s business units, the Economist Business Intelligence Unit and the Central Intelligent Agency. Qualitative data has also been
28
Patel, R. & Davidson, B (1994)
Estimating Market Penetration of Multi-Industrial Companies on a Global Market
21
used for finding information about the BRICK countries and understanding the different industries which Alfa Laval acts within. Written documentations such as the Alfa Laval Annual Report (2008) have been used as well as Internet based secondary sources such as magazines (The Economist, Financial Times, and Fortune Magazine) and reports (World Health Organization, Central Intelligence Unit and Goldman Sachs). Theoretical sources have been found in books and articles found through the LOVISA database at Lund University.
2.6 Validity
The validity of this report refers to how exact we are measuring that which we want to measure.29 It is difficult to assess the validity for this study as there is no right answer to compare with. However, the results that have been shown to the Alfa Laval management group suggest that they are in general in compliance with their impression of how the company is doing. There are some direct limitations to the validity of the results presented, mainly associated with the method itself. As the scope of the thesis is to investigate the usefulness of a rough estimation of market size through the use of different macroeconomic data series, accuracy losses are to be expected. The fact that a similar method has been used by a well known consultancy agency indicates that it does provide useful results, but with some reservations. Another source of inaccuracy is the proxies themselves. As it is not always possible to acquire the most closely related sets of data to each industry, some compromise is likely to appear in the selection of proxies. Additionally, the sets of data for many countries are only estimations which make it difficult for the method user to properly assess their precision. It is also possible that the authors themselves were affected by biases held within the case company that affected their conclusions. To avoid this, interviews with both internal and external sources were used, although internal interviews made up the majority.
2.7 Reliability
The reliability of this report refers to how reliable the PMPT method is.30 There are concerns for the quality of Case Studies as they are often unique and there is a general lack of methodological structure in the Case Study approach according to
29
Patel, R. & Davidson, B. (1994) 30
Ibid

Estimating Market Penetration of Multi-Industrial Companies on a Global Market
22
some authors.31 However, the value of Case Studies as a way to generate new theories has been valuable to many fields, such as marketing, where for example the International Marketing Management (IMM) has actively encouraged the use of Case Study research.32 The results of the method described in this report are largely dependent on two sets of data, the sales numbers, and the proxies used. As the result is a relative number compared to world average, the method should give the same quality of results for different companies and countries, given that the source of the proxy data is the same. As only one case is described however, this is a theoretical argument. If the data source is changed between different companies or cases, the reliability of the result would be altered, as there is great variation in the method for collecting macro-economical data. Even GDP which is widely used is subject to different interpretations by different institutions. Within the Case Study, the PMPT method is used on a set of five countries and an additional benchmark region as well as over ten different company segments creating a set of 60 independent research units. This allows for some control of the variation of the results.
31
Yin, R. K. (1981) 32
Beverland, M. & Lindgreen, A. (2009)

Estimating Market Penetration of Multi-Industrial Companies on a Global Market
23
3 Theoretical foundation
This chapter aims at explaining the usefulness of market penetration as a measurement for assessing growth potential, and why it can be of importance for management strategy making, especially in matrix structured organisations. Different ways of measuring market size and penetration are discussed followed by a clarification of how statistical and proxy data is used. Finally, the PESTEL model is presented which is used for analysing a macro-environment.
3.1 The Multinational Matrix Corporation
To better understand a company’s business situation it is important to look at its organizational structure. There are several ways in which a company can be organized of which a common design is the multidivisional structure (M-structure). When it was introduced, the M-structure was seen as a revolutionary way to organize organizations as it allowed for more autonomous decision making for the different parts of a firm.33 In recent years, the additionally complex matrix organization (MX-structure) has become more common as firms become increasingly exposed to multiple geographical regions and product applications. 34 The matrix organization is a combination of two or more multidivisional levels, based on for example customer type, geographical region or product type, which can results in both advantages and disadvantages.35 The most obvious consequence of this structure is the extensive interdependencies created between different business units, where the results of one unit affect the other. It also creates a situation where managers report to more than one senior unlike in the classic hierarchic business structure. This in turn can be a source of increased flexibility in the organization, but it can also incur increased costs. In general, the matrix business structure is preferred by large multinational companies acting on markets with diverse product and customer requirements illustrated in Figure 4.
33
Chandler, A. (1966) 34
Chi, T. & Nystrom, P. (1998) 35
Ibid

Estimating Market Penetration of Multi-Industrial Companies on a Global Market
24
36
As these companies face complex market characteristics and also have a complicated internal structure of co-dependencies, it is assumed that they also face difficulties in measuring market penetration for their different business units. The case company used in this thesis has a similar organization as the MX structure, with a market environment that fits the description in Figure 3, that is, with a high technological diversity across product lines and speed of technological change, as well as a large variation of customer tastes and regulatory requirements across different geographical areas. These factors make Alfa Laval a suitable company for the development of the PMPT.
3.2 Strategy and Market Penetration
The term strategy can be defined by that of intentional and conscious guidelines which determines decisions into the future.37 With a well defined strategy a company makes sure its performance is constantly improved,38 and competes successfully on particular markets.39 Corporate strategy decisions can be seen as the basis on what surpasses a company’s vision towards growth and success.40 To become a high-performance company, it must grow as well as attain a sustainable and superior return on investment.41
36
Chi, T. & Nystrom, P. (1998) 37
Mintzberg, H. (1979) 38
Day, G. S. (1984) 39
Johnson, G. et al (2008) 40
Grant, R. M. (2008) 41
Frigo, M. L. (2008)
Figure 4 – Corporate structure matrix

Estimating Market Penetration of Multi-Industrial Companies on a Global Market
25
Market penetration is a term often used by companies to describe how they want to grow. For example, the Ansoff Matrix is a useful framework when looking at possible strategies to reduce the gap between where the company is today and where it aims to be in the future.42 By measuring market penetration, that is, the amount of sales the company has compared to the total theoretical market for that product, the company can keep track of its growth potential and its current position compared to competitors, thereby making accurate decision on how their strategy should evolve.43 3.2.1 Measuring Market Potential
A method of measuring market potential as an “Overall Market Opportunity Index” is described by Cavusgil (1997) who says that during the late 1990’s companies who were growth-minded could not overlook the potential of certain emerging markets. Even though his method is more directed at new entrants, and the whole measurement takes into considerations factors connected to market entry and establishment, it is still interesting since it beholds the idea of quantifying market potential. He explains there are seven dimensions of Market Opportunity: Market Size, Market Growth Rate, Market Intensity, Market Consumption Capacity, Commercial Infrastructure, Economic Freedom, and Market Receptivity.44 Table 1 – The seven dimensions of the Overall Market Opportunity Index
45
Dimension of Market Opportunity Representative variables
Market Size Total country population GDP per capita
Market Growth Rate Annual growth rate of an industry
Market Intensity Purchasing Power Parity (GNP / capita) Consumer expenditure per capita
Market Consumption Capacity Size of middle class
Commercial Infrastructure The ease of access to distribution and communication channels
Economic Freedom An index developed by the Heritage Foundation by Johnson and Sheely
Market Receptivity Per capita imports from U.S imports over the past five years
Table 1 shows the seven dimensions of the “Overall Market Opportunity Index” and what variables were chosen to represent each dimension in order to make it
42
Johnson, G. et al (2008) 43
Investopedia (2010) Market Penetration (www) 44
Cavusgil, S.T. (1997) 45
Ibid

Estimating Market Penetration of Multi-Industrial Companies on a Global Market
26
measurable. For example the dimension market size is measured by a country’s total population as a rough estimate of market potential. Although the total population might not be the target of one single company, it indicates the relative importance of that country’s market. An estimation of the market size can help a company to get an idea of what the market potential is. Two methods used today by the Swedish Trade Council for estimating market size when data is unavailable are the “Top-down” approach and the “Bottom-up” approach. The first one involves using macro-economic data, from which relevant market size can be logically estimated for example by using market data and population size. The second method, the “Bottom-down” approach, involves extrapolating an estimation of the total market by researching actual volume or value of a small sub-segment of the market.4647 These methods show that there are historical and current efforts of collecting a general picture of a company’s growth possibilities on certain markets by using a method of measuring market potential and market size. 3.2.2 Measuring Market Penetration
Measuring market penetration can be done in different ways, of which one can be illustrated with a simplified example: If there are 200 million (m) people in a country and 55m of those people have a bicycle, then the market penetration of bicycles would be approximately 28%. In theory, there are still 145m potential customers for bicycles. This could be a sign of growth potential for bicycle makers. 48 A company that manufactures bicycles and has sold 20m of the bicycles has then a market penetration of 10% (20m/ 200m), in contrast to a market share of 36% (20m / 55m).49 Another, dynamic, way to measure penetration could be to use yearly sales. Let’s say for example that for the same market as above, 10m bicycles are sold each year. Then the total market penetration for new bicycles is 5% (10m / 200m) and for a company which sells 2m bicycles in the same year the corresponding market penetration would be 1% (5m/ 200m) while their market share is 20% (2m / 10m). The equations for market penetration of the bicycle manufacturer in this example are as follows: Market Penetration = Total sold products / Total Potential Market or
46
Hägglund, F., Correspondence (2010) 47
Swedish Trade Council, Unpublished Document (2010) 48
Investopedia (2010) Market Penetration (www) 49
Ibid

Estimating Market Penetration of Multi-Industrial Companies on a Global Market
27
Sales for a time period / Total Potential Market 50 There is no common approach to measure and visualize a company’s market penetration across a set of different industries and there is limited theory on the subject of alternative ways of measuring market penetration. One method used by Tefler (1962) is to measure market performance by using the sales against market potential in the construction industry. He explains that it is logical to assume the direct relationship between product sales or shipment and the amount of building that takes place of the type that represents a market for that product. As it is found that shipments correlate with construction contracts, a firm can measure current sales performance against potential contracts for specific sales territories. The procedure of the method needs consideration regarding: 51
1) Careful selection of which types of projects should be representing the market for the product
2) Determining which unit of measurement (number of projects, square feet of floor area or the valuation of project)
3) Establishment of geographical area (market of an industry, country or country groups etc)
Despite the limitations of existing market penetration measurement theory, the authors have discovered a method used by a consultant company called Booz & Company. They have, similarly to the “Top-down” approach, used Industry Output of key driving industry segments as a proxy to market size and related this to the sales of a company. For example, a company that sells components in different parts of the process industry, and instead of looking at all aspects of this wide industry, a proxy, for example the steel industry, is chosen to be representative. The sales of the company within the process industry are compared to the industry output of the steel industry. To further get a measurement of market penetration of the company in the process industry, a world average is used.5253 The method of measuring market penetration in this thesis has been inspired by the “Top-down” approach, the methods used by Booz & Company and Tefler (1962) where particular proxies are used to represent the size of a particular market. Similarly to the “Overall Market Opportunity Index”, the method for measuring market penetration uses representative variables, as market proxies, which are explained further in the next chapter.
50
Investopedia (2010) Market Penetration (www) 51
Tefler, K. R. (1962) 52
Pannell, N., Correspondence (2010) 53
Booz & Company, Unpublished Document (2004)

Estimating Market Penetration of Multi-Industrial Companies on a Global Market
28
3.3 Market Proxies
To simplify a study that requires market statistics and variables, a market proxy or a representation of a specific or the overall market, can be used. It is not always possible to chose or find a market proxy that represents the whole market, therefore a proxy will often only represent a piece of the market.54 As in the example discussed in Chapter 3.2 Measuring Market Penetration, the steel industry is a proxy for the process industry. For the PMPT, proxies are selected to be representative for the size of the different market segments of AL.
3.4 Statistical Analysis
Statistical analysis is a powerful way of making conclusions from numerical data. The most common form is descriptive statistical analysis where a variance or standard deviation of a sample around some kind of average or mean is described. 55 3.4.1 Mean & Variation
The mean of a sample is the sum of all observed values divided with the number of observations.56 In this thesis the mean will be calculated for the whole world to function as a reference point for the specific segments and countries studied. This value is calculated as the total sales for a company divided over the sum of the proxy values for the countries on which the total sales were made. For a company acting in the majority of the countries in the world, like in the case for AL, the value of the proxy for world total is used. By using this mean value as a reference, the penetration of the individual countries can be expressed by their deviation from the average. This is done in the form of relative deviation, more explicitly as a percentage of the average value. 3.4.2 Correlation
Correlation analysis is a method used to measure the relationship between two sets of variables and can be done with different techniques. In this thesis, the correlation coefficient is used to compare the year to year change of sales and proxies, to indicate to which extent they co-variate. The coefficient gives a number between -1 and 1 where 1 indicates a perfect linear relation, 0 no correlation, and -1 indicates a perfect opposite linear relation.57 The correlation coefficient is defined by the following formula in this thesis under the command “CORREL” in Excel.58
54
Investopedia (2010) Market Proxy (www) 55
Hassmén, P. & Koivula, N. (1996) 56
Körner, S. & Wahlgren, L. (1993) 57
Ibid 58
Excel Function Help, Correl
Estimating Market Penetration of Multi-Industrial Companies on a Global Market
29
𝐶𝑜𝑟𝑟𝑒𝑙 𝑋, 𝑌 = 𝑥 − 𝑥 𝑦 − 𝑦
𝑥 − 𝑥 2 (𝑦 − 𝑦 )2
In the formula above, 𝑥 and 𝑦 are sample means.59 The assumption made in this report and which allows macro-economic proxies to be used to simulate market size, is that the market size is dependent on the growth of the proxies, and that for a company active on these markets, sales should consequentially be dependent on the proxies as well.60 By using the correlation coefficient, this assumption can be checked over time. To limit noise and inaccuracies and in sample variance, this correlation analysis should be done on as many years as possible to be reliable and as only a finite number of years can be used (either limited by proxies, sales data availability or by time constraints) the statistical results cannot be expected to be completely accurate for this method.61 The overall statistical approach that is useful for the PMPT method developed in this report is greatly dependent on the available data set size. If the correlation coefficient is used over a short time period, a correlation of 0 doesn’t mean that there is no correlation between the proxies and the sales in the long run. The comparison of sales divided by proxy can still give an indication of how the company is doing on a certain market in comparison to average, despite that the two arrays can have developed differently over the studied time period. If used over a long time period, the correlation is a more useful indication of how well the method works.
3.5 Macro-economic analysis
The reason for looking at macro-economic aspects is to get an external view of a market, which is the first step in a strategic analysis.62 There are various models of analyzing macroeconomic aspects of a market. The purpose of this type of analysis for this study is mainly that of understanding the BRICK countries in regard of historical, political and economical aspects and getting an overview of what how they differ. The PESTEL framework, presented in Figure 5, is a model used to examine and analyse the external macroeconomic environment of a firm. It includes six aspects described with examples below.63 It will be used in the Case Study to understand the BRICK countries as it fulfils the need to take the countries differences into consideration.
59
Körner, S. & Wahlgren, L. (1993) 60
Ibid 61
Ibid 62
Johnson, G., et al. (2008) 63
Ibid

Estimating Market Penetration of Multi-Industrial Companies on a Global Market
30
64
64
Johnson, G., et al. (2008)
Political
• Environmental regulation
• Employment laws
• Political stability
Economic
• Economic growth
• Governmental spending
• Stage of the business cycle
Social
• Income distribution
• Demographics
• Lifestyle changes
• Education
Technological
•New inventions
•Energy use and cost
•Changes in internet use
•Goverment research
Environmental
•global warming
•environmental issues
Legal
•competition law
•health and safety
•employment law
Figure 5 - PESTEL

Estimating Market Penetration of Multi-Industrial Companies on a Global Market
31
4 Case Study
In this chapter the relevant findings of the Case Study, which has been done on the company Alfa Laval with focus on the growing markets of the BRICK countries are presented. The case company, the products and the segments are described and explained. Furthermore, the five BRICK countries are introduced and presented by using the aspects of the PESTEL model. Lastly, Alfa Laval’s involvement on these markets is clarified.
4.1 Alfa Laval
Gustaf de Laval and Oscar Lamm Jr. originally founded Alfa Laval in 1883 under the name of Separator AB. Today, it is a global company with over 11500 employees and a turnaround of SEK 27464 million (2008).65 The company is noted on the Stockholm Stock Exchange in its present form since 2002, after being sold from Tetra Pak.66 Alfa Laval´s headquarter is Located in Lund in Sweden, and there are several other manufacturing sites across Europe, Asia, the US and in Brazil.67 Alfa Laval’s vision is to improve customer performance and profitability by providing the latest technological solutions.68 Sales are made through two divisions, Process Technology and Equipment division of which Equipment handle customers with a well-defined and continuous need for products and Process Technology handle customers with a more custom demand. Additional geographical segmentations create a complex matrix organisation, with additional managers for different segments and product groups. The business structure can be seen in Figure 6.
65
Alfa Laval (2010) About Us (www) 66
Funding Universe (2010) Alfa Laval AB (www) 67
Alfa Laval (2010) About Us (www) 68
Alfa Laval (2010) Press Information (www)
1 2 3 4 5 6

Estimating Market Penetration of Multi-Industrial Companies on a Global Market
32
Figure 6 – Alfa Laval business structure
69
4.1.1 Products
Alfa Laval´s products are divided into three core technologies: heat transfer, separators and fluid handling which are briefly described in Table 2.
Table 2 – Alfa Laval Products70
Heat Exchangers Product types: These products are available in many different shapes and sizes. Most common are plate heat exchangers (picture), but there are also spiral models for rough conditions, shell-and-tube exchangers, air heat exchanger, and several other types. Use: Heat exchangers are used to heat, cool, condensate and evaporate gases and liquids. This makes them an important part of most industrial processes. They usually work by leading hot and cold liquids/gases by each other in channels, separated by thin conductive walls.
69
Alfa Laval (2010), About Us (www) 70
Alfa Laval (2010) Showroom (www)

Estimating Market Penetration of Multi-Industrial Companies on a Global Market
33
Separators Product types: Separators are divided into high speed separators (picture), decanters and membrane, and each group includes several sub-types. Use: These products are used to separate liquids from each other, and also to remove particles from liquids and gases. The original intention for separators was to separate cream from milk, and the diary industry is still a large area of application for this product.
Fluid handling Product types: Pumps, valves (picture), tank equipment and installation material. Use: Alfa Laval specializes in fluid handling equipment for industries where the requirement for hygienic safety is high, such as the food and medical industries. The products are used to transport liquids and for regulating fluid flow as well as many other fluid-related applications.
These products serve a wide range of industrial applications divided into 10 market segments with addition of a Parts & Service segment. The divisional segment structure is presented in Table 3. Table 3 – Alfa Laval divisions
4.1.2 Segments
Alfa Laval´s different segments are descried briefly in Table 4. Due some recent reorganization of these segments in the organization, this segmentation is not identical to the one used in the annual report, but will be the main structure for this report.72
71
Original Equipment Manufacturer 72
In annual report 2008, Comfort and Refrigeration & Cooling are combined into one segment: Comfort & Refrigeration.
Division Segments (Parts & Service excluded)
Equipment Comfort Marine & Diesel
OEM71 Fluids & Utility
Refrigeration & Cooling
Sanitary
Process Technology
Food technology
Energy & Environment
Process Industry
Life Sciences

Estimating Market Penetration of Multi-Industrial Companies on a Global Market
34
Table 4 – Alfa Laval Segments
Market Segment Operations73
Comfort Comfort products are used to temperate indoor environments at temperatures above zero. This segment primarily sells heat exchangers to customers within offices, shopping malls and for the heating of homes.
Marine & Diesel This segment mainly serves the shipping industry, where a wide variety of products are offered. It also provides diesel power stations for use at remote locations, or for swift company start ups.
OEM These customers use Alfa Laval´s products as components in their own products, including air-conditioning equipment, diesel engines and boilers. Usually Alfa Laval forms partnerships with these customers.
Fluids & Utility Most industries use liquids in their production, and Alfa Laval offers solutions within liquid cleaning and heat control that optimize energy utilization for their customers and thereby cuts their expenses.
Refrigeration & Cooling
These products are also sold to customers with the need for chilled and freezing compartments, such as food processing, supermarkets and ice rinks. Customers are divided into industrial and commercial applications.
Sanitary This segment offers products to customers with very high requirements for hygiene. These include producers of diary food, beverage, biotech- and pharmaceutical industries with Tetra Pak being the single largest customer.
Food technology Alfa Laval sells products to producers of different kinds of food and beverage industries. These range from wine, juice and beer to processed meats and vegetables.
Energy & Environment
Within the Energy sector, Alfa Laval offers solutions to the extraction of oil and gas as well as energy production at power plants. In the Environment sector, they offer water treatments that help reduce waste and transportation.
Process Industry Alfa Laval serves the process industries of petrochemical products, plastics, polymers, metals, minerals, bio-fuels, paper, starch and sugar and they have many large customers around the world within this segment.
Life Sciences These customers produce biochemical, hygienic, pharmaceutical and healthy food products. Like in sanitary, these customers have a very high requirement of hygienic safety.
4.2 The BRICKs
It is a fact that the global landscape is changing. In 2003, the Goldman Sachs chief economist Jim O’Neill coined the “BRIC” phenomenon (Brazil, Russia, India, China), and the grouping term has had an important impact on the way we view the global
73
Alfa Laval (2008) Annual Report

Estimating Market Penetration of Multi-Industrial Companies on a Global Market
35
scene. The fact that these countries: Brazil, Russia, India and China collectively stand for 15 % of global GDP and with expanding population growth the countries are gaining importance and power. “We radically need overhaul of the IMF, the G7, the G8, to give these guys a much bigger say in the running of the world.” 74 Alfa Laval has decided to add South Korea to the group because it is as an important market for the company, hence creating the abbreviation “BRICK”, which is used in this report. 4.2.1 GDP
The BRICK countries have experienced rapid recent growth, and their GDP is predicted to continue growing. Figure 7 and 8 show the predicted economic development according to the Economist Intelligence Unit.75 Although all countries were hit by the financial crisis, these countries are expected to recover relatively quickly. 76 China for example had an average GDP growth rate of over 8% in 2009 despite the crisis, mainly due to a very large economic stimulus programme from the government.77
Figure 7 – GDP Growth Figure 8 – GDP / Capita
74
Kowitt, B. (2009) 75
Economist Intelligence Unit, Database 76
Beattie, A. (2010) 77
Trading Economics (2010) China GDP growth rate (www)
-10
-5
0
5
10
15
2005 2010 2015 2020
% Y
to
Y
Real GDP % growth
Brazil China India
Russia Korea
Forecast
0
10 000
20 000
30 000
40 000
50 000
2005 2010 2015 2020
US
$
GDP/Capita
Brazil China India
Russia Korea
Foreca

Estimating Market Penetration of Multi-Industrial Companies on a Global Market
36
4.2.2 Macroeconomic Summary
This chapter has used the PESTEL model to highlight important facts of the BRICK countries. Each of the five aspects; Political, Economical, Social, Technical, Environment and Legal have been taken into consideration.
Brazil Brazil is politically stable which speaks for growth potential. The country is expanding its presence on the world markets and its economy outweighs the rest of the South American countries. Its economy is characterized by the large and developed agricultural, mining, manufacturing and service sectors. Brazil has advanced on macroeconomic stability and succeeds in maintaining its inflation target. Although the economic crisis hit the economy as global demand for Brazil’s commodity-based exports decreased, Brazil was one of the first emerging markets to start recovery.78 Economic growth is an effect of growing demand for Brazilian products but most of all as a consequence of increasing domestic consumption.79 Brazil has a population of almost 199 million people which
grows about 1.2% per year. In total, 86% of the population lives in cities and the literacy rate is 88.6%.80 The economical development of recent years has lead to social progress. Employment has advanced while the income gap has decreased. However, there are still a lot of challenges to face when dealing with inequality and poverty. 81 Brazil consumes almost as much electricity as it produces. The country has some oil proven reserves but does not produce as many oil b/d82 as it consumes. Its industries are textiles, shoes, chemicals, cement, lumber, iron ore, tin steel, aircraft, motor vehicles and parts, and other machinery and equipment. Around 33% of the population are internet users according to 2008 numbers, and is a number which is probably bigger today. 83 The domestic set of regulations is seen as a hinder to trade and investments. Despite the positive development of the economy, bottlenecks such as poor infrastructure, problematic and bureaucratic rules when running a business and high costs on loans
78
CIA - The World Factbook (2010) Brazil (www) 79
Markovic, A. (2008) 80
CIA - The World Factbook (2010) Brazil (www) 81
National Board of Trade (2009) 82
Barrels per day 83
Markovic, A. (2008)
Estimating Market Penetration of Multi-Industrial Companies on a Global Market
37
makes it is difficult for individuals to start and run companies.8485 In the study called “Ease of Doing Business” done by the World Bank, Brazil falls on the 125th place out of the 181 countries included in the study.
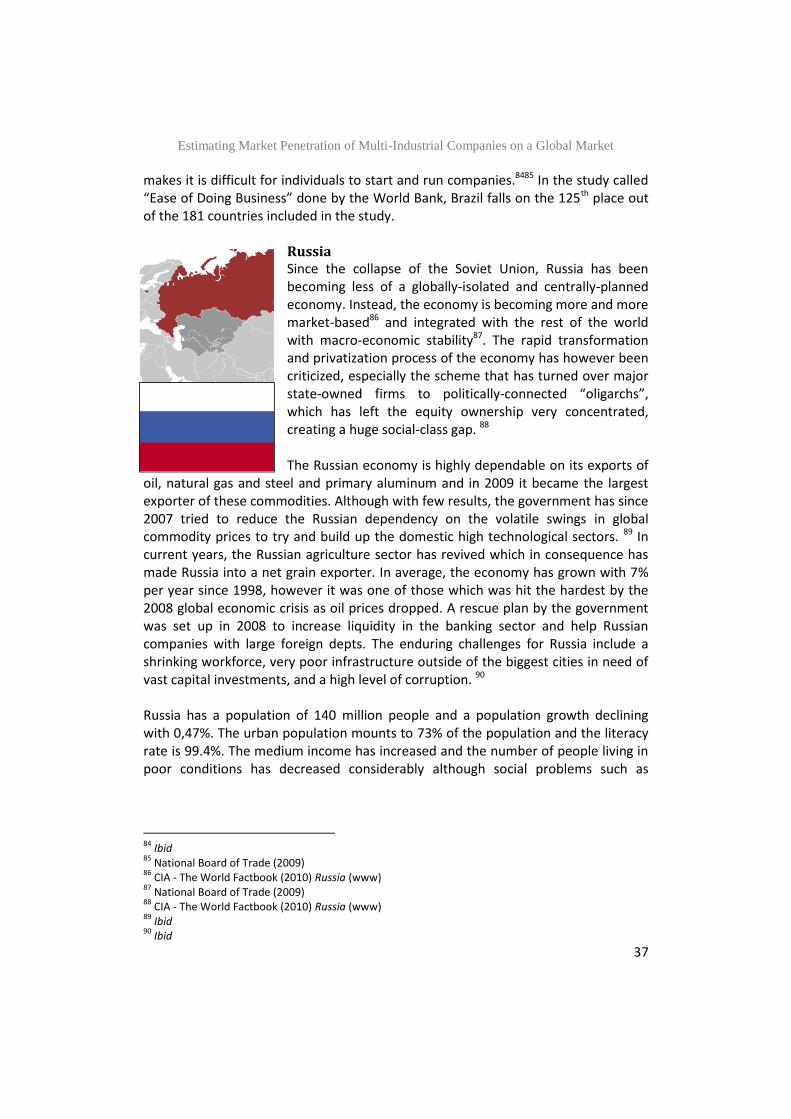
Russia Since the collapse of the Soviet Union, Russia has been becoming less of a globally-isolated and centrally-planned economy. Instead, the economy is becoming more and more market-based86 and integrated with the rest of the world with macro-economic stability87. The rapid transformation and privatization process of the economy has however been criticized, especially the scheme that has turned over major state-owned firms to politically-connected “oligarchs”, which has left the equity ownership very concentrated, creating a huge social-class gap. 88 The Russian economy is highly dependable on its exports of
oil, natural gas and steel and primary aluminum and in 2009 it became the largest exporter of these commodities. Although with few results, the government has since 2007 tried to reduce the Russian dependency on the volatile swings in global commodity prices to try and build up the domestic high technological sectors. 89 In current years, the Russian agriculture sector has revived which in consequence has made Russia into a net grain exporter. In average, the economy has grown with 7% per year since 1998, however it was one of those which was hit the hardest by the 2008 global economic crisis as oil prices dropped. A rescue plan by the government was set up in 2008 to increase liquidity in the banking sector and help Russian companies with large foreign depts. The enduring challenges for Russia include a shrinking workforce, very poor infrastructure outside of the biggest cities in need of vast capital investments, and a high level of corruption. 90 Russia has a population of 140 million people and a population growth declining with 0,47%. The urban population mounts to 73% of the population and the literacy rate is 99.4%. The medium income has increased and the number of people living in poor conditions has decreased considerably although social problems such as
84
Ibid 85
National Board of Trade (2009) 86
CIA - The World Factbook (2010) Russia (www) 87
National Board of Trade (2009) 88
CIA - The World Factbook (2010) Russia (www) 89
Ibid 90
Ibid

Estimating Market Penetration of Multi-Industrial Companies on a Global Market
38
alcoholism is wide spread and shortens the average life expectancy, especially of men. 91 Russia is the world’s 5th largest producer of electricity (1.04 trillion kWh) and is the 4th largest consumer of electricity (1.02 trillion kWh) in the world. Having vast oil reserves it is the world’s 2nd biggest producer of oil (9.81 million b/d) and world’s biggest producer of natural gas (66.2 billion cu m). The industrial sector makes up a complete range of oil, coal and gas production, all forms of machine building, construction equipment, consumer durables, foodstuffs and handicrafts. Russia is not a member of The World Trade Organization and there is a great uncertainty about the trade regulations. The custom services are very complex and the prospects for companies trading and investing are unforeseeable.92 The legal protection of property rights is very weak and state interference is everywhere in the private sector. 93
India Since the early 1990’s, India has developed into a market-based economy, with more openness to foreign trade and investment, although there are still hints of the past autarkic policies left. The economic liberalization has accelerated India’s economic growth which has been around 7% since the late 1990’s. Compared to the rest of the world, India escaped the global financial crisis because of precautious banking policies. There was a slow-down in economic growth to around 6% in 2009 but domestic demand driven by consumer consumption has become key drivers of the economy. Challenges of the future lay within
the limited physical and inadequate social infrastructure, limited employment opportunities and deficient basic and higher education prospects. 94 India has a population of almost 1.2 billion people with an annual growth of 1.4%. This huge and growing population is a fundamental problem concerning social, economical and environmental features in India. Around half of India’s work force is in the agriculture sector, but services stands for the highest economic growth such as accounting which by itself is more than half of India’s output but less than one-third of the labor force. Although a fraction, it is the large number of well-educated people that India is capitalizing on and the reason why India is today a major world
91
National Board of Trade (2009) 92
National Board of Trade (2009) 93
CIA - The World Factbook (2010) Russia (www) 94
Ibid
Estimating Market Penetration of Multi-Industrial Companies on a Global Market
39
exporter of software services and workers’ expertise. 95 Inequality in income is spread both geographically and socially and poverty is ubiquitous. 96 India is the world’s 6th biggest producer of electricity (761.7 billion kWh) and also the 6th biggest consumer in the world (568 billion kWh). It has a production of natural gas and oil but consumes well over what it produces. The major industries are textiles, chemicals, food processing, steel, transportation equipment, cement, mining, petroleum, machinery, software and pharmaceuticals. Only 81 million people, according to numbers from 2008, are users of the internet. 97 In the World Bank’s study, “Ease of Doing Business”, India falls on the 122nd place out of the 181 countries included in the study which is because of a complex system of employment, a high level of bureaucracy and unpredictable governmental interference.98
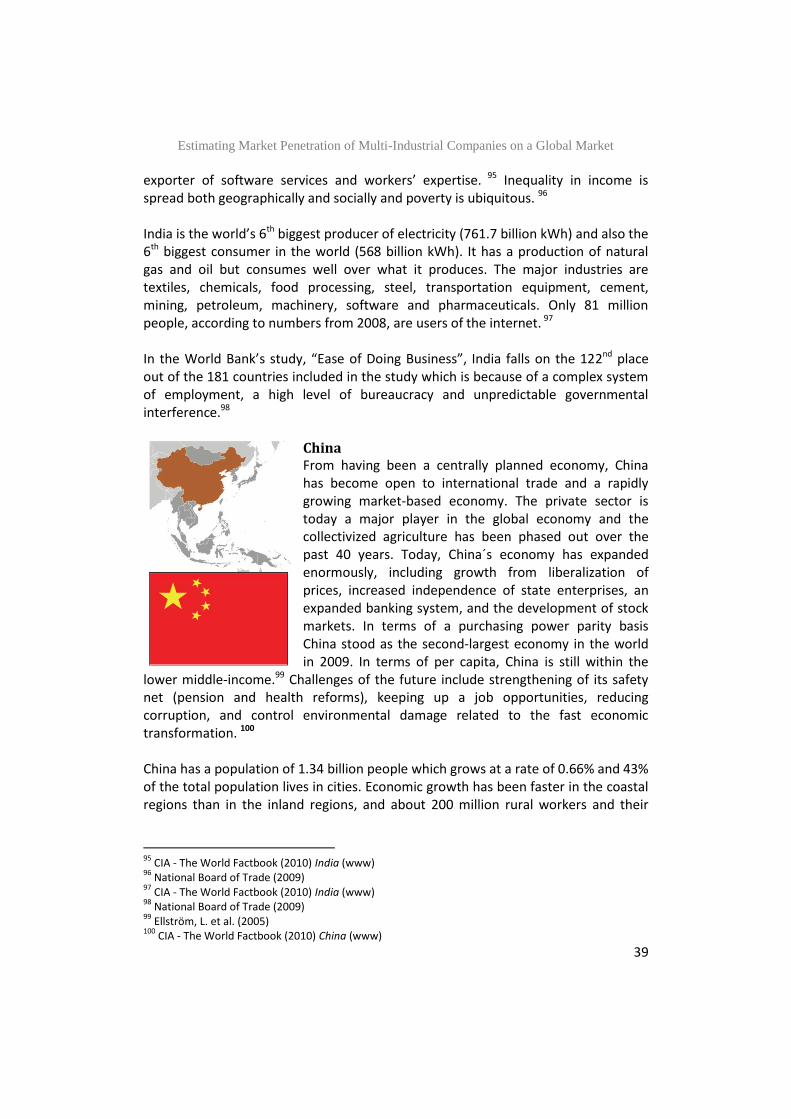
China From having been a centrally planned economy, China has become open to international trade and a rapidly growing market-based economy. The private sector is today a major player in the global economy and the collectivized agriculture has been phased out over the past 40 years. Today, China´s economy has expanded enormously, including growth from liberalization of prices, increased independence of state enterprises, an expanded banking system, and the development of stock markets. In terms of a purchasing power parity basis China stood as the second-largest economy in the world in 2009. In terms of per capita, China is still within the
lower middle-income.99 Challenges of the future include strengthening of its safety net (pension and health reforms), keeping up a job opportunities, reducing corruption, and control environmental damage related to the fast economic transformation. 100 China has a population of 1.34 billion people which grows at a rate of 0.66% and 43% of the total population lives in cities. Economic growth has been faster in the coastal regions than in the inland regions, and about 200 million rural workers and their
95
CIA - The World Factbook (2010) India (www) 96
National Board of Trade (2009) 97
CIA - The World Factbook (2010) India (www) 98
National Board of Trade (2009) 99
Ellström, L. et al. (2005) 100
CIA - The World Factbook (2010) China (www)
Estimating Market Penetration of Multi-Industrial Companies on a Global Market
40
families have moved to urban areas to find work. 101 In recent years, many of them have returned to their rural villages.102 Effects of the fast economical development have been increased employment rates, decrease in poverty and an increase in living standards for a large portion of the population.103 An effect of the “One Child” policy is the rapid aging population in China, compared to the rest of the world. Another affect is the lack of female populates in the current adult generations.104 105 The electricity production in China is the world 2nd largest, with 3.45 trillion kWh. China is also the 2nd largest consumer of electricity in the world, with a usage of 3.44 trillion kWh. China has considerable production of oil and consumes 7.999 million b/d, being the 3rd biggest consumer of oil in the world. Its industries are many: everything from mining and processing of steel and other metals, machine building, consumer products, food processing and transportation equipment. 298 million people in China are users of the internet, making china number one in internet using inhabitants. China has several long term environmental problems such as air pollution, soil erosion and fall of the water table supply. Due to erosion and the economic development, there is a continuous loss of land which can be used for productive farming. The government has announced that the carbon intensity will be reduced 40% from 2005 levels and that they seek to use other sources than coal and oil to add to the energy production capacity and is focusing on renewable energy sources and nuclear energy development.106 107 Although these policies are outspoken and well intended, the many provinces in China have different rules and regulations making it difficult to control the whole country. 108
101
Ibid 102
Ibid 103
Employee at Swedbank in Shanghai, Interview (2010-03-11) 104
Ibid 105
CIA - The World Factbook (2010) China (www) 106
Employee at Nordea in Shanghai, Interview (2010-03-11) 107
CIA - The World Factbook (2010) China (www) 108
Employee at Nordea in Shanghai, Interview (2010-03-11)

Estimating Market Penetration of Multi-Industrial Companies on a Global Market
41
South Korea Unlike the rest of the BRICK, South Korea has already achieved a status of having a high-tech industrialized economy due to an implausible growth and is today one of the world’s twenty largest economies. Only four decades ago, South Korea’s GDP was comparable with levels of the poorest countries of Africa and Asia. Success was achieved due to close cooperation between the government and business, for example by import restrictions. The government has encouraged imports of raw materials and technology at the expense of consumer goods, and encouraged saving and investing rather than consumption. The 2008 global financial crisis slowed down Koreas GDP growth to 2,2% 2008 and turned down
0.8% in 2009. The economy began to recover in the end of 2009 and challenges now a long term overdependence on manufacturing exports to drive the economic growth.109 South Korea has a population of 48.4 million people and a population growth of 0.27%. A long term challenge to deal with is a rapidly aging population and an inflexible labor market.110 The electricity production is 440 billion kWh and the consumption is around 390 billion kWh (World 11th). There are no oil proven reserves in South Korea and the oil production is well below the consumption of over 2.175 million b/d. The most important industries of South Korea are machinery, electronic equipment, steel, transport equipment, organic chemicals and plastics.
4.3 Alfa Laval in the BRICK countries
Being a global player, it is inevitable for a company such as Alfa Laval to recognize the importance of the potential and power that lies within the future of the BRICK countries. In 2009, the BRICK countries stood for 26% of Alfa Laval´s sales, and the company sees great potential for continuous growth for their products in these countries.111 Out of the five countries, China stands for the largest sales contribution as can be seen in Figure 9. All markets have grown between 2006 and 2007, but all except for India have also had significant drops in sales in 2009, as a consecuence of the 2008 economical chrisis. The most significant drops have been seen in China and
109
CIA - The World Factbook (2010) South Korea (www) 110
Ibid 111
Alfa Laval (2006-2009) Orders Received

Estimating Market Penetration of Multi-Industrial Companies on a Global Market
42
Korea, as the mojority of Alfa Lavals businesses there are within the marine industry, an industry which was devastated during the crisis.
Figure 9 – BRICK sales
Even though the BRIC countries are often grouped together, they have industrial differences. For Alfa Laval, that means that different product segments sell unequally well on the different markets. Figure 10 shows how the different markets are divided up into the different segments. One can see that the five countries are quite different. Also, that there is a large share of Process Development in Brazil and India, largely due to the significant sales shares of the Process Industry and Food Technology, while China and Korea have a large marine industry. Process Industry was the largest segment for Alfa Laval in terms of sales in 2009, and it can be seen to be well present in all five BRICK countries.
Figure 10 – Sales of Segments per country
0
50
100
150
200
250
300
350
2006 2007 2008 2009
Mill
ion
€ Sales per country
Brazil
Russia
India
China
Korea
0
20
40
60
80
100
120
140
160
180
200
Brazil China India Korea Russia
€M
illio
ns
Sales per Country and Segment PPI Process Industry Total
PLS Process Life Science Total
PFT Food Technology Total
PEE Energy & Environment Total
ESE Sanitary Equipment Total
ERC Refrigeration and Cooling Total
ECF Comfort Total
EOE OEM Equipment Total
EMD Marine & Diesel Equipment - Capital sales Total
EFU Fluids & Utility Equipment Total

Estimating Market Penetration of Multi-Industrial Companies on a Global Market
43
5 Driver Analysis
This chapter describes how proxies are selected to be representative for the different AL segments and used for the PMPT. Sales data, interviews and data availability are considered in the selection process. Out of the segments, the analysis of Fluids & Utility, Refrigeration & Cooling and Process Industry are presented here while the analysis for the remaining segments can be found in appendix A1-A3.
To be able to identify relevant proxies, several things need to be taken into consideration. For Alfa Laval, appropriate proxies will be selected in three steps: 1. Internal Sales Data
Each segment is divided into customer groups/industries, and by analyzing their importance to the segment, driving industries can be identified. Some segments are divided into more than 20 sub-groups and for the ease of presentations, only the 10 most influential groups are presented in this chapter for segments that are made up of more than that.112 Initial screening is done from Alfa Laval’s Global sales figures113 to make the drivers valid for more countries than those studied in this thesis. This is to enable the tool to be applied to additional countries in the future. Additional screening is done based only on sales figures from the BRICK countries, to make sure that the drivers are specifically applicable to these countries, which are of particular interest to Alfa Laval.
2. Interviews
Interviews with the Segment Managers at AL and other key people in the organization will be used to capture additional aspects and drivers than those identified from sales figures.
3. Data availability
To enable the PMPT to be updated with time, and also used on other markets, the data used as industry proxies need to be relatively easy to collect, and also comparable between countries. This is a limiting factor, and the potential drivers and proxies that are identified in the first two steps must be checked for data availability.
112
Alfa Laval (2006-2009) Orders Received 113
Ibid
1 2 3 4 5 6

Estimating Market Penetration of Multi-Industrial Companies on a Global Market
44
5.1 Segment sales analysis
5.1.1 Fluids & Utility
Figure 11 - Fluids & Utility Sales
For Fluids & Utility the largest customer groups are Diesel Engine manufacturers and the general manufacturing industry. The automotive industry is also important in the form of locomotive engines, heavy machines and hydraulics, which have even more importance when looking only on the BRICK Total. Potential industry driver measurements would be general manufacturing, diesel engine manufacturing, mechanical value added and automotive industry turnover. 5.1.2 Refrigeration & Cooling
Figure 12 - Refrigeration & Cooling Sales
EFU Fluids & Utility Equipment Total Sales
Refrig, Commercial
(supermarket)
Refrig, Indust Cooling
HVAC, Cooling other
Refrig, Industrial Process
Refrig, Marine Air Conditioning
Refrigeration absorption
ERC Refrigeration and Cooling Total Sales

Estimating Market Penetration of Multi-Industrial Companies on a Global Market
45
The Refrigeration and Cooling segment is dominated by commercial and industrial cooling followed by HVAC on a global level. For the BRICK countries, the most important industries are the same with industrial and commercial use at the top. Possible driver measurements could be turnaround of general industries, or the number of supermarkets in a region. General construction of buildings could also be used to capture the HVAC industry. 5.1.3 Process Industry
Figure 13 - Process Industry
The Process Industry segment is clearly dominated by the oil and gas refinement, followed by the production of ethanol. Other important industries include the processing of steel and other minerals, pulp and paper processing, chemical processing and different types of mining. For the BRICK, ethanol has greater importance than globally, due to large production in India and Brazil. However, oil and gas is the main industry also for the total of those countries. Possible segment drivers would be the oil and gas industry, general energy consumption or the turnaround of different mineral processing. Ethanol is a possible driver, but due to big differences regionally, it might be a bit selective.
5.2 Interviews
5.2.1 Fluids & Utility
Fundamental global drivers of this segment are the increase in industry capacity and environmental consciousness. The general industrial growth increases general, demand, while the environmental consciousness causes companies to update their equipment for which AL’s products provide a suitable supplier. The specific industries that drive the segment are lighter manufacturing industry, fluid power, electrical power, engines, machine builders and other general industrial applications.
PPI Process Industry Total Sales

Estimating Market Penetration of Multi-Industrial Companies on a Global Market
46
The growth of this segment is also closely correlated to the general economic growth of a country.114 5.2.2 Refrigeration & Cooling
Refrigeration and cooling is largely divided into industrial and commercial applications. The industrial products are sold to a few large contractor customers that in turn serve the majority of the market with cooling machines. These are driven by general industrial activity within food processing and the fact that people want fresher and more diverse food. Commercial demand is driven trough many small customers such as supermarkets, which in turn are largely driven by population growth and the general wealth of the population. The whole segment is also driven by construction activity and experienced a large boom following large construction investments in south East Asia, the Middle East and North America in 2007-2008.115 5.2.3 Process Industry
As this segment is divided into business units with very varying customers and applications, the drivers of this segment are also very diverse. Oil industry is one important driver that has a general correlation to several parts of the segment. Another important industry is the petro chemical industry, with many products within consumer products, cosmetics and all other precuts with a high percentage of plastics. This demand is highly driven by consumer consumption and structural growth and higher standards of living.116
5.3 Data availability
The available database for this thesis was the Economist Intelligence unit Market Indicators and forecast database.117 This is a database of almost 500 series of data available for most countries in the world. Despite this vast amount of data, the exact proxies that would have been preferable according to the segment analysis and the sales manager interviews, were not always available. The final Proxies chosen for each segment are presented in Table 5 - Selected Proxies.
114
Segment Manager, Equipment Fluids and Utility, Interview (2010-03-16) 115
Segment Manager, Equipment Comfort and Refrigeration, Interview (2010-03-02) 116
Segment Manager, Process Development Process Industry, Interview (2010-04-19) 117
Economist Intelligence Unit, Database (2010-03-09)

Estimating Market Penetration of Multi-Industrial Companies on a Global Market
47
Table 5 - Selected Proxies
Segment Proxies Comment
Fluids & Utility
Commercial vehicle
registrations
Petrol Consumption
Motor vehicle and parts –
Market demand
Industrial GDP
The focus on vehicle industry is somewhat misleading for some countries as this is not always a highly influential industry, but as no data on general light industry was available, two proxies from the motor sector were chosen. Industrial GDP and Petrol consumption were chosen as they are good indications on the general industrial activity of a country.
Refrigeration & Cooling
Industrial GDP
Consumer expenditure –
Food, beverages and
tobacco
Retail sales
As no data on construction was available, the proxies chosen focus on the related to food consumption and general wealth of the population, which is a large driver for both commercial and industrial applications.
Process Industry
Energy consumption
Industrial GDP
Petroleum consumption
Consumer expenditure –
Total
As oil is an important driver, energy and petroleum consumption were suitable proxies. Consumer expenditure is important for petrochemical applications and was included as well as the general industrial activity of the company through the GDP. Unfortunately, no data was available on commodity production.

Estimating Market Penetration of Multi-Industrial Companies on a Global Market
48
6 Tool Design and Application
This chapter explains the different components of the PMPT and the calculation associated with the two components: The penetration and the year to year correlation of change. It also introduces the different presentational formats used in the results, to familiarize the reader to the different graphs.
6.1 Penetration
As described in Chapter 1.5, penetration is assumed to be the relation between proxy and sales growth. The selected proxies presented in Table 5 are put in relation to company sales for each segment as described in Figure 14. For each market segment, sales are divided with the proxy value to create a relative market penetration value.
Figure 14- Tool Design
1 2 3 4 5 6

Estimating Market Penetration of Multi-Industrial Companies on a Global Market
49
Table 6 shows a numerical illustration through a fictive example of the calculations for one country and one market. Table 6 - Penetration Example
Country: China 2006
Company X: Sales [$] 1 000 000
pro
xies
Proxy 1 – Steel production [tones] 200 000 Section 1. This Section Presents the Selected Proxies and the respective values
for each year.
Proxy 2 – GDP [m$] 1 000
Sale
s /
Pro
xy Proxy 1 – Steel production [tones] 5 Section 2
This Section shows Sales divided with each Proxy in section 1.
Proxy 2 – GDP [m$] 1000
Dif
f. in
Sale
s/P
roxy
to
Wo
rld
Avg
. as
%
of
Wo
rld
Avg
. Proxy 1 – Steel production [tones] 1,5 Section 3. This section shows the difference
between the values in section 2 and the same value for world
total, expressed as a percentage of the world average.
Proxy 2 – GDP [m$] -0,4
The first grey row shows sales (1000000$) while the following section (Section 1) shows the values for the chosen proxies (Steel production and GDP). Section 2 shows sales divided by proxy value to get a relation between the two. The third section shows the difference between the values in the middle section, and the corresponding values calculated for world total instead of a single country as a fraction of the value for world total. That is:
𝑆𝑎𝑙𝑒𝑠𝐶𝑜𝑢𝑛𝑡𝑟𝑦𝑃𝑟𝑜𝑥𝑦𝐶𝑜𝑢𝑛𝑡𝑟𝑦
−𝑆𝑎𝑙𝑒𝑠𝑊𝑜𝑟𝑙𝑑𝑃𝑟𝑜𝑥𝑦𝑊𝑜𝑟𝑙𝑑
𝑆𝑎𝑙𝑒𝑠𝑊𝑜𝑟𝑙𝑑𝑃𝑟𝑜𝑥𝑦𝑊𝑜𝑟𝑙𝑑
This result is a value relative to a common reference point (world average) that is independent of which proxy unit that was used. It also minimizes effects from extreme events, such as the crisis in 2008 as it can be assumes to have a similar effect on both individual countries and world average. A positive number for this value (for example Steel production in the fictive example in Table 6 at 1,5) indicates that the company is more penetrated than average in this area while a negative number indicates lower penetration than average. Since the denominator is world penetration fraction, and the maximum negative value possible for the numerator is
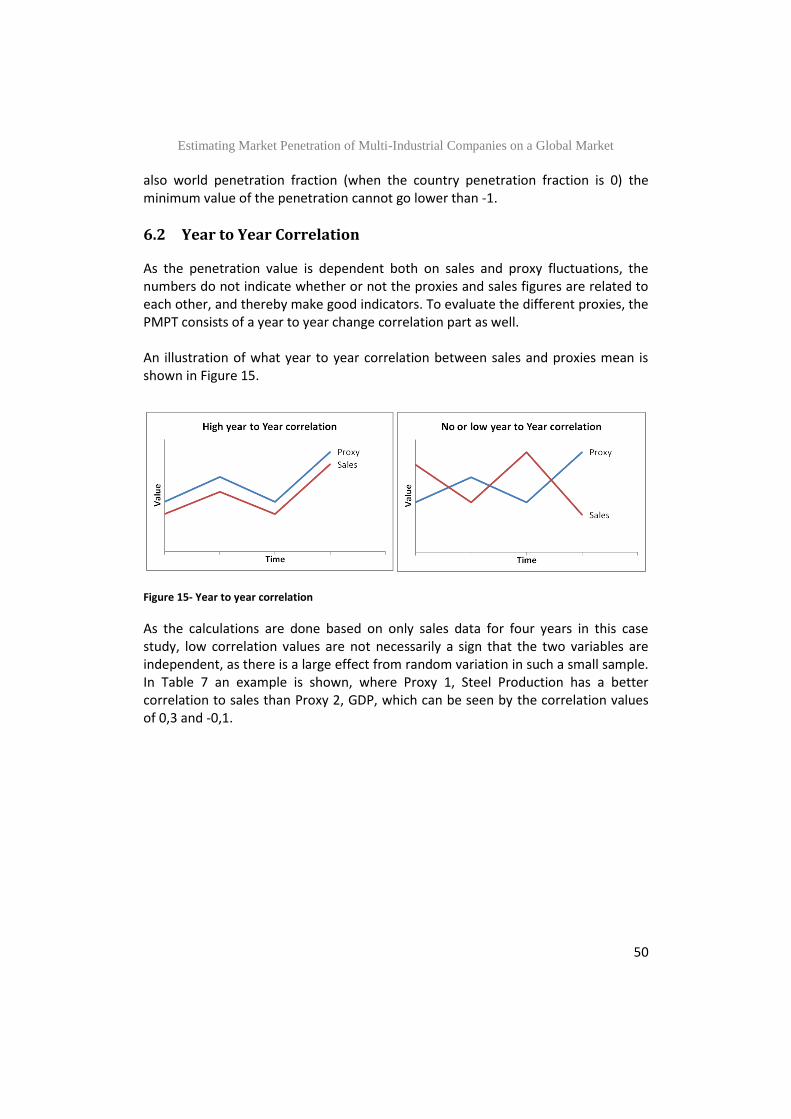
Estimating Market Penetration of Multi-Industrial Companies on a Global Market
50
also world penetration fraction (when the country penetration fraction is 0) the minimum value of the penetration cannot go lower than -1.
6.2 Year to Year Correlation
As the penetration value is dependent both on sales and proxy fluctuations, the numbers do not indicate whether or not the proxies and sales figures are related to each other, and thereby make good indicators. To evaluate the different proxies, the PMPT consists of a year to year change correlation part as well. An illustration of what year to year correlation between sales and proxies mean is shown in Figure 15.
As the calculations are done based on only sales data for four years in this case study, low correlation values are not necessarily a sign that the two variables are independent, as there is a large effect from random variation in such a small sample. In Table 7 an example is shown, where Proxy 1, Steel Production has a better correlation to sales than Proxy 2, GDP, which can be seen by the correlation values of 0,3 and -0,1.
Figure 15- Year to year correlation
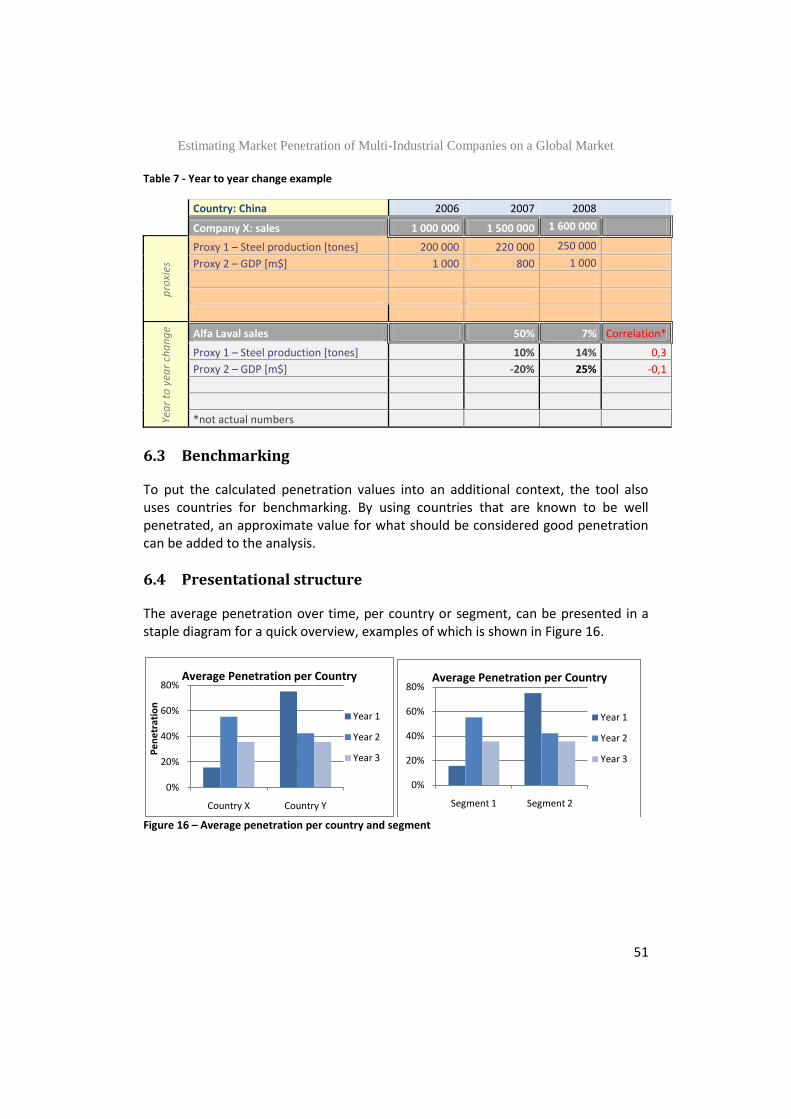
Estimating Market Penetration of Multi-Industrial Companies on a Global Market
51
Table 7 - Year to year change example
6.3 Benchmarking
To put the calculated penetration values into an additional context, the tool also uses countries for benchmarking. By using countries that are known to be well penetrated, an approximate value for what should be considered good penetration can be added to the analysis.
6.4 Presentational structure
The average penetration over time, per country or segment, can be presented in a staple diagram for a quick overview, examples of which is shown in Figure 16.
Figure 16 – Average penetration per country and segment
0%
20%
40%
60%
80%
Country X Country Y
Pe
ne
trat
ion
Average Penetration per Country
Year 1
Year 2
Year 3
0%
20%
40%
60%
80%
Segment 1 Segment 2
Average Penetration per Country
Year 1
Year 2
Year 3
Country: China 2006 2007 2008
Company X: sales 1 000 000 1 500 000 1 600 000
pro
xies
Proxy 1 – Steel production [tones] 200 000 220 000 250 000
Proxy 2 – GDP [m$] 1 000 800 1 000
Yea
r to
yea
r ch
an
ge Alfa Laval sales 50% 7% Correlation*
Proxy 1 – Steel production [tones] 10% 14% 0,3
Proxy 2 – GDP [m$] -20% 25% -0,1
*not actual numbers

Estimating Market Penetration of Multi-Industrial Companies on a Global Market
52
More detailed penetration values are presented in line graphs, one for each country and if applicable, also divided into different market segments. In each graph, the different proxies are shown over a set of years around the world average for each proxy (the x-axis). This means that a value of 50% means that the country is 50% more penetrated than average. In Figure 17 such a graph is shown based on
fictive numbers. It shows penetration estimated against 3 proxies, with a spread of results both towards less and more penetrated than world average depending on the proxy. It also shows a general increase of penetration over the 4 year period.
Year to year change is also graphed over the time period to give an indication on how well the proxies and sales covariate. Figure 18 shows a fictive example where sales and the three proxies are all decreasing with especially proxy 2 showing a high degree of correlation. This graph is similar to the illustrational graphs in Figure 15 with the difference that the change in value from year to year is graphed, rather
than the absolute value of sales and proxies. A value of 10% means that the series has increased 10% since the previous year. To show penetration for several segments at once, overview graphs are used. These graphs are descried briefly in Figure 19 where the interpretations of the four quartiles are presented.
-100%
-50%
0%
50%
100%
150%
2006 2007 2008 2009
Penetration
Proxy 1 Proxy 2 Proxy 3
-40%
-30%
-20%
-10%
0%
10%
20%
2007 2008 2009
Year to year Change
Proxy 1 Proxy 2 Proxy 3 Sales
Figure 17 - Penetration per year
Figure 18 - Year to year change

Estimating Market Penetration of Multi-Industrial Companies on a Global Market
53
A more detailed sample of an overview graph for one country is shown in Figure 20, where several segments are plotted to show their penetration and penetration change since 2007. The Y-axis shows the average penetration for each segment across the different proxies used, while the X-axis shows how the penetration has changed during the last two years in % units. The time span can be changed depending on what time span is used, and on if there is a particular period during which change is particularly interesting. In Figure 20, five different segments of market units are shown, and three of them are labeled Segment A-C. Segment A shows a segment with penetration at about world average level (as it is close to 0% on the y-axis), and a change of penetration from 2007-2009 of over -500% units. This means that two years ago is was 500% units better penetrated along the Y-axis than in 2009. Segment B shows a segment with a penetration of about 200% above world average, which has increase since 2007 (with about 100% units). Segment C, is penetrated below world average, and has had no change since 2007, meaning that is was located on the same level on the x-axis in that year. This graph type is useful to see patterns in penetration levels and penetration change for a large number of segments or market units at the same time. The graph can also be developed, for example by adding the dimension of circle size to indicate sales volumes, or the dimension of circle color to show for example correlation.
Decreasing
Penetration above world average
Increasing
Penetration above world average
Decreasing
Penetration below world average
Increasing
Penetration below world average
X-Axis: Change in penetration
Y-Axis: Penetration relative to world average
Figure 19- Overview graph description

Estimating Market Penetration of Multi-Industrial Companies on a Global Market
54
Figure 20 - Overview graph
Segment C
Segment B
Segment A
-200%
0%
200%
400%
600%
-700% -500% -300% -100% 100% 300% 500%
Ave
rage
Pen
etra
tio
n 2
00
9 r
elat
ive
to
wo
rld
Avg
.
Change 2007-2009 in % units
Country X

Estimating Market Penetration of Multi-Industrial Companies on a Global Market
55
7 Results
This chapter presents the results from the PMPT applied on Alfa Laval. The results discussed in the chapter are predominantly based on the three segments Fluids & Utility, Refrigeration & Cooling and Process Industry, while the other segments are presented in more depth in Appendix B1-B2. All the results in form of graphs are presented in Appendix D1-D3
7.1 Penetration
The overall penetration per segment for 2006-2009 can be seen in Figure 21. This is based on the average penetration of all BRICK countries based on the different proxies to get one value per country and segment. Although there are large variations across the countries that are not shown in the graph, it gives an indication on how the segments compare.
Figure 21 - Penetration per segment
The graph shows that OEM is the least penetrated segment among the BRICK countries, while Food Technology, Life Science and Process Industry are the best penetrated ones. In general the first six, which represent the Equipment Division segments, are less penetrated than the Process development Division segments, which are the last four. Fluids & Utility has increased its penetration significantly in
-100%
-50%
0%
50%
100%
150%
200%
2006
2007
2008
2009
1 2 3 4 5 6
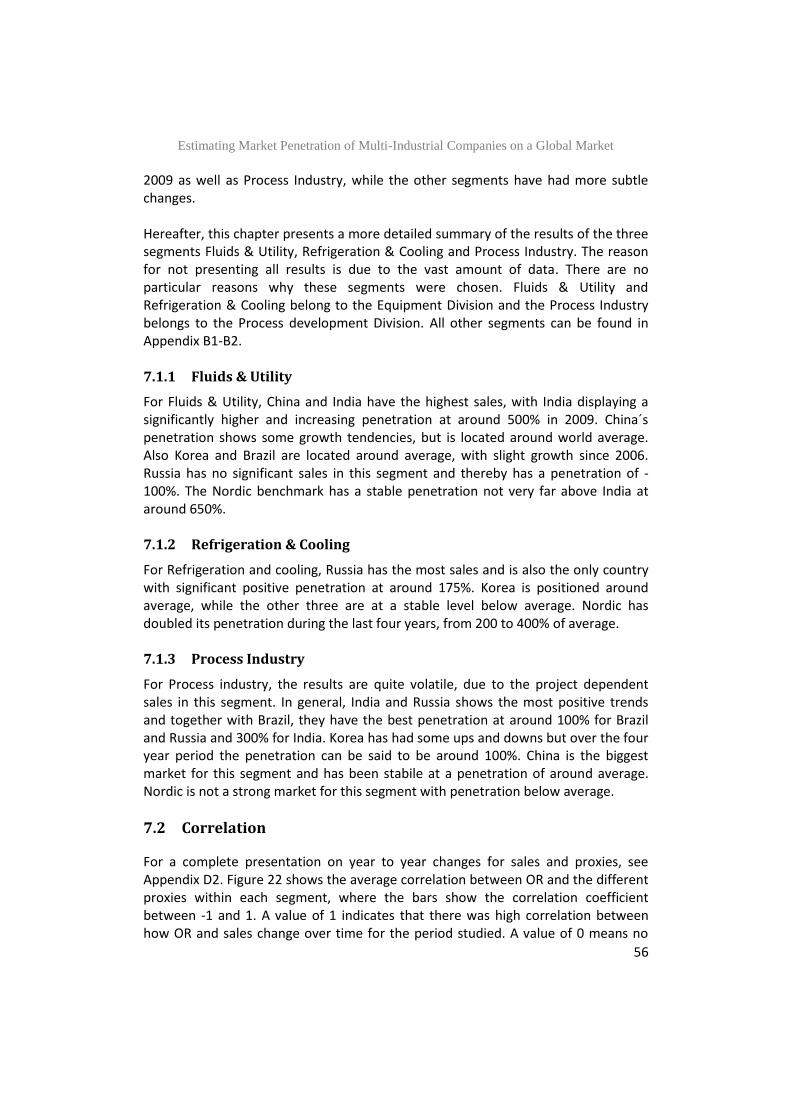
Estimating Market Penetration of Multi-Industrial Companies on a Global Market
56
2009 as well as Process Industry, while the other segments have had more subtle changes. Hereafter, this chapter presents a more detailed summary of the results of the three segments Fluids & Utility, Refrigeration & Cooling and Process Industry. The reason for not presenting all results is due to the vast amount of data. There are no particular reasons why these segments were chosen. Fluids & Utility and Refrigeration & Cooling belong to the Equipment Division and the Process Industry belongs to the Process development Division. All other segments can be found in Appendix B1-B2. 7.1.1 Fluids & Utility
For Fluids & Utility, China and India have the highest sales, with India displaying a significantly higher and increasing penetration at around 500% in 2009. China´s penetration shows some growth tendencies, but is located around world average. Also Korea and Brazil are located around average, with slight growth since 2006. Russia has no significant sales in this segment and thereby has a penetration of -100%. The Nordic benchmark has a stable penetration not very far above India at around 650%. 7.1.2 Refrigeration & Cooling
For Refrigeration and cooling, Russia has the most sales and is also the only country with significant positive penetration at around 175%. Korea is positioned around average, while the other three are at a stable level below average. Nordic has doubled its penetration during the last four years, from 200 to 400% of average. 7.1.3 Process Industry
For Process industry, the results are quite volatile, due to the project dependent sales in this segment. In general, India and Russia shows the most positive trends and together with Brazil, they have the best penetration at around 100% for Brazil and Russia and 300% for India. Korea has had some ups and downs but over the four year period the penetration can be said to be around 100%. China is the biggest market for this segment and has been stabile at a penetration of around average. Nordic is not a strong market for this segment with penetration below average.
7.2 Correlation
For a complete presentation on year to year changes for sales and proxies, see Appendix D2. Figure 22 shows the average correlation between OR and the different proxies within each segment, where the bars show the correlation coefficient between -1 and 1. A value of 1 indicates that there was high correlation between how OR and sales change over time for the period studied. A value of 0 means no

Estimating Market Penetration of Multi-Industrial Companies on a Global Market
57
correlation, and a value of -1 means a strong, but opposite correlation (in this application it is equal to no correlation in practice as proxies are assumed to only show positive or no correlation).
Figure 22 - Correlation per segment
It can be seen that correlations are positive on average, and that correlations are higher for segments within Equipment than for those in the Process Development division. Brazil has the highest average correlation with 0,63 and India the lowest average with 0,16. Among the segments, Marine & Diesel and OEM have the highest correlations with 0,81 and 0,68 respectively while Energy & Environment, Life Science and Process Industry are at the bottom, all scoring below 0,1.
7.3 Country Overview
This chapter refers to the graphs in Appendix D3 and is done on presented in country basis. First, the results for the three segments studied in particular in this report, Fluids & Utility, Refrigeration & Cooling and Process Industry are presented followed by a general description of the other segments. 7.3.1 Brazil overview
In Brazil, Fluids & Utility and Process Industry are penetrated over world average, while Refrigeration & Cooling is below, and none of the three segments has experienced any large growth or decline in penetration since 2007. Looking at all segments in Brazil, Process Industry and Food Technology are the two most penetrated, and like Process Industry, Food Technology is penetrated better than average. Life Science is located far to the left as a result of an almost 600% unit decrease of penetration since 2007, leaving it around average. Fluids & utility and
-1
-0,5
0
0,5
1
1,5 Average Correlation
Brazil
Russia
India
China
Korea

Estimating Market Penetration of Multi-Industrial Companies on a Global Market
58
Energy & Environment are both in the top left quadrant with a penetration slightly over average. Located below average, are OEM, Refrigeration & Cooling and Sanitary. Sanitary, having had a decrease since 2007, was located over average two years ago, while the other two have not experienced much change in penetration in the last two years. 7.3.2 Russia overview
In Russia, Refrigeration & Cooling are both located at around 200% penetration over average, with Process Industry having shown a significant increase in penetration since 2007, which is the one with the largest increase of all the segments in Russia, while Refrigeration & Cooling has declined somewhat. Fluids & Utility is penetrated below average, with no change since 2007. Looking at all segments in Russia, Comfort is the most penetrated even though it has experienced a slight decrease. Food technology is also over average penetration, but has decreased since 2007. Below world average, we have Sanitary, OEM and Marine & Diesel. 7.3.3 India overview
In India, Fluids & Utility is the best penetrated segment, and also the segment that has experienced the most penetration growth since 2007. Also Process Industry has had a substantial increase in penetration, making it the second most penetrated segment in the country. Refrigeration & Cooling on the other hand is penetrated below average with no significant change since 2007. Looking at all segments in India, all segments except OEM and refrigeration & Cooling are in the top right quadrant (Comfort and Marine & Diesel have to little sales to be included in the graph), which makes it the best penetrated country of the BRICK’s. 7.3.4 China overview
In China, Fluids & Utility and Process Industry are penetrated at around world average, and Refrigeration and Cooling just below. None of the three has experienced much change in penetration since 2007. Looking at all segments in China, Marine & Diesel is the most penetrated segment at 250% above world average. The second most penetration is Life Science, at about 180%, and neither of these two has experienced any particular change in penetration since 2007. On the whole, there has been little change in penetration on the Chinese market compared to the other countries and most segments are
Estimating Market Penetration of Multi-Industrial Companies on a Global Market
59
clustered in the middle of the graph. Energy & Environment is the segment with the most positive penetration increase, with a bit over 100% units over 2 years. 7.3.5 Korea overview
In Korea, Process Industry is the second most penetrated segment at about 150% above average which is an increase from around average penetration in 2007. Fluids & Utility and Refrigeration & Cooling are the third and fourth most penetrated segments, both with a slight increase from 2007. Looking at all segments in Korea, Life Science protrudes as the most penetrated segment, also with the largest increase over the last two years. Marine & Diesel had the most significant fall in penetration from 2007 with over 500%, but the segment is penetrated above average despite the fall. The rest of the segments are located at or below average penetration, which little or no change since 2007, with the exception of Energy & Environment which has had a significant decrease in penetration.
7.4 Future Outlook
The Future outlook for Fluids & Utility, Refrigeration & Cooling and Process Industry are presented here, while the other segments are presented in Appendix C1. 7.4.1 Fluids & Utility Equipment
This segment is mainly selling to light production, and as living standard increase, so does business. A new coming driver is the environmental awareness that can cause companies to want a greener image. This can boost sales of equipment for reusing fluids in production for example, which today is not usually done. Also the increasing demand of electrical power will probably have a positive effect on Fluids and Utility, foremost in the construction of transformers. For AL, the challenge is to choose the right affairs among all the opportunities, and being the second to smallest segment, it does not always get too much attention.118 Overall, the BRICK countries have increased their shares of the sales in this segment from 2006 onwards, not least during the financial turbulence in 2008.119 Brazil In Brazil, technical knowledge of products and applications is high, but limited sales resources limit sales. The structural growth in the country will yield increasing opportunities in the future, however, increasing competition and the high import
118
Segment Manager, Equipment Fluids and Utility, Interview (2010-03-16) 119
Alfa Laval, Orders Received (2006-2009)
Estimating Market Penetration of Multi-Industrial Companies on a Global Market
60
taxes increases demand to produce everything locally.120 A potential threat is if mayor competitors will start to locally produce in a larger extent than AL.121 Russia AL was in Russia early and has a very strong brand name. However, business for Fluids and Utility in Russia is small, and there is considerable difficulty to find customers; almost everything is imported.122 Hopefully, the import dependency in Russia could lessen, as the government is attempting to stimulate local industries by introducing favorable legislation (such as making it cheaper to export a refined product than raw material), but as for now, the Russian infrastructure seems to be too weak to support any major industrial growth.123 India India is a large market where AL has a good presence with some local production and a leading brand name. Producing locally is very important on this market as import tariffs are very high, and a weakness for AL is that they do not produce everything there. Competitors GEA and Tranter are producing more heat exchangers in India, which could be a serious threat.124 China In China, there is more business than AL can serve, and it is important to focus on the right deals. AL´s strength is their product knowledge and commitment. Presence is however an area of improvement, and AL could probably develop new ways to reach the market to gain market share. For the future in this segment, as in many others in China, AL will face threats from competitors lower down in the price range, and have to decide how to position themselves for this, for example through the new product series at a lower price.125 Korea Korea is a good market for Fluids and Utility, but there are not enough resources to pursue all opportunities. AL has a strong brand and is recognized for their quality, but the presence is inadequate and the main limiting factor to increased sales. Local competition is strong in Korea, and local suppliers are usually favored over foreign. To grow, one opportunity would be for AL to use an adapted version of the products like in China to satisfy a larger share of the market.126
120
President, Alfa Laval Brazil, Interview (2010-03-25) 121
Segment Manager, Equipment Fluids and Utility, Interview (2010-03-16) 122
Segment Manager, Equipment Fluids and Utility, Interview (2010-03-16) 123
Employee at Swedbank in Moscow, Interview (2010-03-24) 124
Segment Manager, Equipment Fluids and Utility, Interview (2010-03-16) 125
Ibid 126
Ibid

Estimating Market Penetration of Multi-Industrial Companies on a Global Market
61
7.4.2 Refrigeration and Cooling
The market is largely driven by economic welfare and more specifically by the demand for fresher and more varied food. The BRICK markets were hit by the crisis but have started to recover and both commercial and industrial refrigeration are expected to grow, although with more dense competition and suffering margins.127 Brazil Alfa Laval has a strong presence and recognition on this market, but still lacks production of air heat exchangers to be fully competitive. Due to historical focus on oil and gas, there is also some shortage in the distribution network for these products which can be a considerable weakness as the food industry in Brazil is expected to grow extensively.128 Given that Brazil will break out of the economic downturn, this segment is full of potential.129 130 Russia Out of the BRICK countries, Russia has the largest share of refrigeration and cooling sales, mainly within commercial applications, and although the market has shrunk during the crisis AL has managed to increase their market shares.131 AL has a strong brand and good local presence on this market, but still lacks local production of some products.132 A general threat is the infrastructure and economical development in Russia, which makes distribution difficult and also greatly limits the industrial growth in the country.133 On the other hand, the government is pushing for more environmental solutions to the refrigeration technology, which is an opportunity for AL to strengthen business.134 India The local setup in India is strong, and the brand is good which is a strength, especially as this market has a tremendous potential for the future as the population grows and the living conditions improve. On the downside, is a somewhat slow management of the local production which can leave AL lagging behind faster competitors.135
127
Segment Manager, Equipment Comfort and Refrigeration, Interview (2010-03-02) 128
Ibid 129
President, Alfa Laval Brazil, Interview (2010-03-25) 130
Segment Manager, Equipment Comfort and Refrigeration, Interview (2010-03-02) 131
Market Unit Manager, Industrial Equipment, Moscow Office, Interview (2010-03-25) 132
Segment Manager, Equipment Comfort and Refrigeration, Interview (2010-03-02) 133
Market Unit Manager, Industrial Equipment, Moscow Office, Interview (2010-03-25) 134
Segment Manager, Equipment Comfort and Refrigeration, Interview (2010-03-02) 135
Ibid
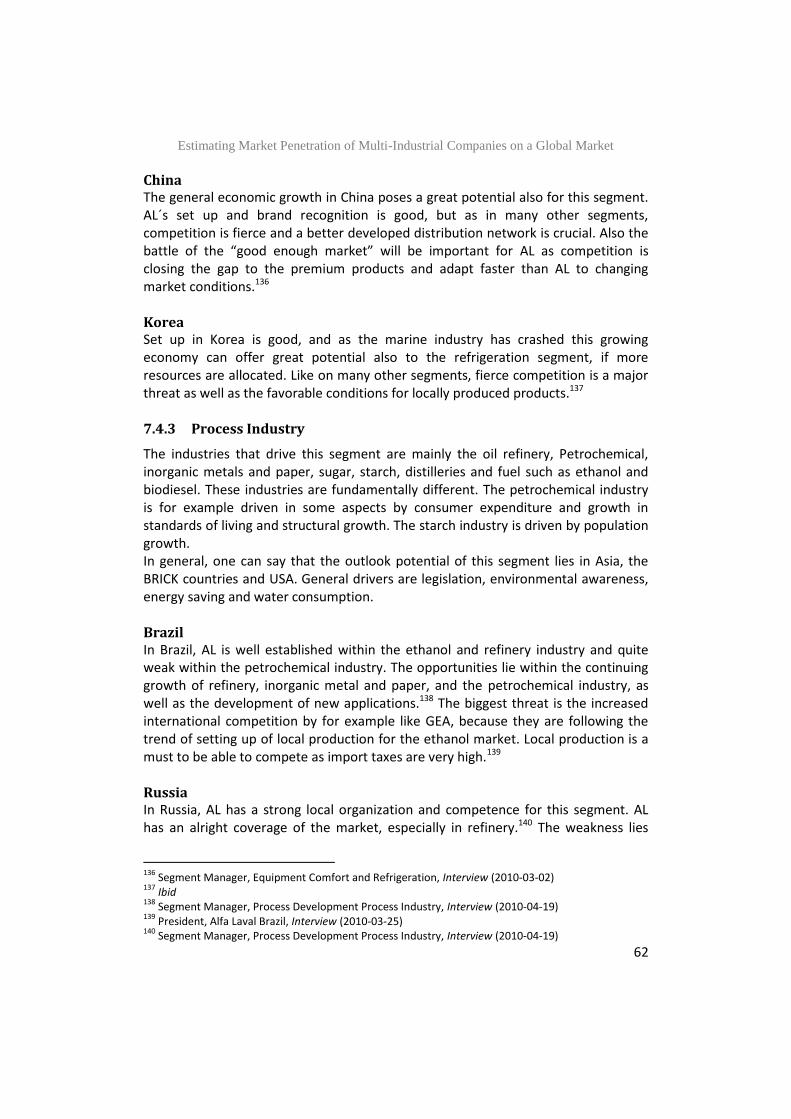
Estimating Market Penetration of Multi-Industrial Companies on a Global Market
62
China The general economic growth in China poses a great potential also for this segment. AL´s set up and brand recognition is good, but as in many other segments, competition is fierce and a better developed distribution network is crucial. Also the battle of the “good enough market” will be important for AL as competition is closing the gap to the premium products and adapt faster than AL to changing market conditions.136 Korea Set up in Korea is good, and as the marine industry has crashed this growing economy can offer great potential also to the refrigeration segment, if more resources are allocated. Like on many other segments, fierce competition is a major threat as well as the favorable conditions for locally produced products.137 7.4.3 Process Industry
The industries that drive this segment are mainly the oil refinery, Petrochemical, inorganic metals and paper, sugar, starch, distilleries and fuel such as ethanol and biodiesel. These industries are fundamentally different. The petrochemical industry is for example driven in some aspects by consumer expenditure and growth in standards of living and structural growth. The starch industry is driven by population growth. In general, one can say that the outlook potential of this segment lies in Asia, the BRICK countries and USA. General drivers are legislation, environmental awareness, energy saving and water consumption. Brazil In Brazil, AL is well established within the ethanol and refinery industry and quite weak within the petrochemical industry. The opportunities lie within the continuing growth of refinery, inorganic metal and paper, and the petrochemical industry, as well as the development of new applications.138 The biggest threat is the increased international competition by for example like GEA, because they are following the trend of setting up of local production for the ethanol market. Local production is a must to be able to compete as import taxes are very high.139 Russia In Russia, AL has a strong local organization and competence for this segment. AL has an alright coverage of the market, especially in refinery.140 The weakness lies
136
Segment Manager, Equipment Comfort and Refrigeration, Interview (2010-03-02) 137
Ibid 138
Segment Manager, Process Development Process Industry, Interview (2010-04-19) 139
President, Alfa Laval Brazil, Interview (2010-03-25) 140
Segment Manager, Process Development Process Industry, Interview (2010-04-19)

Estimating Market Penetration of Multi-Industrial Companies on a Global Market
63
within not focusing on all opportunities, there are other applications which can grow apart from refinery. However, a big potential lies within the need to reconstruct old soviet refineries141 as the customers have to change the equipment.142 The increased presence of international competitors like GEA is definitely a threat to AL.143 India AL has a strong presence in India but the competence for new applications however is not so strong. The potential for AL lies within the refinery industry. Import duties are high and looking at the landed cost is extremely important. AL cannot compete on large heat exchangers due to this reason and because of low margins on the market. Therefore, AL sells more engineered projects in India, which have a bigger scope and covers non-core products which in general has lower margins. AL needs to produce locally in order to be able to compete in India. Competition is becoming more intense from local competitors as well as international competitors whom are increasing their production capacity.144 China AL has a historically long presence in China and competence in established applications. For new applications however, presence and competence is weaker. The market potential lies within refinery, petrochemicals and the growing focus on energy savings. The market for inorganic mining, pulp and paper is big in China and the sales force for this market could be bigger and should be in order to compete with local competitors.145 In general for the segment, local competition is becoming stronger although no one is established market leader. The challenge is be able to act fast in order to grab this position.146 Legislation such as the prohibition of producing bio-fuel of raw material that is considered as food is an obstacle that threatens the growth of the biochemical and ethanol markets.147 Korea AL has historically good relations to major EPCs (engineering companies) but has a stronger position towards the export market in Korea. The relations are weaker today than they have been and sales to the local market are low. This is definitely where opportunities lie for AL as well as keep up with the export market. Competition from other international companies such as Hesaca and APV are a major threat. 148
141
Segment Manager, Process Development Process Industry, Interview (2010-04-19) 142
Business Development Manager, Refinery & Petrochemicals, Moscow Office, Interview (2010-03-25) 143
Segment Manager, Process Development Process Industry, Interview (2010-04-19) 144
Ibid 145
General Manager, Inorganic materials, Metal & Paper, Shanghai Office, Interview (2010-03-10) 146
Segment Manager, Process Development Process Industry, Interview (2010-04-19) 147
Ibid 148
Ibid
Estimating Market Penetration of Multi-Industrial Companies on a Global Market
64
8 Case Discussion and Conclusions
In this chapter, the results for the three segments Fluids & Utility, Refrigeration & Cooling and Process Industry are discussed and concluded. The remaining segments are discussed in appendix C2. Also the accuracy of the results and the specific considerations for the tool used for AL are discussed in this chapter.
8.1 Discussion of results
With the help of the penetration results, Alfa Laval can get some indication as to which segments and countries are penetrated below average. The PMPT does however not say anything about which markets have high potential for improved penetration. A particular segment can be penetrated below average both as a consequence of bad penetration efforts, but also because it is a segment with a very low absolute potential. In combination with the interviews with the different segment and country managers and their input on where there might be most potential, as well as the country information presented in the PESTEL chapter, the tool can be a valuable additional base to strategic decisions. 8.1.1 Fluids & Utility
Russia is the country with the lowest penetration within Fluids & Utility, which is a likely result of the underpenetrated domestic industrial activity in the country. The initiated governmental stimulus of local production could have a positive impact for this segment, but until then there does not seem to be too much unrealized potential. Brazil, China and Korea are all around the world average of penetration having increased from under-penetration with potential for additional improvements. In Brazil, the high tax barriers that protect the local industry can be a potential opportunity as it ensures that lighter industries do not move abroad given that AL themselves can establish sufficient local production. In China, the possibilities are infinite, and the seemingly stagnating penetration could indicate that AL is not optimizing their business. In Korea, there is also room for increased penetration as there are many customers that AL is not targeting. The country is highly industrialized, and increased efforts here could probably pay off. In India, AL is doing well and penetration has increased over the last four years compared to average and if the domestic production strengthens, this should continue. Importing products to India is expensive as the taxes are high, and this quickly cannibalizes the margins.
1 2 3 4 5 6
Estimating Market Penetration of Multi-Industrial Companies on a Global Market
65
8.1.2 Refrigeration & Cooling
Brazil, India and China are all underpenetrated, but they all have great potential for improvement. The food industry in Brazil and India is expected to grow both as a consequence of improving living standards and the increasing populations. This will increase demand for AL refrigeration products that serve supermarkets and retailers as well as industrial food processing companies. China is also is experiencing tremendous growth potential as people are becoming richer demand for everything from fresh food to air conditioning is escalating. Korea is a little more penetrated, but also here there is potential for improvement following structural growth of the country and increasing demand for food. Russia, being the most penetrated market of the set, is not an area of considerable penetration growth potential as the historical presence has been high, and there is no population growth. 8.1.3 Process Industry
In China and Russia, Process Industry is penetrated around average. For China, this has been the case since 2006 with a small decrease in 2009, while there for Russia has been a slight increase in 2009. On both countries, there is potential for increased sales and improved penetration. In China, the growth of the general industrial activity as well as increased demand for consumer products and other plastics are the source, while Russia’s oil industry should harbor opportunity. The potential in Russia is however, dependent on how the economical development of the country will be and whether or not the government will succeed in its efforts to boost national production. India and Brazil are both better penetrated that average, and especially India is doing well. Brazil has had a slight decrease in 2009 but it might be the effect of a bad year as Process Industry in Brazil is largely dependent on few large projects. The penetration in Korea had a dip in 2007 but has come back to over average level since then. There could be some increased potential in this Korea, especially on the local market.
8.2 Discussion of accuracy
The observations in Chapter 8.1 are based on the assumption that the tool itself is accurate. There are however, some concerns that compromise the accuracy of the results, discussed below. 8.2.1 Sales Data availability
Sales data for the different segments are only available for 2006-2009. This is a rather short time span to use for any deep deductions on how the company is growing on this market, not least due to the crisis affecting the sales greatly in 2008.

Estimating Market Penetration of Multi-Industrial Companies on a Global Market
66
8.2.2 Segment structure
Some of the segments are grouped independently of the market characteristics. For example, Marine and Diesel do not necessarily have the same industry drivers, nor Energy and Environmental applications or the different market units within Process Industry. This makes it more difficult to identify suitable proxies, and also lowers the accuracy of the proxies used. To work around this problem, the authors tried to isolate Petroleum and Refinery applications from the Process Industry segment, and only use these sales figures in correlation to the proxies. The result of this was inconclusive, as there was still low or no correlation between sales and proxies the two for most countries. 8.2.3 Project dependent sales
As discussed in chapter 7.2, segments within Process development have lower correlation than those in Equipment division. One reason for this is the fact that for Process Development, much of the sales are done in the form of large projects. For some years and markets, one project can make up the vast majority of the sales which makes fluctuations more dependent on luck of individual deals rather than economic development of the market. One way to get around this can be to look only at base sales, which are sales from continuous business rather than from very large one-time business. Used for Alfa Laval, this resulted in significantly improved correlation for the Process Industry segment, where projects pay a mayor role, but there was no significant improvement for the other segments. Average correlations for the two data types are shown in Table 8. Table 8 - Correlation per sales type
Segment Avg. Correlation 2006-2009 All sales
Avg. Correlation 2006-2009 Base sales
Difference
Comfort 0,496 0,377 -0,120
Fluids & Utility 0,525 0,574 0,049
Marine & Diesel 0,812 0,747 -0,065
OEM Equipment 0,682 0,519 -0,163
Refigeration & Cooling 0,446 0,474 0,029
Sanitary 0,247 0,278 0,032
Energy & Environment 0,052 0,119 0,067
Food Technology 0,215 -0,063 -0,277
Life science 0,076 -0,004 -0,079
Process Industry -0,083 0,694 0,778

Estimating Market Penetration of Multi-Industrial Companies on a Global Market
67
As there is no unequivocal result from this change in data base, both methods seem equally suitable, but it could be argued that base sales should correlate better with the general macro-economic development of a market and thereby be a better indication on how well a certain market is penetrated over time. The results from base sales also show less change over a two year period, suggesting that these results are less volatile. What more is interesting is that all BRICK’s had lower penetrations compared to average when using only base sales, shown in Figure 23 a possible indication that these countries are in general more dependent on project sales than other countries.
Figure 23 - Penetration per sales type
8.2.4 Quality of proxy data
Macro-economic data presented in the same way for several countries as well as for world total is not always easy to find. Therefore, some proxies that would have been preferred could not be used since they were not available or incomplete. The fact that this case was applied on countries where macro-economic data is especially difficult to find, and has not been collected as meticulously over the years as in many European countries, makes this difficulty more severe. Many of the figures used are estimates made by the intelligence company that collected them, and error margins are not displayed. 8.2.5 Benchmarks
In this case, the initial idea was to use Nordic as a Benchmark for the other countries, to get an approximate indication on what could be considered very good penetration for each segment. This was based on the fact that Nordic is considered to be Alfa Laval’s best penetrated market looking at the total sales. Although this holds true according to this report for most segments as can be seen in appendix D1, there are two segments where Nordic scores lower than the other countries, Food Technology and Process Industry. This is confirmed by the manager for these
0%
50%
100%
150%
200%
250%
Brazil Russia India China Korea
Comparison of Average Penetration level per sales type
All Sales
Base Sales
Estimating Market Penetration of Multi-Industrial Companies on a Global Market
68
countries, as they have never been strong segments on the Nordic market. Other markets were tested as benchmarks, such as Germany for Process Industry, and Spain for Food Technology, but also they score lower than most BRICS. Using only base sales made Spain and Germany reach higher penetration. Given these shortcomings, there is some development that can be done to the tool if it was to be used in the future, which are further discussed in Chapter 9.1.3.
8.3 Conclusions
This tool has identified markets on which AL is more and less penetrated and has also shown approximate developments of the penetration levels over the last four years. In combination with the interviews conducted within each segment, the numerical results can be used to point out market areas that could have potential for increased penetration for AL. Year to year changes for AL sales and proxies give an indication as to whether they tend to covariate over the time period studied, and they were found to correlate better for the segments within the equipment division than for the Process Development division. In general the results are reasonable, but there are some concerns about the accuracy due to limitations in the method when applied at AL. There are two concerns regarding the data used as input, one regarding the limited number of years for which sales data is available and the other, and more influential one, concerns the availability of suitable proxies for the different segments. There are also two factors related with the internal structure of AL that through the sales data layout affects the results. Firstly, the segments are groups of business units that are not necessarily driven by the same macro economic factors. Secondly, using general sales includes both base sales and sales connected to large specific projects. When comparing the results only using base sales, it showed that the BRICK’s would have lower penetration on average if only base sales were used. Additionally, the use of a benchmark country had only limited applicability as the Nordics are not the most penetrated country on all markets. Two other countries were tried with similar results. The benchmark results for the rest of the segments are however useful as a comparison. Considering both the strengths and weaknesses of this analysis at AL, the tool seems to be a useful additional input for strategic decision making for the management. It also allows the user to get a quick overview of several countries on a comparable scale which is valuable for a multinational company. It should however not be used as a sole base for conclusions about how AL is doing on different markets as there are significant uncertainties and as differences between the economic environments of the different countries is not taken into consideration.

Estimating Market Penetration of Multi-Industrial Companies on a Global Market
69
9 General Discussion and Conclusions
In this chapter the PMPT is analysed and evaluated from a general point of view including a discussion of the shortcomings and suggestions on further development of the tool. Finally, the general conclusions of the tool are made and presented.
9.1 Discussion
With the discussion from the Case Study perspective in mind, a general discussion of the tool can be done in order to evaluate its usefulness and shortcomings. 9.1.1 Case study dependency
As discussed in chapter 2, there are limitations to the general applicability of the findings from one case study to other cases. The results in this report are based on the company of Alfa Laval and the extent to which this allows for general conclusions cannot be fully accounted for. Still, some considerations for the tool, presented below, have been identified to be of value to other companies that wish to use this method. 9.1.2 Tool Considerations
Company sales data availability In order to get a valid historical trend of market penetration, sales data series ten years or longer would be advantageous. The correlation accuracy of the sales data versus the proxies would also increase from longer time-series. Company Structure The structure of the tool depends very much on the company structure. What is important to consider is that the grouping of sales should be related to drivers which can be represented by relatively the same set of proxies. For example, a company can chose to group sales by product groups or by sales channels. Format of sales data A central aspect to consider is what type of sales figures to use. Companies may sell base products or have different categories of project sales based on size or time span. It is important to be aware that the correlation may differ between the proxies and different types of sales figures and one aim should be to use the set of sales which has the best correlation with the proxies.
1 2 3 4 5 6

Estimating Market Penetration of Multi-Industrial Companies on a Global Market
70
Quality of macro-economical data
The selected PMPT proxies should be collected from reliable sources and needs to be available to the company over time. Even trusted sources as the World Bank have certain inaccuracies that the company needs to be aware of. As mentioned before, these should preferably exist from at least ten years back, as they can then be correlated to the sales data. As the PMPT can be used for several countries, it is vital that complete data series are available for all countries studied. Benchmarks A useful extension of the PMPT is to apply it to one or more markets where the company knows that the market penetration is high as a benchmark. This way, the markets of interest can be compared to the best-in-class market from which considerable conclusions can be made. 9.1.3 Further development of the PMPT
Following the tool considerations, there are ways to further developing the tool. The area with most potential of improvement is the proxy selection. By extending the sales data series and availability of different proxies, further statistical analysis could be used to formally investigate how well different proxies covariate with the company sales. This would allow for more exact selection of proxies for different segments or business units. Given more time, sales proxies could also be more precisely connected to different formats of sales. For example, a company with base sales and project sales can choose to have different proxies associated with each sales type. A further variation of the tool could be to allow proxies to vary between countries. It would diminish the possibility to compare countries against each other, but would on the other hand allow for adaptation of the tool according to the unique conditions in each country. For a company that develops detailed sales forecasts for their different markets, the tool could also be developed to show penetration prediction. This requires that the macro-economical data is available as forecasts for the same time period, and although these predictions would be subjects to higher uncertainty, it could give a useful indication to managers about the development of their markets. 9.1.4 Future research
As discussed in chapter 3, no vast research has been done on different ways of measuring market penetration. Extending this study to other companies and markets would add to this field of market intelligence and to the development of the PMPT. Other studies on the field of market penetration would also be valuable,

Estimating Market Penetration of Multi-Industrial Companies on a Global Market
71
where other approaches of measuring market potential, such as originating from a bottom-up approach, could be used as a base in measuring penetration.
9.1.5 Theoretical Contribution
Market penetration is a useful measurement for management to use when taking strategic decisions regarding a company’s growth. For companies that are acting on several countries and within many different industries, this can be a very hard and time-consuming thing to measure, and very little has been written on the subject. This thesis has developed a Market Penetration Tool that indicates the market penetration of a company on different markets with the use of sales and macro-economical proxies. Based in the analysis of a case company, the PMPT can be used as a platform for additional studies on other companies and be the start of a refinement process for a practical new way of using economic indicators to measure market penetration.
9.2 Conclusions
The general conclusion of this study is that it is possible for a company that acts on a set of markets across a wide range of industries and countries to get an indication of its market penetration using the PMPT. However, it is only an indication and generalization of reality. The purpose of the study was examine the possibilities to measure market penetration across different countries and industries and in expense of obtaining this very general picture of how well a company is penetrated on extremely different markets, it has shortcomings. The main potential in developing the tool is improving the selection of proxies by using correlation and extending the access to different macro-economic data. Expanding the study to other companies and markets would also add to the accuracy of the tool and its general applicability. Regardless of the future potential development possibilities of the tool and its present shortcomings, the indications of market penetration is of use to a company manger as a complement to other information available for strategic decisions concerning the growth potential of the company. .

Estimating Market Penetration of Multi-Industrial Companies on a Global Market
72
10 Bibliography
10.1 Interviews
10.1.1 Alfa Laval Employees
Segment & Market Unit Mangers Segment Manager, Equipment Comfort and Refrigeration (2010-03-02) Segment Manager, Equipment Fluids and Utility (2010-03-16) Segment Manager, Equipment Marine and Diesel (2010-02-01) Segment Manager, Equipment Original Equipment Manufacturer (2010-05-06) Segment Manager, Process Development Energy and Environment (2010-03-19) Segment Manager, Process Development Food Technology (2010-03-18) Segment Manager, Process Development Life Science (2010-03-31) Segment Manager, Process Development Process Industry (2010-04-19) Market Unit Manager, Marine (2010-03-04) Country Presidents President, Alfa Laval Brazil (2010-03-25) President, Alfa Laval China (2010-03-10) President, Alfa Laval Korea (2010-02-01) President, Alfa Laval Russia (2010-03-25) Shanghai Office Managers General Manager, Life Science, Shanghai Office (2010-03-10) General Manager, Inorganic materials, Metal & Paper, Shanghai Office (2010-03-10) Marketing Unit Manager, Power, Shanghai Office (2010-03-09) Sales Manager, Fluids & Utility, Shanghai Office (2010-03-09) Vice President, Marine & Diesel, Shanghai Office (2010-03-10) Vice President, Marketing & Business Development, Shanghai Office (2010-03-10) Moscow Office Managers Business Development Manager, Metal & Paper, Moscow Office (2010-03-25) Business Development Manager, Refinery & Petrochemicals, Moscow Office (2010-03-25) Division Manager, Energy & Environment, Moscow Office (2010-03-25) Division Manager, Food & Pharma, Moscow Office (2010-03-25) Market Unit Manager, Industrial Equipment, Moscow Office (2010-03-25) Tumba Office Managers Sales Manager, Equipment Parts and Services, Tumba Office (2010-02-01)

Estimating Market Penetration of Multi-Industrial Companies on a Global Market
73
10.1.2 Other
Employee at Swedbank in Moscow (2010-03-24) Employee at Swedbank in Shanghai (2010-03-11) Employee at Nordea in Shanghai (2010-03-11)
10.2 Email Correspondences
Segment Manager, Sanitary Equipment (2010-05-09) 10.2.1 Alfa Laval Employees
President, Alfa Laval India (2010-02-25 – 2010-05-09)
10.2.2 Other
Hägglund, F., Trade Commissioner at the Swedish Trade Council and Swedish Embassy Counselor in Moscow, Russia (2010-03-05 – 2010-05-03)
Pannell, N., Vice President at Booz & Company, London, UK (2010-05-06)
10.3 Literature
Bryman. A. & Bell, E. (2005), “Företagsekonomiska forskningsmetoder”, First Edition, Authors & Liber AB, Ljubljana, Slovenia Chandler, A. (1966), “Strategy and Structure: Chapters in the history of Industrial enterprise”, First Edition, Anchor Books, New York, USA Day, G. S. (1984), “Strategic Market Planning – The Pursuit of Competitive Advantage”, Second Edition, West Publishing Co., St Paul, Minnesota, USA Grant, R. M. (2008), “Contemporary Strategy Analysis”, Sixth Edition, Blackwell Publishing Ltd, Oxford, UK Hassmén, P. & Koivula, N. (1996), ”Variansanalys”, First Edition, Studentlitteratur, Lund, Sweden Hägg, I. & Wiederstheim-Paul, F. (1984), ”Att arbeta med modeller inom företagsekonomin”, Fifth Edition, LiberTryck, Stockholm, Sweden Johnson, G., Scholes, K. & Whittington, R. (2008), ”Exploring Corporate Strategy” 8th Edition, Pearson Education Limited, Harlow, UK
Estimating Market Penetration of Multi-Industrial Companies on a Global Market
74
Körner, S. & Wahlgren, L. (1993), ”Praktisk Statistik”, Studentlitteratur, Lund, Sweden Patel, R. & Davidson, B. (1994), ”Forskningsmetodikens grunder”, Second Edition, Studentlitteratur, Lund, Sweden Yin, R. K. (2002), “Case study Research – Design and methods”, Third Edition, Sage Publications Inc, California, USA
10.4 Articles
BBC Russian, (2008-01-04) “В Сибири и Якутии ждут подачи тепла” (Translation: “Siberia and Jakutia are waiting for provision of heat”), BBC URL: http://news.bbc.co.uk/hi/russian/russia/newsid_7172000/7172153.stm (2010-05-06) BBC Russian, (2006-01-17)”Россия мерзнет и ждет отключений света и тепла” (Translation:”Russia is freezing and is waiting for light and heating to be switched off”), BBC URL: http://news.bbc.co.uk/hi/russian/russia/newsid_4621000/4621286.stm (2010-05-06) Beattie, A. (2010), “Changing faces of power: Stars shine bright but fail to transform the world, Financial Times URL: http://www.ft.com/cms/s/0/67bfefd8-03d1-11df-a601-00144feabdc0.html?nclick_check=1 (2010-05-06) Beverland, M. & Lindgreen, A. (2009), “What makes a good case study?” – A positivist review of qualitative case research, School of Management, University of Bath & Hull University Business School, Elsevier Inc, United Kingdom Cavusgil, S. T. (1997), “Measuring the potential of emerging markets: An indexing approach”, Business Horizons, Vol. 40, No. 1. JAI. Chi, T. & Nystrom, P. (1998), “An Economic Analysis of Matrix Structure, Using Multinational Corporations as an Illustration”, Managerial and Decision Economics, Vol 19, No. 3, John Wiley & Sons URL: http://www.jstor.org/stable/3108192 (2010-05-03) Eisenhardt, K. (1989), “Building theory from case study research”, The Academy of Management Review, Vol 14, No 4, The Academy of Management URL: http://www.jstor.org/stable/258557 (2010-02-25)

Estimating Market Penetration of Multi-Industrial Companies on a Global Market
75
Ellström, L. & Fällman, F. & Lodén, T.(2005), ”Kina förändrar världen”, Svenska Dagbladet, (reviewed 2007-03-21) URL: http://www.svd.se/opinion/brannpunkt/kina-forandrar-varlden_405881.svd (2010-05-06) Frigo, M. L. (2008), “Return Driven – Lessons from high-performance companies”, Cover Story, Strategic Finance Magazine, Institute of Management Accountants Gabarain, C. (2010), “World Bank opens largest set of development data - for free and in several languages” URL: http://blogs.worldbank.org/eastasiapacific/node/2892 (2010-04-25) Kowitt, B. (2009), “For Mr. BRIC, nations meeting is a milestone”, Fortune Magazine, CNN URL: http://money.cnn.com/2009/06/17/news/economy/goldman_sachs_jim_oneill_interview.fortune/index.htm (2010-05-06) Markovic, A. (2008), Ekonomisk rapport för Brazilien, Swedish Embassy, Brasilia. Mintzberg, H. (1979), “Patterns in Strategy Formation”, Int. Studies of Mgt. & Org., Vol 4, No. 3, M. E. Sharp, Inc. Tefler, K. R. (1962), “How to Measure Sales against Market Potential in the Construction Industry”, The Journal of Marketing, Vol. 26, No.1 , American Marketing Association URL: http://www.jstor.org/stable/1249629 (2010-02-17) The Economist special reports (2010a), “A different game – A special report on managing information”, The Economist URL: http://www.economist.com/specialreports/displaystory.cfm?story_id=15557465 (2010-05-04) The Economist special reports (2010b), “Data, data everywhere – A special report on managing information”, The Economist URL: http://www.economist.com/specialreports/displaystory.cfm?story_id=15557443 (2010-05-04) Yin, R. K. (1981), “The Case Study Crisis: Some Answers”, Administrative Science Quarterly, Vol. 26, No 1, Johnson Graduate School of Management, Cornell University

Estimating Market Penetration of Multi-Industrial Companies on a Global Market
76
URL: http://www.jstor.org/stable/2392599 (2010-03-01)
10.5 Company Reports
Alfa Laval, Annual Report (2008) Alfa Laval, Orders Received (2006-2009) Alfa Laval, EMD Business Plan (2009)
National Board of Trade (2009) BRICK-länderna i världshandeln, Vol. 2009, No. 1. First Edition
10.6 World Wide Web (www)
Alfa Laval (2010) About Us (www) URL: http://local.alfalaval.com/sv-se/about-us/pages/default.aspx (2010-05-05) Alfa Laval (2010) Press Information (www) URL: http://www.alfalaval.com/about-us/press/product-press/Documents/rotary_jet_mixers_en.pdf (2010-05-05) Alfa Laval (2010) Showroom (www) URL: http://www.showroom.alfalaval.com/expos07/highlights/flash/default.aspx?Market=int&key=0.3517299557204506pdf (2010-05-05) CIA - The World Factbook (2010) Brazil (www) URL: https://www.cia.gov/library/publications/the-world-factbook/geos/br.html (2010-05-06) CIA - The World Factbook (2010) China (www) URL: https://www.cia.gov/library/publications/the-world-factbook/geos/ch.html (2010-05-06) CIA - The World Factbook (2010) India (www) URL: https://www.cia.gov/library/publications/the-world-factbook/geos/in.html (2010-05-06) CIA - The World Factbook (2010) Russia (www) URL: https://www.cia.gov/library/publications/the-world-factbook/geos/rs.html (2010-05-06) CIA - The World Factbook (2010) South Korea (www)
Estimating Market Penetration of Multi-Industrial Companies on a Global Market
77
URL: https://www.cia.gov/library/publications/the-world-factbook/geos/ks.html (2010-05-06) Funding Universe (2010) Alfa Laval AB (www) URL: http://www.fundinguniverse.com/company-histories/Alfa-Laval-AB-Company-History.html (2010-05-05) Investopedia (2010) Market Penetration (www) URL: http://www.investopedia.com/terms/m/market-penetration.asp (2010-05-04) Investopedia (2010) Market Proxy (www) URL: http://www.investopedia.com/terms/m/market-proxy.asp (2010-05-04) Investopedia (2010) Market Share (www) URL: http://www.investopedia.com/terms/m/marketshare.aspasp (2010-05-04) Trading Economics (2010) China GDP growth rate (www) URL: http://www.tradingeconomics.com/Economics/GDP-Growth.aspx?Symbol=CNY (2010-05-06)
10.7 Unpublished Documents
Alfa Laval (2010), “Master’s Thesis Project Specification” (through Syed, A., Vice President, Corporate Development, Alfa Laval) Swedish Trade Council (2010), “Key Issues for a market potential study“(Through Hägglund, F., Swedish Trade Commissioner and Swedish Embassy Counselor in Moscow, Russia) Booz & Company (2004), “Geographical Potential” (Through Pannell, N., Vice President at Booz & Company, London, UK)
10.8 Other
Excel Function Help, Correlation (“Correl”) Economist Intelligence Unit, Market Indicators and Forecasts, Database (2010-03-09) URL: http://store.eiu.com/product/430000243.html?ref=Products Paulson, M. “Kunskapsinhämtning & Bedömning” Swedish Trade Council Seminar, Emerging Markets Day (2010-02-02)

Estimating Market Penetration of Multi-Industrial Companies on a Global Market
78
11 Appendix
11.1 Appendix A1 – Driver Analysis through sales data
11.1.1 Comfort
Figure 24 - Comfort Sales
The comfort segment has only four customer groups, of which HVAC district heating is the largest both globally and for the BRICK total. These investments are largely dependent on how much new buildings that are built, and also governmental initiatives within public sectors. Relevant industries to use as proxies would be those included in HVAC, amount of new construction or infrastructural investments from the government. 11.1.2 Marine & Diesel
Figure 25 - Marine & Diesel Sales
For Marine and Diesel globally, the main industries in terms of sales are fuel oil treatment and diesel engine production followed by lube oil treatment and water distillation. For the BRICK countries the industries are similar, but with much less
HVAC, District heating HVAC, Heating other HVAC, District cooling HVAC, Cooling for special use
ECF Comfort Total Sales
EMD Marine & Diesel Equipment - Capital sales Total Sales

Estimating Market Penetration of Multi-Industrial Companies on a Global Market
79
importance for diesel engines and with increased importance for engine cooling. The Marine & Diesel segment is a bit unique as China and Korea are the single largest markets and together make up almost 50% of the sales.149 Potential industry drivers would be ship production, fuel oil production or numbers of transports made by boat. 11.1.3 OEM Equipment
Figure 26 - OEM Sales
The OEM segment is dominated by the Air Conditioning industry, both globally and even more so looking only at the BRICK countries. A possible driver could be measured as the turnaround of the air conditioning industry, or as a measure of new construction. On a global level, boiler and heat pump production could also be used.
149
43% 2008 and 47% forecast for 2010-2012. Alfa Laval, EMD Business Plan (2009)
EOE OEM Equipment Total Sales
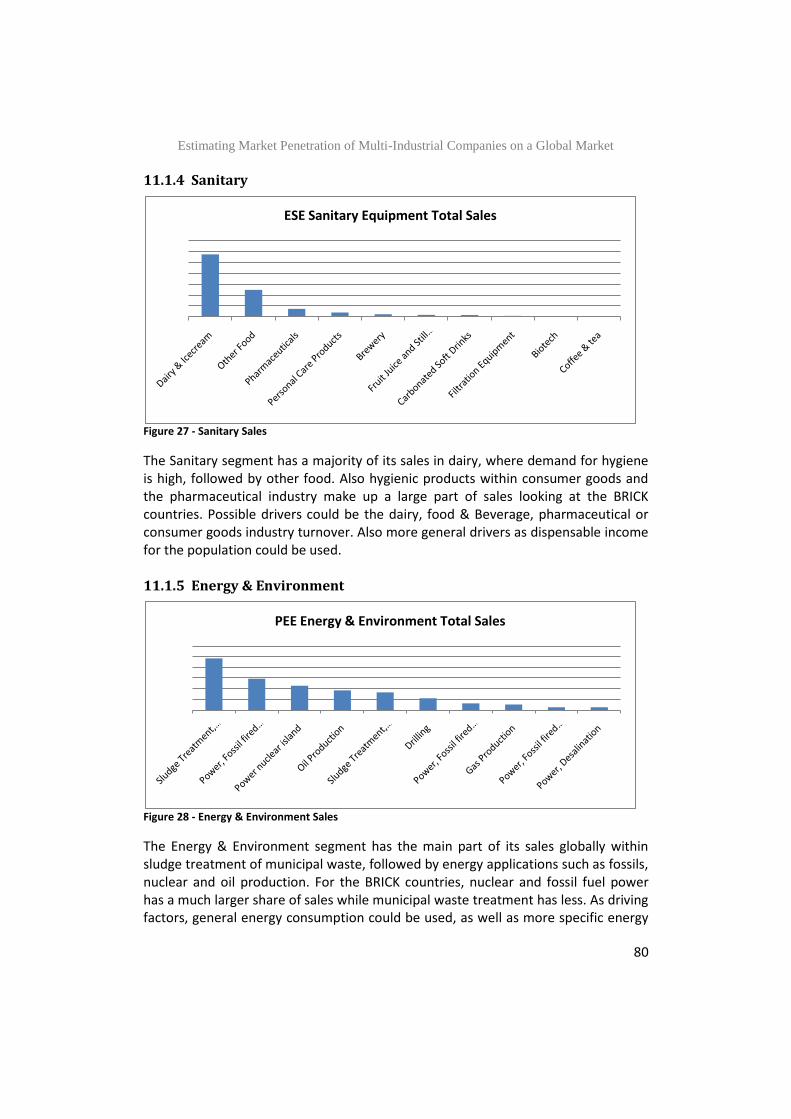
Estimating Market Penetration of Multi-Industrial Companies on a Global Market
80
11.1.4 Sanitary
Figure 27 - Sanitary Sales
The Sanitary segment has a majority of its sales in dairy, where demand for hygiene is high, followed by other food. Also hygienic products within consumer goods and the pharmaceutical industry make up a large part of sales looking at the BRICK countries. Possible drivers could be the dairy, food & Beverage, pharmaceutical or consumer goods industry turnover. Also more general drivers as dispensable income for the population could be used. 11.1.5 Energy & Environment
Figure 28 - Energy & Environment Sales
The Energy & Environment segment has the main part of its sales globally within sludge treatment of municipal waste, followed by energy applications such as fossils, nuclear and oil production. For the BRICK countries, nuclear and fossil fuel power has a much larger share of sales while municipal waste treatment has less. As driving factors, general energy consumption could be used, as well as more specific energy
ESE Sanitary Equipment Total Sales
PEE Energy & Environment Total Sales

Estimating Market Penetration of Multi-Industrial Companies on a Global Market
81
sources, such as nuclear or oil use. If available, numbers on municipal waste treatment would be useful, but could possibly be approximated with governmental spending on infrastructure, or general development level of the country. 11.1.6 Food Technology
Figure 29 - Food Technology Sales
Food Technology is much about the production of vegetable oils from seeds, olives and palms. Other important applications include fermentation of beer and other typed of food processing. For the BRICK countries, the segmentation is similar, with the processing of seed oil as dominant. Use or production of vegetable oil would be a good driver for this segment, as well as the general food & Beverage industry. Another driver of the consumption of processed food is indirectly the disposable income of households which could be used as a proxy. 11.1.7 Life Science
Figure 30 - Life Science Sales
PFT Food Technology Total Sales
PLS Process Life Science Total Sales

Estimating Market Penetration of Multi-Industrial Companies on a Global Market
82
Process Life Science mainly serves the pharmaceutical industry, but also other applications where demand on hygiene is high, such as oil and ethanol production and industrial fermentation. The segment profile is similar for the BRICK total with a bit more weight on the importance of the pharmaceutical industry. Possible driver measurements could be done with the turnover of the pharmaceutical industry or total drug usage in the country. Other possibilities are the oil industry or possibly the beverage industry to which some of the sales are done.

Estimating Market Penetration of Multi-Industrial Companies on a Global Market
83
11.2 Appendix A2 - Driver analysis through Interviews
11.2.1 Comfort
The main drivers in this segment according to a company manager are the increasing demand for temperate environments, both through increasing populations and need for new construction, but also through increased standards of living in countries with large populations. The drivers are largely global but can differ between different countries and in some countries like in India and Brazil, demand is low since the warm climate doesn’t require comfort heating of buildings.150 11.2.2 Marine & Diesel
The drivers of this segment are relatively the same between different countries. It is mainly the marine ship building industry, which drive the Marine part of the segment and the building of diesel power plants, which drive the Diesel part of the segment. For the environmental part of this segment a major driver is new legislation and the market for the environmental applications within this segment are predicted to grow over 6 fold (both invoicing and OR)151152 11.2.3 OEM Equipment
It is difficult to mention general drivers for this segment which are equal for different countries. This segment depends much upon industries like HVAC industries, building appliances for air conditioning, heat pumps, wall hanged gas boilers and district heating sub stations. Others like wind mills and solar equipment are markets where demand will grow and can hence be linked to renewable energy and environmental consciousness.153 11.2.4 Sanitary
The Drivers for Sanitary are relatively alike for the BRICK countries, although there are some differences between countries. In general, driving industries are the Food and Beverage, diary, cosmetics and pharmaceutical industries. In the future, especially cosmetics and pharmaceuticals will most likely have an increasing influence. Suitable proxies could therefore be food and beverage consumption, consumer expenditure and pharmaceutical investments.154
150
Segment Manager, Equipment Comfort and Refrigeration, Interview (2010-03-02) 151
Alfa Laval, EMD Business Plan (2009) 152
Segment Manager, Equipment Marine and Diesel, Interview (2010-02-01) 153
Segment Manager, Equipment Original Equipment Manufacturer, Interview (2010-05-06) 154
Segment Manager, Sanitary Equipment, Correspondence (2010-05-09)
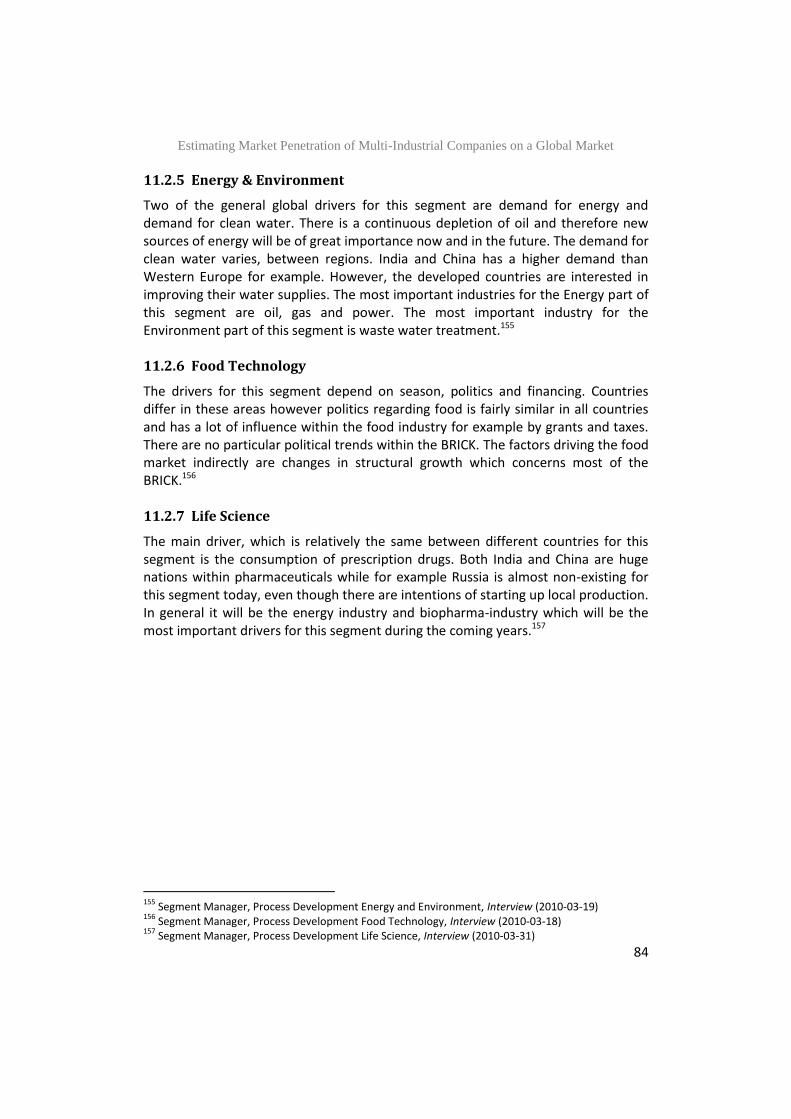
Estimating Market Penetration of Multi-Industrial Companies on a Global Market
84
11.2.5 Energy & Environment
Two of the general global drivers for this segment are demand for energy and demand for clean water. There is a continuous depletion of oil and therefore new sources of energy will be of great importance now and in the future. The demand for clean water varies, between regions. India and China has a higher demand than Western Europe for example. However, the developed countries are interested in improving their water supplies. The most important industries for the Energy part of this segment are oil, gas and power. The most important industry for the Environment part of this segment is waste water treatment.155 11.2.6 Food Technology
The drivers for this segment depend on season, politics and financing. Countries differ in these areas however politics regarding food is fairly similar in all countries and has a lot of influence within the food industry for example by grants and taxes. There are no particular political trends within the BRICK. The factors driving the food market indirectly are changes in structural growth which concerns most of the BRICK.156 11.2.7 Life Science
The main driver, which is relatively the same between different countries for this segment is the consumption of prescription drugs. Both India and China are huge nations within pharmaceuticals while for example Russia is almost non-existing for this segment today, even though there are intentions of starting up local production. In general it will be the energy industry and biopharma-industry which will be the most important drivers for this segment during the coming years.157
155
Segment Manager, Process Development Energy and Environment, Interview (2010-03-19) 156
Segment Manager, Process Development Food Technology, Interview (2010-03-18) 157
Segment Manager, Process Development Life Science, Interview (2010-03-31)

Estimating Market Penetration of Multi-Industrial Companies on a Global Market
85
11.3 Appendix A3 – Driver analysis through data availability
Segment Proxies Comment
Comfort Urban Population
Number of HH earning > 10000 $/Y
Consumer expenditure – Total
Consumer Expenditure – Housing and
household fuels
There were no figures available on district heating or construction, so household specific data was used instead. Also population can be a suitable measure for heating needs.
Fluids & Utility
Commercial vehicle registrations
Petrol Consumption
Motor vehicle and parts – Market demand
Industrial GDP
See Driver analysis Chapter 5.
Marine & Diesel
No. Ships Delivered
No. Ships Contracted
This data is extracted from a different source.
158
OEM Equipment
Number of HH earning > 10000 $/Y
Electricity Consumption
Consumer Expenditure – Housing and
household fuels
Industrial GDP
This segment is selling to many application areas and the proxies were chosen to get some spread over the different areas.
Refrigeration & Cooling
Industrial GDP
Consumer expenditure – Food, beverages
and tobacco
Retail sales
See driver analysis Chapter 5.
Sanitary Consumer expenditure – Food, beverages
and tobacco
Milk consumption
Healthcare spending
Pharmaceutical sales
Consumer expenditure - Total
These proxies should all be suitable according to our data analysis and interviews.
Energy & Environment
Energy Consumption
Consumer expenditure – Total
Coal consumption
Petroleum consumption
The business units in this segment are very different – Environment not related to energy for example. The proxies
158
Market Unit Manager, Marine, Interview (2010-03-04)
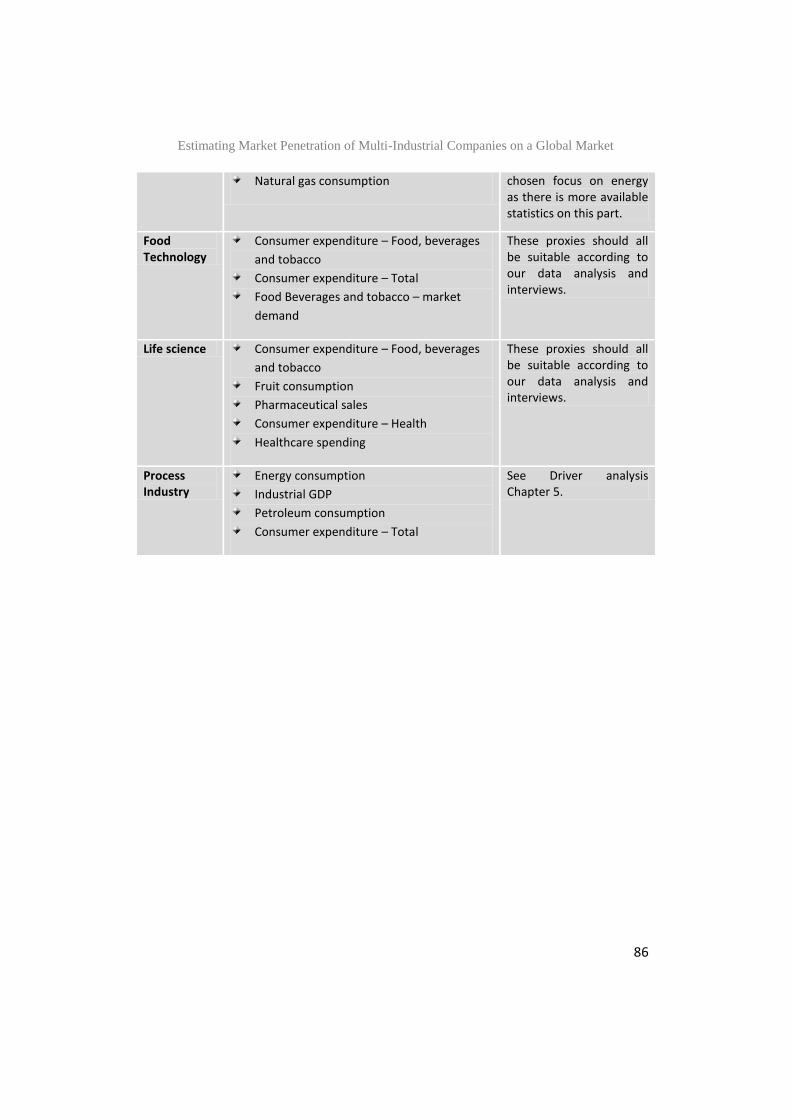
Estimating Market Penetration of Multi-Industrial Companies on a Global Market
86
Natural gas consumption chosen focus on energy as there is more available statistics on this part.
Food Technology
Consumer expenditure – Food, beverages
and tobacco
Consumer expenditure – Total
Food Beverages and tobacco – market
demand
These proxies should all be suitable according to our data analysis and interviews.
Life science Consumer expenditure – Food, beverages
and tobacco
Fruit consumption
Pharmaceutical sales
Consumer expenditure – Health
Healthcare spending
These proxies should all be suitable according to our data analysis and interviews.
Process Industry
Energy consumption
Industrial GDP
Petroleum consumption
Consumer expenditure – Total
See Driver analysis Chapter 5.

Estimating Market Penetration of Multi-Industrial Companies on a Global Market
87
11.5 Appendix B1 – Penetration Results
11.5.1 Comfort
Within comfort, Russia and China are the dominating BRICK countries in terms of sales volumes, and these are also the two who have penetration values over 0. Russia has had a stabile penetration of between 150-900% of world average depending on proxy, while China´s penetration has decreased from around 100% on average to almost tangent world average. Korea is under average, but shows an increasing trend for all proxies. Brazil and India have too low sales volumes to give any useful penetration data. The Nordic market used as a benchmark is well higher than Russia at slightly over 1000% with an especially high penetration compared to urban population. This can indicate that district heating in the Nordics is well developed also in rural areas unlike in Russia and China. 11.5.2 Marine & Diesel
Marine & Diesel is slightly different from the other segments as China and Korea are known to be the two main markets. The other studied countries have almost no sales in this segment. Marine & Diesel was also hit hard by the crisis, and consequently, Korea´s penetration has decreased significantly between 2008 and 2009. China has maintained its penetration over the last 4 years and even increased slightly. 11.5.3 OEM Equipment
For OEM, China is the only significant country among the BRICK´s. and its penetration has dropped from about 50% to below average during the past four years. The Nordic countries have a stabile penetration of around 500%.
11.5.4 Sanitary
For Sanitary, Brazil, Russia, India and China all have results spread from slightly below average to around 150% depending on proxy, with India scoring slightly higher than the others. Brazil has ha downward trend for its penetration while India´s is turning upwards. Korea has an average penetration below zero, with the exception of the line correlated to milk consumption, which indicates that Korea has very low milk consumption rather than high sales (Korea has the lowest sales in this segment among the studied countries). Overall, the spread for this segment makes conclusions hard to make. Nordic has a high penetration concentrated around 700%. 11.5.5 Energy & Environment
For energy and Environment, Brazil and China have high penetration numbers for 2008, but the graphs are very volatile, which could indicate high influence from

Estimating Market Penetration of Multi-Industrial Companies on a Global Market
88
certain large projects. Also Korea has a large bump in the penetration, but in 2007. India has a steadier development, from a significant negative value, to be around average in 2009. Also Russia has had an increased penetration. Like for sanitary, the spread of the penetration is large, and makes accurate conclusions difficult to make. Nordic has a high penetration with a very large spread; from around 400-2300% in 2009. 11.5.6 Food Technology
For Food Technology, India has the highest average penetration of around 400% and an increasing trend. Also Brazil is increasing in penetration with an average value of just over 200% in 2009. Russia has decreased significantly since 2006 and is now at around 100%, and also china is showing a downwards trend, although from a lower staring level. In Korea, sales are too small to show any results. On this market, The Nordic benchmark is not very strong and after a top in 2007, it is now below average. 11.5.7 Life science
For Life Science, Brazil and China are the most selling countries and of those Brazil has had a significant downturn in penetration from a high point of 500%, hitting average in 2009, while China has had a slight increase. Korea has quite small volumes, but shows a clear upward trend going from average to 300% since 2008. Russia shows an increased penetration as well, although still under average, and with very small sales volumes. India has had a slight downturn around 2007 and is now at around 200% on average. Nordic is slightly increasing, with an average of about 600% in 2009.

Estimating Market Penetration of Multi-Industrial Companies on a Global Market
89
11.6 Appendix B2- Future outlook from interviews
11.6.1 Comfort
Comfort is driven by demand for temperate indoor environments, which limits the main growth to countries with temperatures that drop below a comfortable level for large part of the year. In these countries, increased standards of living, population growth and increased construction activity are the main drivers.159 In the coming future, environmental consideration and energy efficiency will become increasingly important drivers, through increasing consumer demand as well as new legislations.160 This is a major opportunity for district heating and other energy efficient solutions offered by AL. Brazil Due to climate, AL does not have any sales in this segment in Brazil.161162 Russia On the Russian market, AL has a strong local presence with a good distribution network and production of casketed heat exchangers outside Moscow. Local production is essential in Russia, as governmental regulation and import taxes play a major role. As the Russian leaders try to stimulate local industries, it is important for AL to continue and develop their local production. Sales people in Russia are experienced and also have good knowledge of aftermarket service work. Russia has a strong historic use of district heating.163 Their old and large heating plants are now becoming run down, and several break downs where people have lost their heating have been reported.164 For AL, the reconstruction and improvement of the much needed heating systems create a great opportunity for growth.165 Thanks to environmental commitments from the government, AL´s products, which are technically superior to local competitors, have a great advantage.166 However, competition is a threat to take seriously. Cheaper products that serve a “good enough” market are emerging from China, and both local and international players are becoming increasingly aggressive after the crisis.167 There is also a lack of funding on the Russian market, and although demand is high, renovation projects run the risk of being held back.168
159
Segment Manager, Equipment Comfort and Refrigeration, Interview (2010-03-02) 160
Segment Manager, Equipment Comfort and Refrigeration, Interview (2010-03-02) 161
Segment Manager, Equipment Comfort and Refrigeration, Interview (2010-03-02) 162
Alfa Laval, Orders Received (2006-2009) 163
BBC Russian, (2008) 164
BBC Russian, (2006) 165
Segment Manager, Equipment Comfort and Refrigeration, Interview (2010-03-02) 166
President, Alfa Laval Russia, Interview (2010-03-25) 167
President, Alfa Laval Russia, Interview (2010-03-25) 168
Segment Manager, Equipment Comfort and Refrigeration, Interview (2010-03-02)

Estimating Market Penetration of Multi-Industrial Companies on a Global Market
90
India Due to climate, AL does not have any sales in this segment in India.169 China In China, AL has a strong local set up and a well known brand.170 As the market grows however, the distribution network is still too weak to support all potential customers.171 In northern China, district heating is becoming increasingly popular, and AL is the pioneer who brought this technology to the Chinese market 20 years ago.172 The general lack of isolation of houses in China causes huge energy losses and most people still often use their air conditioning as the heating source.173 As customers become aware of advantages with more energy efficient solutions to heating this is changing.174 With a growing market there is growing competition and AL are currently losing shares to lower cost alternatives in heat exchangers; an initial 100% of the market is now down to 10%.175 This is a fairly easy technology to copy and competition is moving fast, which is vulnerability for the Comfort segment in China.176177 Korea Korea still only stands for a small but increasing part of the Comfort sales, and the general growth of the economy and increasing living standards are generating a potential for this country which has a suitable climate for demand of heating equipment.178179180 AL´s main focus on this market has always been the marine industry, and as this segment has had a major drawback, alternative business as comfort could be very interesting for the company.181The brand is already well known in Korea and there is a strong local set up.182 Competition is however moving fast, posing a threat to this segment.183
169
Segment Manager, Equipment Comfort and Refrigeration, Interview (2010-03-02) 170
Segment Manager, Equipment Comfort and Refrigeration, Interview (2010-03-02) 171
Segment Manager, Equipment Comfort and Refrigeration, Interview (2010-03-02) 172
Vice President, Marketing & Business Development, Shanghai Office, Interview (2010-03-10) 173
Employee at Nordea in Shanghai, Interview (2010-03-11) 174
Vice President, Marine & Diesel, Shanghai Office, Interview (2010-03-10) 175
Vice President, Marketing & Business Development, Shanghai Office, Interview (2010-03-10) 176
Vice President, Marketing & Business Development, Shanghai Office, Interview (2010-03-10) 177
Segment Manager, Equipment Comfort and Refrigeration, Interview (2010-03-02) 178
Alfa Laval, Orders Received (2006-2009) 179
Segment Manager, Equipment Comfort and Refrigeration, Interview (2010-03-02) 180
Economist Intelligence Unit, Database (2010-03-09) 181
Segment Manager, Equipment Comfort and Refrigeration, Interview (2010-03-02) 182
Segment Manager, Equipment Comfort and Refrigeration, Interview (2010-03-02) 183
Segment Manager, Equipment Comfort and Refrigeration, Interview (2010-03-02)

Estimating Market Penetration of Multi-Industrial Companies on a Global Market
91
11.6.2 Marine & Diesel Equipment
The main trend for the marine production is a shift in geography. Today, 80% of ships are built in China, Japan and Korea, compared to 70% 5 years ago. Speculations points toward an additional shift where Japan will lose business to new coming countries such as Thailand and the Philippines. The Marine Industry grew extensively during 2005-2008 and was then hit very hard by the crisis in 2009 where the entire industry activity came to a halt. For the Diesel industry, increased power demand will stimulate continuous growth, both through back-up systems for nuclear and wind power technology, and for remote locations in developing countries. Both segments will be seeing increased environmental drivers globally.184 Brazil Brazil might be an up and coming country in the Marine Industry, although there are still several question marks on how the market will develop. AL has a good brand and market position in the country, and a strong local technical support. However, there is a lack of central support and training to maintain competence.185 Overall, there are several potential projects under discussion in the country, among them governmental plans for about 100 ships, that could yield attractive business opportunity for AL as long as they can stay ahead of increasing competition.186 187 Russia AL has a good brand and position on this market, but in the Marine and Diesel segment, there is limited potential for growth.188 India Like Brazil, India could become an important player in shipbuilding in the future although the segment today is small. AL´s strong brand local presence is a strength despite some lack in central support and training. China China is the world´s largest shipbuilder which means large potential and lots of competition.189 AL has a strong market position and a recognized brand which is a strength.190 They were also early on the market and have developed good relations with shipbuilders and the company strategy is stronger here than on many other segments.191 A weakness is that internal company structures are complicated and can sometimes cause slower execution. As for the future, the Marine segment is
184
Market Unit Manager, Marine, Interview (2010-03-04) 185
Market Unit Manager, Marine, Interview (2010-03-04) 186
Market Unit Manager, Marine, Interview (2010-03-04) 187
Market Unit Manager, Marine, Interview (2010-03-04) 188
Market Unit Manager, Marine, Interview (2010-03-04) 189
Market Unit Manager, Marine, Interview (2010-03-04) 190
Market Unit Manager, Marine, Interview (2010-03-04) 191
Vice President, Marine & Diesel, Shanghai Office, Interview (2010-03-10)

Estimating Market Penetration of Multi-Industrial Companies on a Global Market
92
expected to recover in 2011-2012 and continue to grow.192 To maintain their market share, AL needs to find new ways to the market and increase their presence. There are an infinite amount of small Chinese shipbuilders, and distributors could be a good way to reach additional customers.193 Both International and local competitors are important to consider, and especially product pricing will be important to maintaining shares.194 Korea Korea is a historical shipbuilder, and the government is actively supporting the industry development, which means that many local actors such as Hyundai are making boats on the side since it is profitable.195 This means tough competition, and it is very important to be perceived as a local supplier as shipbuilders must have a certain percentage of their sourcing locally.196 For Alfa Laval this is important and they have for example made a strategic accusation of the local company Onnuri in 2009 to produce heat exchangers locally and develop distribution channels.197198 AL´s advantages are the strong brand, the product competence and also the recent adaptation center in the country. Their main weaknesses are the product cost and a large number of new people in the supply chain which can leave relations damaged. Competition will continue to be a major threat, and finding new ways to the market through for example distributors will be an important challenge.199200 11.6.3 OEM Equipment
The most important industry for the OEM segment in the coming future, are industries that provide residential and commercial markets with heating and cooling appliances as well as industries building energy transformation systems like wind mills and solar equipments. 201 Brazil AL has limited presence in Brazil and a lack of market knowledge for this segment. 202 192
Market Unit Manager, Marine, Interview (2010-03-04) 193
Market Unit Manager, Marine, Interview (2010-03-04) 194
Market Unit Manager, Marine, Interview (2010-03-04) 195
Segment Manager, Equipment Marine and Diesel, Interview, (2010-02-01) 196
Market Unit Manager, Marine, Interview (2010-03-04) 197
Market Unit Manager, Marine, Interview (2010-03-04) 198
Alfa Laval, Annual Report (2008) 199
Market Unit Manager, Marine, Interview (2010-03-04) 200
Segment Manager, Equipment Marine and Diesel, Interview, (2010-02-01) 201
Segment Manager, Equipment Original Equipment Manufacturer, Interview (2010-05-06) 202
Segment Manager, Equipment Original Equipment Manufacturer, Interview (2010-05-06)

Estimating Market Penetration of Multi-Industrial Companies on a Global Market
93
Russia AL is not active within this segment on the Russian market. The potential however is big for example speaking of district heating. 203 India AL is not active within this segment on the Indian market. Being an emerging market, there are opportunities in some applications. 204 China AL has a very recognized brand in China.205 Being a fast growing market with developing demand, AL has big potential and opportunities to grow within this segment. For OEM, China has the highest sales volumes out of the BRICK countries. Although the volume of the market is great and the manufacturing costs are still low in China, the competition is fierce which, is the main threat on the market. 206 Korea There are opportunities for AL in Korea, especially in the market for Heat Pumps. However, the market is fragmented and future sales are threatened by the national protectionism. 11.6.4 Sanitary Equipment
Brazil In Brazil, AL has a good local presence and a strong overall locally produced portfolio. The general weakness on this market is a lack of resources, from the local sales organization build up to the actual number of people and their competence. There are some opportunities within the mid range portfolio that could be capitalized although there is threats from especially Asian suppliers.207 Russia In Russia, AL has a good Brand name and local production, which is a strength. The main limiting factor is the general lack of investments and money on the Russian market. There is also more Chinese competitors making their way to this market and competing on price.208 India In India, AL’s good brand and general presence is a strength. The price competition from especially GEA and SPX however is an increasing threat as AL’s prices are
203
Segment Manager, Equipment Original Equipment Manufacturer, Interview (2010-05-06) 204
Segment Manager, Equipment Original Equipment Manufacturer, Interview (2010-05-06) 205
President, Alfa Laval China, Interview (2010-03-10) 206
Segment Manager, Equipment Original Equipment Manufacturer, Interview (2010-05-06) 207
Segment Manager, Sanitary Equipment, Correspondence (2010-05-09) 208
Segment Manager, Sanitary Equipment, Correspondence (2010-05-09)

Estimating Market Penetration of Multi-Industrial Companies on a Global Market
94
somewhat high to compete on the market. If the prices can be adjusted and AL could capitalize on the growing mid range market, there is potential for improved penetration.209 China In China, the brand and presence is good, but there is a problem of a high a turn-over rate of sales people which keeps competence down. Like for many other segments on the Chinese market, increasing competition and an increasing price war in the mid range market is both an opportunity and a threat.210 Korea In Korea, presence for this segment is very low, and this lack of resources is a both a drawback and an opportunity for growth.211 11.6.5 Energy & Environment
Two main drivers for the Energy and environment segment are energy demand, and the demand for clean water. There is a continuous depletion ratio of oil wells and the demand of new energy sources will grow. New technology for capturing gas brings a big potential to the gas industry. The nuclear energy market has reached a new renaissance and is starting to gain momentum in many parts of the world. The type of demand for clean water varies very much from region to region but industrial countries search for more efficient ways of improving water supply while emerging markets have a big demand for better and cleaner water for consumption. 212 Brazil In Brazil, AL has a good local sales setup although the company has a relatively small market share and its sales position is rather weak. AL has opportunities to grow in the oil and gas industry as well as in the water business.213 It is however important to become more local as the local competition is likely to grow.214 Russia In Russia, AL has good skills and local sales setup. It has a strong position in and knowledge of nuclear power which is growing in Russia. Although the drilling sector of the oil and gas industry is improving in total, the company share is too low. The
209
Segment Manager, Sanitary Equipment, Correspondence (2010-05-09) 210
Segment Manager, Sanitary Equipment, Correspondence (2010-05-09) 211
Segment Manager, Sanitary Equipment, Correspondence (2010-05-09) 212
Segment Manager, Process Development Energy and Environment, Interview (2010-03-19) 213
Segment Manager, Process Development Energy and Environment, Interview (2010-03-19) 214
President, Alfa Laval Brazil, Interview (2010-03-25)
Estimating Market Penetration of Multi-Industrial Companies on a Global Market
95
opportunity in this industry is very big for AL. When it comes to waste treatment, AL is weaker in the municipal sector in comparison to the industrial sector.215 India In India, AL has local manufacturing of decanters and heat exchangers which is a definite strength. However, there seems to be a lack of resources to manage the heat exchange business where AL is not price competitive and is being pushed out. Even though AL has local production, the products are too advanced and therefore not price competitive. The opportunities to grow within the clean water business are very big as the demand for clean water in India is immense. 216 China In China, AL has a strong organization and a historical presence with a strong brand name. Both in the nuclear industry and waste water treatment industry, AL are quite strong, however, much weaker in the oil and gas industry. Energy demand and the need for clean water are big which brings great growth opportunities. 217 As new legislations of upgrading nuclear plants are imposed and new plants are being built, the opportunities for AL grow. District heating is also on the rise and can be a very big prospect for AL. Government support on environmental protection, for example of carbon and sulfur dioxide capture in power plants, poses new opportunities for AL as well.218 The main threat of AL is the local fast and growing local competition, which often gets governmental support. In some cases, the government prohibits the end users to buy non-Chinese end products which make it impossible for foreign companies such as AL to compete and grow.219 Local competitors are fast moving and take high risks, and because AL’s size and global perspective, it moves too slowly to be able to catch up with the local competition and the fast moving market. The lack of local production is a great threat for AL potential to grow and take new market shares.220 Korea In Korea, AL’s business focus is on the marine industry. Thus, there is lack of good presence and good skills in the areas needed for the Energy and Environment segment which makes AL weak in the relevant industries. There are definitely opportunities for AL if the right skills and presence in the right areas were improved. Korean contractors have their focus on the export market which makes it very important for AL to build good relations with them as this expands the opportunity
215
Segment Manager, Process Development Energy and Environment, Interview (2010-03-19) 216
Segment Manager, Process Development Energy and Environment, Interview (2010-03-19) 217
Vice President, Marketing & Business Development, Shanghai Office, Interview (2010-03-10) 218
Marketing Unit Manager, Power, Shanghai Office, Interview (2010-03-09) 219
Segment Manager, Process Development Energy and Environment, Interview (2010-03-19) 220
Marketing Unit Manager, Power, Shanghai Office, Interview (2010-03-09)

Estimating Market Penetration of Multi-Industrial Companies on a Global Market
96
to a global level. Surprisingly, business principles and ethics are not what you would expect them to be which poses a barrier for AL to be able to succeed. 221 11.6.6 Food Technology
The drivers of this segment are mainly industries of brewery, fruit, vegetable and palm oils, olive oil and protein. There is a lot of politics concerning the food industry, for example by taxes and grants. During the past two and a half years, the world’s food industry has changed. Today the food industry is demanding a more “glocal” approach. People demand more local products which makes it difficult for Alfa Laval to compete without local production. The BRICK countries are getting smarter and this adds on to the local competition as well. A sure driver of this segment is structural growth as the demand for food follows economical growth, population growth and growth in standards of living. 222 Brazil In Brazil, AL sales are fairly low although it has a good local presence and local engineering competence. T he market presence can be a lot better and the sales force should be enhanced. The opportunities of the market are many and there is a lot of money to be made. What threatens AL business is the local business values and national corruption. Also, being a large international company, AL does not follow competition and can be overtaken by competitors for being too slow. In Brazil the margins of the Food Technology are higher than Russia, India and Korea. 223 Russia In Russia, AL sales are fairly low although it has a broad sales network. The problem is that there is no money in the market. 224 India India has the highest sales volumes regarding the RBICK countries and the local presence is very good and there is high engineering competence. AL struggles with its engineered solutions and constantly needs to improve the quality of the engineered solutions. In comparison to competitors, AL is doing ok, however, in order not to lose market opportunities to competitors, AL needs to move faster and secure its local presence. The market potential is very big and there is a lot of money to make. Comparing to the other BRICK countries, AL is ok penetrated in India. In India, AL is the biggest international player in food, vegetable oils, fruit and general food. In brewery, there is still competition from other international companies. 225
221
Segment Manager, Process Development Energy and Environment, Interview (2010-03-19) 222
Segment Manager, Process Development Food Technology, Interview (2010-03-18) 223
Segment Manager, Process Development Food Technology, Interview (2010-03-18) 224
Segment Manager, Process Development Food Technology, Interview (2010-03-18) 225
Segment Manager, Process Development Food Technology, Interview (2010-03-18)

Estimating Market Penetration of Multi-Industrial Companies on a Global Market
97
China Although the local presence in China is good, it should be even better. The market potential is huge and the market is growing fast226, and the demand for food grows with the population and higher standards of living.227 However, in comparison to local competitors, AL moves slowly and is losing market share due to the high speed and low costs of local competitors. The market penetration could be better in China than it is today.228 Korea In Korea, AL has built up good customer relations, although the sales are almost non-existing. There are opportunities to increases AL’s presence in Korea and to expand the global network.229 11.6.7 Process Life Science
The drivers of the Life Science Technology part of the segment are mainly the Bio-phama industry, and Industrial fermentation. The drivers for the high speed heat exchangers market, on the other hand, are the Oil and Gas industry, the Bio-fuel industry and the Petrochemical Industry. 230 Brazil In Brazil, AL has a very strong position in the Ethanol industry and has developed good relations on the market. There are good opportunities to further penetrate this market as the Ethanol business recovers and the production grows. Competition from Westfalia is growing as they focus on the Brazilian market and AL can lose out on market share. AL presence in the Biotechnology and Pharmaceutical industries is weak. 231 Russia AL has no real strengths in Russia within this segment. However, AL’s presence and strong foothold in Russia should be possible to use for developing the Life Science business. Governmental support for a local biochemical and pharmaceutical industry is a future opportunity for this segment. 232 India AL coverage of the Bio-Parm industry is good and so are the results. There is an organizational weakness due to a too quick turn-over on people. The opportunity
226
Sales Manager, Fluids & Utility, Shanghai Office, Interview (2010-03-09) 227
President, Alfa Laval China, Interview (2010-03-10) 228
Segment Manager, Process Development Food Technology, Interview (2010-03-18) 229
Segment Manager, Process Development Food Technology, Interview (2010-03-18) 230
Segment Manager, Process Development Life Science, Interview (2010-03-31) 231
Segment Manager, Process Development Life Science, Interview (2010-03-31) 232
Segment Manager, Process Development Life Science, Interview (2010-03-31)

Estimating Market Penetration of Multi-Industrial Companies on a Global Market
98
lies within the continued good development of Biotech in India as well as the membrane and energy business. The main threats in India are the increasing local competition and low price levels on the market. 233 China The Life Science team in China focuses on the Bio-Pharma industry and has good coverage and results. AL historical presence in China has created a strong brand name and has a lot of experience of the market. Out of the BRICK countries, half of the total sales are in China.234 On the other hand, the coverage of the energy and petrochemical sectors are weak from a High Seed Separator perspective. Customers have also complained that AL focuses too little on the aftermarket. The opportunities lie within the development of the biotechnology industry and there is an unexploited potential for separation. 235 There is also Huge efficiency potential for the medicine industry, especially insulin and fermentation technology. The biggest threat on the Chinese market is the fast and quick growing local competition. Being an international big company, AL tends to move a lot slower and less efficient than local competition which prevents AL to maintain its market position in China. Another threat is keeping key employees as it takes several years for an employee to learn the market.236 Korea In Korea, AL focuses on the Oil and Gas sector, unfortunately, the hit-ratio on Oil and Gas projects are too low, often driven by the low price levels. The opportunities lie within the development of making Korea a major hub for construction of Oil and Gas facilities. A lower cost level through local supply chain is also an opportunity. Just like in Brazil, Westfalia will continue to defend the market strongly and could be a threat to AL. 237
233
Segment Manager, Process Development Life Science, Interview (2010-03-31) 234
Alfa Laval, Orders Received (2006-2009) 235
Segment Manager, Process Development Life Science, Interview (2010-03-31) 236
General Manager, Life Science, Shanghai Office, Interview (2010-03-10) 237
Segment Manager, Process Development Life Science, Interview (2010-03-31)

Estimating Market Penetration of Multi-Industrial Companies on a Global Market
99
11.7 Appendix C1- Discussion of results per segment
11.7.1 Comfort
For Comfort, the low penetration in Brazil and India can be expected, as these are countries with high year round temperatures. Also Russia has probably reached mature level of penetration, being the most selling country within this segment and increased sales can be expected to depend mainly on the economic activity in the country in the near future, rather than additional investments by AL. China is the second largest market of the ones studied, and the fact that penetration has decreased while the country economy has continued to grow, indicates that AL is not keeping up. As it is a large and important market for AL with obvious growth potential for district heating, this would be an interesting area for penetration efforts. Korea is still a rather small market within comfort, but penetration is increasing. The climate and growing economy of this country are two factors that could make this a very interesting market for the future growth of the comfort segment. 11.7.2 Marine & Diesel
This segment is a little harder to draw conclusions from as there is only boat data for three countries, and two countries make up the majority of the sales. China with the largest sales is the main influence on the world average, and therefore, it is not too strange that penetration is quite steady while the effect of the crisis is more visible for Korea. For both Korea and China, there is potential for growth, but it is not necessarily captured by this tool. 11.7.3 OEM Equipment
For OEM, China is the dominating country, but for 2009, all five have penetrations below average. Apparently, AL growth has not matched the growth of the Chinese market for this period. The fact that OEM is underpenetrated on all this markets despite the fact that they are doing well for AL within other industrial applications, indicate that they are all high potential markets for OEM. In China for example, energy investments both for nuclear, renewable and other sources provide a great opportunity, while in Russia, heat generation and distribution are high potential business areas. 11.7.4 Energy & Environment
The results for Brazil and China show a high degree of volatility, which makes conclusions a bit difficult to make. In general they should have more potential for penetration, especially for oil and ethanol in Brazil and within water treatment and nuclear in China. India’s penetration level has increased steeply from 2006, and there is great continuous potential within water treatment especially. Russia’s penetration has increased historically, but the apparent stagnation from 2008
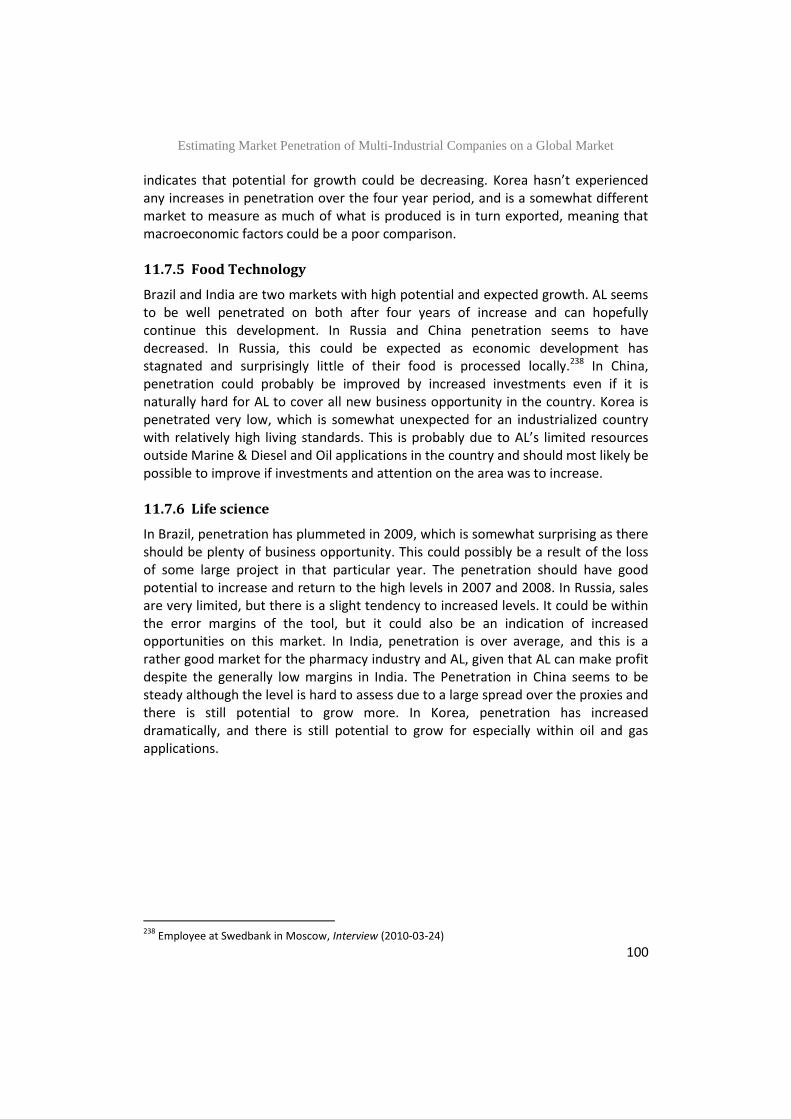
Estimating Market Penetration of Multi-Industrial Companies on a Global Market
100
indicates that potential for growth could be decreasing. Korea hasn’t experienced any increases in penetration over the four year period, and is a somewhat different market to measure as much of what is produced is in turn exported, meaning that macroeconomic factors could be a poor comparison. 11.7.5 Food Technology
Brazil and India are two markets with high potential and expected growth. AL seems to be well penetrated on both after four years of increase and can hopefully continue this development. In Russia and China penetration seems to have decreased. In Russia, this could be expected as economic development has stagnated and surprisingly little of their food is processed locally.238 In China, penetration could probably be improved by increased investments even if it is naturally hard for AL to cover all new business opportunity in the country. Korea is penetrated very low, which is somewhat unexpected for an industrialized country with relatively high living standards. This is probably due to AL’s limited resources outside Marine & Diesel and Oil applications in the country and should most likely be possible to improve if investments and attention on the area was to increase. 11.7.6 Life science
In Brazil, penetration has plummeted in 2009, which is somewhat surprising as there should be plenty of business opportunity. This could possibly be a result of the loss of some large project in that particular year. The penetration should have good potential to increase and return to the high levels in 2007 and 2008. In Russia, sales are very limited, but there is a slight tendency to increased levels. It could be within the error margins of the tool, but it could also be an indication of increased opportunities on this market. In India, penetration is over average, and this is a rather good market for the pharmacy industry and AL, given that AL can make profit despite the generally low margins in India. The Penetration in China seems to be steady although the level is hard to assess due to a large spread over the proxies and there is still potential to grow more. In Korea, penetration has increased dramatically, and there is still potential to grow for especially within oil and gas applications.
238
Employee at Swedbank in Moscow, Interview (2010-03-24)

11.9 Appendix D1 – Results: Penetration
11.9.1 How to read the results
Accumulated sales. Countries with very low sales have less significant results
A country with penetration better than world average.
A country with penetration below world average.
A legend of the different proxies used. Graphs show sales divided with each proxy compared to world average, not the proxy itself.
Segment name
The axis shows percentage of the world average penetration. 0% is equal to world average. Minimum value is minus 100%
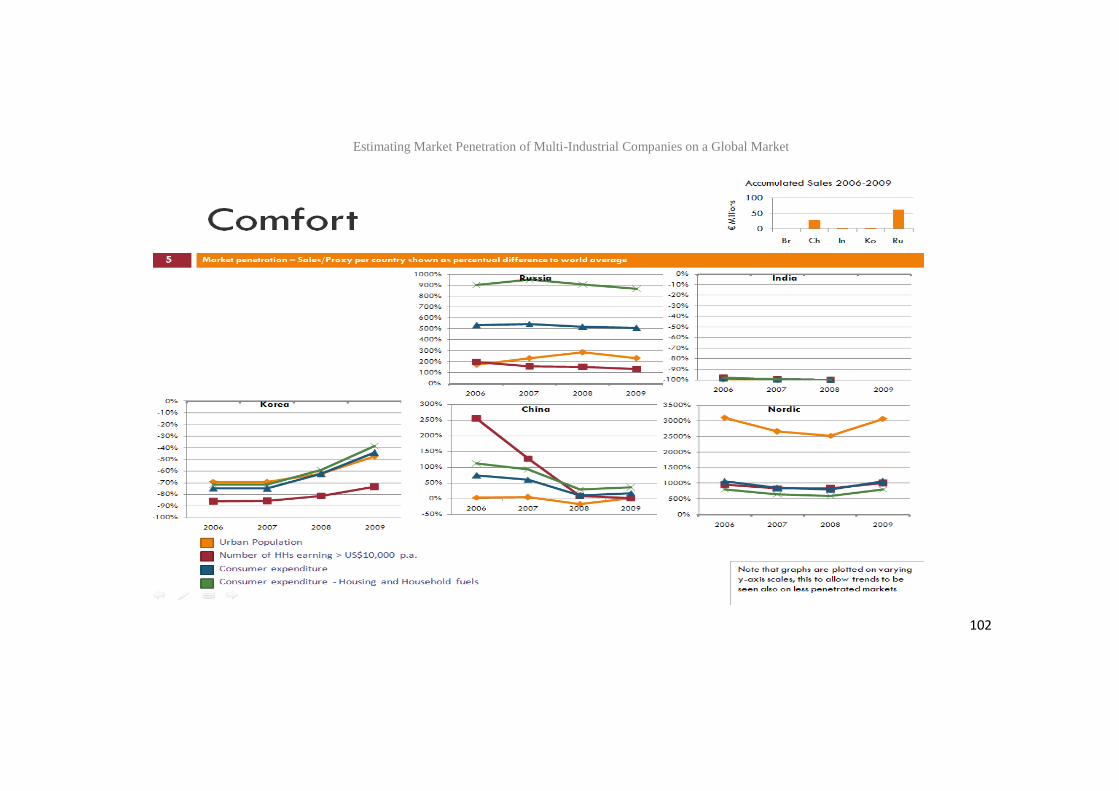
Estimating Market Penetration of Multi-Industrial Companies on a Global Market
102

Estimating Market Penetration of Multi-Industrial Companies on a Global Market
103

Estimating Market Penetration of Multi-Industrial Companies on a Global Market
104

Estimating Market Penetration of Multi-Industrial Companies on a Global Market
105

Estimating Market Penetration of Multi-Industrial Companies on a Global Market
106
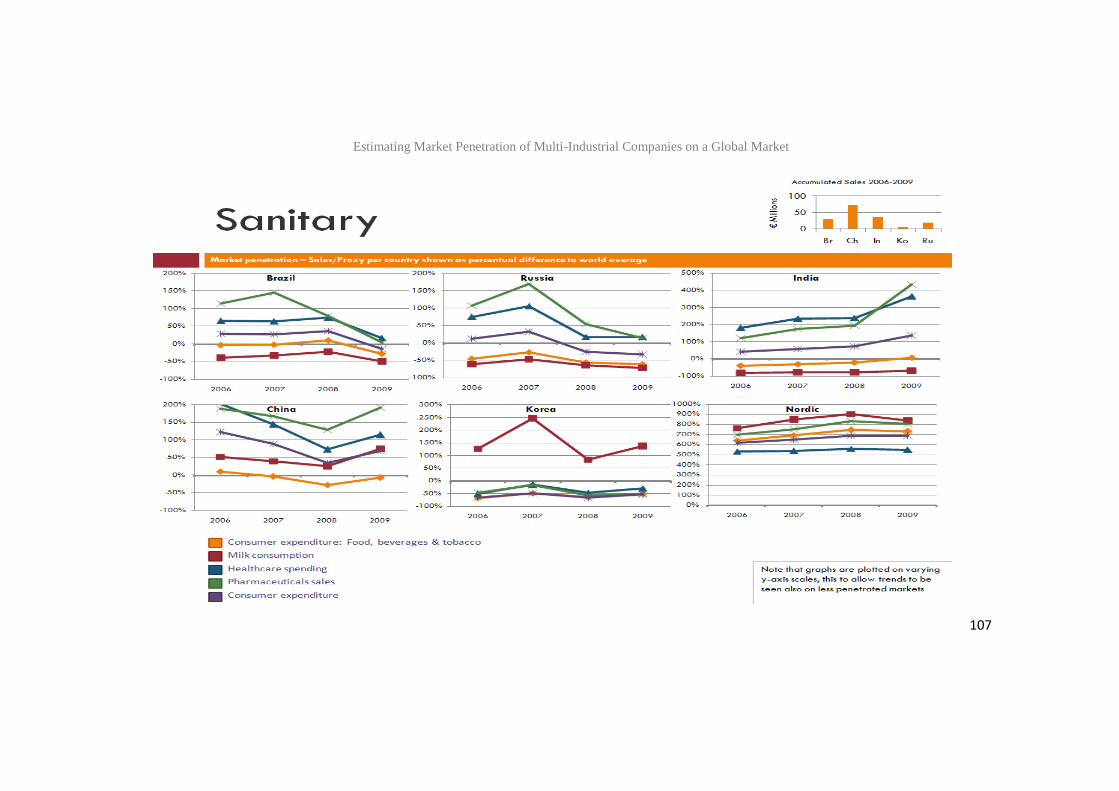
Estimating Market Penetration of Multi-Industrial Companies on a Global Market
107
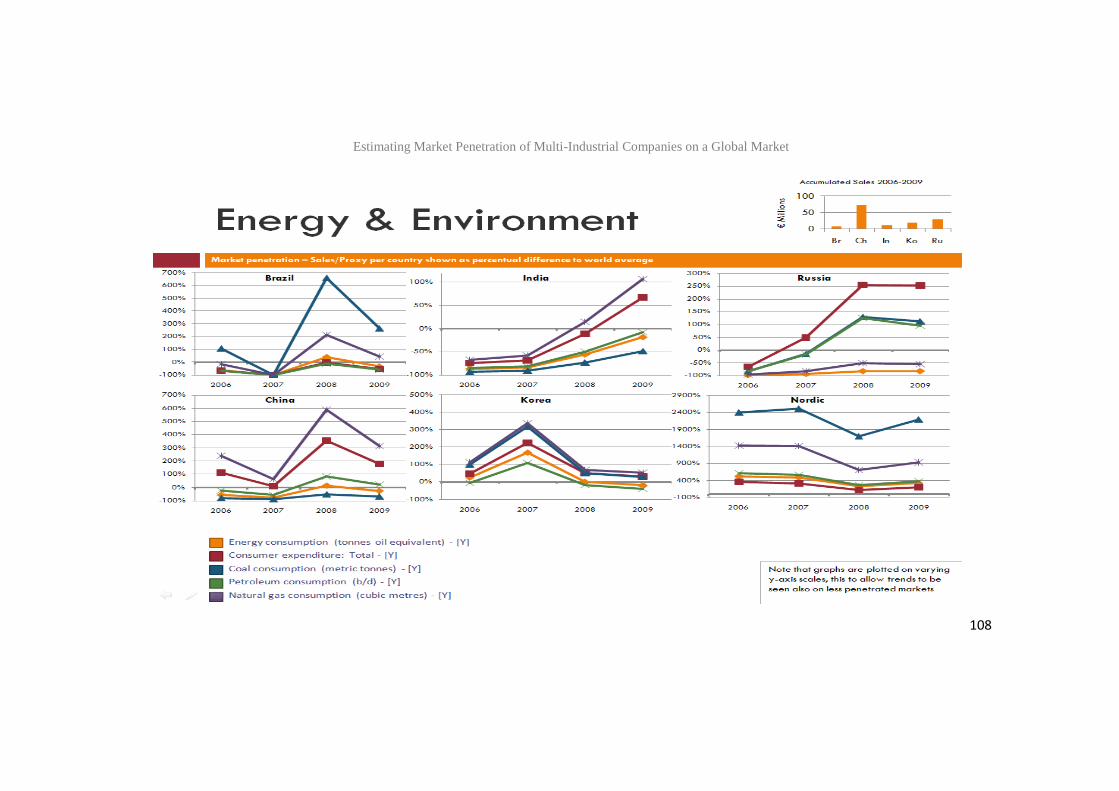
Estimating Market Penetration of Multi-Industrial Companies on a Global Market
108

Estimating Market Penetration of Multi-Industrial Companies on a Global Market
109

Estimating Market Penetration of Multi-Industrial Companies on a Global Market
110
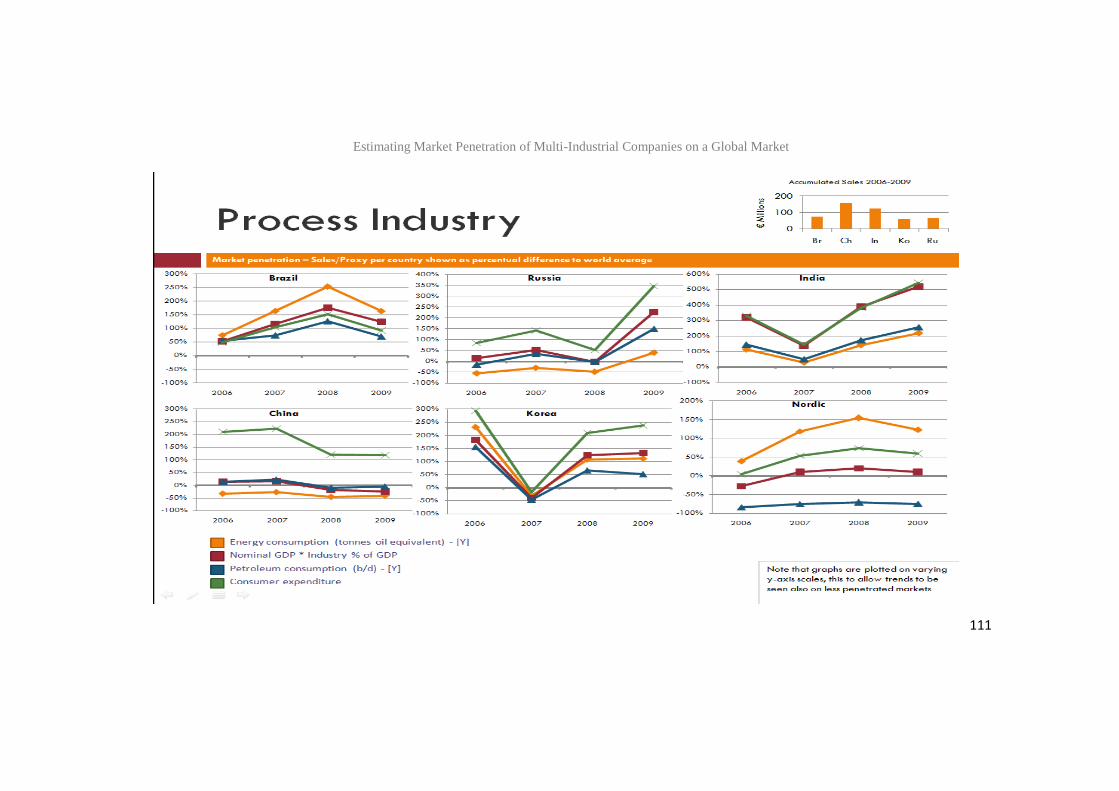
Estimating Market Penetration of Multi-Industrial Companies on a Global Market
111

Estimating Market Penetration of Multi-Industrial Companies on a Global Market
112
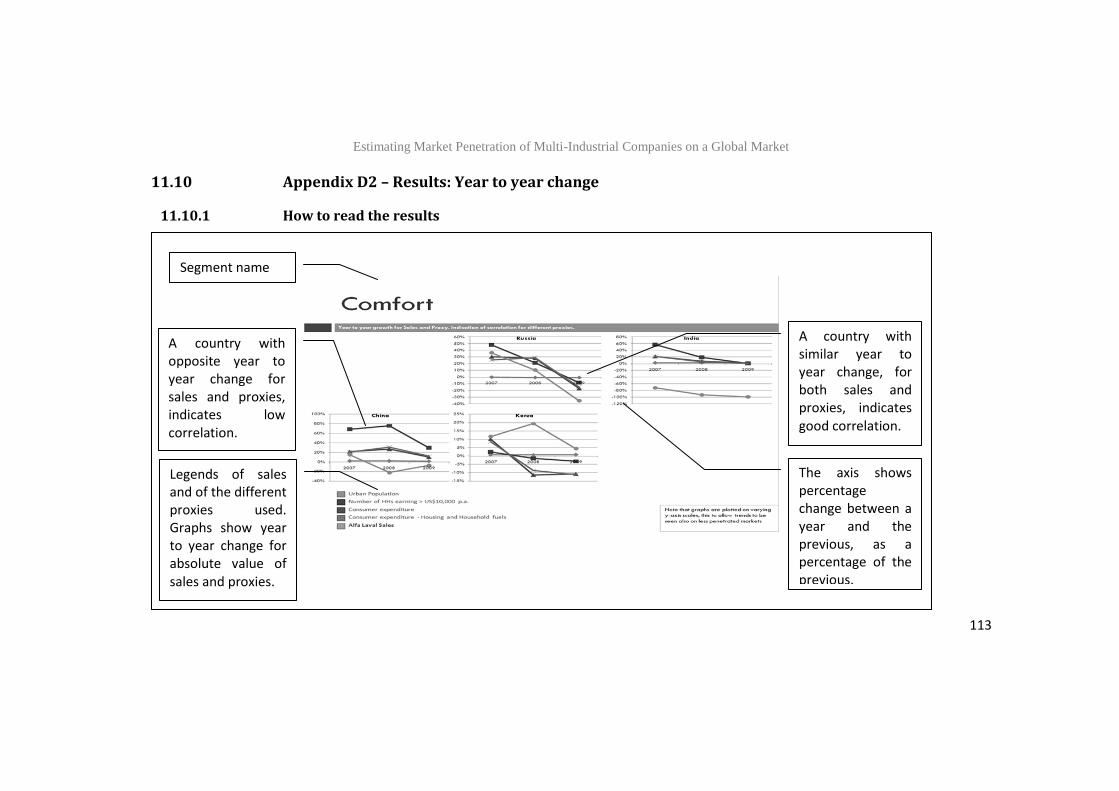
Estimating Market Penetration of Multi-Industrial Companies on a Global Market
113
11.10 Appendix D2 – Results: Year to year change
11.10.1 How to read the results
A country with similar year to year change, for both sales and proxies, indicates good correlation.
A country with opposite year to year change for sales and proxies, indicates low correlation.
Legends of sales and of the different proxies used. Graphs show year to year change for absolute value of sales and proxies.
Segment name
The axis shows percentage change between a year and the previous, as a percentage of the previous.
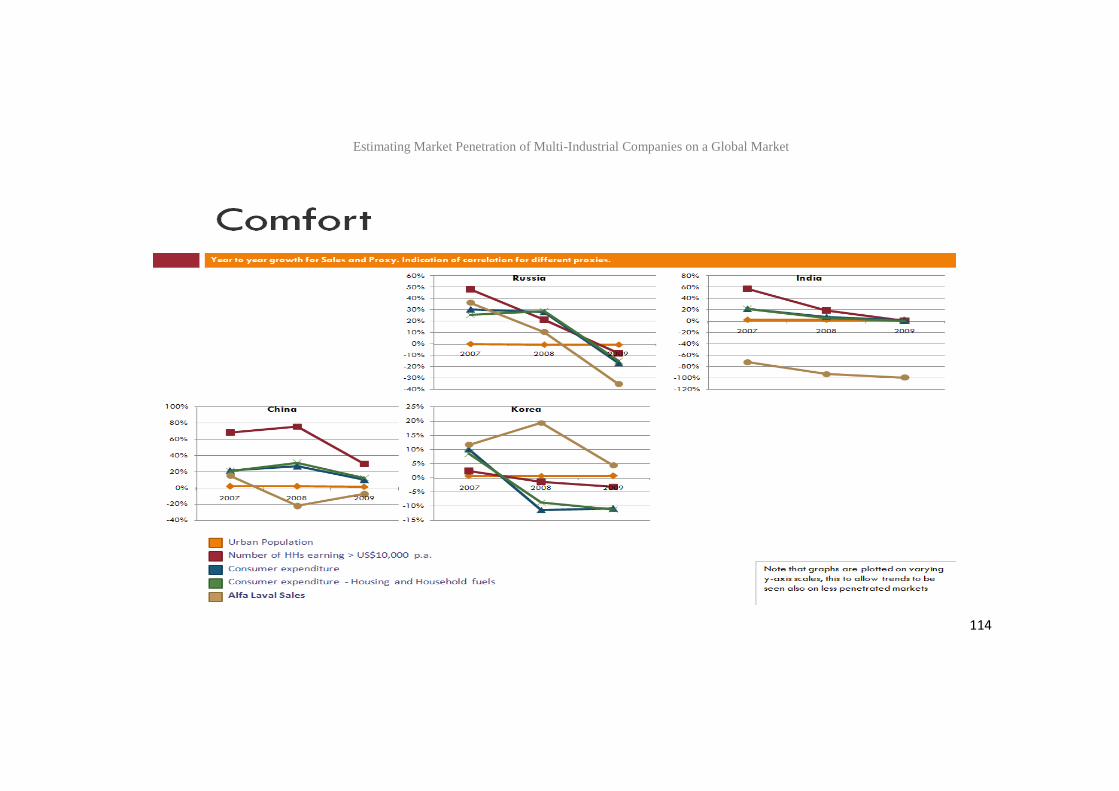
Estimating Market Penetration of Multi-Industrial Companies on a Global Market
114

Estimating Market Penetration of Multi-Industrial Companies on a Global Market
115
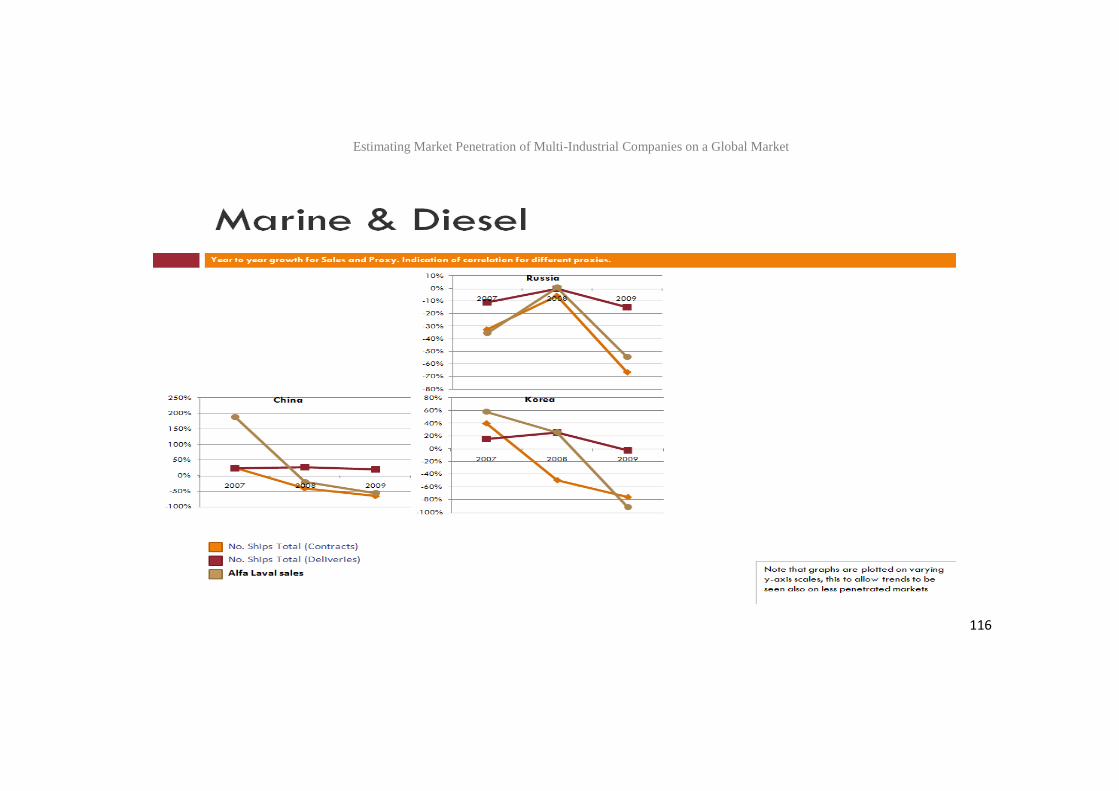
Estimating Market Penetration of Multi-Industrial Companies on a Global Market
116

Estimating Market Penetration of Multi-Industrial Companies on a Global Market
117
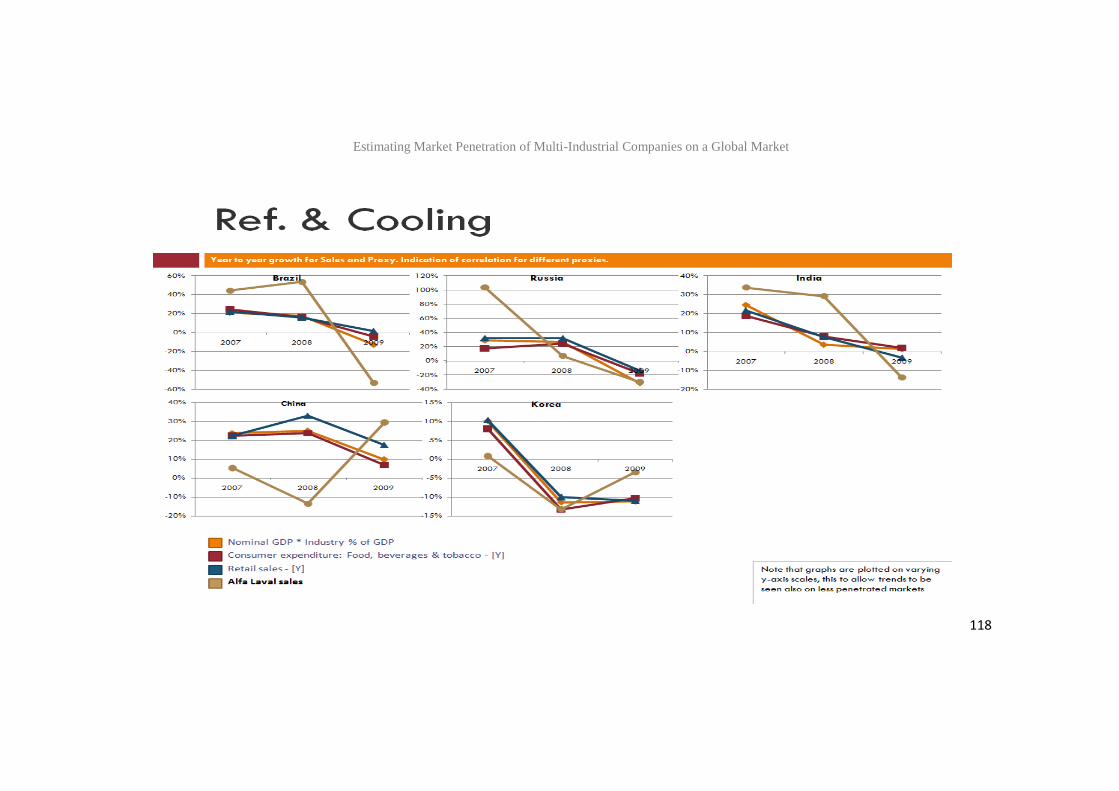
Estimating Market Penetration of Multi-Industrial Companies on a Global Market
118
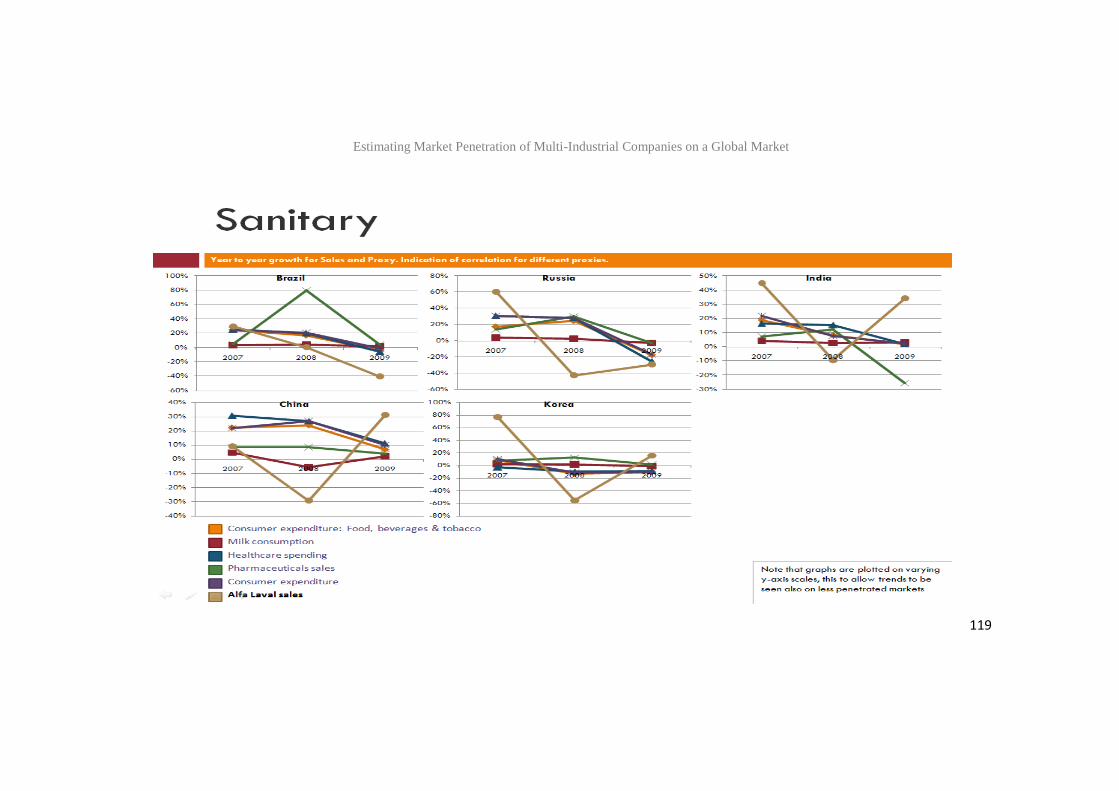
Estimating Market Penetration of Multi-Industrial Companies on a Global Market
119
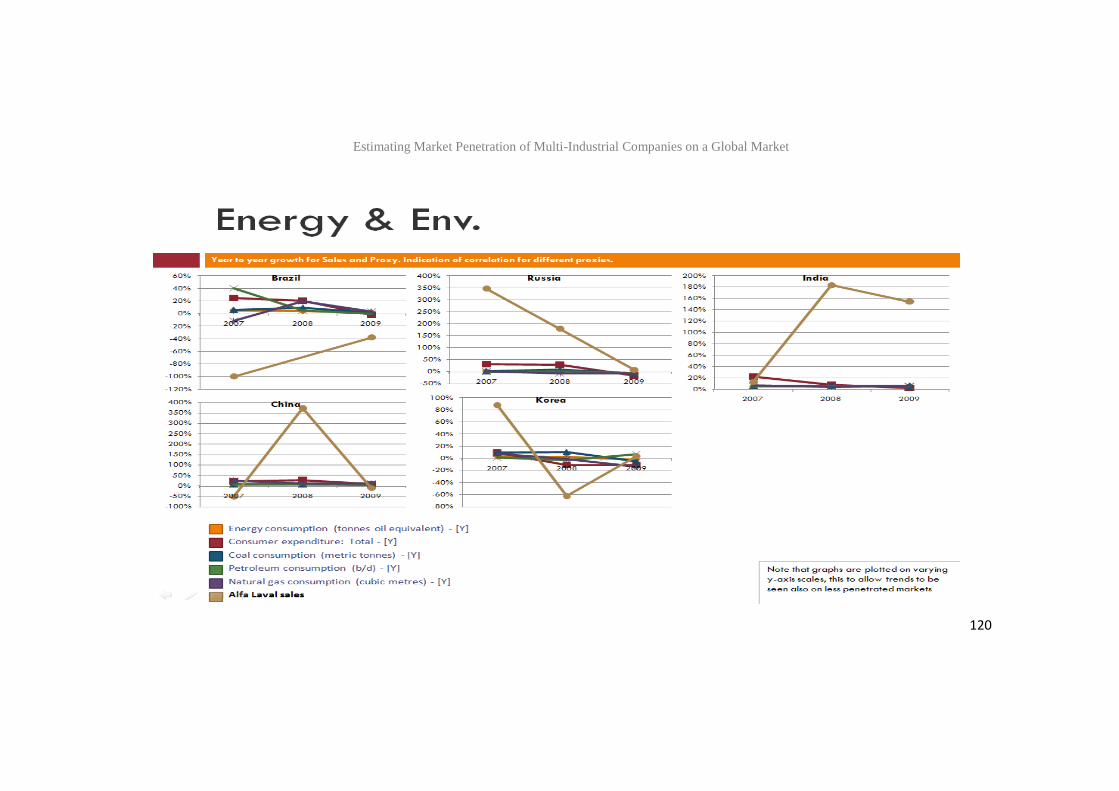
Estimating Market Penetration of Multi-Industrial Companies on a Global Market
120

Estimating Market Penetration of Multi-Industrial Companies on a Global Market
121
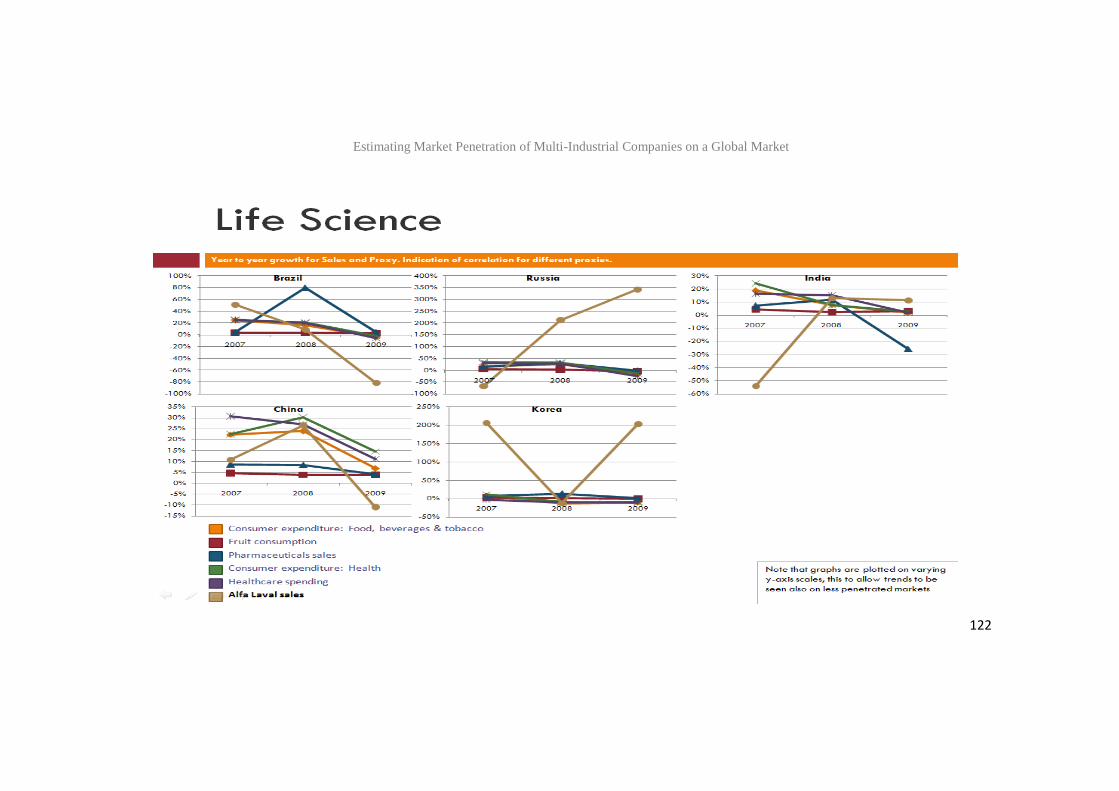
Estimating Market Penetration of Multi-Industrial Companies on a Global Market
122

Estimating Market Penetration of Multi-Industrial Companies on a Global Market
123

Estimating Market Penetration of Multi-Industrial Companies on a Global Market
124

Estimating Market Penetration of Multi-Industrial Companies on a Global Market
125
11.11 Appendix D3– Overview Per country
11.11.1 How to read the graphs
A segment in this quadrant has an average penetration above average and has experienced an increase in penetration since 2007.
A segment in this quadrant has an average penetration above average but has experienced a decrease in penetration since 2007.
A segment in this quadrant has an average penetration below average but has experienced an increase in penetration since 2007.
A segment in this quadrant has an average penetration below average and has experienced a decrease in penetration since 2007.

Estimating Market Penetration of Multi-Industrial Companies on a Global Market
126
Process Industry
Fluids & Utility
Ref & Cooling
OEM Equipment
Sanitary Energy & Environment
Food technology
Life Science
-200%
-100%
0%
100%
200%
300%
400%
500%
600%
-700% -500% -300% -100% 100% 300% 500%
Ave
rage
Pen
etra
tio
n 2
00
9 r
elat
ive
to w
orl
d A
vg.
Change in penetration 2007-2009 in % units
Brazil

Estimating Market Penetration of Multi-Industrial Companies on a Global Market
127
Comfort
Fluids & Utility
Marine & Diesel
OEM Equipment
Refigeration & Cooling
Sanitary
Process Industry
Energy & Environment
Food Technology
Life science
-200%
-100%
0%
100%
200%
300%
400%
500%
600%
-700% -500% -300% -100% 100% 300% 500%
Ave
rage
Pen
etra
tio
n 2
00
9 r
elat
ive
to w
orl
d A
vg.
Change in penetration 2007-2009 in % units
Russia

Estimating Market Penetration of Multi-Industrial Companies on a Global Market
128
Fluids & Utility
OEM Equipment
Refrigeration & Cooling
Sanitary
Process Industry
Energy & Environment
Food Technology
Life science
-200%
-100%
0%
100%
200%
300%
400%
500%
600%
-700% -500% -300% -100% 100% 300% 500%
Ave
rage
Pen
etra
tio
n 2
00
9 r
elat
ive
to w
orl
d A
vg.
Change in penetration 2007-2009 in % units
India
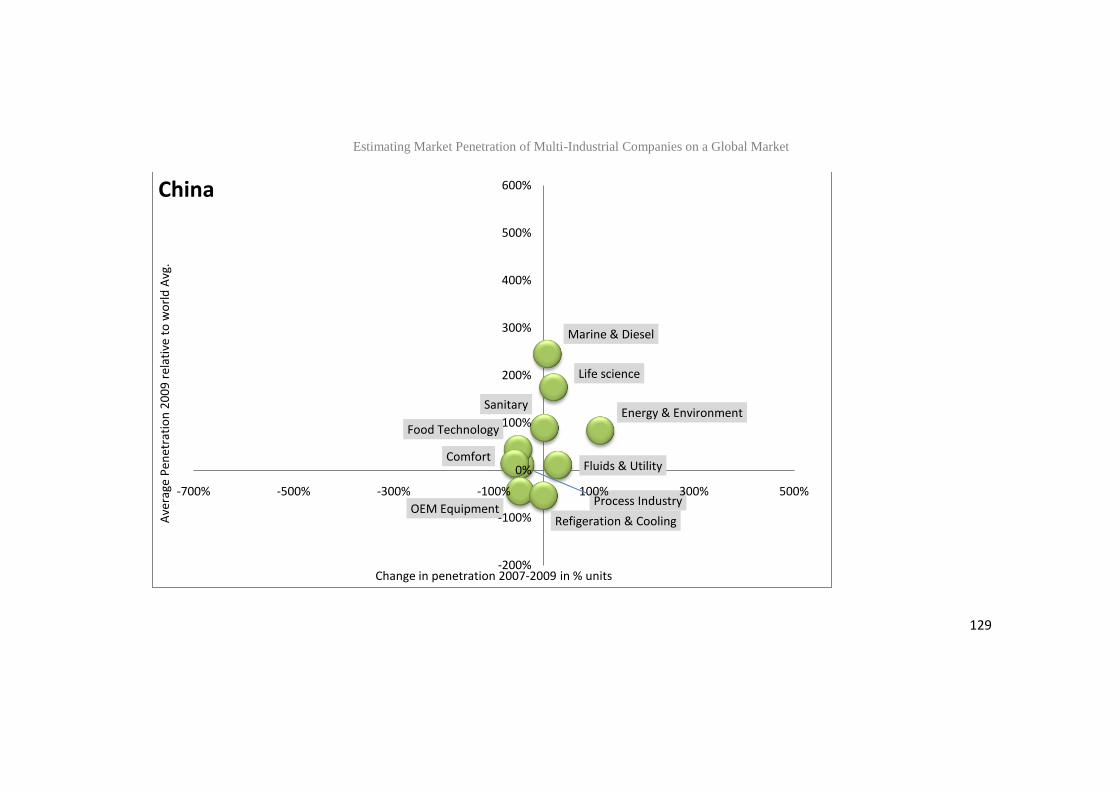
Estimating Market Penetration of Multi-Industrial Companies on a Global Market
129
Process Industry
Food Technology
ComfortFluids & Utility
Marine & Diesel
OEM EquipmentRefigeration & Cooling
SanitaryEnergy & Environment
Life science
-200%
-100%
0%
100%
200%
300%
400%
500%
600%
-700% -500% -300% -100% 100% 300% 500%
Ave
rage
Pen
etra
tio
n 2
00
9 r
elat
ive
to w
orl
d A
vg.
Change in penetration 2007-2009 in % units
China

Estimating Market Penetration of Multi-Industrial Companies on a Global Market
130
Process Industry
Comfort
Fluids & Utility
Marine & Diesel
OEM Equipment
Refigeration & Cooling
SanitaryEnergy & Environment
Food Technology
Life science
-200%
-100%
0%
100%
200%
300%
400%
500%
600%
-700% -500% -300% -100% 100% 300% 500%
Ave
rage
Pen
etra
tio
n 2
00
9 r
elat
ive
to w
orl
d A
vg.
Change in penetration 2007-2009 in % units
Korea