Embed Size (px)
Citation preview
Preliminary draft, do not quote
Estimating Hong Kong Re-export Markups and Reconciling Trade
Statistics from China, Hong Kong and Their Major Trading Partners -- A Mathematical Programming Approach1
Zhi Wang
United States International Trade Commission
Mark Gehlhar United States Department of Agriculture
Shunli Yao
China Center for Economic Research, Peking University
May 2006
ABSTRACT This paper develops a mathematical programming model to simultaneously estimate re-export markups and reconcile bilateral trade statistics between China, Hong Kong, and their trading partners. The model is applied to sector level trade flows to resolve discrepant reporting in an efficient manner. Adjustments in trade flows are based upon statistical reporter’s reliability information. The program is implemented in GAMS and retains many desirable theoretical and empirical properties. Estimates are used for generating trade flows and markups for Hong Kong’s re-exports used in the forthcoming version 7 GTAP database. The model’s flexibility has potential for expanded use in other regions where re-exports and associated markup cause discrepant trade flows. JEL Classification Numbers: F1, C61, C81 Paper prepared for presentation at the 9th GTAP conference
1 The views expressed in this paper are those of the authors and do not represent the opinions of the institutions with which they are affiliated.
1

TABLE OF CONTENTS I. Introduction II. The Mathematical Programming Model
Reconcile international trade statistics as an estimation problem solved by constrained matrix procedures
General Assumptions and Mathematical Notations
Eastbound flows: China and Hong Kong exports, partner imports
Westbound flows: China and Hong Kong imports, partner exports
China-Hong Kong bilateral trade Global balance and objective function Properties of the reconciliation model
III. Link the Model with Trade Statistics from the Real World
Obtain initial estimates for all bilateral trade variables in the model from observed or derived trade statistics
Calculate initial Hong Kong re-export markups Bilateral trade cost and estimates of fob/cif margins Determine appropriate country and commodity aggregation level based on the issue at hand and data availability
The choice and estimation of reliability weights IV. Preliminary Results from the Model Adjusted Hong Kong re-export markup rate Hong Kong re-exports earnings and retained imports Adjusted China’s balance of trade at sector level V. Concluding Remarks
2

I. Introduction
The U.S. Department of Commerce reported U.S. a trade deficit with China at $201.6 billion in 2005, while according to statistics provided by China's customs China’s trade surplus with the United States was $114.2 billion, 57 percent of what the United States reported. The apparent inconsistency between China and their partner’s reported trade statistics was once again brought into the spotlight. Discrepancies in reported trade between the United States and China were first noticeable in the early 1980s. In 1982, for example, Chinese statistics showed the country had a trade deficit about US$2 billion with the United States while the U.S. reported it had accumulated a surplus with China of only US$403 million. In 1983, according to U.S. statistics, the United States started to show a trade deficit with China and it grew to $10 billion by 1990. According to Chinese Customs, however, China had a trade deficit with the United States up until 1992, turning to surplus only in 1993. As China takes a lead role as a global trading nation, the statistical discrepancy has widened dramatically. The widening gap is attracting growing attention from popular media, government agencies, and academics around the world. One of the primary reasons for statistical discrepancies is the intermediary role of Hong Kong in China’s external trade. A large share of China’s trade with the world passes through Hong Kong, while current reporting practices in China and their trading partners do not fully reflect this fact. This creates a misleading picture of the origin and final destination of Chinese exports and imports, leading to conflicting official bilateral trade balances. China began to identify the final destinations of its goods shipped through Hong Kong in 1993, but the work is incomplete. This is in part because traders often do not know the final destinations when goods leave China. In these cases, they are recorded as exports to Hong Kong by the Chinese Customs. For this reason, in Chinese customs statistics Hong Kong is one of China’s largest export destinations second to the Unites States. In fact, Hong Kong re-exports most its imports from China to other countries. The initial investigation of this problem was conducted by the trade and investment working group under the China-U.S. Joint Commission on Commence and Trade (JCCT) in 1995. The report concluded that although “there are some differences in the statistical concepts and definitions used by the two countries,” “the effects of these differences are small,” and the shipment of goods via Hong Kong and other intermediate countries are the major cause of the statistical discrepancy, because the final destination frequently is unknown at the time the goods leave China, and “when goods of Chinese origin arrive in the United States, the entire value, including any markup (either simple markup or from further processing) by intermediates, is attributed to China.” 2 Similar studies were also conducted by Statistics Canada on Canada-China bilateral merchandise trade from 1998 to 2003. It also identified indirect trade via Hong Kong and other countries as the main
2 JCCT, Report of the “Trade Statistics Subgroup”, Washington, DC, October 17, 1995, p. 2.
3

source of discrepancy between Canadian and Chinese trade statistics in both directions.3 Fung and Lau (1998, 2001, 2003, 2004) conducted a series of studies to adjust official trade data reported by China and the United States. Their central claim is that neither the U.S. nor the Chinese official trade data are complete accurate in terms of reflecting the true bilateral situation similar to the JCCT report and suggested three necessary adjustments to arrive comparable measurements of the bilateral balance of merchandise trade.4 Feenstra et al. (1999) developed a methodology to estimate Hong Kong’s re-export markup and found that the U.S. official statistics count the total value of re-exports from Hong Kong originated in China as China’s exports thereby ignoring the value-added in Hong Kong. This tends to overestimate U.S. trade deficit with China. China’s trade statistics do not count all of its exports destined for the U.S. via Hong Kong, therefore it tends to underestimate its trade surplus with the United States. The study showed that with proper adjustment for value added in Hong Kong on re-export for Chinese goods it reduced (on average) 91 percent of the discrepancy between the official US and China statistics on US-China trade balance for the 1988 to 1996 period. Schindler and Beckett (2005) extend Fung and Lau and Feenstra et al.’s method to adjust China’s bilateral trade with its 69 trading partners. They found that China’s trade surplus is larger than indicated in China’s official statistics but significantly smaller than the statistics of its trading partners and the majority of the discrepancy is due to the role of Hong Kong as an intermediary in China’s external trade. The literature to date consistently shows that the re-export activities in Hong Kong are the major contributing factor to the statistical discrepancy. However, there has not been a comprehensive approach fully utilizing official trade statistics from China, Hong Kong and their trading partners simultaneously in a consistent optimization framework. Constructing such a framework will not only provide an effective tool to reconcile China’s trade with its partners systematically, help policy makers and the public better understand China’s role in world trade, but also contributes to the methodological development for reconciling discrepancies in international trade statistics when transshipment and re-export activities become increasingly important and heavily diminish the ability of a country identifying its correct partner countries. The objective of this paper is two-fold: first to develop and implement a formal model to estimate Hong Kong re-export markup and reconcile trade statistics from China, Hong Kong and their partners simultaneously in a consistent optimization framework, second to apply the model to 2004 bilateral world trade data in GTAP sector classification to produce Hong Kong re-exports adjusted trade flows contributing to version 7 GTAP database. In doing so, we further demonstrate the usefulness of such model in the preparation of consistent global trade data for future versions of GTAP database.
3 International Trade Division, Statistics Canada, “Merchandise Trade Reconciliation Study: Canada-China, 2002 and 2003.” Ottawa, August 2005. 4 These adjustments are: (1) Freight along side (f.a.s.) – free on board (f.o.b) and cost, insurance and freight (c.i.f.), (2) re-exports through Hong Kong, (3) re-export markups by Hong Kong middlemen.
4

The paper is organized as follows. Section two specifies the optimization framework and discusses its theoretical and empirical properties. Section three outlines the major steps to implement the model with real world trade statistics, including the preparation of initial fob/cif ratio and Hong Kong’s re-export markup estimates, aggregation issues and the choice and estimation of reliability weights for major variables in the model. Preliminary results from the model for 2004 at GTAP sector classification are presented and discussed in section four. The paper concludes with a discussion of future research directions. II. The Mathematical Programming Model 2.1 Reconcile international trade statistics as an estimation problem solved by constrained matrix balancing procedures Reconciling international trade statistics in an optimization framework is an application of the constrained matrix balancing procedure5 (Bacharach, 1970) to solve over determined estimation problems. It involves obtaining best estimates of conflicting data from more than one source. Procedures for matrix balancing can be classified into two broad classes -- bi-proportional scaling and mathematical programming. The scaling methods are based on the adjustments of the initial matrix by multiplying its row and column by positive constants until the matrix is balanced. It was developed by Stone and other members of the Cambridge Growth Project (Stone et al., 1963) and is usually known as RAS. The basic method was originally applied to known row and column totals but had been extended to cases where the totals themselves are not known with certainty (Senesen and Bates, 1988; Lahr, 2001). Mathematical programming methods are explicitly based on a constrained optimization framework, usually minimizing a penalty function, which measures the deviation of the balanced matrix from the initial matrix subject to a set of balance conditions. 5The constrained matrix balancing procedure appears as a core mathematical structure in diverse applications. These applications include the estimation of input-output tables (Bachem and Korte, 1981; Harrigan and Buchanan, 1984; Miller and Blair, 1985; Kaneko, 1988; Nagurney, 1989; Antonello, 1990) and inter-regional trade flows in regional science (Batten, 1982; Byron et al., 1993), balancing of social/national accounts in economics (Byron, 1978; Van der Ploeg, 1982, 1984,1988; Zenios, Drud, and Mulvey, 1989; Nagurney, Kim, and Robinson, 1990), estimating interregional migration in demography (Plane, 1982), the analysis of voting patterns in political science (Johnson, Hay, and Taylor, 1982), the treatment of census data and estimation of contingency tables in statistics (Friedlander, 1961), the estimation of transition probabilities in stochastic modeling (Theil and Rey, 1966), and the projection of traffic within telecommunication and transportation networks (Florian, 1986; Klincewicz, 1989). A survey of this literature can be found in Schneider and Zenios (1990).
5

An important advantage of mathematical programming models over scaling methods is its flexibility. It allows a wide range of initial information to be used efficiently in the data adjustment process. Additional constraints can be easily imposed, such as allowing precise upper and lower bounds to be placed on unknown elements. Inequality conditions or incorporating an associated term in the objective function are used to penalize deviations from the initial row or column total estimates when they are not known with certainty. Therefore, the mathematical programming approach provides more flexibility to the matrix balancing procedure. This flexibility is very important in terms of improving the information content of the balanced estimates as shown by Robinson, Cattaneo and El-said (2001). The mathematical programming approach also permits one to routinely introduce relative degrees of reliability for initial estimates. The idea of including data reliability in matrix balancing can be traced over a half century to Richard Stone and his colleagues (1942) when they explored procedures for compiling national income accounts. Their ideas were formalized into a mathematical procedure to balance the system of accounts after assigning reliability weights to each entry in the system. The minimization of the sum of squares of the adjustments between initial and balanced entries in the system, weighted by the reliabilities or the reciprocal of the variances of the entries is carried out subject to linear (accounting) constraints. This approach had first been implemented by Byron (1978) and applied to the System of National Accounts of the UK by Ploeg (1982, 1984). Zenios and his collaborators (1989) further extended this approach to balance a large social accounting matrix in a nonlinear network-programming framework. Robinson and his colleagues (2001) provided a way to handle measurement error in cross entropy minimization via an error-in-variables formulation. Although computational burden is no longer a problem today, the difficulty of estimating the error variances in a large data set by such approaches still remains unsolved. There is a large and growing literature on the use of matrix balancing procedures to estimate input/output tables or Social Accounting Matrix (SAM), but only few studies have used them to adjust/estimate bilateral trade statistics6. There are significant differences in the conditions for adjusting an unbalanced SAM and reconciling bilateral trade data, although there are similarities in terms of the general optimization framework and algorithms. First, SAMs are square matrix with their rows and columns represent the same accounts, so that all their row sums equal to corresponding column sums. While bilateral trade statistics are usually in the form of rectangular matrix, and their row and column sum represent different types of account (for example, reporter and partner sums or export and import totals),
6 Waelbroeck(1964) applied the RAS procedure on trade flows for the world with the flows grouped into nine regions. Using 1938 trade flows as base, he estimated 1948, 1951-52, and 1959-60 trade flows. Mohr, Crown and Polenske (1987) discussed the problems encountered when the RAS procedure is used to adjust trade flow data. They pointed out that the special properties of interregional trade data increase the likelihood of non-convergence of the RAS procedure and proposed a linear programming approach that incorporates exogenous information to override the infeasibility of RAS problem.
6

therefore do not equal each other in general. Second, all SAMs usually have similar structure in terms of their zero and nonzero elements, while this structure may differ significantly from region to region in trade matrix, depending on the dominant trade pattern in the region under concern. Finally, in SAMs estimates of the same entries can often be obtained from income, expenditure or production data, and typically data gathered from one source is not consistent with that obtained from a different source. The common practice in removing the account inconsistencies is by assigning relative degrees of reliability to entries in the SAM and use constrained matrix balancing procedures with available information to adjust the data to ensure consistency in the accounts. While international trade statistics are often obtained from two or more sources, reporting countries and their partner’s official trade flow statistics. In most cases, even with apparently "good" data from both sides, the discrepancies can be significant. This is because the exporter and importer may have very different reporting criteria and systems for valuation of bilateral trade. For example, the initial destination of a shipment may not be sole and the actual destination of its components; and the importer may not be able to assign a unique origin. Because international trade statistics are inherently inconsistent, a systematic procedure is needed to ensure the balance between imports and exports of multiple partners. The TESSY (trade estimation system) used by UNSTAT is unique being the first mathematical procedure to find estimates of trade data by commodity and partner for non-reporting countries. It can calculate estimates for all the missing values in trade matrix, including missing commodity totals, partner totals. By scaling and re-scaling those estimates other than the "true reported" figures, a balanced trade matrix can be achieved. Baras and Panoutsopoulos (1993) developed a progressive elimination and quadratic programming procedure to estimate missing value in bilateral trade flows. They tested their procedure by using several selected countries. This was done in the case of only the commodity and partner totals was given and certain entries in the bilateral trade matrix are also known. Unfortunately, they devoted most of their efforts to fill the missing values in the trade matrix, did not pay any attention to how the reliability information regarding the initial trade statistics should be incorporated into the adjustment process. In addition, this approach has little to offer for dealing with the increasingly important phenomena of entrepot trade and transshipments. To the best of our knowledge, the formulation of international trade statistics reconciliation problem into an optimization framework in the context of China’s trade with other nations via Hong Kong in this paper is the first attempt of this kind in both international trade and constrained matrix balance literature to date, which we now turn to. 2.2 General Assumptions and Mathematical Notations Consider China and Hong Kong both engage in bilateral trade with N partner countries and each other on M commodities for time period T. Hong Kong is the only entrepot between China and the N partner countries engaging re-export activities to transship both China’s and its N partner countries’ exports to each others. Hong Kong earns a markup by conducting such activities. This is basically the difference between the price Hong Kong buys goods and what it sells the same goods for. All partner countries except one report their exports to and imports from China and Hong Kong. China and Hong Kong also report their exports to and imports from all their partner countries and trade flows
7

between them. In addition, Hong Kong reports the origin and destination of all commodities it re-exports bound for and coming from China and other partner countries. The markup from such activities is unreported, thus it must be estimated. Assuming all reporting countries, including China, can correctly identify the country of origin of their imports, the imports are directly from the partners or indirectly from Hong Kong. Reporters however can not determine the final destination when exports leave their ports (Schindler and Beckett, 2005). The notation used to describe the reported trade statistics and their relationships are as follows (expressed in annual values in this paper):
sritDX = Direct exports of commodity ‘i’ from country ‘s’ to country ‘r’ at time ‘t’.
For ‘s’ equals Hong Kong, it is domestic exports including earnings from re-export that commodity. For ‘r’ equals Hong Kong, it is partner countries’ exports remain in Hong Kong
sritRX = Indirect exports of commodity ‘i’via Hong Kong from origin country ‘s’
to destination country ‘r’ at time ‘t’, including Hong Kong’s re-export earnings sritTX = Total or actual exports of commodity ‘i’ from country ‘s’ to country ‘r’ at
time ‘t’. For ‘s’ equals Hong Kong, it is its domestic exports plus re-exports sritDM = Direct imports of commodity ‘i’ by country ‘r’ from country ‘s’ at time
‘t’. For ‘r’ equals Hong Kong, it is imports for domestic use, for “s” equals Hong Kong it is partner’s imports originated from Hong Kong
sritTM = Total imports of commodity ‘i’ by country ‘s’ from country ‘r’ at time
‘t’. sritRXM = Hong Kong markup earnings by re-export commodity ‘i’ originated
from country ‘s’ to final destination country ‘r’ at time ‘t’ sitWEX = Total exports of commodity ‘i’ to the world by country ‘s’ at time “t”,
including both direct and indirect exports to all countries ritWMX = Total imports of commodity ‘i’ from the world by country ‘r’ at time
“t”, including both direct and indirect imports from all countries ritXER = Statistical discrepancy of commodity ‘i’ in China and Hong Kong’s east
bound trade with partner country ‘r’ at time ‘t’ ritMER = Statistical discrepancy of commodity ‘i’ in China and Hong Kong’s west
bound trade with partner country ‘r’ at time ‘t’ sr
itcif = fob/cif ratio for commodity ‘i’ shipped from country ‘s’ to country ‘r’ at time ‘t’. It is a fixed parameter in the model.
Indices ‘i’ defined over commodity set I ∈{1, 2, …, M}, indices ‘s’ and ‘r’ defined over country set W ∈{1, 2, …, N, CH, HK}. All the trade flow variables have directions. The first superscripts always indicate the source country and the second always refer to destination countries. For exports (DX and TX), source country are the reporter, while for
8

imports (DM and TM), destination country are the reporter. Exports are valued at fob basis, imports are valued at cif basis. Using notations defined above, the following 16 accounting identities describe the
.3 Eastbound flows: China and Hong Kong exports, partner imports
or all r ∈{1, 2, …, N} and all s ∈{1, 2, …, N, CH}:
(1)
quation (1) states that the sum of any particular partner’s imports of China and Hong
,,,,, )( +−= (2)
quation (2) defines that China’s total exports to a particular partner equal China’s direct
(3)
quation (3) defines that Hong Kong’s domestic exports to a particular partner equals to
relationship among bilateral trade flow statistics reported by China, Hong Kong and their partner countries. 2 F EKong originated products after fob/cif adjustment should equal to the sum of China’s total exports and Hong Kong’s domestic exports to that partner, plus a statistical discrepancy.
rCHit
rCHit
rCHit
HKCHit
rCHit DXRXMRXcif TX
Eexports plus Hong Kong’s re-exports for China to that partner minus Hong Kong’s re-export makeup adjusted by China-Hong Kong fob/cif ratio.
∑ −−=s
srit
srit
rHKit
rHKit RXMRXTXDX )(,,
Eits total exports to that partner minus its re-exports for all other countries to the particular partner and plus its markup earnings from re-exports7.
rHKit
rsrit
sritrHK
itrHK
it cifRXMRX
TMDM ,,, )(∑ −−= (4)
quation (4) indicates partner’s imports of Hong Kong’s domestic products equals
Epartners’ total imports from Hong Kong minus Hong Kong’s re-exports to the partner from all sources adjusted by Hong Kong re-export markup and fob/cif ratio from Hong Kong to the partner.
rHKit
rHKitititititit DMcifTMcif XERDXTX ,,+=++ rCHrCHrrHKrCH ,,,,
7 The definition of this variable is different with domestic exports statistics published by Hong Kong authority, which is total exports minus re-exports without adjustment for markup.
9

rCHit
rCHit
rCHit
HKCHitrCH
itrCH
it cifRXMRXcif
TMDM ,
,,,,, )( −−= (5)
Equation (5) indicates that partner’s direct imports from China equals its total imports from China minus Hong Kong’s re-exports for China to that partner adjusted by Hong Kong’s re-exports markup and China to Hong Kong and China to partner cif/fob ratios. 2.4 Westbound flows: China and Hong Kong imports, partner exports For all s ∈{1, 2, …, N} and all r ∈{1, 2, …, N, CH}:
∑ =−−+=++
N
rsrit
srit
HKsit
HKsit
CHsit
sit
HKsit
HKsit
CHsit
CHsit RXMRXcifTX DXMERDMcifTM
1,,,,,,, )(cif
(6) Equation (6) states that the sum of China and Hong Kong’s total imports of products originated from any particular partner after fob/cif adjustment should equal to the sum of that partner’s direct exports to China and its total exports to Hong Kong, minus its re-exports via Hong Kong to other countries other than China plus a statistical discrepancy.
∑∑ −−=r
sritr
srit
HKsit
HKsit RXMRXTMDM )(,, (7)
Equation (7) requires Hong Kong’s domestic use of imports plus its re-exports for a particular partner minus re-exports markup equals Hong Kong’s total imports from that partner country.
CHsit
CHsit
CHsit
HKsitCHs
itCHs
it cifRXMRXcif TMDM ,
,,,,, )( −
−= (8)
Equation (8) defines that China’s direct imports from a partner equal China’s total imports from that partner plus Hong Kong’s re-exports to China for that partner minus Hong Kong’s re-export earnings adjusted by partner to Hong Kong and partner to China fob/cif ratios.
)( ,,,,, CHsit
CHsit
HKsit
CHsit
CHsit RXMRXcif DXTX −+= (9)
Equation (9) reveals that partner’s total exports to China equals partner’s direct exports to China plus Hong Kong’s re-exports to China for that partner adjust by Hong Kong’s re-export markup and partner to Hong Kong’s fob/cif ratio.
∑ −−=r
srit
srit
HKsit
HKsit
HKsit RXMRXcifTXDX )(,,, (10)
Equation (10) defines that a partner’s exports to Hong Kong for Hong Kong domestic use equals its total export to Hong Kong minus its re-exports via Hong Kong to all
10

destinations adjust by Hong Kong’s re-export markup and partner to Hong Kong’s fob/cif ratio. 2.5 China-Hong Kong bilateral trade
∑ −−=r
rCHit
rCHit
HKCHit
HKCHit
HKCHit RXMRXcifDX TX )( ,,,,, (11)
∑ −−=
rCHs
itCHs
itCHHK
itCHHK
it RXMRXTX DX )( ,,,, (12) Equation (11) defines that China’s actual exports to Hong Kong for Hong Kong domestic use equals its direct exports to Hong Kong minus Hong Kong’s re-exports for China to all other trading partners adjusted by Hong Kong re-exports markup and China to Hong Kong fob/cif ratio. Equation (12) defines that Hong Kong’s domestic exports to China equals its total exports to China minus its re-exports to China from all other partners adjust by its markup earnings.
∑ −−=r
rCHit
rCHit
HKCHit
HKCHit RXMRXTM DM )( ,,,, (13)
CHHKit
CHsitr
CHsitCHHK
itCHHK
it cifRXMRX
DMTM ,
,,,, )( −
+= ∑ (14)
Equations (13) defines Hong Kong’s imports from China for domestic use equals its total imports from China minus its re-exports for China to all destinations adjusted by its markup earnings. While equation (14) defines China’s total imports from Hong Kong equals its imports of goods with Hong Kong origin plus Hong Kong’s re-exports to China from all sources adjusted by re-exports markup and Hong Kong to China fob/cif ratio. 2.6 Global balance and objective function For all r ∈{1, 2, …, N, CH, HK}:
(15)
WEXWEX =DXTX CHit
HKitr
rHKitr
rCHit ++∑∑ ,,
(16)
WMXWMX =DMRXMRXTM CHit
HKitr
HKsits r
srit
sritr
CHsit ++−+ ∑∑ ∑∑ ,, )(
Equation (15) states that the sum of after adjustment actual exports from China and Hong Kong to all its partners should still equal to the sum of their reported total exports to the world. It means the adjustment made by the model do not change the total exports to the world reported by China and Hong Kong, it merely estimate Hong Kong’s re-export markup and rearrange the destinations of China’s exports. Equation (16) states that China and Hong Kong’s imports and Hong Kong’s re-exports minus re-exports markup after
11

adjustment should still equal to the sum of China and Hong Kong’s total imports from the world. The adjustments made by the model only change the markup estimates and rearrange the sources of China and Hong Kong’s imports. In addition, China and Hong Kong’s total exports to and imports from the world should satisfy following conditions: total world exports by all trading countries equals total world imports after fob/cif adjustment.
∑=∑ rrit
rits
sit WMXcifWEX (17)
Given above clearly defined accounting relationship among trade flow statistics, what remains to mathematically formulate the reconciliation problem in an optimization framework is the construction of a criteria for changing the reported statistics to conform the know linear accounting constraints. Either a cross-entropy (Harrigan & Buchanan, 1984, Golan et al., 1994) or a quadratic objective penalty function can be specified. We choose to use a quadratic function as follows for computation efficiency reasons8:
⎪⎪⎪⎪
⎭
⎪⎪⎪⎪
⎬
⎫
⎪⎪⎪⎪
⎩
⎪⎪⎪⎪
⎨
⎧
∑ +∑+∑ ∑ ∑ ∑+
∑ ∑ ∑ ∑+∑ ∑ ∑ ∑+
∑ ∑ ∑ ∑+∑ ∑ ∑ ∑
∈∈ ∈ ∈
∈ ∈ ∈∈ ∈ ∈
∈ ∈ ∈∈ ∈ ∈
t itMi
ittmi Ws Wr
srit
2srit
srit
tmi Ws Wr
srit
2srit
srit
tMi Ws Wr
srit
2srit
srit
tmi Ws Wr
srit
2srit
srit
tMi Ws Wr
srit
2srit
srit
merxerwrxm
)RXM -RXM (
wtm)TM -TM (
wtx)TX -TX (
wdm)DM -DM (
wdx)DX -DX (
21 =SMin
)22(
0
00
00
(18)
Where variables with a 0 in the end denote initial estimates for that variable, and an additional “w” before the variable in lower case indicates the reliability measure for that variable. In short, the reconciliation problem is to modify a given set of bilateral trade flow statistics with equation (18) as objective function and equations (1) to (16) as constraints. 2.7 Properties of the reconciliation model There are desirable analytical properties of the optimization model specified above. Firstly, it is a separable nonlinear programming problem subject to linear constraints. There are different statistical interpretations underlying the model by choices of different reliability weights. When weights are all equal to one, the solution of this model gives a constrained 8 The quadratic function has a numerical advantage in implementing the model. It is easier to solve than the entropy function in very large models because they can use software specifically designed for quadratic programming. As showed by Canning and Wang (2005), the quadratic function is equivalent to the entropy function in the neighborhood of initial estimates, under a properly selected weighing scheme.
12

least square estimator. When initial estimates are taken as the weights, the solution of the model gives a weighted constrained least square estimator, which is identical to the Friedlander-solution, and a good approximation of the RAS solution. If the weights are proportional to the variances of the initial estimates and the initial estimates are statistically independent, the solution of the model yields best linear unbiased estimates of the true unknown matrix (Byron, 1978), which is identical to the Generalized Least Squares estimator if the weights are equal to the variance of initial estimates (Stone, 1984, Ploeg, 1984). Furthermore, as noted by Stone et al. (1942) and proven by Weale (1985), in cases where the error distributions of the initial estimates are normal, the solution also satisfies the maximum likelihood criteria. Secondly, the estimates of markups and trade flow adjustments are made in a consistent simultaneous manner. The model re-directs sources and destinations of China’s and Hong Kong’s exports and imports, estimates Hong Kong’s re-export markup, allocates statistical discrepancies to trade flows among China, Hong Kong and their trading partners, and adjust bilateral trade balance for China and all its partners simultaneously. In doing so it imposes global consistency to the adjusted trade flow data, which is a necessary condition for any world trade data set can be used for global general equilibrium trade policy analysis. Thirdly, as proven by Harrigan (1990), in all but the trivial case, the adjusted estimates derived from entropy or quadratic loss function will always better approximate the unknown true values than do the associated initial estimates. This is because adding valid constraints or further restricting the feasible set through the narrowing of interval constraints cannot move the adjusted estimates away from the true values, unless the additional constraints are non-binding (have no information value). The optimization process has the effect of reducing, or at least not increasing, the variance of the estimates. This property is simple to show by using matrix notation. Define W as the variance matrix of initial estimates D , A as the coefficient matrix of all linear constraints. The least squares solution (equivalent to the quadratic minimand as noted above) to the problem of adjusting D to D that satisfies the linear constraint, A•D = 0 can be written as: D = (I - WAT(AWAT)-1A) D (19) Thus, var(D) = (I - WAT(AWAT)-1A)W = W - WAT(AWAT)-1A)W (20) Since WAT(AWAT)-1A)W is a positive semi-definite matrix, the variance of adjusted estimates will always be less, or at least not greater than the variance of the initial estimates as long as A•D = 0 holds. This is the fundamental reason why such a reconciliation framework will provide better adjusted trade statistics. Imposing equation (1) to (16) will definitely improve, or at least not worsen the initial statistics, since we are sure from international economics that those constraints are consistency requirements and must be true for any well defined trade statistics.
13

Finally, the choice of weights ( ) in the objective function has very important impacts on the model solution. The model uses these weights to determine by how much an initial estimate may be changed. For instance, using the initial trade statistics as weights has the advantage that each entry of the trade flow data is adjusted in proportion to its magnitude in order to satisfy those consistency constraints. The variables can not change signs and the larger the trade flows the more adjustment takes place. However, the adjustment relates directly to the size of the initial trade statistics
srit
srit
srit
srit
srit wrxmwtmwdmwtxwdx ,,,,,
, and does not force the unreliable trade data to absorb the bulk of the required adjustment. Furthermore, only under the assumptions: (1) the initial estimates for different trade flows are statistically independent, and (2) each error variance is proportional to the corresponding initial estimates, this commonly used weighing scheme (underlying RAS) can obtain best unbiased estimates, while those assumptions often not hold for the international trade data. Therefore, the efficiency of the model will be improved if the error structure of the initial trade statistics is available. Because using such a weighting scheme makes the adjustment independent of the size of the initial trade data. The larger the variance, the smaller its contribution to the objective function, and hence the lesser the penalty for each adjusted trade statistics to move away from their initial value (only the relative, not the absolute size of the variance affects the solution). A small variance of the initial trade statistics indicates, other things equal, it is a very reliable reported data and thus should not change by much, whilst a large variance of the initiate estimates indicates an unreliable report data and may be adjusted considerably, i.e. adjust the trade data in an unreliable reported route more than the reliable report one, thus providing an attractive but feasible weighing mechanism in reconciliation of bilateral trade statistics. Advantages of such an optimization framework in adjusting international trade statistics are also significant from empirical perspective. Firstly, it offers great convenience and details. Hong Kong's re-export markup rate, each country's transshipments via Hong Kong as percent of the country's total exports and imports, and adjusted bilateral balance of trade among China, Hong Kong and their partner countries by each covered commodity are all part of the model solution. Secondly, it provides considerable flexibilities. It permits a wider variety and volume of information to be brought into the reconciliation process. For example, the ability of introducing upper and/or lower bounds is one of the flexibilities not offered by commonly used scaling procedures such as RAS. Therefore, it is very easy to restrict the value of the adjusted trade statistics to nonnegative in the reconciliation process. This is a very desirable property of adjusting bilateral trade flow data. It is also very flexible regarding to the required known information. For example, it allows the possibility that some of the bilateral trade statistics are missing and the total exports and imports by China and Hong Kong to the world do not known with certainty. In real world, missing bilateral trade value is common and a country’s total exports or imports generally lie in a range. By incorporation of associated terms similar to bilateral trade variables in the objective function to penalize solution deviations from the world totals from statistical sources, allows reconciliation of these world totals together with bilateral trade flows.
14

Finally, various relative measure of the reliability of the initial data can be easily included in the reconciliation process, because the choice of values for those reliability weights in the objective function is also very flexible. As noted before, these weights should reflect the relative reliability of the original trade statistics. The interpretation is straightforward. Statistics with higher reliability should be changed less than statistics with a lower reliability, thus the best available information can always be used to insure that statistics reported by reliable trade routines are not perturb by the reconciliation process as much as statistics reported by unreliable trade routines. III. Link the Model with Trade Statistics from the Real World To apply the model specified above to bilateral trade statistics from the real world, there are five key steps in the implementation process and they are discussed one by one in details below. 3.1 Obtain initial estimates for all bilateral trade variables in the model from observed or derived trade statistics In east bound trade, initial estimates can be directly obtained from existing bilateral trade statistics for four sets of variables in the model. They are China’s direct exports to partner countries ( ), Hong Kong’s total exports to partner countries ( ), and partner’s total imports from China ( ) and imports of product originated from Hong Kong ( ). Similarly, there are also four sets of variables have initial estimates directly from existing data in westbound trade. They are partner countries total exports to Hong Kong and direct exports to China ( and ), and China and Hong Kong’s total imports from partner countries ( and ). All China and Hong Kong reported trade statistics are obtained from China Custom authorities and Hong Kong Census and Statistical Department in HS 8-digit details. All partner countries reported data are downloaded from UN COMTRADE at HS 6-digit level.
rChitDX ,0 HKs
itTX ,0CHs
itTM ,0HKs
itDM ,0
HKsitTX ,0 CHs
itDX ,0CHs
itTM ,0 HKsitTM ,0
We also obtain initial estimates of Hong Kong’s re-exports by origin and destination ( ) from Hong Kong re-exports statistics provided by Hong Kong Census and Statistical Department in HS 8-digit details. However, there are still nine sets of variables need initial estimates before the model can be implemented. There are four sets each for eastbound and westbound trade respectively, plus Hong Kong re-export markup ( ). However, if we can obtain initial estimates for and also know fob/cif margin for all bilateral routines, then rest of the eight set variables all can be derived from existing trade statistics based on accounting identities specified in the optimization model.
sritRX 0
sritRXM 0 sr
itRXM 0
The four sets unobservable variables in eastbound trade are China’s total exports to partner countries ( ), Hong Kong’s domestic exports to partner countries rCh
itTX ,0
15

( ),rHKitDX ,0 9 partner countries’ direct imports from China ( ), and partner
countries’ total imports from Hong Kong ( ). Their initial estimates can be derived from observed data according to equation (2), (3), (4) and (5) respectively. The four sets unobservable variables in westbound trade are Hong Kong’s imports from partner countries for domestic use ( ), China’s direct imports from partner countries( ), and partner countries’ total exports to China and their exports for Hong Kong’s domestic market ( and ). Their initial estimates can be computed from observed data according to equation (7), (8), (9) and (10) respectively.
rCHitDM ,0
rHKitTM ,0
HKsitDM ,0
CHsitDM ,0
CHsitTX ,0 HKs
itDX ,0
The initial estimates for bilateral trade variables between Hong Kong and China can be obtained from existing trade statistics reported by China and Hong Kong or calculated from observed trade data in the same fashion as unobserved variables in east and west bound trade according to equations (11) to (14). The observed statistics are , ,
, and . The only difference is that is China’s actual exports to Kong Kong, equals its direct exports to Hong Kong minus all its re-export to other countries via Hong Kong.
HKCHitDX ,0 CHHK
itTX ,0HKCH
itTM ,0 CHHKitDM ,0 HKCH
itTX ,0
In summary, there are eight sets variables each in both eastbound and westbound as well as China and Hong Kong bilateral trade, four of them in each direction can be obtained directly from existing reported trade statistics. While for the remaining four sets unobservable variables we have four sets of equations in each trade direction, therefore, as long as we can obtain estimates for Hong Kong’s re-exports markup ( ) and fob/cif margins ( ), all variables in the optimization model specified in this paper are fully initialized.
sritRXM 0 sr
itcif
3.2 Calculate initial Hong Kong re-export markups The initial estimation of Hong Kong re-export markups follows the spirit of Feenstra et al (1998, 1999), the SAS programming procedures of which are documented in Chapter 2 of Yao (2000). While Feenstra et al (1998, 1999) only reports overall markups for China trade with the US and a few other selected countries, Yao (2000) is able to produce markups at as detailed as 6-digit HS commodity and individual country levels. Yao (2000) also provides the markups tailored for trade data reconciliation in the GTAP version 5 database. This paper uses the same methodology and updated SAS procedures to estimate the average 2002-04 markups and their standard deviations as the initial inputs for the mathematical programming model. The key features of Feenstra et al (1998, 1999) include:
9 Although Hong Kong Census and Statistics Department also publishes Hong Kong’s domestic exports to all its partner countries, but the definition is different with what we defined in this paper. We include Hong Kong’s re-exports markup into Hong Kong’s domestic exports.
16

1. They use very detailed China and Hong Kong trade data at the commodity level (SITC for early years and 6-digit HS for 1994 and onward) and country level. As a result, the markup estimates are also at the same detailed levels. The overall markups are just weighted average of those disaggregate markups.
2. The Hong Kong import data does not have information on the final destination countries but with China trade data, which identifies the final destination countries and origin countries that go through Hong Kong, they are able to produce better markup estimates for China-originated goods, but for China-bound goods, the markups estimates do not show any regular patterns.
3. The markup estimates are sensitive to outliers. By assuming that normally Hong Kong cannot re-export significantly more than its imports in the same year, records with re-export quantity more than double import quantity are treated as outliers and thus are deleted from the markup calculations.
4. Three methods produce three sets of markups and their aggregate values coincide with findings from JCCT (1995), which are based on the analysis of Hong Kong trade data only, Hong Kong Census surveys and Fung and Lau (1998) interviews. They reconcile all three sets of markups with precise economic interpretations. Specifically, Method A markups refer to those based on destination generic Hong Kong import unit value but destination specific Hong Kong re-export unit value, and coincide with JCCT (1995) findings; Method B markups are based on Hong Kong import and re-export unit values both of which are destination generic, and coincide with Hong Kong Census survey results; and coinciding interview results reported in Fung and Lau (1998), Method C markups are based on Hong Kong import unit value (adjusted with China export data) and Hong Kong re-export unit values, both of which are destination specific and therefore are more accurate for China-US trade.
Markups are defined as the share of the value added by Hong Kong middleman in the total re-export value, or M2 in Feenstra et al (1998). Let the unit-value of Hong Kong re-export be denoted by PMi=VMi/QMi where VMi is the value and QMi is the quantity of imports, and i denotes the HS codes. Let the unit-value of Hong Kong re-exports be denoted by PXi=VXi/QXi, where VXi is the value and QXi is the quantity of re-exports. Thus the relationship between the aggregate markup (RXM) and disaggregate markup (RXMi) can be shown by the following formulas,
( )∑ ∑∑ ∑∑
∑⎟⎟⎟
⎠
⎞
⎜⎜⎜
⎝
⎛=
⎟⎟⎟
⎠
⎞
⎜⎜⎜
⎝
⎛
⎟⎟⎠
⎞⎜⎜⎝
⎛−=
−=
ij
jj
iii
ij
jj
ii
i
i
iii
iiiii
QXPXQXPX
RXMQXPX
QXPXPXPM
QXPX
QXPMQXPXRXM 1
(21)
The above formula shows that when using this definition, re-export values should be used as compatible weights. For the purpose of using the programming model to solve for the final markup estimates, standard deviations are needed which measure the scope of variations of the estimates,
17

and will inform the model how much adjustment should be allowed. The weighted variance and standard deviation of the markups are given as:
∑∑ −
=
jjj
iiii
QXPX
RXMRXMQXPXRXMVar
2)()( , and )()( RXMVarRXMSTD = (22)
Again, re-export values are chosen as weights. In data preparation, we first add up the annual data on Chinese exports, Hong Kong imports and re-exports over the years 2002, 2003 and 2004 respectively. So the markups should be interpreted as the weighted average over the three years. Both China and Hong Kong data are in 8-digit HS codes, but only comparable at 6-digit level. When calculating the Method A markups, only Hong Kong data is used and therefore, markups are at the 8-digit HS level. But in Method C markup estimation, we need to combine the Chinese export data with Hong Kong data. Because China and Hong Kong trade data are comparable only at the 6-digit HS level, Method C markups are estimated at 6-digit HS level. As final outputs, markups are aggregated into GTAP sectoral and trade region levels. However, to fully reflect the extent of markup spread over commodities, their variances and standard deviations are calculated over 6-digit HS codes for a given pair of origin and destination countries at the GTAP trade region level. All initial markup estimates are Method A markups except for China originated goods, which have Method C markups. Though theoretically Method C could also apply to China bound goods when the unit values of Hong Kong re-exports to China are adjusted with Chinese import data, we choose not to do so because Method A markups for China bound goods do not show any regular patterns over years and it is not worth the efforts to improve it with Method C. 3.3 Bilateral trade cost and estimates of fob/cif margins A fundamental factor behind bilateral trade patterns are trade cost. However bilateral trade costs are largely unobservable due to insufficient data coverage for bilateral trade flows. Attempts to extract bilateral costs from econometric-based models in explaining trade patterns are a common approach with implicit transactions costs. The foundation for empirical estimation of trade cost is found in the gravity model. Generalized gravity equations are now viewed as being consistent with economic theory. Not surprisingly, applied gravity work has experienced a veritable renaissance. See, Anderson (1979), Bergstrand (1985 and 1989), Harrigan (1994), Deardorff (1998), Baier and Bergstrand (2001), Feenstra et al. (2001), Eaton and Kortum (2002), Anderson and van Wincoop (2003), and Haveman and Hummels (2004). Tinbergen (1962) posited that the same basic functional form could be applied to international trade flows. Linneman (1966) provided an economic foundation for the basic gravity model, showing that it is a reduced form from a partial equilibrium model of export supply and import demand.
18

The general form of the gravity model, as applied to international economics, is as follows:
),( , ijjiij RYYfV =where Vij is the value of trade between countries i and j, Yi is the exporter’s size denoting its willingness to supply goods to the world market, Yj is the importer’s size denoting its ability to demand imports from the world market, and Rij measures other factors that affect bilateral trade, including impediments (such as transportation costs) as well as inducements (such as geographic contiguity).
A basic gravity equation found in the literature is
ij
jiij D
YYCX =
where Xij is the value of exports from country i to country j, Yi and Yj refer to national income, Dij is a measure of distance between the two trading partners, and C is a constant of proportionality. Applied researchers often augment the basic model to include an array of variables to account for additional determinants affecting partner trade, such as the presence or absence of preferential trade agreements. The traditional gravity equation takes the following form:
(23) )ln(1
21 ijkij
K
kkjiij Zyyx εβαα +++= ∑
=
where xij is the log of exports from i to j, yi and yj are the log of GDP of the exporter and importer, is a set of other observable factors k (k= 1,……, K) impeding or inducing bilateral trade, and ε
kijZ
ij is the error term. The gravity equations we estimated are based upon a synthesis of various determinants of trade. The gravity model approach provides a rudimentary relationship of trade costs, bilateral trade volume, distance, and country specific factors. However, since our primary interest here is not attempting to explain drivers of trade, but the relationship between one component among the set of trade affecting factors ( ), which is bilateral transportation costs. The gravity model specification indirectly suggests that costs are a function of trade volume x
kijZ
ij , country-specific factors, and bilateral distance Dij. The gravity model provides us with the rationale for estimating transport cost function that can be used to generate bilateral f.o.b./ c.i.f. margins that varies by commodity, volume of merchandise trade, country-specific effects, and various genre of transaction costs. We surmise that unobservable costs such as shipping costs and insurance can be predicted using observable bilateral distances and trade volumes. Bilateral transportation margins are country, commodity, and port specific. It includes freight and insurance which are not part of most country's official trade statistics. Although it is technically possible to estimate transportation margins based on fob/cif values reported by different partner pairs, such data do not represent the true transport margins even after
19

corrected for biases in reporting. This is due to inconsistencies caused by errors and valuation methods of different countries. It is common to find exports (fob value) exceeding the corresponding import value (cif value). Ideally fob/cif margins should vary based on port capacity, distance between countries, the volume of trade, and the corresponding freight rate for the industry in question. Variations in margins by route are often caused by differences in the volume shipped and differences in port efficiencies. In addition, the cost associated with insurance and the mode of transportation such as air or vessel is also important.
(24) lnVlnlnln ijtvijtfijdkkkij FDCm φφφγ +++=
The variable Ck is a dummy variable identifying the kth commodity to capture commodity
specific attributes of costs. For example bulk commodities with low unit values such as coal and minerals are generally more expensive in terms of the share cost from transportation than with high unit value goods such as electronics. The coefficients dφ , fφ , and vφ are estimated in logarithmic form to measure the effects of distance, freight cost, and volume of trade for bilateral margin . Transport margins are generally a decreasing function of the total volume of trade for a given flow due to economies of scale.
kijm
In more recent versions of the GTAP database, bilateral transport margins are based reference countries where actual bilateral margins for countries are reported. The U.S. trade data is one source where transport costs are reported on a bilateral basis and at the most detailed commodity classification level. Using sources such as this, bilateral margins are extrapolated to cover all bilateral trade flows using the margin function (equation 24). Missing margins can be projected where transportation cost are not available from the trade data by using observable right-hand side variables. Because time and data limitations, this is the approach used to provide initial estimates of fob/cif margins. However, in future versions of this paper we will provide an updated estimated margins function from an econometrically based model to better represent all relevant factors that determine the fob/cif margins. 3.4 Determine appropriate country and commodity aggregation level based on the issue at hand and data availability Because one of the objectives of this study is to produce Hong Kong re-exports adjusted trade flows contributing to version 7 GTAP database, therefore trade data reported by China, Hong Kong and their partners were aggregated from 8 and 6 digit HS to the 42 GTAP commodities respectively. There are 215 countries identified in the GTAP global bilateral trade data base, while only 157 countries reported at least one year of their exports to or import from China and Hong Kong during 2002 to 2004.10 To determine the country aggregation used in our
10 There are about 100 countries reported their trade with China and Hong Kong in 2004 in current WITS with missing data for China’s several important trading partners such as
20

optimization model, we first aggregate all the non-reporting country into one block to be consistent with the model assumption that only one partner country do not report their trade with China and Hong Kong. Then use the difference between China reported imports (exports) and the sum of all partner reported exports (imports) adjusted by associate fob/cif margin to approximate the partner reported data for this aggregate non reporting country block. Then we use two cut off criteria to separate the 157 reporting country into two blocks. The first block has 96 countries, including all single countries in version 6 GTAP database and the sum of exports from China and Hong Kong to the world greater than 300 million dollars in 2004 identified either by China and Hong Kong reported data or their partner reported data. The selected model country list and initial value of corresponding model variables for eastbound and westbound trade are listed Table 1 and Table 2 respectively. The second block is consisted of 61 remaining reporting countries. Their names are listed in Appendix Table A1. (Insert Table 1 and Table 2 here) Although the initial estimates listed in Tables 1 and 2 still suffered from several unsolved data problems, they still show several interesting features of the data. First, reported westbound trade seems less problematic than reported eastbound trade, which reflected by the statistical discrepancies are more volatile in eastbound trade. Although the overall discrepancies are 3.9 percent in eastbound trade and 2.5 percent in westbound trade, there are 20 of the 97 reported bilateral routines in the model with more than hundred percent statistical discrepancies in the eastbound trade, while only two routines in the westbound trade see such large discrepancies. In the other hand, there are only six bilateral routines in eastbound trade with less than five percent discrepancies, while about 20 routines in the westbound trade have small discrepancies. Second, trade with developing country partners shows greater discrepancies than developed countries in general, reflecting the poor quality of data reported from those nations. Finally, extremely large discrepancies are usually come from partners only have small trade values with China and Hong Kong, such as Benin, Kyrgyz Republic in eastbound trade and Cambodia and Lithuania in westbound trade. The combined exports reported by China and Hong Kong are less than one billion in 12 of the 20 bilateral routines with more than hundred percent discrepancies in eastbound trade. There are three types of balance of trade reported in Table 1. They are China and Hong Kong officially reported trade balance with their partner countries (difference between China and Hong Kong reported exports and imports before any adjustment), partner countries officially reported trade balance with China and Hong Kong (difference between partner reported exports to and imports from China and Hong Kong before any adjustment), and balance of trade after initial Hong Kong re-exports and fob/cif adjustments. While only adjusted trade balance are listed in Table 2 but calculated in an
Indonesia, Thailand and Viet Nam. Therefore, additional data for 2002 to 2004 pulled directly from UN COMTRADE database were also used and growth rates between 2002 and 2003 were calculated at the 6-digit HS level to project missing data in 2004 before being aggregated into GTAP sectoral classifications.
21

opposite direction, i.e. they should have a same absolute value with what reported in Table 1, but with an opposite sign. As expected, China’s trading partners reported much larger trade deficits with China than China reported as trade surpluses with its partners. The value reported by partner is $283 billion, while the official statistics from China are only $81 billion. More strikingly, if excluding Hong Kong, other partners reported a deficient with China at $282.4 billion, while China also reported a trade deficient of $7.6 billion with these partners! Most the initial adjusted trade balance fills between those two numbers. For example, the United Stases reported a $174 billion trade deficit with China, while China only report about 80 billion trade surplus with the United States. This number after initial adjustment become 108.8 billion, 36 percent higher than the Chinese data, but 37 percent lower than data reported by the United States. With all variables in the model has an initial value now, there is only one issue left before we can solve the optimization model: How the reliability weights in the objective function ( in equation 18) should be determined, which will determine which and how much of the initial estimates should be adjusted and it is the topic in next section.
srit
srit
srit
srit
srit wrxmwtmwdmwtxwdx ,,,,,
3.5 The choice and estimation of reliability weights From statistical theory point of view, the best way to systematically assign reliability weights in the objective function is to obtain estimates of the variance-covariance matrix of the initial trade flow statistics. Then the inverted variance-covariance matrix may be justified as the best index of the reliability of entries in the trade flow matrix. However, as we discussed earlier, one of the major difficulties to apply constrained matrix balance procedure in data reconciliation is the lack of data to estimate the variance-covariance matrix associate with the initial estimates. For example, the common practice in SAM balancing exercises is assign different degree of subjective reliabilities to the initial entries of the matrix follow the method proposed by Stone (1984),11 almost no attempt to date has been made to statistically estimate data reliability such as error variance of the initial estimates from historical data, except Weale (1989), who developed a statistical method that uses time series information on accounting discrepancies to infer data reliability in a system of national accounts. A similar statistical method can be used to the reporting discrepancies of bilateral trade data to derive those variances associated with international trade statistics. Trade data reported by each country and its partners are often used in international economic literature to check the quality of trade statistics. Theoretically, export statistics from one country to its partner countries should match the import statistics from their partner countries. This often refers to as mirror statistics. An approximate match of mirror statistics implies trade data reported via that routine are reliable. Therefore, an analysis of discrepancies between two "reported" trade data of the same trade flows may provide a means of determining data reliability and mirror trade statistics are used as major
11 Stone proposed to estimate the variance of x0
ij as var(x0ij) = (θijx0
ij)2, where θij is a subjective determined reliability rating, expressing the percentage ratio of the standard error to the initial estimates of x0
ij.
22

data source to estimate the variance of reported bilateral trade statistics or to construct some sort reliability index in this study. Auto regression with dummy variables Assuming the discrepancies in any pair of mirror trade statistics are a function of a systematic bias, last period's discrepancies and K dummy variables plus an error term as follows:
Dbbeae itk
n
k
kiiitiit μ+++= ∑
=−
1
01 (25)
where is the mirror trade statistics discrepancies at year t, is the symmetric bias, and is the random error term, D
ite 0ib
itμ k’s are dummy variables represent events have a significant impact on the reporting practice in the two data reporting countries such as change of commodity classifications, implementing better custom information systems or enforcing effective anti-smuggling programs. The autocorrelation coefficient and the variance
Var( ) can be taken as indicators of magnitude of the measurement errors. The variance of initial trade statistics thus may be derived as follows:
ia
itμ
since eit-1 and μit are independent,
VeVaVeaVDbbeaVeV itiititiitk
n
k
kiiitiit )()()()()()( 1
21
1
01 μμμ +=+=+++= −−
=− ∑ (26)
At stationary assumption in long run, V(eit)=V( eit-1)
(27)
VeVaeV itiit )()()( 2 μ=−
Therefore
a
VeV i
it )1()()( 2−
= μ (28)
As long as we have enough historical mirror trade statistics and sufficient knowledge on the change in related country’s trade reporting system to estimate V( ) for each pair of mirrored trade variables in our optimization model, then they can be assigned as weights in equation (18), the objective function.
ite
Reliability indexes As described earlier, in adjusting inconsistent bilateral trade flow statistics to satisfy the consistency requirements, it is crucial for the reconciliation procedure to be biased towards changing the unreliable route more than the reliable route. For example, past statistical information suggested that the US-Japan trade is one of the most consistently reported trade flow. Thus, less or no adjustment is needed on this particular route while more adjustment should occur where there is less certain. Because a small discrepancy in
23
mirror trade statistics may indicate a reliable trade routine, while a large discrepancy may indicate unreliable reported data, mirror statistics and their discrepancies also directly provide useful information to construct some sort of reliability index to inform the model how the initial estimates should be adjust in the reconciliation process. In fact, when we assign initial estimates for the 16 sets of trade flow variables in both east bound and westbound trade in the optimization model either directly from reported trade statistics or by derivation from them, we also obtain 8 sets of mirrored trade data. The discrepancies computed from each mirrored pair divided by corresponding sum of mirrored
flows12 thus can be used to construct an index which reflects the reliability of the associate initial estimates of the reported trade flows in some extent, although we are not sure how large the associated variance really may be. Using mathematical notations:
)0000
( csit
csit
csit
csit
csit
csitcs
itcsit DMcifDX
DXDMcifABSPDMPDX
+−
== (29)
)0000
( csit
csit
csit
csit
csit
csitcs
itcsit TMcifTX
TXTMcifABSPTMPTX
+−
== (30)
)0000
( scit
scit
scit
scit
scit
scitsc
itscit DMcifDX
DXDMcifABSPDMPDX
+−
== (31)
)0000
( scit
scit
scit
scit
scit
scitsc
itscit TMcifTX
TXTMcifABSPTXPTX
+−
== (32)
Where indexes “c” is indexed over set {CH, HK} and variable with a prefix “P” are reliability index for that variables. All these reliability indexes defined above usually have a value between 0 and 1. A smaller value of the indexes indicates the initial estimates are relatively reliable for the associated trade routine. The weights in the objective function (equation 18) of the model can be assigned by multiplying these indexes by their corresponding initial values, e.g.,
. With such a weighting scheme, we also make the model to be biased towards changing those unreliable initial data more than those reliable ones in the reconciliation process, although just roughly.
srit
srit
srit TXPTXwtx 0×=
12 There is also a consensus in trade statistics reconciliation work to use import data as a bench mark for comparison of most commodities. Import data usually are considered to be more reliable than export data because imports have to be reported in sufficient details to allow Customs to apply tariffs, taxes, trade agreements or other regulatory controls. For the same reason, Customs offices generally more attentive to goods entering the country as opposed leaving the country.
24

IV. Preliminary Results from the Model The implemented optimization model is coded in GAMS(Brooke et al, 2005), with about 2.5 million equations and variables in its current aggregation. It was solved using barrier method of the Cplex solver (GAMS Development Corporation, 2005). There are 13 input data files, all automatically produced by two SAS programs. Aggregated adjusted estimates for eastbound and westbound trade are listed in Tables 3 and 4 respectively. Detailed results by countries and sectors are available from the author upon request. (Insert Table 3 and Table 4 here) 4.1 Adjusted Hong Kong re-export markup rate Comparing the model adjusted data with the initial estimates, the first notable change is the post adjusted Hong Kong re-export markup rate are higher than the initial estimates. The weighted average markup rates in eastbound trade increased from 31.0 percent to 40.2 percent, the same numbers in westbound trade increased from 9.2 percent to 12.2 percent. Although whether these adjustments are the right adjustment is subject to further investigation because there are some data and logical issues still unsolved in the model that we will discuss later, the adjustments seem move to the right direction. Based on the most recent Canada-China merchandise trade reconciliation study published by Statistics Canada in 2005, Hong Kong’s re-export markups rate in eastbound trade is about 40 and 38 percent during 2002 and 2003 respectively, while the initial markup rate for Hong Kong re-exporting Canada originated goods to China is only 29 percent, and the post adjustment markup rate increase to 37 percent. The initial markup estimates for Hong Kong re-exporting Canada originated good to China is 5.1 percent, while the post adjusted rate increase to 8.7 percent, which is very close to the 9.2 percent Hong Kong re-exports markup rate in westbound trade during 2002 and 2003 reported by Statistics Canada. The upward adjustment for the overall markup rate may caused by omitting a significant portion of the initial markup rates with negative sign computed directly from the detailed trade data when we initialize the model, because the counter intuitive nature of these negative markups. Feenstra and Hanson (2004) reported Hong Kong’s re-export markup has a mean of 0.375 with a standard error of 0.358 based on official data from China and Hong Kong covering period 1988-1998. They also reported the presence of negative markups are a genuine feature of their data, similar to what had be found by Feenstra et al (1999) in China-US westbound trade. However, we strongly believe there should be a positive markup in either direction of trade because in the real world no business can still exist for a decade with consistent loss, there must be some institutional and measurement factors distorting the reported trade data which need further investigation. While the model developed in this paper provides a solid way to estimate a final positive markup rate for both directions of re-exports. (Inset table 5 here)
25

Table 5 presents the initial and model adjusted Hong Kong re-exports as percentage of China’s total exports and imports as well as Kong Kong’s re-exports markup rate and their associated weighted standard deviations by each of the 42 GTAP sectors. Generally speaking, the model tends to adjust Hong Kong’s re-exports markup rate for finished products upward but reduce the initial markup rate of most intermediate and primary products downward with some exceptions. For example, there is a slightly downward or no adjustment for primary commodities (GTAP sector 1 to 24) except animal products in eastbound re-exports, while significant upward adjustments occur to some finished commodities with product differentiations, such as leather, toy and sporting products (GTAP sector 29), other transport equipment (GTAP sector 39), electronic equipment (GTAP sector 40), and other manufactures (GTAP sector 42). 4.2 Hong Kong re-exports earnings and retained imports The first panel of table 6 summaries Hong Kong’s earnings from its re-export China originated goods to other countries, from re-exports other countries’ products to China, and from transshipment of commodities among other countries by the 42 GTAP sectors. It shows that Hong Kong’s re-export activities and their associated earnings are mainly concentrated on few finished manufacturing products. In eastbound trade, these products are electronic equipment, other manufactures, other machinery and equipment, leather and sporting goods, textiles and wearing apparel. While electronic and other machineries are major commodities in transshipment from other countries to China. Qualities of these products are usually more difficult to observe and more likely to require the service of intermediation to resolve information problems in trade (Feenstra and Hanson, 2004). Therefore, these estimates seem make good economic sense. (Inset table 6 here) The second panel of table 6 lists initial and adjusted estimates of Hong Kong’s retained imports from all its trading partners excluding and including China by GTAP sectors. The initial estimates seem very close to the estimates published by Hong Kong Census and Statistics Department at aggregate level if excluding imports from China (68.7 and 70 billion U.S dollars respectively), while the model adjusted estimates are significantly larger when including goods from China. However, carefully comparing estimates including and excluding China, we find the differences are mainly caused by few sectors and directly related to our current treatment of Hong Kong re-export China originated products to China in the model. In Hong Kong re-exports statistics, there are re-exports for China originated commodities back to China.13 The volume of such round tripping trade flows worth about 34.8 billion
13 This may be quite true in real world trade. For example, shipments of forest products from northwest port of Dalian to Hong Kong by sea first, then transport to factories use these products in Shenzhen by truck may be a lot cheaper than direct transport the products from inland China to Shenzhen. However, the data show that the majority of
26

in 2004 based on Hong Kong re-exports statistics and 36.9 billion in China Custom reported imports through Hong Kong. Although we tried different ways, the current model still can not handle such trade properly yet, the 34.8 billion Hong Kong re-exports are simply eliminated from the initial estimates of Hong Kong’s re-exports, total exports and imports. There is no adjustment has been made to China’s direct exports to Hong Kong, however, because there is no records in China officially reported exports through Hong Kong back to China. It is very possible that the exporters misreported to Chinese Customs that such exports are bound for some other final destinations via Hong Kong for incentive reasons, such as export rebate, but in fact these exports went back to China eventually as shown in both Hong Kong’s re-exports and China’s official imports statistics. Therefore, the model tends to over estimate Hong Kong retained imports for China originated products and introduces bias to its estimates of Hong Kong re-exports markup rates. This is clearly shown by comparing the last column of table 6, Hong Kong re-exports China originated goods back to China, with initial and adjusted estimates of Hong Kong’s retained imports. There are three sectors in the model adjusted estimates are significantly higher than these initial estimates. They are textiles (increase from 4 to 5 billion), electronic equipment (increase from 27.2 to 42.2 billion), and other machinery and equipments (increase from 8 to 16.4 billion), while the corresponding Hong Kong re-exports from China back to China are 5, 17.8 and 7.3 billion respectively. Obviously, properly treat such round trip trade flows in the model will definitely improve the accuracy of the final estimates of the model. 4.3 Adjusted China’s balance of trade at sector level Table 3 reports model adjusted aggregate bilateral balance of trade between China, Hong Kong and their trading partners along with official trade balance reported by both sides. It shows that most of the adjusted bilateral balance of trade lies between China and its partner reported data. At aggregate level, the model adjusted trade surplus for China is 97.6 billion dollars, which is higher than China officially reported surplus of 81 billion14, but significantly smaller than the 283.2 billion partners reported trade deficit with China. At bilateral level, for instance, the model adjusted trade balance between China and Canada is 6.7 billion dollars, which lies between the 0.8 billion China reported trade surplus with Canada and 13.4 billion Canada reported trade deficit with China. Similarly, the model adjusted trade balance between China and Philippine is 3.4 billion dollars, which also lies between the 273 million Philippine reported trade surplus with China and China reported 4.8 billion trade deficit with Philippine.
these round tripping commodities are electronic equipment (17.8 billion), Other machineries (7.3 billion) and textiles (5.0 billion), there must be some incentive reasons to encourage exporters to do so. 14 The balance of trade data reported here are calculated from current model data base, which is different from the officially reported data because our model database excludes utility trade (such as electricity) and HS Chapter 98 and 99. There are also 36.9 billion Hong Kong re-exports of China originated products back to China did not count as China’s imports as described in the text. Therefore, China’s trade surplus in the model is higher than 32 billion, the official 2004 number reported by China.
27

(Inset table 7 here) The first panel of table 7 presents initial and model adjusted net exports of China with all its trading partners with and without Hong Kong by GTAP sectors. There are several interesting features of the model adjusted estimates of China’s net exports to the world. First, there is no sign change among China officially reported net exports, the initial, and model adjusted estimates, in both including and excluding Hong Kong, for all but three GTAP sectors (processed rice, beverages and tobacco products, and petroleum products, first two of them has very small values). Further more, for the three sectors with sign changes, the sign of model adjusted net exports are the same with the officially reported net exports and consistent with people’s intuition of China’s comparative advantages (net importer of processed rice and petroleum products, net exporter of beverages and tobacco products). Finally, by adjusting Hong Kong’s transshipment back to China’s total export and imports, the adjusted net trade flows show China’s current comparative advantages in the world market more clearly. For instance, the adjusted net exports are significantly larger than China officially reported in most labor intensive products such as textiles, wearing apparel, leather and sporting goods, other manufactures and certain technology-capital intensive goods such as electronic equipments. All these imply that Hong Kong’s re-export activities facilitate China to fully realize its comparative advantages and the model did a reasonable job in adjusting China’s net trade flows. China’s trade balance with the United States by GTAP sector is presented in the second panel of table 7 as an example to illustrate the features of model adjusted bilateral net trade flows. It also shows that most model adjusted sector net trade flows lie between China and the U.S. officially reported statistics except two sectors, which are textiles (about 90 million dollars higher than U.S. reported deficit with China) and meat products (only 6 million dollars higher than China reported deficit with U.S.). As we discussed earlier, textile sector also associated with large values of Hong Kong re-exports for China originated products back to China. Therefore, the inability to treat such trade flow properly may distort current model to overestimate China’s trade surplus. V. Concluding Remarks This study constructed a mathematical programming model to estimate re-export markup and reconcile detailed bilateral trade statistics from China, Hong Kong and their trading partners. Five key steps to link the model with actual trade statistics are discussed. The model was applied to 2004 bilateral world trade data in GTAP sectoral classification to produce Hong Kong re-exports adjusted trade flows contributing to version 7 GTAP database. Preliminary result shows that the model is able to eliminate the statistical discrepancy efficiently. Hong Kong's re-export mark-up, each trading partner's transshipment via Hong Kong as percent of the country's total exports to and import from China, and adjusted bilateral balance of trade among China, Hong Kong and their partner countries by each covered commodity are all part of the model solution.
28

In conclusion, the model provides a flexible tool to reconcile trade statistics from China, Hong Kong and their trading partners simultaneously. Advantages of the model are its flexible in data requirement and its desirable theoretical and empirical properties. It can be applied to reconcile direct and indirect trade for other regions of the world where transshipment creates major discrepancies. It not only provides a tool for the preparation of global trade data in future versions of GTAP database, but also contributes to the methodological development to estimate and reconcile discrepancies in international trade statistics when transshipment and re-export activities heavily diminish the ability of a country identifying its correct partner countries. However, there are several caveats that need mentioning. First, the model assumes all transshipments via Hong Kong are recorded by Hong Kong’s re-export statistics, while China’s export statistics only include China’s direct exports to destination countries. In reality there is a large portion of China’s exports to and imports from the world via Hong Kong may be only transferred through Hong Kong and do not reflect in Hong Kong re-export statistics.15 In addition, as we mentioned earlier, China Customs also started to identify the final destinations of its goods shipped through Hong Kong in 1993, therefore, there may be some double counting between China reported trade via Hong Kong and Hong Kong re-export statistics. Tables 7 and 8 compare mirror trade statistics of China and Hong Kong with Hong Kong’s “Port Cargo Loaded by Major Country/Territory and Port of discharge” statistics as well as Hong Kong’s “Port Cargo Discharged by Major Country/Territory and Port of Loading” statistics. They show that as the difference between China reported exports via Hong Kong (but Hong Kong may be or may not be the final destination) and Hong Kong reported imports from China increase, the outward transshipment as percent of Hong Kong’s total shipment to the world also increase (Table 8). Similarly, as China reported imports through Hong Kong (but Hong Kong may be or may not be the country of origin) and Hong Kong reported exports to China increase, the inward transshipment as percent of Hong Kong’s total shipment received from the world also increase (Table 9). Unfortunately, we are unable to judge whether the transshipment value reported by China under or over valued China’s outward or inward transshipment via Hong Kong to and from the world. In other words, for instance, only when we know whether the 35,891 million metric ton goods transshipped through Hong Kong to the world in 2004 over or under valued by the additional 54 billion dollars transshipment value reported by China, we are unable to adjust China and Hong Kong reported export statistics in either direction. The underline assumption of current model is suppose the transshipments double counted by both China’s exports and Hong Kong’s re-exports
15 There are four types of shipment are classified by Hong Kong Census and Statistics Department: imports, exports (including domestic exports and re-exports), inward transshipment, and outward transshipment. Goods imported into or exported from Hong Kong are classified as direct shipment, while goods transshipped in Hong Kong under a through bill of lading are classified as transshipment. It refers to cargo that is consigned from a place outside Hong Kong to another place outside Hong Kong but is or is to be removed from one vessel and either returned to the same vessel or transferred to another vessel within Hong Kong waters. It is different with goods imported into Hong Kong for subsequent re-exports and usually do not go through Hong Kong custom valuations.
29

statistics just equal to Hong Kong’s outward transshipment (i.e. anything do not go through Hong Kong Customs is suppose to recorded by China as direct exports to partner countries, or in 2004, the 35,891 million metric ton goods exactly worth 54 billion dollars). Obviously, this is a very strong assumption. (Insert table 8 and 9 here) Second, we keep re-export statistics reported by Hong Kong Census and Statistics Department as constant in the model during the adjustment process, because it is the most reliable source to provide both origins and destinations of transshipment through Hong Kong. In reality, such statistics also subject to errors as other reported trade statistics. As we described earlier, China customs started to report China’s exports and imports via Hong Kong in 1993, and the quality of such statistics are improved in recent years, especially records on its imports through Hong Kong. Therefore, using such data as a mirror of Hong Kong’s re-exports statistics may help us to eliminate possible double counting in westbound trade thus improving the quality of model adjusted estimates. Thirdly, the model assume both China and Hong Kong correctly report their total exports to and imports from the world, therefore, these totals enter the model as controlled constants. However, in the real world, the sum of partner countries reported trade with China and Hong Kong in some sectors may well exceed what China and Hong Kong reported. Therefore, there is an inconsistency in the global level which can not be eliminated by current model alone. To solve this issue, a global commodity equilibrium adjustment model is needed. It treats each country as both supplies and demanders for each commodity and reconciles each countries’ total exports and imports statistics using equation (17) as its constraint to solve a set of global consistent total exports and imports (no bilateral trade data needed) for each commodity and every country, which then can be used as input to our current model to solve the bilateral details. Fourth, because data and time limitations, major parameters in the model, the reliability weights and fob/cif margins, have not been estimated by econometric methods we proposed yet. Reliability index and reference country method were applied as an approximation. Therefore, the numeric estimates reported in the paper should be interpreted with caution: they can only be viewed as preliminary and indicative rather than precise and final. Finally, current model only reconciles one year bilateral trade data, to be consistent with the 2004 base year of version 7 GTAP database. However, a three year average may be more desirable. It not only smoothes any unusual annual variation of the bilateral trade data, reduce time difference of recording which might cause discrepancies, but also provides more non-zero entries in the trade flow matrix and corrects time delays in export and import records. This certainly will have a positive impact on the development of CGE-based trade policy analysis using future versions of GTAP database. To solve above discussed remaining data and modeling issues, econometrically estimate all parameters in the model are in our next step research agenda.
30

31
References Antonello, Paola, 1990, "Simultaneous Balancing of Input-Output Tables at Current and Constant Prices with First Order Vector Autocorrelated Errors," Economic Systems Research, Vol. 2, No. 2, pp. 157-171 Anderson, James E. and Eric van Wincoop. 2003, “Gravity with Gravitas: A Solution to the Border Puzzle.” American Economic Review, Vol. 93: 170-192, March. Baier, Scott L. and Jeffrey H. Bergstrand. 2001, “The Growth of World Trade: Tariffs, Transport Costs, and Income Similarity.” Journal of International Economics, Vol. 53: 1-27. Bergstrand, Jeffrey H. 1989, “The Generalized Gravity Equation, Monopolistic Competition, and the Factor-Proportions Theory in International Trade.” The Review of Economics and Statistics, Vol.: 143-153, February. Bergstrand, Jeffrey H. 1985, “The Gravity Equation in International Trade: Some Microeconomic Foundations and Empirical Evidence.” The Review of Economics and Statistics, Vol. 67: 474-481, August. Bacharach, M, 1970, Bi-proportional Scaling and Input-output Change, Cambridge University Press, Cambridge Bachem, Achim and Bernhard Korte (1981) Mathematical Programming and Estimation of Input-Output Matrices, Report WP78102, University of Bonn Baras, J S and Panoutsopoulos, 1993, "World Trade Data Estimation: A Methodology Using Progressive Elimination and Constrained Quadratic Optimization," The World Bank (unpublished report), March. Batten, F. David, 1982, "The Interregional Linkages between National and Regional Input-Output Models," International Regional Science Review, Vol. 7, pp. 53-67. Brooke, Kendrick, Meeraus, and Raman, 2005, “GAMS -- User's Guide” GAMS Development Cooperation, Washington, DC. Byron, Ray P. 1978. "The Estimation of Large Social Account Matrix," Journal of Royal Statistical Society, A, 141 (Part 3), 359-367. Byron, R. P., P.J. Crossman, J.E. Hurley and S.C. Smith, 1993, "Balancing Hierarchal Regional Accounting Matrices," Paper presented to the International Conference in memory of Sir Richard Stone, National Accounts, Economic Analysis and Social Statistics, Siena, Italy, October 17-20, 1993.
32

Canning, Patrick and Zhi Wang “A Flexible Mathematical Programming Model to Estimate Interregional Input-Output Accounts.” Journal of Regional Sciences 45(3):539-563, August 2005. Deardorff, Alan V. 1998, “Determinants of Bilateral Trade: Does Gravity Work in a Neoclassical World?” In J. A. Frankel, ed., The Regionalization of the World Economy, pp. 7-22. Chicago: University of Chicago Press. Eaton Jonathan and Samuel Kortum. 2002. "Technology, Geography, and Trade." Econometrica, Vol. 70: 1741-1779, September. Feenstra, Robert, Wen Hai, Wing Woo and Shunli Yao, 1998, “The U.S.-China Bilateral Trade Balance: Its Size and Determinants,” NBER Working Paper #6598, June, National Bureau of Economic Research (NBER), Cambridge, MA Feenstra, Robert, Wen Hai, Wing Woo and Shunli Yao, 1999, “Discrepancies in International Data: An Application to China-Hong Kong Entrepôt Trade,” American Economic Review, vol. 89, no. 2, 338-343, May. Feenstra, Robert C.; James R. Markusen; and Andrew K. Rose, 2001, “Using the Gravity Equation to Differentiate Among Alternative Theories of Trade.” Canadian Journal of Economics, Vol. 34: 430-447, May. Feenstra and Robert C. and Gordon H. Hanson, 2004, “Intermediaries in Entrepôt Trade: Hong Kong Re-Exports of Chinese Goods,” Journal of Economics and Management Strategy, Vol. 13, No. 1, pp. 3-35. Fung, K C and Lawrence Lau, 1998, “The China-United States Bilateral Trade Balances: How Big Is It Really?” Pacific Economic Review, No. 3, October, pp. 33-47 Fung, K C and Lawrence Lau, 2001, “New Estimates of U.S.-China Bilateral Trade Balances,” Journal of the Japanese and International Economics, Vol. 15, pp. 102-130 Fung, K C and Lawrence Lau, 2003, “Adjusted Estimates of United States-China Bilateral Trade Balances: 1995-2002, Asian Economic Journal, Vol. 14, May/June, pp. 489-496 Fung, K C and Lawrence Lau, 2004, “Estimates of Recent United States-China Bilateral Trade Balances,” Working Paper, March 10 Florian, M, 1986, "Nonlinear Cost Network Models in Transportation Analysis," Mathematical Programming Study, Vol. 26, pp. 167-196 Friedlander, D, 1961, "A Technique for Estimating Contingency Table, Given the Marginal Totals and Some Supplementary Data," Journal of the Royal Statistical Society, A. Vol.124, Part 3, pp. 412-420
33

Harrigan, J. Frank 1990, "The Reconciliation of Inconsistent Economic Data: the Information Gain," Economic System Research, Vol.2, No.1, pp. 17-25 Harrigan, James. 1994, “Scale Economies and the Volume of Trade.” The Review of Economics and Statistics, Vol. 76: 321-328 Haveman, Jon and David Hummels. 2004, “Alternative Hypotheses and the Volume of Trade: The Gravity Equation and the Extent of Specialization.” Canadian Journal of Economics, Vol. 37: 199-281. Johnston, R.J., A.M. Hay, and P. J. Taylor, 1982, "Estimating the Sources of Spatial Change in Election Results: A Multipropotional Matrix Approach," Environment and Planning, A, Vol. 14 pp. 951-962 Joint Commission on Commerce and Trade (JCCT), 1995, “Report of the ‘Trade Statistics Subgroup’,” Trade and Investment Working Group, Washington DC Kaneko, Yukio, 1988, "An Empirical Study on Non-survey Forecasting of the Input Coefficient Matrix in a Leontief Model," Economic Modelling, No.1, pp. 41-48 Klincewicz, J G, 1989, "Implementing an Exact Newton Method for Separable Convex Transportation Problems," Networks, Vol.19, pp. 95-105 Lahr, Michael L, 2001, “A Strategy for Producing Hybrid Regional Input-output Tables,” in Lahr, Michael and Erik Dietzenbacher (eds.), Input-Output Analysis: Frontiers and Extensions. Basingstoke, U.K: Palgrave, pp. 211-242. Linnemann, Hans. 1966, An Econometric Study of International Trade Flows. Amsterdam: North Holland Publishing Co. Miller, R. E. and P.D. Bliar, 1985, Input-Output Analysis: Foundations and Extensions, Prentice Hall, Englewood Cliffs, New Jersey Mohr, Malte, William H. Crown and Karen R Polenske, 1987, "A Linear Programming Approach to Solving Infeasible RAS Problems," Journal of Regional Sciences, 27(4), 587-603 Nagurney, A., Dae-Shik Kim and A.G. Robinson, 1990, "Serial and Parallel Equilibration of Large-Scale Constrained Matrix Problems with Application to the Social and Economic Sciences," The International Journal of Supercomputer Applications, Vol. 4, No. 1, pp. 49-71. Plane, D.A. 1982, An information theoretic approach to the estimation of migration flows, Journal of Regional Science 22: 441-456.
34

Ploeg, van der F, 1982, "Reliability and the Adjustment of Sequences of Large Economic Accounting Matrices," Journal of the Royal Statistical Society, A. 145, 169-194 Ploeg, van der F, 1984, "General Least Squares Methods for Balancing Large Systems and Tables of National Accounts," Review of Public Data Use, 12, 17-33 Ploeg, van der F, 1988, "Balancing Large Systems of national Accounts," Computer Science in Economics and Management 1, 31-39 Robinson, Sherman, Andrea Cattaneo and Moataz El-Said, 2001, “Updating and Estimating a Social Accounting Matrix Using Cross Entropy Methods,” Economic System Research, 13(1), 47-64 Schindler, W. John and Dustin Beckett, “Adjusting Chinese Bilateral Trade Data: How Big China’s Trade Surplus?” International Journal of Applied Economics, 2(2):27-55, September, 2005. Schneider, Michael H., and Stavros A. Zenios, (1990) "A Comparative Study of Algorithms for Matrix Balancing." Operations Research, Vol. 38, No. 3, pp. 439-455. Senesen, Gulay and John M. Bates, 1988, "Some Experiments with Methods of Adjusting Unbalanced Data Matrices," Journal of the Royal Statistical Society, A. 151(Part 3), 473-490. Stone, Richard, 1984, "Balancing the National Accounts: The Adjustment of Initial Estimates: a Neglected Stage in Measurement," in A. Ingham and A.M. Ulph (eds.), Demand, Equilibrium and Trade. London: Macmillan Stone, Richard, John M. Bates and Michael Bacharach, 1963, A Program for Growth, Vol. 3 Input-Output Relationship 1954-1966, London: Chapman and Hall Stone, Richard, David G. Champernowne and James E. Meade, 1942, "The Precision of National Income Estimates," Review of Economic Studies, 9(2), 110-125. Theil, Henri and G. Ray (1966) "A quadratic Programming Approach to the Estimation of Transition Probabilities." Management Sciences, No. 12, 714-721. Tinbergen, J. 1962, Shaping the World Economy. New York: Twentieth Century Fund. Waelbroeck, J. (1964) "Use non-survey methods to analysis International Trade Matrix." Cahiers Economiques de Bruxelles, Vol. 21, pp.93-114. Weale, Martin R, 1985, "Testing Linear Hypotheses on National Account Data," Review of Economics and Statistics, 67, 685-689.
35

Weale, Martin R, 1989, “Asymptotic Maximum-Likelihood Estimation of National Income and Expenditure,” Cambridge, mimeo. Yao, Shunli, 2000, Three Essays on China’s Foreign Trade, unpublished PhD dissertation, University of California, Davis. Zenios, Stavros A., Arne Drud and John M. Mulvey, 1989, "Balancing Large Social Accounting Matrices with Nonlinear Network Programming," NETWORKS, 19, 569-585. Appendix Table A1 Countries in the other reporting country block of the model Country number ISO3 Country name
Country number ISO3 Country name
1 ABW Aruba 32 JAM Jamaica 2 AND Andorra 33 KNA St. Kitts and Nevis 3 ARM Armenia 34 LBY Libya 4 AZE Azerbaijan 35 LCA St. Lucia 5 BDI Burundi 36 LSO Lesotho 6 BFA Burkina Faso 37 MDA Moldova 7 BHR Bahrain 38 MDV Maldives 8 BIH Bosnia and Herzegovina 39 MKD Macedonia, FYR 9 BLR Belarus 40 MNG Mongolia
10 BLZ Belize 41 MSR Montserrat 11 BOL Bolivia 42 MUS Mauritius 12 BRB Barbados 43 NAM Namibia 13 BRN Brunei 44 NCL New Caledonia 14 CAF Central African Republic 45 NER Niger 15 CIV Cote d'Ivoire 46 NIC Nicaragua 16 CMR Cameroon 47 NPL Nepal 17 COK Cook Islands 48 OMN Oman 18 CPV Cape Verde 49 PNG Papua New Guinea 19 DMA Dominica 50 PYF French Polynesia 20 ERI Eritrea 51 QAT Qatar 21 ETH Ethiopia(excludes Eritrea) 52 RWA Rwanda 22 FJI Fiji 53 SEN Senegal 23 GAB Gabon 54 SLE Sierra Leone 24 GEO Georgia 55 SLV El Salvador 25 GIN Guinea 56 STP Sao Tome and Principe 26 GMB Gambia, The 57 SWZ Swaziland 27 GRD Grenada 58 SYC Seychelles 28 GRL Greenland 59 TTO Trinidad and Tobago 29 GUY Guyana 60 VCT St. Vincent and the Grenadines 30 HND Honduras 61 WSM Samoa 31 ISL Iceland
36

Table 1 Initial Estimates of Bilateral Trade Between China, Hong Kong and their Partner Countries, Eastbound Flows, 2004, in Millions of U.S. Dollars
Country Code Country Name
China actual exports to partners
China direct exports to Partners
Hong Kong total exports to partner
Hong Kong domestic export to partner
China re-exports to partner via Hong kong
Hong Kong re-export markup
Partners total imports from Hong Kong
Partners total imports from China
Partner imports of Hong Kong domestic products
Partner direct import from China
Re-exports as percent of partner total exports to China
Statistical discrepancies
Hong Kong re-export markup rate
Partners balance of trade with China after adjustment
China reported balance of trade with partners
Partner reported balance of trade with China
Partners balance of trade with Hong Kong after adjustment
Hong Kong reported balance of trade with partners
Partner reported balance of trade with Hong Kong
fob/cif ratio, China to partner
fob/cif ratio, Hong Kong to partner
Variable in the model TX0(CH,r) DX0(CH,r) TX0(HK,r) DX0(HK,r) RX0(s,CH) RXM0(CH,r) TM0(HK,r) TM0(CH,r) DM0(HK,r) DM0(CH,r)
(RX0(CH,r)-RXM0(CH,r))/RX0(CH,r) SDX(r)
RXM0(CH,r)/RX0(CH,r)
TX0(CH,r)-TX0(r,CH)
TX0(CH,r)-TM0(r,CH)
TX0(r,CH)-TM0(CH,r)
TX0(HK,r)-TX0(r,HK)
TX0(HK,r)-TM0(r,HK)
TX0(r,HK)-TM0(HK,r) cif(CH,r) cif(HK,r)
USA United States 147,749 125,118 43,924 17,707 35,587 11,667 37,048 208,153 9,141 184,266 15.3 17.2 32.8 108,876 80,395 -174,095 8,671 29,469 -21,543 0.945 0.939CAN Canada 10,019 8,161 3,132 1,077 2,761 798 2,722 18,526 552 16,565 18.5 34.6 28.9 4,395 816 -13,436 600 1,929 -1,654 0.944 0.947MEX Mexico 5,634 4,973 938 226 808 116 1,152 14,003 406 13,310 11.7 54.7 14.3 4,952 2,831 -13,529 17 604 -668 0.952 0.954AUS Australia 10,462 8,838 3,190 1,062 2,493 780 3,167 13,064 933 11,360 15.5 11.6 31.3 3,637 -2,704 -6,755 -209 1,326 -1,132 0.951 0.953NZL New Zealand 1,313 1,077 413 133 355 107 398 2,180 104 1,934 17.9 29.5 30.3 107 -336 -1,080 -123 88 -25 0.949 0.955JPN Japan 81,243 73,222 13,799 4,302 11,977 3,557 11,276 93,589 1,322 85,190 9.9 4.2 29.7 -7,920 -21,035 -22,981 -6,790 -19,115 21,704 0.946 0.954KOR Korea Rep 29,313 27,810 5,653 2,117 2,832 1,269 6,929 29,585 3,268 28,027 5.1 -1.5 44.8 -26,748 -34,350 20,173 -8,724 -7,244 11,198 0.941 0.966TWN Taiwan China 15,193 13,489 6,298 2,221 2,486 706 6,289 16,625 2,072 14,860 11.2 1.6 28.4 -31,984 -51,289 17,373 -13,065 -13,597 23,439 0.950 0.967SGP Singapore 14,761 12,684 5,588 2,095 3,456 1,292 7,219 16,012 3,599 13,862 14.1 9.1 37.4 -2,611 -1,282 -889 -12,263 -8,655 9,981 0.961 0.966MAC Macao 1,768 1,605 1,242 351 256 83 1,293 1,531 368 1,362 9.2 -11.5 32.3 1,366 1,388 -1,140 207 950 -984 0.951 0.963IDN Indonesia 6,886 6,256 1,104 281 851 190 1,088 2,858 226 2,198 9.1 -115.5 22.4 2,521 -942 793 -156 -661 175 0.939 0.951MYS Malaysia 8,949 8,087 2,288 1,085 1,625 727 4,026 10,100 2,777 9,205 9.6 17.0 44.7 -2,734 -10,073 -1,704 -2,178 -4,377 3,444 0.954 0.965PHL Philippines 5,226 4,268 2,514 1,076 1,679 675 3,223 1,888 1,723 890 18.3 -58.7 40.2 1,243 -4,806 273 282 -1,816 -1 0.950 0.961THA Thailand 6,816 5,786 2,639 1,009 1,838 764 2,785 6,122 1,093 5,055 15.1 -10.6 41.6 -944 -5,757 -579 -472 -2,210 1,420 0.953 0.964VNM Vietnam 4,826 4,259 1,218 317 746 144 1,707 1,655 805 1,088 11.8 -79.8 19.3 3,294 1,777 -223 98 771 -1,319 1.000 1.000KHM Cambodia 756 452 451 110 393 71 778 357 422 40 40.2 -11.3 18.1 748 422 -351 -243 443 -423 0.952 0.956BGD Bangladesh 2,182 1,895 506 175 418 113 778 1,134 428 830 13.2 -48.9 27.1 2,122 1,826 -1,109 121 419 -685 0.946 0.944IND India 6,566 5,925 2,095 379 813 145 3,498 6,688 1,683 6,023 9.8 10.1 17.9 698 -1,807 -1,403 -1,577 -1,678 172 0.950 0.945LKA Sri Lanka 894 694 428 182 355 144 880 466 621 256 22.4 -3.9 40.4 867 668 -449 137 363 -811 0.945 0.949PAK Pakistan 2,292 2,230 126 35 84 19 190 1,486 95 1,422 2.7 -52.6 22.9 1,599 1,635 -1,181 -154 -477 401 0.947 0.957AUT Austria 1,124 781 583 195 513 155 604 2,609 199 2,250 30.6 44.1 30.1 -150 -731 -1,449 -131 71 -134 0.956 0.958BEL Belgium 6,544 5,860 1,610 529 1,047 329 1,943 8,287 798 7,572 10.4 15.5 31.5 3,515 2,327 -5,548 -744 -188 -20 0.943 0.943DEU Germany 28,520 23,753 8,071 2,752 6,905 1,924 8,039 40,679 2,491 35,710 16.7 21.4 27.9 1,077 -6,625 -15,831 569 2,940 -2,800 0.957 0.956DNK Denmark 2,335 1,946 807 331 578 171 852 2,677 354 2,269 16.7 6.1 29.5 961 379 -1,880 109 67 -40 0.949 0.954ESP Spain 6,617 5,477 1,880 582 1,637 438 1,724 10,609 358 9,410 17.2 27.2 26.7 5,108 3,718 -9,256 259 1,411 -1,214 0.944 0.950FIN Finland 3,080 2,495 907 265 818 212 815 2,466 146 1,858 19.0 -27.5 25.9 417 -614 -37 89 426 -276 0.956 0.959FRA France 11,982 9,922 3,409 1,099 2,981 821 3,163 20,367 743 18,210 17.2 31.2 27.6 5,129 2,252 -14,025 -632 1,016 -561 0.954 0.952GBR United Kingdom 19,218 14,952 8,450 3,587 6,849 2,360 8,485 26,206 3,372 21,719 22.2 15.7 34.5 14,267 10,151 -22,087 680 4,402 -3,558 0.949 0.950GRC Greece 1,549 1,380 262 76 228 51 281 1,765 84 1,587 10.9 6.0 22.2 1,469 1,293 -1,692 24 215 -219 0.942 0.945IRL Ireland 2,350 2,138 419 175 328 106 860 3,517 605 3,295 9.0 33.9 32.4 1,378 946 -2,747 -568 -608 189 0.957 0.955ITA Italy 10,939 9,224 3,001 1,056 2,654 849 2,739 14,700 695 12,898 15.7 15.6 32.0 4,202 2,735 -9,250 -1,104 -336 918 0.946 0.951LUX Luxembourg 945 918 73 13 35 7 121 76 58 48 2.9 -447.1 20.4 818 788 40 1 46 -96 0.985 0.955NLD Netherlands 20,779 18,519 4,253 1,690 3,555 1,199 4,649 17,826 1,981 15,473 10.9 -16.2 33.7 17,767 15,534 -15,077 948 2,702 -3,591 0.956 0.960PRT Portugal 685 588 150 43 135 34 149 570 37 469 14.1 -23.9 24.9 550 307 -453 -5 83 -73 0.937 0.947SWE Sweden 2,304 1,860 767 289 652 187 1,446 2,396 944 1,929 19.3 15.4 28.6 -423 -1,481 105 -28 260 -865 0.946 0.950CHE Switzerland 1,847 1,506 1,199 652 812 453 1,235 2,274 661 1,916 18.5 8.9 55.8 -1,085 -1,663 199 -1,484 -2,298 2,044 0.954 0.953NOR Norway 1,208 1,029 338 144 319 130 429 2,353 224 2,164 14.9 41.2 40.8 387 -371 -1,578 -112 159 -121 0.945 0.949CYP Cyprus 206 185 31 7 27 5 62 232 36 210 10.3 14.6 17.3 203 183 -229 1 24 -55 0.950 0.948CZE Czech Republic 1,515 1,351 274 96 252 81 347 3,512 162 3,341 10.8 51.7 32.0 1,197 909 -3,240 -14 125 -163 0.960 0.960EST Estonia 234 202 73 37 64 30 72 379 35 345 13.8 28.5 47.4 197 181 -343 31 67 -65 0.948 0.955HUN Hungary 3,216 2,652 775 176 747 163 1,277 2,871 660 2,288 17.6 0.6 21.8 2,744 2,174 -2,483 170 609 -1,117 0.966 0.969LTU Lithuania 290 274 26 6 22 5 29 295 8 278 5.6 -3.6 21.4 278 260 -283 -36 23 14 0.942 0.948LVA Latvia 195 179 28 10 26 9 27 92 9 75 8.1 -99.5 35.9 183 159 -80 8 28 -24 0.940 0.947MLT Malta 288 273 21 5 20 4 32 78 15 62 5.2 -196.7 19.8 228 21 -58 -29 -61 48 0.936 0.948POL Poland 2,023 1,844 290 92 264 76 261 4,065 53 3,876 8.9 43.7 28.7 1,452 1,353 -3,509 66 250 -220 0.946 0.954SVK Slovak Republic 188 160 44 15 43 14 74 784 43 755 14.8 71.6 32.4 107 31 -706 -2 32 -54 0.952 0.956SVN Slovenia 234 207 39 10 36 8 40 186 9 158 11.5 -26.8 22.4 194 165 -152 -2 25 -22 0.948 0.953ALB Albania 64 63 1 0 1 0 1 101 1 101 0.8 33.0 37.4 63 57 -101 0 1 -1 0.945 0.948BGR Bulgaria 369 338 45 8 38 6 60 465 22 433 8.3 17.3 15.6 328 270 -428 5 38 -53 0.949 0.964HRV Croatia 366 345 35 9 30 7 55 636 28 613 5.8 39.0 24.6 358 323 -628 7 33 -53 0.945 0.958ROM Romania 1,086 1,057 43 11 37 7 57 1,060 23 1,030 2.7 -6.2 19.3 884 730 -865 -26 22 -3 0.943 0.961

Country Code Country Name
China actual exports to partners
China direct exports to Partners
Hong Kong total exports to partner
Hong Kong domestic export to partner
China re-exports to partner via Hong kong
Hong Kong re-export markup
Partners total imports from Hong Kong
Partners total imports from China
Partner imports of Hong Kong domestic products
Partner direct import from China
Re-exports as percent of partner total exports to China
Statistical discrepancies
Hong Kong re-export markup rate
Partners balance of trade with China after adjustment
China reported balance of trade with partners
Partner reported balance of trade with China
Partners balance of trade with Hong Kong after adjustment
Hong Kong reported balance of trade with partners
Partner reported balance of trade with Hong Kong
fob/cif ratio, China to partner
fob/cif ratio, Hong Kong to partner
SER Yugoslavia 170 163 13 4 12 4 13 543 4 535 4.3 65.3 35.0 169 150 -541 4 10 -10 0.946 0.954UKR Ukraine 1,490 1,444 62 10 57 8 59 266 4 218 3.1 -404.5 14.4 1,115 403 95 -2 42 -32 0.946 0.954RUS Russian Federation 9,355 9,102 427 120 361 96 333 4,734 10 4,470 2.7 -105.7 26.6 812 -3,009 3,635 20 -89 -16 0.942 0.954KAZ Kazakhstan 2,216 2,212 10 6 10 5 6 530 1 526 0.2 -340.7 53.6 837 -74 846 5 7 -2 0.943 0.948KGZ Kyrgyz Republic 492 492 1 0 0 0 0 80 0 80 0.1 -548.4 15.6 451 381 -41 0 -1 1 0.939 0.935ARG Argentina 982 852 174 28 151 15 180 1,401 28 1,265 13.2 23.5 10.1 -1,796 -2,407 1,246 -7 -50 -8 0.953 0.958BRA Brazil 4,334 3,675 833 114 778 92 1,121 4,050 372 3,363 15.2 -5.3 11.8 -1,423 -5,030 1,388 -280 -62 -345 0.945 0.959CHL Chile 1,947 1,689 313 36 303 31 362 1,846 72 1,575 13.3 -7.7 10.1 -1,361 -1,989 1,366 -5 122 -224 0.949 0.953COL Colombia 696 629 91 20 86 16 98 1,234 23 1,164 9.6 37.8 19.0 548 453 -1,092 11 71 -78 0.947 0.953ECU Ecuador 369 344 36 8 34 7 36 704 7 677 6.9 42.3 21.9 317 250 -653 3 24 -29 0.943 0.949PER Peru 461 418 61 14 55 9 72 768 22 723 9.3 34.4 17.1 -790 -1,109 468 -2 24 -40 0.946 0.947PRY Paraguay 337 235 132 19 124 17 143 486 27 380 30.3 22.5 14.1 287 175 -442 13 112 -133 0.963 0.965VEN Venezuela 652 596 76 15 73 13 98 185 34 125 8.7 -173.7 17.9 488 -147 -26 4 61 -78 0.945 0.947URY Uruguay 228 210 25 4 22 3 31 173 10 154 8.1 -29.5 13.7 105 99 -61 -4 -5 -12 0.954 0.959CRI Costa Rica 172 154 26 7 25 6 77 270 57 251 10.3 39.5 25.4 -33 -490 -107 -47 -246 62 0.944 0.948GTM Guatemala 475 393 116 28 110 23 156 198 62 111 17.3 -77.7 21.1 455 349 -179 27 113 -155 0.939 0.940PAN Panama 2,650 2,187 582 77 548 61 547 501 21 19 17.5 -221.8 11.1 2,639 2,171 -490 71 567 -538 0.954 0.962DZA Algeria 976 971 8 2 7 2 32 919 26 913 0.5 -9.2 25.8 713 711 -656 2 8 -32 0.944 0.955EGY Egypt Arab Rep 1,429 1,345 131 34 112 24 144 563 41 474 5.9 -134.2 21.1 1,318 1,150 -460 31 67 -131 0.944 0.947IRN Iran Islamic Rep 2,506 2,476 50 9 36 5 51 1,145 9 1,113 1.2 -122.5 13.8 2,291 -2,021 -956 -39 -79 30 0.947 0.960ISR Israel 1,878 1,540 873 202 495 138 1,889 1,469 1,178 1,113 18.0 13.2 27.9 932 509 -688 -1,189 -252 21 0.946 0.943JOR Jordan 761 623 201 51 185 39 206 681 47 535 18.1 -14.8 21.2 720 534 -641 50 196 -204 0.945 0.946LBN Lebanon 511 484 46 12 38 10 46 448 9 420 5.2 -20.1 26.1 503 470 -444 4 38 -34 0.936 0.945MAR Morocco 954 935 30 9 26 6 52 746 30 726 2.0 -30.8 22.8 829 720 -695 7 -84 42 0.941 0.951NGA Nigeria 1,787 1,719 120 35 99 28 203 751 113 680 3.8 -114.2 28.5 1,704 1,253 -675 35 100 -195 0.949 0.951SAU Saudi Arabia 2,988 2,776 295 55 266 43 275 1,771 22 1,547 7.1 -70.9 16.0 -4,625 -4,749 5,676 -96 -75 44 0.937 0.949SYR Syrian Arab Republic 721 690 42 7 37 5 37 310 0 278 4.2 -132.2 13.6 700 662 -289 7 41 -36 0.948 0.963TUN Tunisia 254 245 15 4 13 3 33 291 22 282 3.6 12.6 26.2 224 211 -266 3 7 -26 0.945 0.955TUR Turkey 3,163 2,804 513 73 422 47 586 4,476 129 4,103 11.4 23.5 11.2 2,786 2,205 -4,139 -26 358 -441 0.947 0.960YEM Yemen 455 452 6 2 3 0 6 234 3 231 0.6 -104.9 14.0 -716 -1,007 935 -4 -10 3 0.936 0.952BEN Benin 580 577 6 1 4 0 8 48 3 45 0.5 -1019.8 12.6 563 466 -30 0 6 -8 0.943 0.951GHA Ghana 524 510 24 7 18 4 47 188 30 173 2.6 -149.4 20.2 491 430 -155 6 -72 32 0.937 0.944KEN Kenya 396 347 67 14 60 8 69 188 13 137 12.4 -90.8 13.1 364 312 -178 12 16 -43 0.944 0.948MOZ Mozambique 78 75 5 1 4 1 5 18 1 15 3.9 -280.5 25.3 65 31 -11 1 -8 1 0.944 0.949MWI Malawi 20 19 2 0 2 0 4 25 3 24 6.9 20.3 19.0 20 19 -25 0 2 -4 0.947 0.950MDG Madagascar 224 152 103 23 91 16 88 174 3 98 32.0 -32.7 17.0 211 134 -165 17 94 -78 0.938 0.936SDN Sudan 731 730 7 2 2 0 11 263 6 261 0.2 -186.4 20.6 586 -981 -122 -3 -1 -2 0.942 0.960TGO Togo 422 399 29 4 29 4 40 56 14 31 5.6 -394.6 14.3 404 352 -38 3 26 -38 0.951 0.964TZA Tanzania 228 215 17 3 16 2 22 175 7 162 5.7 -31.1 14.7 142 133 -104 -2 -19 10 0.943 0.952UGA Uganda 74 71 4 1 4 1 17 103 14 99 4.2 30.7 18.0 53 44 -97 -12 -13 12 0.947 0.949ZAF South Africa 3,414 2,952 745 121 581 95 1,073 3,582 420 3,098 13.5 6.0 16.4 2,192 411 -2,526 -173 55 -503 0.948 0.954ZMB Zambia 52 51 2 1 2 0 9 46 7 44 2.5 -5.4 26.2 22 -120 -16 -1 -10 3 0.961 0.963ZWE Zimbabwe 80 78 3 1 2 1 11 65 9 63 2.1 -14.9 27.6 -34 -63 47 -2 -8 -2 0.953 0.951OTH Other reporting countries 3,927 3,364 789 157 708 112 1,113 3,417 446 2,823 14.3 -10.9 15.9 2,204 -4,301 -1,781 59 527 -864 0.942 0.947NRP No reporting partner countries12,863 11,739 2,425 381 1,384 206 2,147 1,178 0 0 8.7 -382.5 14.9 -25,154 11,540 36,665 381 2,128 -1,867 0.943 0.951PTN Partner Total 564,172 491,441 144,986 51,618 110,863 34,417 147,933 661,451 49,847 585,209 119,618 -7,633 -282,386 -38,889 -8,145 24,562HKG Hong Kong China 36,297 100,215 0 0 0 0 0 82,410 0 12,363 0.0 0.0 0.0 24,768 88,676 -834 0 0 0 0.951 CHN China 0 0 78,989 11,529 0 0 82,345 0 11,539 0 0.0 -28.2 0.0 0 0 0 -24,768 -834 88,676 0.952WLD World Total 600,470 591,656 223,975 63,148 110,863 34,417 230,279 743,862 61,386 597,572 12.1 3.9 31.0 144,385 81,043 -283,220 -63,656 -8,979 113,238

Table 2 Initial Estimates of Bilateral Trade Between China, Hong Kong and their Partner Countries, Westbound Flows, 2004, in Millions of U.S. Dollars
Country Code Country Name
Partner actual exports to China
Partner direct exports to China
Partner total exports to Hong Kong
Partner exports remain in Hong Kong
Partner re-exports to China via Hong kong
Hong Kong re-export markup
Hong Kong total imports from partners
China total imports from partners
Hong Kong retained imports from partner
China direct import from partner
Re-exports as percent of partner total exports to China
Statistical discrepancies
Hong Kong re-export markup rate
Partners balance of trade with China after adjustment
Partners balance of trade with Hong Kong after adjustment
fob/cif ratio, partner to China
fob/cif ratio, partner to Hong Kong
Variable in the model TX0(s,CH) DX0(s,CH) TX0(s,Hk) DX0(s,Hk) RX0(s,CH) RXM0(s,CH) TM0(s,HK) TM0(s,CH) DM0(s,HK) DM0(s,CH)
(RX0(r,CH)-RXM0(r,CH))/RX0(r,CH) SDX(s)
RXM0(CH,r)/RX0(CH,r)
TX0(CH,r)-TX0(r,CH)
TX0(HK,r)-TX0(r,HK) cif(s,CH) cif(s,HK)
USA United States 38,873 34,058 15,505 9,036 5,795 781 14,456 44,723 7,727 39,716 12.3 1.7 13.5 -108,876 -8,671 0.963 0.965CAN Canada 5,625 5,090 1,068 476 585 30 1,203 7,346 589 6,790 9.4 16.3 5.1 -4,395 -600 0.948 0.958MEX Mexico 681 474 484 209 309 97 334 2,142 53 1,929 29.9 48.5 31.3 -4,952 -17 0.971 0.972AUS Australia 6,825 6,309 2,035 1,271 581 42 1,864 11,543 1,067 11,001 7.5 25.7 7.3 -3,637 209 0.911 0.940NZL New Zealand 1,205 1,100 372 256 131 21 325 1,413 203 1,303 8.6 2.5 15.7 -107 123 0.943 0.936JPN Japan 89,163 70,608 32,979 11,092 20,625 1,600 32,914 94,257 10,476 75,231 20.5 -1.7 7.8 7,920 6,790 0.969 0.972KOR Korea Rep 56,061 49,757 18,127 10,840 6,730 225 12,897 62,160 5,387 55,655 11.1 -3.8 3.3 26,748 8,724 0.964 0.968TWN Taiwan China 47,176 33,997 29,728 15,285 14,773 1,237 19,895 64,778 5,069 51,242 27.4 4.8 8.4 31,984 13,065 0.968 0.968SGP Singapore 17,373 15,122 17,200 14,358 2,471 150 14,243 13,966 11,311 11,644 12.7 -29.0 6.1 2,611 12,263 0.969 0.966MAC Macao 402 392 309 145 12 2 293 217 124 206 2.5 -75.3 13.3 -1,366 -207 0.960 0.968IDN Indonesia 4,365 3,652 1,263 437 826 79 1,765 7,198 899 6,451 16.0 31.4 9.6 -2,521 156 0.935 0.938MYS Malaysia 11,683 8,395 7,471 3,263 4,169 818 6,666 18,160 2,385 14,808 27.5 16.4 19.6 2,734 2,178 0.958 0.977PHL Philippines 3,983 2,161 3,221 794 1,879 38 4,331 9,075 1,876 7,232 44.6 41.1 2.0 -1,243 -282 0.986 0.987THA Thailand 7,760 5,543 4,205 1,481 2,447 138 4,849 11,543 2,022 9,234 28.2 20.4 5.7 944 472 0.952 0.959VNM Vietnam 1,532 1,432 388 219 111 11 448 2,482 278 2,382 6.2 32.1 10.2 -3,294 -98 1.000 1.000KHM Cambodia 8 7 355 353 1 0 8 30 6 29 14.0 -917.5 5.5 -748 243 0.956 0.944BGD Bangladesh 60 24 93 54 45 8 88 69 47 31 59.1 -4.6 17.9 -2,122 -121 0.957 0.962IND India 5,868 5,285 3,670 1,955 621 16 3,773 7,731 2,010 7,119 9.7 -0.7 2.5 -698 1,577 0.903 0.978LKA Sri Lanka 27 17 69 45 12 1 65 27 41 16 37.1 -25.7 7.5 -867 -137 0.924 0.956PAK Pakistan 693 306 590 189 428 26 603 596 185 193 55.0 -13.0 6.0 -1,599 154 0.959 0.961AUT Austria 1,275 1,160 470 325 134 15 512 1,511 361 1,392 8.9 8.9 11.5 150 131 0.971 0.942BEL Belgium 3,029 2,739 1,924 1,273 387 86 1,797 3,534 1,128 3,231 9.1 -3.3 22.1 -3,515 744 0.960 0.976DEU Germany 27,443 24,847 5,238 2,183 2,923 245 5,131 30,378 1,980 27,699 9.3 3.8 8.4 -1,077 -569 0.971 0.970DNK Denmark 1,374 797 812 223 677 75 739 1,568 125 925 40.9 1.2 11.0 -961 -109 0.964 0.960ESP Spain 1,509 1,353 510 323 180 18 469 1,759 273 1,593 10.1 4.1 9.8 -5,108 -259 0.958 0.956FIN Finland 2,662 2,430 539 176 253 14 482 3,109 108 2,859 8.4 4.5 5.5 -417 -89 0.972 0.970FRA France 6,853 6,342 2,603 1,731 592 65 2,393 7,670 1,493 7,143 7.3 -0.2 11.0 -5,129 632 0.974 0.972GBR United Kingdom 4,951 4,119 4,927 2,907 970 114 4,048 4,801 1,990 3,942 16.4 -28.5 11.8 -14,267 -680 0.969 0.976GRC Greece 79 73 62 51 11 4 47 87 35 80 7.8 -16.0 39.2 -1,469 -24 0.931 0.955IRL Ireland 972 770 1,050 743 484 279 1,027 1,192 717 987 20.2 2.8 57.7 -1,378 568 0.984 0.986ITA Italy 6,737 5,450 3,657 2,160 1,537 207 3,337 6,490 1,792 5,138 18.8 -11.3 13.5 -4,202 1,104 0.969 0.968LUX Luxembourg 127 115 25 12 13 1 26 129 13 117 9.2 -3.2 8.1 -818 -1 0.956 0.966NLD Netherlands 3,012 2,749 1,059 742 301 29 1,550 2,985 1,223 2,712 8.5 5.6 9.7 -17,767 -948 0.964 0.965PRT Portugal 134 117 76 49 21 3 67 281 39 263 12.8 34.8 12.9 -550 5 0.950 0.970SWE Sweden 2,728 2,501 581 317 286 53 507 3,341 235 3,107 8.2 10.1 18.4 423 28 0.969 0.970CHE Switzerland 2,932 2,473 3,279 2,136 516 47 3,496 3,169 2,327 2,698 15.3 -5.9 9.1 1,085 1,484 0.978 0.977NOR Norway 821 775 307 256 70 22 179 1,399 125 1,352 5.6 23.7 32.1 -387 112 0.944 0.951CYP Cyprus 4 3 7 6 1 1 7 2 6 2 18.1 -23.4 49.4 -203 -1 0.976 0.993CZE Czech Republic 318 271 184 110 56 8 148 442 71 395 14.4 7.5 14.5 -1,197 14 0.970 0.970EST Estonia 37 36 8 6 2 0 5 21 4 19 3.5 -79.4 11.2 -197 -31 0.964 0.967HUN Hungary 472 387 160 6 94 7 166 477 9 391 17.7 -11.5 7.6 -2,744 -170 0.977 0.981LTU Lithuania 12 12 42 42 0 0 3 14 2 13 1.5 -254.5 29.5 -278 36 0.959 0.996LVA Latvia 11 11 3 3 0 0 0 20 0 20 0.9 24.0 4.9 -183 -8 0.959 0.965MLT Malta 59 20 80 33 53 12 82 252 34 212 65.5 55.6 23.6 -228 29 0.990 0.991POL Poland 571 556 41 26 17 2 40 490 24 475 2.5 -20.3 10.0 -1,452 -66 0.960 0.958SVK Slovak Republic 81 78 21 17 3 0 12 129 8 125 3.6 24.5 9.8 -107 2 0.963 0.966SVN Slovenia 40 34 17 11 6 1 13 42 7 37 13.1 -6.8 11.9 -194 2 0.971 0.971ALB Albania 1 1 0 0 0 0 0 6 0 6 4.8 88.1 4.0 -63 0 0.999 0.998BGR Bulgaria 40 37 7 3 4 1 8 68 4 65 7.4 31.5 14.9 -328 -5 0.929 0.980HRV Croatia 8 7 3 2 0 0 2 22 2 22 4.1 56.6 21.4 -358 -7 0.987 0.978

Country Code Country Name
Partner actual exports to China
Partner direct exports to China
Partner total exports to Hong Kong
Partner exports remain in Hong Kong
Partner re-exports to China via Hong kong
Hong Kong re-export markup
Hong Kong total imports from partners
China total imports from partners
Hong Kong retained imports from partner
China direct import from partner
Re-exports as percent of partner total exports to China
Statistical discrepancies
Hong Kong re-export markup rate
Partners balance of trade with China after adjustment
Partners balance of trade with Hong Kong after adjustment
fob/cif ratio, partner to China
fob/cif ratio, partner to Hong Kong
ROM Romania 202 195 53 37 21 13 21 327 5 320 3.3 19.2 64.9 -884 26 0.941 0.974SER Yugoslavia 2 1 3 1 1 0 3 13 0 12 38.8 53.6 22.2 -169 -4 0.964 0.977UKR Ukraine 375 361 27 12 16 1 19 1,041 4 1,027 3.6 59.4 8.2 -1,115 2 0.949 0.955RUS Russian Federation 8,543 8,369 317 99 195 10 516 12,111 285 11,927 2.0 24.9 5.2 -812 -20 0.940 0.938KAZ Kazakhstan 1,379 1,376 4 1 4 0 3 2,286 0 2,283 0.2 36.0 8.4 -837 -5 0.951 0.943KGZ Kyrgyz Republic 41 39 2 0 1 0 2 111 0 110 3.2 59.8 7.6 -451 0 0.947 0.996ARG Argentina 2,779 2,647 172 35 149 13 224 3,260 81 3,123 4.7 10.8 8.7 1,796 7 0.949 0.962BRA Brazil 5,757 5,438 776 395 352 19 895 8,705 497 8,370 5.4 24.9 5.5 1,423 280 0.927 0.960CHL Chile 3,308 3,213 138 41 108 8 191 3,678 88 3,577 2.9 5.8 6.9 1,361 5 0.948 0.943COL Colombia 148 142 20 9 7 0 20 177 8 170 4.2 9.4 2.9 -548 -11 0.963 0.958ECU Ecuador 52 50 7 5 2 0 11 93 9 91 3.3 42.4 10.4 -317 -3 0.992 0.950PER Peru 1,251 1,236 32 15 18 2 37 1,527 20 1,511 1.2 10.8 9.5 790 2 0.920 0.952PRY Paraguay 50 45 11 5 6 0 19 60 14 54 10.0 19.8 2.0 -287 -13 0.953 0.940VEN Venezuela 164 159 21 11 6 1 15 742 5 736 3.1 72.2 8.5 -488 -4 0.950 0.962URY Uruguay 123 112 20 8 11 0 30 111 18 99 8.6 -6.0 1.9 -105 4 0.962 0.967CRI Costa Rica 205 163 139 54 118 75 273 644 186 601 20.1 57.4 63.6 33 47 0.988 0.986GTM Guatemala 20 19 1 0 1 0 3 43 2 43 2.5 53.4 7.1 -455 -27 0.998 0.977PAN Panama 12 11 8 7 1 0 16 16 14 14 8.4 31.2 5.6 -2,639 -71 0.958 0.936DZA Algeria 262 262 0 0 0 0 0 259 0 259 0.0 -2.0 8.2 -713 -2 0.992 0.997EGY Egypt Arab Rep 112 102 13 3 10 0 64 196 54 185 8.2 46.9 3.0 -1,318 -31 0.934 0.944IRN Iran Islamic Rep 216 189 82 48 31 3 128 4,497 93 4,469 11.7 93.0 9.2 -2,291 39 0.934 0.971ISR Israel 946 780 1,911 1,391 216 21 1,125 1,031 563 792 16.9 -58.7 9.8 -932 1,189 0.958 0.959JOR Jordan 41 40 2 1 1 0 6 89 5 88 2.0 52.2 4.3 -720 -50 0.977 0.983LBN Lebanon 8 4 12 8 4 0 8 13 4 9 44.6 5.4 5.5 -503 -4 0.972 0.993MAR Morocco 126 50 94 2 82 6 114 215 21 139 58.3 26.7 7.7 -829 -7 0.972 0.993NGA Nigeria 83 76 8 0 8 1 20 467 12 460 7.5 80.0 7.3 -1,704 -35 0.943 0.966SAU Saudi Arabia 7,613 7,447 319 151 195 18 371 7,525 193 7,348 2.2 -7.2 9.3 4,625 96 0.937 0.940SYR Syrian Arab Republic 21 21 1 0 1 0 1 28 0 28 2.3 23.8 8.3 -700 -7 0.997 0.970TUN Tunisia 30 26 7 1 6 1 8 34 1 29 15.3 2.6 16.2 -224 -3 0.931 0.959TUR Turkey 377 337 144 100 47 6 155 599 109 557 10.3 24.5 13.1 -2,786 26 0.921 0.941YEM Yemen 1,171 1,169 9 6 2 0 16 1,459 12 1,457 0.2 14.9 7.0 716 4 0.940 0.977BEN Benin 17 17 1 0 0 0 0 111 0 111 0.1 83.9 1.0 -563 0 0.997 0.992GHA Ghana 33 33 79 1 0 0 96 80 0 80 0.9 -28.4 11.3 -491 -6 0.932 0.823KEN Kenya 32 11 26 2 24 1 52 35 26 11 64.9 26.2 4.8 -364 -12 0.945 0.953MOZ Mozambique 13 7 6 0 7 1 12 45 6 38 37.2 63.3 13.0 -65 -1 0.919 0.930MWI Malawi 0 0 0 0 0 0 0 0 0 0 30.4 -86.4 13.6 -20 0 0.980 0.986MDG Madagascar 13 9 10 6 4 0 9 18 4 14 31.4 0.0 3.3 -211 -17 0.882 0.858SDN Sudan 146 141 9 5 5 0 8 1,711 3 1,705 3.2 90.4 2.8 -586 3 0.943 0.982TGO Togo 18 18 2 1 1 0 4 47 3 46 3.2 58.1 9.2 -404 -3 0.999 0.988TZA Tanzania 86 71 32 4 16 1 35 82 5 65 16.2 -23.0 4.7 -142 2 0.912 0.928UGA Uganda 20 5 29 13 17 2 17 27 0 10 71.1 -22.3 9.4 -53 12 0.958 0.953ZAF South Africa 1,222 1,057 571 294 183 10 691 2,541 399 2,367 13.2 35.6 5.4 -2,192 173 0.920 0.955ZMB Zambia 31 29 12 1 1 0 12 171 1 170 4.2 71.4 4.9 -22 1 0.969 0.965ZWE Zimbabwe 114 112 9 3 3 0 10 141 5 139 2.1 13.2 4.1 34 2 0.955 0.972OTH Other reporting countries 1,723 1,636 249 98 102 10 262 7,665 104 7,572 4.9 72.6 9.8 -2,204 -59 0.933 0.940NRP No reporting partner countries 38,018 37,843 280 0 201 16 298 199 0 0 0.5 -8111.9 7.9 25,154 -381 0.979 0.942PTN Partner Total 444,555 379,065 172,495 90,507 74,329 6,869 153,132 499,074 68,750 431,445 -119,618 38,889HKG Hong Kong China 11,529 78,989 0 0 0 0 11,539 82,345 0.0 -9.2 0.0 -24,768 0 0.952 CHN China 0 100,215 36,297 0 0 82,410 0 12,363 0 0.0 -8.2 0.0 0 24,768 0.951WLD World Total 456,084 458,054 272,710 126,804 74,329 6,869 235,542 510,613 81,113 513,791 12.3 -2.5 9.2 -144,385 63,656

Table 3 Adjusted Estimates of Bilateral Trade Between China, Hong Kong and their Partner Countries, Eastbound Flows, 2004, in Millions of U.S. Dollars
Country Code Country Name
China actual exports to partners
China direct exports to Partners
Hong Kong total exports to partner
Hong Kong domestic export to partner
China re-exports to partner via Hong kong
Hong Kong re-export markup
Partners total imports from Hong Kong
Partners total imports from China
Partner imports of Hong Kong domestic products
Partner direct import from China
Re-exports as percent of partner total exports to China
Statistical discrepancies
Hong Kong re-export markup rate
Partners balance of trade with China after adjustment
China reported balance of trade with partners
Partner reported balance of trade with China
Partners balance of trade with Hong Kong after adjustment
Hong Kong reported balance of trade with partners
Partner reported balance of trade with Hong Kong
fob/cif ratio, China to partner
fob/cif ratio, Hong Kong to partner
Variable in the model TX(CH,r) DX(CH,r) TX(HK,r) DX(HK,r) RX(s,CH) RXM(CH,r) TM(HK,r) TM(CH,r) DM(HK,r) DM(CH,r)
(RX(CH,r)-RXM(CH,r))/RX(CH,r) SDX(r)
RXM(CH,r)/RX(CH,r)
TX(CH,r)-TX(r,CH)
TX0(CH,r)-TM0(r,CH)
TX0(r,CH)-TM0(CH,r)
TX(HK,r)-TX(r,HK)
TX0(HK,r)-TM0(r,HK)
TX0(r,HK)-TM0(HK,r) cif(CH,r) cif(HK,r)
USA United States 167,059 148,529 31,128 9,284 35,587 16,095 33,104 176,838 9,893 157,322 11.1 0.0 45.2 126,105 80,395 -174,095 1,640 29,469 -21,543 0.945 0.939CAN Canada 12,837 11,192 2,410 598 2,761 1,029 2,539 13,587 631 11,857 12.8 0.0 37.3 6,661 816 -13,436 68 1,929 -1,654 0.944 0.947MEX Mexico 7,389 6,773 951 288 808 163 996 7,749 302 7,104 8.3 0.0 20.2 6,170 2,831 -13,529 189 604 -668 0.952 0.954AUS Australia 11,095 9,604 2,819 892 2,493 926 2,957 11,667 939 10,110 13.4 0.0 37.2 2,562 -2,704 -6,755 -98 1,326 -1,132 0.951 0.953NZL New Zealand 1,680 1,460 351 95 355 125 367 1,770 100 1,542 13.1 0.0 35.1 479 -336 -1,080 -105 88 -25 0.949 0.955JPN Japan 84,747 77,470 10,001 1,300 11,977 4,362 10,463 89,683 1,368 82,088 8.6 0.0 36.4 -4,948 -21,035 -22,981 -7,897 -19,115 21,704 0.946 0.954KOR Korea Rep 27,351 25,846 5,092 1,618 2,832 1,271 5,274 29,161 1,679 27,603 5.5 0.0 44.9 -30,132 -34,350 20,173 -3,658 -7,244 11,198 0.941 0.966TWN Taiwan China 14,908 13,300 5,606 1,936 2,486 812 5,805 15,717 2,008 14,057 10.8 0.0 32.7 -39,290 -51,289 17,373 -5,131 -13,597 23,439 0.950 0.967SGP Singapore 14,035 12,041 5,996 2,942 3,456 1,384 6,214 14,589 3,049 12,531 14.2 0.0 40.0 416 -1,282 -889 -8,584 -8,655 9,981 0.961 0.966MAC Macao 1,599 1,411 1,205 286 256 57 1,254 1,683 299 1,487 11.8 0.0 22.2 1,470 1,388 -1,140 209 950 -984 0.951 0.963IDN Indonesia 3,169 2,651 973 275 851 309 1,024 3,388 291 2,845 16.3 0.0 36.3 -2,105 -942 793 -259 -661 175 0.939 0.951MYS Malaysia 8,667 7,813 3,002 1,943 1,625 736 3,120 9,071 2,018 8,186 9.9 0.0 45.3 -5,587 -10,073 -1,704 -471 -4,377 3,444 0.954 0.965PHL Philippines 2,187 1,498 2,799 1,654 1,679 962 2,913 2,313 1,722 1,599 31.5 0.0 57.3 -3,365 -4,806 273 369 -1,816 -1 0.950 0.961THA Thailand 5,787 4,775 2,521 948 1,838 784 2,619 6,038 987 4,990 17.5 0.0 42.6 -3,116 -5,757 -579 -725 -2,210 1,420 0.953 0.964VNM Vietnam 1,794 1,279 1,516 672 746 202 1,516 1,794 672 1,279 28.7 0.0 27.0 -22 1,777 -223 428 771 -1,319 1.000 1.000KHM Cambodia 587 356 604 339 393 149 631 614 355 373 39.3 0.0 37.9 575 422 -351 335 443 -423 0.952 0.956BGD Bangladesh 1,225 889 709 323 418 63 750 1,296 343 941 27.4 0.0 15.0 1,103 1,826 -1,109 272 419 -685 0.946 0.944IND India 6,280 5,623 2,403 800 813 130 2,543 6,634 848 5,954 10.5 0.0 16.0 -239 -1,807 -1,403 -1,067 -1,678 172 0.950 0.945LKA Sri Lanka 506 255 799 494 355 90 841 536 521 273 49.5 0.0 25.4 481 668 -449 448 363 -811 0.945 0.949PAK Pakistan 1,595 1,534 164 77 84 21 172 1,689 81 1,626 3.8 0.0 24.7 1,068 1,635 -1,181 -100 -477 401 0.947 0.957AUT Austria 1,565 1,247 525 172 513 183 548 1,642 181 1,312 20.3 0.0 35.6 205 -731 -1,449 -142 71 -134 0.956 0.958BEL Belgium 6,862 6,327 1,475 580 1,047 491 1,573 7,266 624 6,709 7.8 0.0 46.9 3,676 2,327 -5,548 -531 -188 -20 0.943 0.943DEU Germany 32,370 28,163 7,056 2,322 6,905 2,521 7,363 33,889 2,435 29,515 13.0 0.0 36.5 4,208 -6,625 -15,831 360 2,940 -2,800 0.957 0.956DNK Denmark 2,195 1,844 733 325 578 212 767 2,319 341 1,953 16.0 0.0 36.6 798 379 -1,880 195 67 -40 0.949 0.954ESP Spain 8,096 7,067 1,591 386 1,637 557 1,673 8,569 408 7,489 12.7 0.0 34.0 6,510 3,718 -9,256 123 1,411 -1,214 0.944 0.950FIN Finland 2,228 1,626 786 143 818 194 819 2,343 150 1,717 27.0 0.0 23.8 -645 -614 -37 -15 426 -276 0.956 0.959FRA France 15,170 13,315 2,854 745 2,981 1,040 2,991 15,936 784 13,997 12.2 0.0 34.9 8,047 2,252 -14,025 -734 1,016 -561 0.954 0.952GBR United Kingdom 21,090 17,322 7,848 3,508 6,849 2,896 8,250 22,265 3,701 18,316 17.9 0.0 42.3 16,491 10,151 -22,087 1,483 4,402 -3,558 0.949 0.950GRC Greece 1,538 1,398 234 80 228 81 247 1,633 85 1,486 9.1 0.0 35.6 1,462 1,293 -1,692 43 215 -219 0.942 0.945IRL Ireland 2,692 2,484 579 356 328 111 605 2,813 372 2,596 7.7 0.0 33.9 1,656 946 -2,747 -357 -608 189 0.957 0.955ITA Italy 12,150 10,748 2,276 664 2,654 1,184 2,385 12,847 697 11,379 11.5 0.0 44.6 6,019 2,735 -9,250 -1,072 -336 918 0.946 0.951LUX Luxembourg 44 34 265 219 35 24 269 47 220 36 24.3 0.0 68.4 -72 788 40 208 46 -96 0.985 0.955NLD Netherlands 17,070 14,874 4,271 1,865 3,555 1,270 4,437 17,830 1,934 15,547 12.9 0.0 35.7 14,289 15,534 -15,077 890 2,702 -3,591 0.956 0.960PRT Portugal 549 455 138 34 135 36 146 588 36 489 17.2 0.0 26.5 381 307 -453 -8 83 -73 0.937 0.947SWE Sweden 2,126 1,726 1,004 577 652 235 1,057 2,254 610 1,836 18.8 0.0 36.0 -849 -1,481 105 344 260 -865 0.946 0.950CHE Switzerland 1,812 1,518 957 478 812 504 1,005 1,899 504 1,592 16.2 0.0 62.0 -1,118 -1,663 199 -1,584 -2,298 2,044 0.954 0.953NOR Norway 1,427 1,271 313 143 319 155 330 1,514 152 1,350 10.9 0.0 48.7 414 -371 -1,578 34 159 -121 0.945 0.949CYP Cyprus 191 173 38 18 27 9 40 202 19 184 9.2 0.0 32.1 156 183 -229 -46 24 -55 0.950 0.948CZE Czech Republic 2,126 1,984 269 115 252 104 280 2,216 120 2,069 6.7 0.0 41.2 1,766 909 -3,240 31 125 -163 0.960 0.960EST Estonia 268 238 65 32 64 33 68 282 33 250 11.1 0.0 51.7 246 181 -343 28 67 -65 0.948 0.955HUN Hungary 2,735 2,205 904 352 747 199 932 2,827 364 2,281 19.4 0.0 26.7 2,268 2,174 -2,483 334 609 -1,117 0.966 0.969LTU Lithuania 267 251 24 6 22 5 25 283 7 266 6.1 0.0 21.8 257 260 -283 -35 23 14 0.942 0.948LVA Latvia 96 83 22 8 26 12 23 102 8 89 13.4 0.0 47.9 85 159 -80 7 28 -24 0.940 0.947MLT Malta 72 59 24 10 20 6 26 77 11 63 18.3 0.0 29.2 -17 21 -58 -23 -61 48 0.936 0.948POL Poland 2,685 2,505 247 54 264 76 259 2,837 56 2,648 6.7 0.0 28.7 2,206 1,353 -3,509 31 250 -220 0.946 0.954SVK Slovak Republic 331 308 48 23 43 19 50 348 24 324 7.0 0.0 43.9 228 31 -706 -231 32 -54 0.952 0.956SVN Slovenia 180 155 34 7 36 10 36 190 8 164 13.8 0.0 28.2 144 165 -152 1 25 -22 0.948 0.953ALB Albania 62 62 5,985 5,984 1 0 6,255 66 6,254 65 0.8 0.0 41.8 61 57 -101 5,984 1 -1 0.945 0.948BGR Bulgaria 367 338 47 14 38 7 49 386 15 356 8.0 0.0 19.0 317 270 -428 11 38 -53 0.949 0.964HRV Croatia 400 380 37 14 30 9 39 423 15 402 4.9 0.0 30.9 390 323 -628 12 33 -53 0.945 0.958ROM Romania 805 778 43 14 37 9 45 854 15 825 3.4 0.0 24.3 555 730 -865 -24 22 -3 0.943 0.961SER Yugoslavia 282 276 11 4 12 5 11 298 4 292 2.2 0.0 45.3 272 150 -541 3 10 -10 0.946 0.954

Country Code Country Name
China actual exports to partners
China direct exports to Partners
Hong Kong total exports to partner
Hong Kong domestic export to partner
China re-exports to partner via Hong kong
Hong Kong re-export markup
Partners total imports from Hong Kong
Partners total imports from China
Partner imports of Hong Kong domestic products
Partner direct import from China
Re-exports as percent of partner total exports to China
Statistical discrepancies
Hong Kong re-export markup rate
Partners balance of trade with China after adjustment
China reported balance of trade with partners
Partner reported balance of trade with China
Partners balance of trade with Hong Kong after adjustment
Hong Kong reported balance of trade with partners
Partner reported balance of trade with Hong Kong
fob/cif ratio, China to partner
fob/cif ratio, Hong Kong to partner
UKR Ukraine 518 475 55 6 57 12 57 549 7 505 8.3 0.0 20.6 26 403 95 -2 42 -32 0.946 0.954RUS Russian Federation 5,245 4,997 296 12 361 101 309 5,594 12 5,334 4.7 0.0 28.0 -4,475 -3,009 3,635 -1,159 -89 -16 0.942 0.954KAZ Kazakhstan 897 891 7 1 10 4 7 952 1 946 0.6 0.0 39.2 -739 -74 846 1 7 -2 0.943 0.948KGZ Kyrgyz Republic 204 204 0 0 0 0 1 218 0 218 0.2 0.0 15.7 146 381 -41 0 -1 1 0.939 0.935ARG Argentina 1,119 992 166 28 151 18 173 1,173 29 1,041 11.4 0.0 12.2 -1,813 -2,407 1,246 -36 -50 -8 0.953 0.958BRA Brazil 3,850 3,215 959 282 778 117 1,004 4,067 298 3,405 16.5 0.0 15.0 -3,069 -5,030 1,388 -149 -62 -345 0.945 0.959CHL Chile 1,774 1,527 317 54 303 43 333 1,870 57 1,611 13.9 0.0 14.3 -1,611 -1,989 1,366 -12 122 -224 0.949 0.953COL Colombia 879 820 83 20 86 25 87 927 21 865 6.7 0.0 28.5 734 453 -1,092 11 71 -78 0.947 0.953ECU Ecuador 484 462 32 8 34 11 34 513 9 489 4.6 0.0 31.0 412 250 -653 1 24 -29 0.943 0.949PER Peru 561 525 58 18 55 17 61 593 20 555 6.4 0.0 31.3 -788 -1,109 468 -695 24 -40 0.946 0.947PRY Paraguay 382 289 117 13 124 27 121 397 14 300 24.5 0.0 21.4 -1,368 175 -442 4 112 -133 0.963 0.965VEN Venezuela 207 160 76 25 73 23 80 221 26 171 22.7 0.0 31.9 -183 -147 -26 22 61 -78 0.945 0.947URY Uruguay 172 155 26 7 22 5 27 180 7 163 9.7 0.0 22.5 78 99 -61 -5 -5 -12 0.954 0.959CRI Costa Rica 196 182 38 23 25 11 40 207 24 193 7.1 0.0 42.2 -128 -490 -107 -78 -246 62 0.944 0.948GTM Guatemala 396 312 134 44 110 22 143 422 47 333 21.2 0.0 19.5 373 349 -179 43 113 -155 0.939 0.940PAN Panama 1,857 1,645 285 38 548 326 297 1,937 41 1,717 11.4 0.0 59.4 1,844 2,171 -490 33 567 -538 0.954 0.962DZA Algeria 883 878 18 11 7 2 18 934 12 928 0.6 0.0 23.9 12 711 -656 11 8 -32 0.944 0.955EGY Egypt Arab Rep 970 893 125 36 112 31 133 1,024 38 943 7.9 0.0 27.6 833 1,150 -460 11 67 -131 0.944 0.947IRN Iran Islamic Rep 1,324 1,296 46 9 36 7 48 1,394 9 1,365 2.1 0.0 20.1 -2,337 -2,021 -956 -65 -79 30 0.947 0.960ISR Israel 1,374 1,165 1,183 655 495 277 1,253 1,456 694 1,239 15.2 0.0 55.9 462 509 -688 27 -252 21 0.946 0.943JOR Jordan 628 489 197 47 185 39 209 665 50 518 22.0 0.0 21.1 605 534 -641 45 196 -204 0.945 0.946LBN Lebanon 400 376 40 8 38 13 42 426 9 401 6.0 0.0 33.3 391 470 -444 -2,553 38 -34 0.936 0.945MAR Morocco 727 710 40 21 26 8 42 773 22 755 2.4 0.0 29.6 595 720 -695 4 -84 42 0.941 0.951NGA Nigeria 859 806 145 75 99 44 152 908 79 853 6.1 0.0 44.5 652 1,253 -675 68 100 -195 0.949 0.951SAU Saudi Arabia 1,900 1,690 260 22 266 46 273 2,025 23 1,804 11.1 0.0 17.1 -5,295 -4,749 5,676 -119 -75 44 0.937 0.949SYR Syrian Arab Republic 393 362 36 1 37 5 37 416 1 384 7.8 0.0 13.1 -3,523 662 -289 0 41 -36 0.948 0.963TUN Tunisia 243 234 19 9 13 4 20 257 9 248 3.6 0.0 28.1 213 211 -266 7 7 -26 0.945 0.955TUR Turkey 3,604 3,243 526 106 422 46 548 3,809 111 3,433 10.0 0.0 10.8 3,138 2,205 -4,139 7 358 -441 0.947 0.960YEM Yemen 296 294 2,246 2,243 3 1 2,423 316 2,420 314 0.7 0.0 33.1 -1,015 -1,007 935 1,892 -10 3 0.936 0.952BEN Benin 402 400 5 2 4 2 6 426 2 424 0.5 0.0 45.9 361 466 -30 1 6 -8 0.943 0.951GHA Ghana 251 241 27 14 18 8 29 269 15 259 4.0 0.0 42.8 -4,280 430 -155 13 -72 32 0.937 0.944KEN Kenya 302 258 68 20 60 13 72 320 22 273 14.7 0.0 21.7 276 312 -178 12 16 -43 0.944 0.948MOZ Mozambique 69 67 4 1 4 1 5 82 1 79 4.0 0.0 31.9 -3,228 31 -11 0 -8 1 0.944 0.949MWI Malawi 21 20 365 363 2 0 394 22 392 21 6.6 0.0 18.8 21 19 -25 363 2 -4 0.947 0.950MDG Madagascar 209 153 65 2 91 33 70 223 2 164 26.6 0.0 35.6 169 134 -165 -2 94 -78 0.938 0.936SDN Sudan 286 284 9 4 2 1 10 304 4 302 0.4 0.0 35.8 -88 -981 -122 -225 -1 -2 0.942 0.960TGO Togo 190 178 26 13 29 17 27 199 13 187 6.3 0.0 56.6 160 352 -38 -5,382 26 -38 0.951 0.964TZA Tanzania 183 178 14 7 16 10 15 194 8 188 3.1 0.0 62.0 119 133 -104 -6,150 -19 10 0.943 0.952UGA Uganda 81 77 4,710 4,706 4 1 5,154 85 5,150 82 4.1 0.0 13.3 53 44 -97 3,826 -13 12 0.947 0.949ZAF South Africa 3,287 2,870 829 268 581 143 868 3,469 282 3,033 12.7 0.0 24.7 1,623 411 -2,526 -34 55 -503 0.948 0.954ZMB Zambia 427 426 167 165 2 0 192 449 190 447 0.3 0.0 18.3 -422 -120 -16 164 -10 3 0.961 0.963ZWE Zimbabwe 398 397 1,977 1,974 2 1 2,038 403 2,035 401 0.5 0.0 23.0 268 -63 47 -232 -8 -2 0.953 0.951OTH Other reporting countries 3,075 2,495 990 347 708 96 1,045 3,274 367 2,663 18.8 0.0 13.5 286 -4,301 -1,781 297 527 -864 0.942 0.947NRP No reporting partner countries12,053 11,739 1,574 381 1,384 1,053 1,661 12,803 405 12,471 3 0.0 76.1 -25,965 11,540 36,665 -26 2,128 -1,867 0.943 0.951PTN Partner Total 567,923 504,582 140,113 58,106 110,863 44,523 147,262 599,606 61,271 533,389 82,214 -7,633 -282,386 -28,874 -8,145 24,562HKG Hong Kong China 26,905 90,246 0 0 0 0 0 94,564 0 28,224 0.0 0.0 0.0 15,375 88,676 -834 0 0 0 0.951 CHN China 0 0 80,690 11,529 0 0 93,685 0 25,178 0 0.0 0.0 0.0 0 0 0 -15,375 -834 88,676 0.952WLD World Total 594,828 594,828 220,803 69,635 110,863 44,523 240,947 694,171 86,450 561,613 10.6 0.0 40.2 97,589 81,043 -283,220 -44,250 -8,979 113,238

Table 4 Adjusted Estimates of Bilateral Trade Between China, Hong Kong and their Partner Countries, Westbound Flows, 2004, in Millions of U.S. Dollars
Country Code Country Name
Partner actual exports to China
Partner direct exports to China
Partner total exports to Hong Kong
Partner domestic export to Hong Kong
Partner re-exports to China via Hong kong
Hong Kong re-export markup
Hong Kong total imports from partners
China total imports from partners
Hong Kong retained imports from partner
China direct import from partner
Re-exports as percent of partner total exports to China
Statistical discrepancies
Hong Kong re-export markup rate
Partners balance of trade with China after adjustment
Partners balance of trade with Hong Kong after adjustment
fob/cif ratio, partner to China
fob/cif ratio, partner to Hong Kong
Variable in the model TX(s,CH) DX(s,CH) TX(s,Hk) DX(s,Hk) RX(s,CH) RXM(s,CH) TM(s,HK) TM(s,CH) DM(s,HK) DM(s,CH)
(RX(r,CH)-RXM(r,CH))/RX(r,CH) SDX(s)
RXM(CH,r)/RX(CH,r)
TX(CH,r)-TX(r,CH)
TX(HK,r)-TX(r,HK) cif(s,CH) cif(s,HK)
USA United States 40,955 36,219 14,086 7,643 5,795 862 14,606 42,547 7,902 37,623 11.4 0.0 14.9 -126,105 -1,640 0.963 0.965CAN Canada 6,176 5,662 1,092 530 585 51 1,141 6,549 556 6,015 8.2 0.0 8.7 -6,661 -68 0.948 0.958MEX Mexico 1,219 1,027 330 100 309 113 339 1,265 103 1,068 15.4 0.0 36.6 -6,170 -189 0.971 0.972AUS Australia 8,533 8,026 1,759 990 581 52 1,866 9,416 1,064 8,888 5.9 0.0 9.0 -2,562 98 0.911 0.940NZL New Zealand 1,202 1,099 313 201 131 22 333 1,284 214 1,175 8.4 0.0 17.2 -479 105 0.943 0.936JPN Japan 89,695 71,257 30,591 9,197 20,625 1,718 31,448 92,539 9,507 73,632 20.2 0.0 8.3 4,948 7,897 0.969 0.972KOR Korea Rep 57,483 51,205 12,473 5,276 6,730 253 12,908 59,635 5,491 53,158 10.7 0.0 3.8 30,132 3,658 0.964 0.968TWN Taiwan China 54,198 42,072 20,199 7,067 14,773 2,299 20,795 56,029 7,292 43,555 22.0 0.0 15.6 39,290 5,131 0.968 0.968SGP Singapore 13,618 11,367 14,216 11,526 2,471 149 14,675 14,122 11,896 11,800 16.2 0.0 6.0 -416 8,584 0.969 0.966MAC Macao 129 123 242 77 12 6 249 134 80 128 4.8 0.0 47.1 -1,470 -209 0.960 0.968IDN Indonesia 5,274 4,593 1,333 534 826 113 1,434 5,648 596 4,935 12.7 0.0 13.7 2,105 259 0.935 0.938MYS Malaysia 14,254 11,020 6,330 2,413 4,169 873 6,504 14,835 2,517 11,540 22.2 0.0 20.9 5,587 471 0.958 0.977PHL Philippines 5,552 3,951 3,280 1,285 1,879 261 3,322 5,620 1,305 4,002 28.1 0.0 13.9 3,365 -369 0.986 0.987THA Thailand 8,903 6,888 4,146 1,673 2,447 346 4,332 9,356 1,760 7,255 22.3 0.0 14.1 3,116 725 0.952 0.959VNM Vietnam 1,816 1,738 395 244 111 34 395 1,816 244 1,738 4.0 0.0 30.4 22 -428 1.000 1.000KHM Cambodia 12 11 6 4 1 0 6 13 5 12 7.8 0.0 18.2 -575 -335 0.956 0.944BGD Bangladesh 122 87 91 51 45 8 95 125 53 88 28.7 0.0 18.6 -1,103 -272 0.957 0.962IND India 6,519 5,976 3,541 1,867 621 59 3,622 7,278 1,901 6,716 8.1 0.0 9.5 239 1,067 0.903 0.978LKA Sri Lanka 25 16 68 46 12 2 71 28 48 18 37.6 0.0 13.6 -481 -448 0.924 0.956PAK Pakistan 527 162 562 176 428 48 585 551 184 170 68.3 0.0 11.2 -1,068 100 0.959 0.961AUT Austria 1,360 1,254 451 314 134 24 482 1,399 339 1,289 7.7 0.0 18.1 -205 142 0.971 0.942BEL Belgium 3,186 2,900 1,742 1,111 387 89 1,788 3,320 1,139 3,022 8.5 0.0 23.0 -3,676 531 0.960 0.976DEU Germany 28,162 25,610 4,982 1,962 2,923 290 5,135 29,010 2,019 26,377 8.9 0.0 9.9 -4,208 -360 0.971 0.970DNK Denmark 1,397 881 657 131 677 139 684 1,446 135 908 35.9 0.0 20.5 -798 -195 0.964 0.960ESP Spain 1,586 1,435 453 263 180 22 473 1,653 275 1,495 9.4 0.0 12.2 -6,510 -123 0.958 0.956FIN Finland 2,873 2,645 460 158 253 18 473 2,955 163 2,720 7.6 0.0 7.1 645 15 0.972 0.970FRA France 7,123 6,624 2,409 1,478 592 78 2,479 7,309 1,518 6,795 6.9 0.0 13.2 -8,047 734 0.974 0.972GBR United Kingdom 4,599 3,782 4,057 2,024 970 130 4,154 4,746 2,084 3,905 17.3 0.0 13.4 -16,491 -1,483 0.969 0.976GRC Greece 76 69 48 37 11 5 50 81 39 75 8.0 0.0 40.7 -1,462 -43 0.931 0.955IRL Ireland 1,036 840 1,005 713 484 285 1,019 1,053 723 854 18.5 0.0 58.9 -1,656 357 0.984 0.986ITA Italy 6,131 4,879 3,277 1,736 1,537 243 3,384 6,326 1,793 5,032 20.1 0.0 15.8 -6,019 1,072 0.969 0.968LUX Luxembourg 117 105 24 11 13 1 25 123 12 111 10.0 0.0 8.1 72 -208 0.956 0.966NLD Netherlands 2,781 2,532 1,267 975 301 42 1,312 2,887 1,009 2,628 8.8 0.0 14.0 -14,289 -890 0.964 0.965PRT Portugal 168 151 67 42 21 4 69 175 43 158 9.8 0.0 17.0 -381 8 0.950 0.970SWE Sweden 2,975 2,746 504 233 286 50 519 3,074 239 2,838 7.6 0.0 17.4 849 -344 0.969 0.970CHE Switzerland 2,930 2,504 3,185 2,062 516 80 3,258 2,997 2,110 2,560 14.2 0.0 15.5 1,118 1,584 0.978 0.977NOR Norway 1,014 968 160 108 70 23 172 1,074 118 1,027 4.5 0.0 32.6 -414 -34 0.944 0.951CYP Cyprus 34 34 65 64 1 1 65 34 64 34 1.9 0.0 49.2 -156 46 0.976 0.993CZE Czech Republic 361 315 158 84 56 8 163 372 87 324 12.6 0.0 15.1 -1,766 -31 0.970 0.970EST Estonia 21 20 5 4 2 0 5 22 4 21 5.8 0.0 15.7 -246 -28 0.964 0.967HUN Hungary 468 384 140 17 94 8 143 478 18 393 17.6 0.0 8.7 -2,268 -334 0.977 0.981LTU Lithuania 10 9 41 41 0 0 42 10 41 10 1.8 0.0 30.2 -257 35 0.959 0.996LVA Latvia 10 10 1 1 0 0 1 11 1 11 0.9 0.0 5.3 -85 -7 0.959 0.965MLT Malta 90 48 79 33 53 10 80 91 34 48 45.8 0.0 19.3 17 23 0.990 0.991POL Poland 479 465 38 23 17 3 40 498 25 484 2.8 0.0 15.2 -2,206 -31 0.960 0.958SVK Slovak Republic 103 100 257 254 3 1 258 107 254 104 2.5 0.0 21.1 -228 231 0.963 0.966SVN Slovenia 36 31 11 6 6 1 12 37 6 32 13.2 0.0 19.2 -144 -1 0.971 0.971ALB Albania 1 1 0 0 0 0 0 1 0 1 2.2 0.0 4.0 -61 -5,984 0.999 0.998BGR Bulgaria 50 47 7 3 4 1 7 54 3 51 5.5 0.0 21.4 -317 -11 0.929 0.980HRV Croatia 9 9 2 2 0 0 2 9 2 9 3.8 0.0 14.4 -390 -12 0.987 0.978ROM Romania 250 244 53 38 21 14 54 266 39 259 2.4 0.0 68.5 -555 24 0.941 0.974SER Yugoslavia 10 9 3 0 1 0 3 11 0 10 7.5 0.0 22.2 -272 -3 0.964 0.977

Country Code Country Name
Partner actual exports to China
Partner direct exports to China
Partner total exports to Hong Kong
Partner domestic export to Hong Kong
Partner re-exports to China via Hong kong
Hong Kong re-export markup
Hong Kong total imports from partners
China total imports from partners
Hong Kong retained imports from partner
China direct import from partner
Re-exports as percent of partner total exports to China
Statistical discrepancies
Hong Kong re-export markup rate
Partners balance of trade with China after adjustment
Partners balance of trade with Hong Kong after adjustment
fob/cif ratio, partner to China
fob/cif ratio, partner to Hong Kong
UKR Ukraine 492 479 22 8 16 2 23 524 9 511 2.6 0.0 14.7 -26 2 0.949 0.955RUS Russian Federation 9,720 9,549 1,384 1,171 195 12 1,414 10,356 1,187 10,173 1.7 0.0 6.0 4,475 1,159 0.940 0.938KAZ Kazakhstan 1,636 1,633 3 0 4 0 3 1,726 0 1,723 0.2 0.0 8.4 739 -1 0.951 0.943KGZ Kyrgyz Republic 59 57 2 0 1 0 2 62 0 61 2.2 0.0 7.6 -146 0 0.947 0.996ARG Argentina 2,932 2,804 199 64 149 16 207 3,083 67 2,950 4.3 0.0 10.9 1,813 36 0.949 0.962BRA Brazil 6,920 6,597 818 431 352 15 851 7,562 448 7,225 4.6 0.0 4.2 3,069 149 0.927 0.960CHL Chile 3,385 3,285 168 67 108 2 179 3,574 71 3,468 3.0 0.0 2.3 1,611 12 0.948 0.943COL Colombia 145 139 19 9 7 1 20 150 9 144 4.0 0.0 10.5 -734 -11 0.963 0.958ECU Ecuador 72 70 9 7 2 0 10 72 8 71 2.3 0.0 12.6 -412 -1 0.992 0.950PER Peru 1,348 1,336 727 713 18 5 728 1,467 714 1,454 0.9 0.0 27.3 788 695 0.920 0.952PRY Paraguay 1,750 1,746 14 9 6 1 14 1,753 10 1,748 0.3 0.0 13.0 1,368 -4 0.953 0.940VEN Venezuela 390 385 12 3 6 1 12 416 3 411 1.2 0.0 15.1 183 -22 0.950 0.962URY Uruguay 93 84 22 12 11 2 23 97 13 88 9.6 0.0 16.2 -78 5 0.962 0.967CRI Costa Rica 324 295 162 101 118 89 164 328 103 298 8.7 0.0 75.1 128 78 0.988 0.986GTM Guatemala 23 23 2 1 1 0 2 23 1 23 2.1 0.0 8.5 -373 -43 0.998 0.977PAN Panama 13 12 7 5 1 0 7 14 6 13 7.5 0.0 8.7 -1,844 -33 0.958 0.936DZA Algeria 871 871 0 0 0 0 0 873 0 873 0.0 0.0 8.2 -12 -11 0.992 0.997EGY Egypt Arab Rep 136 132 29 24 10 6 31 149 26 144 3.1 0.0 55.3 -833 -11 0.934 0.944IRN Iran Islamic Rep 3,661 3,636 106 73 31 5 109 3,899 75 3,873 0.6 0.0 16.3 2,337 65 0.934 0.971ISR Israel 912 748 1,144 628 216 23 1,217 962 660 768 17.3 0.0 10.5 -462 -27 0.958 0.959JOR Jordan 23 22 3 2 1 0 3 23 2 22 3.3 0.0 13.1 -605 -45 0.977 0.983LBN Lebanon 9 6 2,564 2,561 4 1 2,564 10 2,561 6 32.3 0.0 18.4 -391 2,553 0.972 0.993MAR Morocco 132 54 96 17 82 3 97 136 17 57 57.8 0.0 3.9 -595 -4 0.972 0.993NGA Nigeria 206 200 14 7 8 1 15 220 7 213 2.9 0.0 11.5 -652 -68 0.943 0.966SAU Saudi Arabia 7,195 7,026 311 141 195 16 331 7,677 150 7,497 2.3 0.0 8.0 5,295 119 0.937 0.940SYR Syrian Arab Republic 3,916 3,916 1 0 1 0 1 3,916 0 3,916 0.0 0.0 8.3 3,523 0 0.997 0.970TUN Tunisia 30 26 7 2 6 1 7 32 2 28 14.8 0.0 18.5 -213 -7 0.931 0.959TUR Turkey 467 431 139 98 47 10 147 508 105 471 7.4 0.0 22.1 -3,138 -7 0.921 0.941YEM Yemen 1,311 1,310 353 351 2 2 353 1,393 351 1,392 0.0 0.0 83.5 1,015 -1,892 0.940 0.977BEN Benin 41 41 1 1 0 0 1 41 1 41 0.0 0.0 29.8 -361 -1 0.997 0.992GHA Ghana 4,532 4,532 79 1 0 0 96 4,852 1 4,852 0.0 0.0 12.6 4,280 -13 0.932 0.823KEN Kenya 26 5 31 8 24 2 33 27 9 6 76.3 0.0 10.3 -276 -12 0.945 0.953MOZ Mozambique 3,297 3,291 7 1 7 1 7 3,338 1 3,332 0.1 0.0 13.6 3,228 0 0.919 0.930MWI Malawi 0 0 0 0 0 0 0 0 0 0 28.3 0.0 14.1 -21 -363 0.980 0.986MDG Madagascar 40 37 8 4 4 1 9 41 4 38 9.0 0.0 12.7 -169 2 0.882 0.858SDN Sudan 373 369 233 229 5 0 234 397 229 392 1.2 0.0 6.0 88 225 0.943 0.982TGO Togo 30 29 5,395 5,394 1 0 5,395 30 5,394 29 2.0 0.0 9.2 -160 5,382 0.999 0.988TZA Tanzania 64 51 6,184 6,157 16 2 6,374 70 6,345 56 20.2 0.0 11.2 -119 6,150 0.912 0.928UGA Uganda 28 14 895 880 17 3 896 29 880 14 48.3 0.0 17.1 -53 -3,826 0.958 0.953ZAF South Africa 1,664 1,501 577 302 183 13 606 1,838 317 1,668 9.5 0.0 7.1 -1,623 34 0.920 0.955ZMB Zambia 849 848 11 1 1 0 12 851 1 850 0.1 0.0 13.8 422 -164 0.969 0.965ZWE Zimbabwe 130 128 2,212 2,207 3 0 2,317 136 2,311 134 1.8 0.0 4.1 -268 232 0.955 0.972OTH Other reporting countries 2,789 2,702 201 49 102 10 210 2,993 52 2,900 3.0 0.0 9.8 -286 -297 0.933 0.940NRP No reporting partner countries 38,018 37,843 683 407 201 16 729 38,846 435 38,661 0.5 0.0 7.9 25,965 26 0.979 0.942PTN Partner Total 485,710 422,414 165,519 86,980 74,329 9,101 170,532 504,914 89,637 439,694 -82,214 28,874HKG Hong Kong China 11,529 80,690 0 0 0 0 93,685 0 25,178 0.0 0.0 0.0 -15,375 0 0.952 CHN China 0 90,246 26,905 0 0 94,564 0 28,224 0 0.0 0.0 0.0 0 15,375 0.951WLD World Total 497,239 503,103 255,765 113,885 74,329 9,101 265,096 598,599 117,861 464,872 11.0 0.0 12.2 -97,589 44,250

Table 5 Initial and Adjusted Estimates of Hong Kong Re-exports Markup Rates by GTAP Sectors, 2004, all partner average, in percent
GTAP Sector name
Hong Kong re-exports as percent of China's total exports
Hong Kong re-exports markup rate
Standard deviation of markup rate
re-exports as percent of China's total exports
Hong Kong re-exports markup rate
Standard deviation of markup rate
Hong Kong re-exports as percent of China's total imports
Hong Kong re-exports markup rate
Standard deviation of markup rate
re-exports as percent of China's total imports
Hong Kong re-exports markup rate
Standard deviation of markup rate
1 pdr Paddy rice, 0.0 0.0 0.0 0.0 0.0 0.0 0.0 0.0 0.0 0.0 0.0 0.02 wht Wheat, 0.0 16.4 0.0 0.0 16.5 0.0 0.0 0.0 0.0 0.0 0.0 0.03 gro Cereal grains nec, 0.0 58.5 18.1 0.0 58.5 18.1 0.1 20.2 18.4 0.1 19.7 18.64 v_f Vegetables fruit nuts, 0.2 26.3 17.0 0.3 25.7 17.3 26.1 4.7 0.9 14.2 5.8 6.45 osd Oil seeds, 0.2 25.8 12.4 0.2 27.1 14.6 0.1 4.5 3.4 0.1 4.5 3.46 c_b Sugar cane and sugar beet, 0.0 0.0 0.0 0.0 0.0 0.0 0.0 0.0 0.0 0.0 0.0 0.07 pfb Plant-based fibers, 0.8 14.1 0.0 0.5 14.1 0.2 0.5 26.2 10.7 0.4 26.2 10.68 ocr Crops nec, 2.6 44.9 17.7 2.5 45.0 17.8 7.3 9.9 11.4 7.5 11.3 15.79 ctl Bovine cattle sheep and goats horses, 0.0 0.0 0.0 0.0 0.0 0.0 0.0 0.0 0.0 0.0 100.0 0.0
10 oap Animal products nec, 0.7 34.6 19.8 0.6 44.3 25.8 35.4 6.5 3.6 36.4 17.9 15.711 rmk Raw milk, 0.0 0.0 0.0 0.0 0.0 0.0 0.0 0.0 0.0 0.0 0.0 0.012 wol Wool silk-worm cocoons, 9.2 6.6 0.7 10.0 6.6 0.7 0.1 0.0 0.0 0.1 7.4 9.713 frs Forestry, 3.5 34.1 12.4 2.3 47.7 17.3 2.9 4.4 5.2 2.3 4.0 6.714 fsh Fishing, 1.8 37.4 27.3 1.6 37.8 26.6 4.5 10.5 3.2 7.3 9.2 5.415 col Coal, 0.0 0.0 0.0 0.0 0.0 0.0 0.0 60.8 33.1 0.0 60.8 33.116 oil Oil, 0.0 0.0 0.0 0.0 0.0 0.0 0.0 0.0 0.0 0.0 0.0 0.017 gas Gas, 0.0 0.0 0.0 0.0 0.0 0.0 0.0 0.0 0.0 0.0 0.0 0.018 omn Minerals nec, 0.4 38.1 40.1 0.4 40.2 40.1 1.6 26.1 28.9 1.0 22.2 23.719 cmt Bovine cattle sheep and goat horse meat prods, 0.5 1.8 0.0 0.5 1.8 0.0 34.3 4.7 2.3 29.9 22.2 19.220 omt Meat products nec, 0.3 19.3 9.8 0.3 15.1 13.1 41.2 4.4 3.8 42.1 8.5 16.521 vol Vegetable oils and fats, 1.0 35.1 10.5 0.9 42.3 13.4 1.8 1.8 1.4 1.6 5.2 13.822 mil Dairy products, 4.0 25.6 6.8 3.4 25.6 6.8 6.5 25.7 11.3 6.6 26.1 12.023 pcr Processed rice, 0.1 11.1 4.9 0.1 11.2 4.9 0.6 11.7 0.2 0.3 11.7 0.224 sgr Sugar, 1.7 14.3 19.7 2.2 19.1 23.6 7.0 12.3 1.6 3.0 12.3 1.625 ofd Food products nec, 1.3 21.0 14.1 1.2 30.8 17.1 7.3 5.8 5.0 7.3 5.2 9.126 b_t Beverages and tobacco products, 13.5 33.7 20.8 5.6 51.1 32.0 24.7 28.7 18.7 30.6 34.6 14.827 tex Textiles, 10.8 30.6 12.6 11.5 25.4 20.3 24.2 9.3 5.6 26.8 11.5 8.928 wap Wearing apparel, 14.1 38.9 10.2 15.3 34.4 12.1 40.9 10.3 6.8 18.4 14.9 14.829 lea Leather products, 26.8 15.5 4.3 9.3 70.5 15.0 38.7 11.0 8.0 20.6 12.7 11.130 lum Wood products, 4.3 28.5 9.2 2.9 47.9 16.3 11.4 5.9 4.3 10.3 5.6 8.431 ppp Paper products publishing, 24.6 49.6 7.7 18.5 57.4 9.3 7.5 6.3 4.2 6.4 4.5 6.532 p_c Petroleum, coal products, 0.1 19.0 12.9 0.1 19.7 12.4 2.4 6.5 5.1 2.2 6.5 7.733 crp Chemical rubber plastic products, 5.9 31.6 9.0 6.2 26.6 12.4 14.4 6.1 4.1 13.4 4.3 4.734 nmm Mineral products nec, 2.6 31.3 14.6 2.1 43.5 16.3 8.9 1.0 1.6 8.5 1.9 10.535 i_s Ferrous metals, 0.1 42.9 20.3 0.2 45.5 21.0 9.6 2.6 4.8 9.4 2.0 5.636 nfm Metals nec, 2.4 20.3 13.2 2.7 15.3 25.6 10.8 3.6 5.3 8.4 21.2 39.037 fmp Metal products, 8.2 31.4 9.2 7.9 33.6 12.6 7.8 5.6 3.4 7.5 3.5 4.238 mvh Motor vehicles and parts, 0.2 53.0 19.0 0.4 48.5 21.7 7.2 5.4 2.9 7.3 8.5 4.739 otn Transport equipment nec, 1.6 19.2 12.5 1.6 39.3 23.8 1.8 2.5 3.6 1.8 12.7 14.340 ele Electronic equipment, 15.7 23.9 14.3 15.7 22.4 15.6 25.2 11.0 10.0 23.0 15.3 10.541 ome Machinery and equipment nec, 14.7 37.0 10.1 11.9 45.3 9.8 10.2 10.0 4.9 9.1 12.7 5.242 omf Manufactures nec, 29.9 40.3 8.2 15.2 65.9 11.8 21.2 2.9 5.1 27.5 2.5 8.0
All sectors 12.9 31.0 6.6 11.2 40.2 9.1 14.5 9.2 6.3 12.8 12.2 6.9
Eastbound Trade West Bound TradeInitial Estimates Adjusted Estimates Initial Estimates Adjusted Estimates
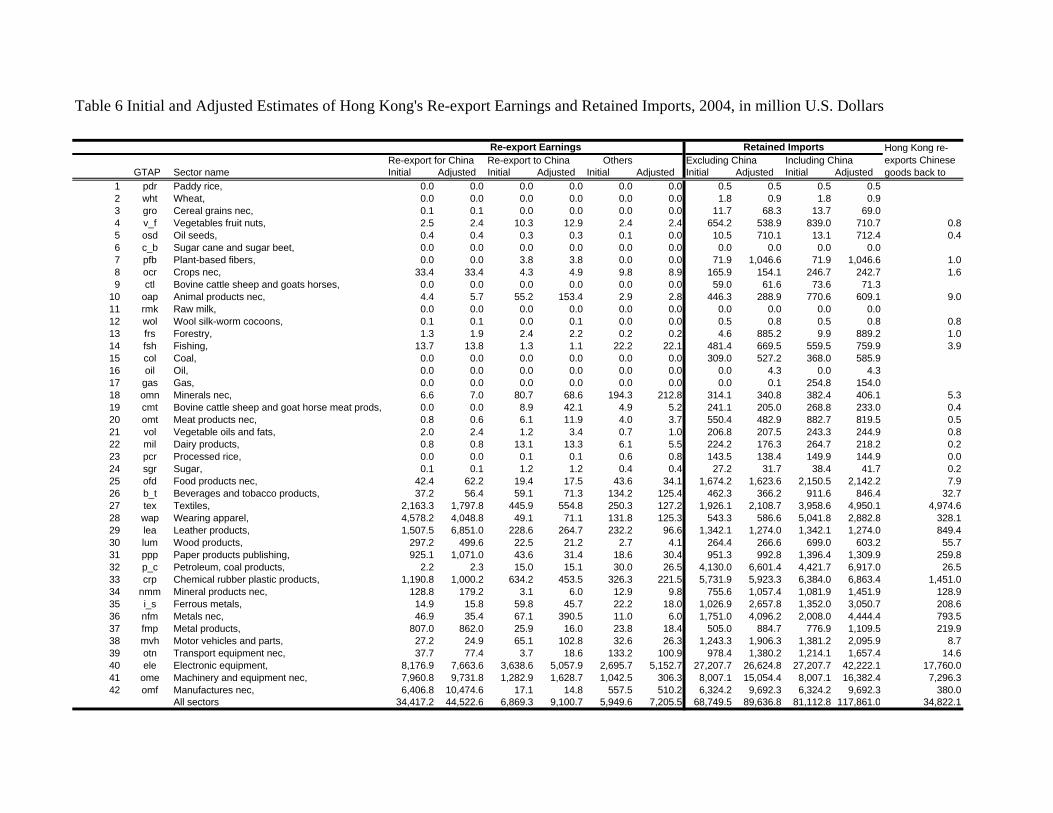
Table 6 Initial and Adjusted Estimates of Hong Kong's Re-export Earnings and Retained Imports, 2004, in million U.S. Dollars
Re-export for China Re-export to China Others Excluding China Including ChinaGTAP Sector name Initial Adjusted Initial Adjusted Initial Adjusted Initial Adjusted Initial Adjusted
1 pdr Paddy rice, 0.0 0.0 0.0 0.0 0.0 0.0 0.5 0.5 0.5 0.52 wht Wheat, 0.0 0.0 0.0 0.0 0.0 0.0 1.8 0.9 1.8 0.93 gro Cereal grains nec, 0.1 0.1 0.0 0.0 0.0 0.0 11.7 68.3 13.7 69.04 v_f Vegetables fruit nuts, 2.5 2.4 10.3 12.9 2.4 2.4 654.2 538.9 839.0 710.7 0.85 osd Oil seeds, 0.4 0.4 0.3 0.3 0.1 0.0 10.5 710.1 13.1 712.4 0.46 c_b Sugar cane and sugar beet, 0.0 0.0 0.0 0.0 0.0 0.0 0.0 0.0 0.0 0.07 pfb Plant-based fibers, 0.0 0.0 3.8 3.8 0.0 0.0 71.9 1,046.6 71.9 1,046.6 1.08 ocr Crops nec, 33.4 33.4 4.3 4.9 9.8 8.9 165.9 154.1 246.7 242.7 1.69 ctl Bovine cattle sheep and goats horses, 0.0 0.0 0.0 0.0 0.0 0.0 59.0 61.6 73.6 71.3
10 oap Animal products nec, 4.4 5.7 55.2 153.4 2.9 2.8 446.3 288.9 770.6 609.1 9.011 rmk Raw milk, 0.0 0.0 0.0 0.0 0.0 0.0 0.0 0.0 0.0 0.012 wol Wool silk-worm cocoons, 0.1 0.1 0.0 0.1 0.0 0.0 0.5 0.8 0.5 0.8 0.813 frs Forestry, 1.3 1.9 2.4 2.2 0.2 0.2 4.6 885.2 9.9 889.2 1.014 fsh Fishing, 13.7 13.8 1.3 1.1 22.2 22.1 481.4 669.5 559.5 759.9 3.915 col Coal, 0.0 0.0 0.0 0.0 0.0 0.0 309.0 527.2 368.0 585.916 oil Oil, 0.0 0.0 0.0 0.0 0.0 0.0 0.0 4.3 0.0 4.317 gas Gas, 0.0 0.0 0.0 0.0 0.0 0.0 0.0 0.1 254.8 154.018 omn Minerals nec, 6.6 7.0 80.7 68.6 194.3 212.8 314.1 340.8 382.4 406.1 5.319 cmt Bovine cattle sheep and goat horse meat prods, 0.0 0.0 8.9 42.1 4.9 5.2 241.1 205.0 268.8 233.0 0.420 omt Meat products nec, 0.8 0.6 6.1 11.9 4.0 3.7 550.4 482.9 882.7 819.5 0.521 vol Vegetable oils and fats, 2.0 2.4 1.2 3.4 0.7 1.0 206.8 207.5 243.3 244.9 0.822 mil Dairy products, 0.8 0.8 13.1 13.3 6.1 5.5 224.2 176.3 264.7 218.2 0.223 pcr Processed rice, 0.0 0.0 0.1 0.1 0.6 0.8 143.5 138.4 149.9 144.9 0.024 sgr Sugar, 0.1 0.1 1.2 1.2 0.4 0.4 27.2 31.7 38.4 41.7 0.225 ofd Food products nec, 42.4 62.2 19.4 17.5 43.6 34.1 1,674.2 1,623.6 2,150.5 2,142.2 7.926 b_t Beverages and tobacco products, 37.2 56.4 59.1 71.3 134.2 125.4 462.3 366.2 911.6 846.4 32.727 tex Textiles, 2,163.3 1,797.8 445.9 554.8 250.3 127.2 1,926.1 2,108.7 3,958.6 4,950.1 4,974.628 wap Wearing apparel, 4,578.2 4,048.8 49.1 71.1 131.8 125.3 543.3 586.6 5,041.8 2,882.8 328.129 lea Leather products, 1,507.5 6,851.0 228.6 264.7 232.2 96.6 1,342.1 1,274.0 1,342.1 1,274.0 849.430 lum Wood products, 297.2 499.6 22.5 21.2 2.7 4.1 264.4 266.6 699.0 603.2 55.731 ppp Paper products publishing, 925.1 1,071.0 43.6 31.4 18.6 30.4 951.3 992.8 1,396.4 1,309.9 259.832 p_c Petroleum, coal products, 2.2 2.3 15.0 15.1 30.0 26.5 4,130.0 6,601.4 4,421.7 6,917.0 26.533 crp Chemical rubber plastic products, 1,190.8 1,000.2 634.2 453.5 326.3 221.5 5,731.9 5,923.3 6,384.0 6,863.4 1,451.034 nmm Mineral products nec, 128.8 179.2 3.1 6.0 12.9 9.8 755.6 1,057.4 1,081.9 1,451.9 128.935 i_s Ferrous metals, 14.9 15.8 59.8 45.7 22.2 18.0 1,026.9 2,657.8 1,352.0 3,050.7 208.636 nfm Metals nec, 46.9 35.4 67.1 390.5 11.0 6.0 1,751.0 4,096.2 2,008.0 4,444.4 793.537 fmp Metal products, 807.0 862.0 25.9 16.0 23.8 18.4 505.0 884.7 776.9 1,109.5 219.938 mvh Motor vehicles and parts, 27.2 24.9 65.1 102.8 32.6 26.3 1,243.3 1,906.3 1,381.2 2,095.9 8.739 otn Transport equipment nec, 37.7 77.4 3.7 18.6 133.2 100.9 978.4 1,380.2 1,214.1 1,657.4 14.640 ele Electronic equipment, 8,176.9 7,663.6 3,638.6 5,057.9 2,695.7 5,152.7 27,207.7 26,624.8 27,207.7 42,222.1 17,760.041 ome Machinery and equipment nec, 7,960.8 9,731.8 1,282.9 1,628.7 1,042.5 306.3 8,007.1 15,054.4 8,007.1 16,382.4 7,296.342 omf Manufactures nec, 6,406.8 10,474.6 17.1 14.8 557.5 510.2 6,324.2 9,692.3 6,324.2 9,692.3 380.0
All sectors 34,417.2 44,522.6 6,869.3 9,100.7 5,949.6 7,205.5 68,749.5 89,636.8 81,112.8 117,861.0 34,822.1
Re-export Earnings Retained Imports Hong Kong re-exports Chinese goods back to

Table 7 Initial and Adjusted Estimates of China's Net Trade Flows, 2004, in million U.S. Dollars
Trade Balance with the United States
GTAP Sector name
China official reported
Initial estimates
Adjusted estimates
China official reported
Initial estimates
Adjusted estimates
China official reported
U.S. official reported
Initial estimates
Adjusted estimates
1 pdr Paddy rice, 47.5 47.0 47.5 47.5 47.0 47.5 0.0 0.6 -0.6 0.02 wht Wheat, -1,528.4 -952.7 -1,046.0 -1,528.4 -952.7 -1,046.0 -648.2 495.0 -495.0 -570.03 gro Cereal grains nec, 69.0 188.5 137.0 70.8 190.2 137.5 0.1 0.2 -0.7 0.14 v_f Vegetables fruit nuts, 1,101.5 1,478.0 812.5 1,215.0 1,576.0 927.8 20.0 -95.0 0.6 43.55 osd Oil seeds, -6,620.1 -4,653.1 -5,636.2 -6,617.0 -4,651.3 -5,634.4 -3,334.8 2,306.9 -2,314.9 -2,845.86 c_b Sugar cane and sugar beet, -0.4 -0.4 -0.4 -0.4 -0.4 -0.4 0.0 0.0 0.0 0.07 pfb Plant-based fibers, -2,723.3 -1,825.1 -2,123.9 -2,723.3 -1,828.9 -2,127.6 -1,766.1 1,421.0 -1,425.7 -1,623.88 ocr Crops nec, 911.2 936.9 1,003.0 1,059.2 1,044.0 1,079.0 45.9 -120.3 45.4 91.49 ctl Bovine cattle sheep and goats horses, -184.3 -158.1 -137.3 -154.3 -128.1 -130.3 0.0 0.1 -0.1 -0.1
10 oap Animal products nec, -974.8 -951.6 -632.7 -666.3 -705.8 -389.6 -380.0 243.1 -412.7 -316.411 rmk Raw milk, 0.0 0.0 0.0 0.0 0.0 0.0 0.0 0.0 0.0 0.012 wol Wool silk-worm cocoons, -975.9 -978.8 -932.1 -975.5 -978.8 -932.1 -6.3 0.5 -4.0 -5.013 frs Forestry, -2,443.5 -1,422.7 -1,773.8 -2,437.4 -1,421.1 -1,772.9 -69.4 94.0 -132.9 -69.014 fsh Fishing, 766.6 729.2 872.0 924.2 870.2 932.9 4.6 -21.4 0.9 16.615 col Coal, 2,927.2 3,261.8 3,157.0 2,975.6 3,310.2 3,205.8 8.6 17.9 -24.5 10.116 oil Oil, -24,368.3 -10,768.2 -16,595.8 -24,368.3 -10,768.2 -16,595.8 114.5 -181.2 114.0 148.517 gas Gas, -0.1 -89.7 -89.6 186.8 97.2 56.6 0.0 0.0 0.0 0.018 omn Minerals nec, -17,885.5 -8,976.9 -16,009.8 -17,816.4 -8,993.8 -16,041.8 -112.6 -142.8 39.4 -13.219 cmt Bovine cattle sheep and goat horse meat prods, -443.4 -433.4 -399.4 -416.6 -415.6 -382.1 -97.3 28.0 -59.1 -60.520 omt Meat products nec, 920.8 889.4 718.4 1,253.0 1,209.4 1,030.6 -76.8 50.6 -76.4 -81.821 vol Vegetable oils and fats, -3,775.7 -3,149.2 -3,459.9 -3,730.3 -3,108.3 -3,425.4 -12.3 3.9 -11.2 -9.422 mil Dairy products, -426.6 -448.5 -431.0 -383.7 -420.8 -407.7 -45.9 46.4 -44.8 -46.423 pcr Processed rice, -73.5 77.5 -47.7 -67.6 83.1 -42.4 11.8 -20.8 11.8 14.524 sgr Sugar, -156.6 -94.9 -247.7 -147.1 -86.6 -239.7 0.4 -0.9 0.4 0.625 ofd Food products nec, 6,806.5 7,121.3 6,885.5 7,566.8 7,717.0 7,332.5 984.5 -1,658.2 1,097.0 1,305.426 b_t Beverages and tobacco products, 45.3 -45.9 454.2 624.8 393.0 792.1 -4.7 -30.4 -13.6 0.027 tex Textiles, 24,306.1 25,801.5 28,250.0 32,592.1 29,708.7 29,630.0 4,750.7 -7,201.0 5,129.6 7,291.228 wap Wearing apparel, 40,724.9 47,409.6 45,823.2 48,000.8 46,895.3 46,659.8 5,996.6 -11,539.5 8,072.8 10,536.429 lea Leather products, 17,331.0 24,055.5 20,538.0 19,880.9 23,821.5 20,304.0 7,897.9 -16,648.8 11,460.7 12,650.230 lum Wood products, 11,938.4 12,813.7 13,368.4 13,440.6 13,640.1 13,641.6 6,507.7 -13,910.6 6,882.1 7,802.031 ppp Paper products publishing, -7,008.6 -4,436.7 -5,564.2 -6,251.5 -4,487.8 -5,630.9 -1,036.1 -1,166.3 -39.8 27.032 p_c Petroleum, coal products, -3,273.1 -74.7 -3,042.2 -2,939.1 263.4 -2,776.2 499.7 -767.5 613.2 605.933 crp Chemical rubber plastic products, -34,527.9 -23,248.8 -28,298.8 -31,909.3 -22,770.2 -28,827.0 901.3 -6,814.2 3,605.5 3,565.834 nmm Mineral products nec, 5,690.0 6,293.7 6,694.5 6,659.9 7,079.7 7,024.2 1,539.0 -3,396.9 1,693.8 2,299.635 i_s Ferrous metals, -11,768.3 -8,378.8 -11,247.6 -11,375.3 -7,901.9 -11,105.5 669.9 -556.9 457.4 612.936 nfm Metals nec, -10,843.1 -8,554.2 -9,844.3 -8,928.3 -6,466.3 -9,679.7 -684.2 836.6 -901.5 -717.237 fmp Metal products, 12,487.2 14,785.0 14,474.2 13,931.4 14,721.6 14,619.6 5,161.5 -7,748.3 5,942.6 6,465.338 mvh Motor vehicles and parts, -4,830.7 -4,287.3 -8,693.6 -3,653.6 -3,193.1 -8,579.8 3,044.4 -1,409.3 2,999.3 1,615.139 otn Transport equipment nec, 2,205.4 1,999.0 602.3 2,765.6 2,420.2 863.6 -1,277.8 270.6 -619.9 -880.640 ele Electronic equipment, 23,265.5 48,278.5 46,292.0 60,424.4 59,757.5 57,272.2 35,413.7 -57,796.1 41,324.3 46,205.741 ome Machinery and equipment nec, -43,101.9 -19,590.3 -22,831.0 -29,140.9 -18,057.8 -23,276.3 7,214.0 -24,172.9 12,931.3 16,303.142 omf Manufactures nec, 18,756.9 26,971.5 31,169.0 23,654.4 26,877.6 31,075.2 9,160.5 -24,511.0 13,031.4 15,733.2
All sectors -7,632.6 119,617.5 82,213.6 81,043.4 144,385.3 97,588.9 80,395.0 -174,094.7 108,876.0 126,104.8
Trade Balance with All Partners Excluding Hong Kong Trade Balance with All Partners

Table 8 Trade and Port Cargo Loaded Statistics Reported By China and Hong Kong on China's exports, 1995 to 2004
year
Hong Kong as final destination
Hong Kong as consigned destination
Export via Hong Kong (Transshipment)
Hong Kong total Imports from China (cif)
Hong Kong-China FOB/CIF ratio
Hong Kong total Imports from China (fob)
Statistical discrepancy (Million U.S. Dollars)
Statistical discrepancy (Percent) Exports1
Outward transshipment2
Total Cargo loaded
Outward Transshipment as % of total
1995 35,988 74,493 38,505 69,736 0.9919 69,171 5,321 7.1 4,924 4,190 9,114 46.01996 32,904 64,209 31,305 73,758 0.9919 73,160 -8,952 -13.9 5,638 4,486 10,124 44.31997 43,798 77,852 34,054 78,581 0.9919 77,944 -92 -0.1 5,944 4,882 10,826 45.11998 38,785 76,547 37,762 74,966 0.9919 74,359 2,188 2.9 4,841 3,883 8,724 44.51999 36,917 72,674 35,757 78,312 0.9929 77,756 -5,082 -7.0 2,606 3,704 6,310 58.72000 44,530 82,409 37,879 91,771 0.9938 91,202 -8,793 -10.7 14,830 15,655 30,485 51.42001 46,489 83,423 36,934 87,445 0.9901 86,579 -3,155 -3.8 13,013 18,776 31,789 59.12002 58,465 99,295 40,829 91,944 0.9912 91,135 8,160 8.2 12,318 21,673 33,991 63.82003 76,289 123,600 47,312 100,889 0.9921 100,092 23,508 19.0 19,697 34,127 53,824 63.42004 100,878 154,885 54,007 117,909 0.9927 117,048 37,837 24.4 20,662 35,891 56,553 63.5
Data source: All China reported trade data are from China Customs Authority; all Hong Kong reported trade data are from Hong Kong Census and Statistics Department. Port Cargo data are from Hong Kong Census and Statistics Department. The cargo statistics from 1995 to 1999 refer to HK’s seaborne cargo statistics,
while those for 2000-2004 refer to Hong Kong's seaborne and river port cargo statistics. The river cargo statistics have been compiled in recent years given the growing importance of the river trade between Hong Kong and the mainland of China, particularly the Pearl River Delta (PRD) region. Port cargo movements between HK and places other than the mainland of China and Macao are all classified as seaborne cargo movement.
Note: 1. Goods exported/re-exported from Hong Kong are classified as direct shipment, whereas goods shipped in Hong Kong under a through bill of lading are classified as transshipment. Gods in transit through Hong Kong are not included in the statistics. 2. It refers to cargo that is consigned under a through bill of lading from a place outside Hong Kong to another place outside Hong Kong but is or is to be removed from one vessel and either returned to the same vessel or transferred to another vessel with Hong Kong waters.
Table 9 Trade and Port Cargo Loaded Statistics Reported By China and Hong Kong on China's imports, 1995 to 2004
Port Cargo Discharged and Port Loading 1000 Metric Ton
year
Reexport to China for third countries
Domestic Export to China
Total Exports to China
Imports originated from Hong
Total imports via Hong Kong
Imports originated from third countries
Hong Kong-China FOB/CIF ratio
Total imports via Hong Kong (fob)
Statistical discrepancy (Million U.S. Dollars)
Statistical discrepancy (Percent) Imports1
Inward Transshipment2
Total cargo discharged
Inward Transshipment as percent of total
1995 49,644 8,216 57,859 8,599 60,165 51,566 0.9919 59,678 1,819 3.0 5330 5252 10582 49.61996 54,015 7,967 61,982 7,839 55,046 47,207 0.9919 54,600 -7,383 -13.5 5177 4304 9481 45.41997 57,334 8,249 65,583 6,990 53,808 46,818 0.9919 53,372 -12,211 -22.9 4666 4409 9075 48.61998 52,597 7,239 59,836 6,667 52,762 46,096 0.9919 52,335 -7,501 -14.3 4465 4154 8619 48.21999 51,455 6,498 57,953 6,893 62,391 55,497 0.9929 61,948 3,994 6.4 3715 5158 8873 58.12000 62,742 6,951 69,693 9,431 76,384 66,952 0.9938 75,910 6,217 8.2 19334 10805 30139 35.92001 63,672 6,353 70,025 9,420 82,496 73,076 0.9901 81,680 11,655 14.3 22422 10958 33380 32.82002 73,326 5,305 78,631 10,741 104,979 94,237 0.9912 104,055 25,424 24.4 24983 13519 38502 35.12003 90,637 4,720 95,357 11,119 132,064 120,945 0.9921 131,021 35,664 27.2 69502 35447 104948 33.82004 109,225 4,866 114,091 11,800 166,529 154,729 0.9927 165,314 51,222 31.0 67207 41418 108626 38.1
Data source: All China reported trade data are from China Customs Authority; all Hong Kong reported trade data are from Hong Kong Census and Statistics Department. Port Cargo data are from Hong Kong Census and Statistics Department. The cargo statistics from 1995 to 1999 refer to HK’s seaborne cargo statistics,
while those for 2000-2004 refer to Hong Kong's seaborne and river port cargo statistics. The river cargo statistics have been compiled in recent years given the growing importance of the river trade between Hong Kong and the mainland of China, particularly the Pearl River Delta (PRD) region. Port cargo movements between HK and places other than the mainland of China and Macao are all classified as seaborne cargo movement.
Note: 1. Goods imported into Hong Kong are classified as direct shipment, whereas goods shipped in Hong Kong under a through bill of lading are classified as transshipment. Gods in transit through Hong Kong are not included in the statistics. 2. It refers to cargo that is consigned under a through bill of lading from a place outside Hong Kong to another place outside Hong Kong but is or is to be removed from one vessel and either returned to the same vessel or transferred to another vessel with Hong Kong waters.
Hong Kong Reported Exports (fob) China Reported Imports(cif) Adjustment
China Reported Exports (fob) Hong Kong Reported Imports Adjustment Port cargo loaded and port discharge, 1000 Metric Ton