Embed Size (px)
Citation preview
CENSUS 2016 TOPIC PAPER
Estimating Homelessness in Greater Western Sydney
By Amy Lawton, Social Research and Information Officer,
WESTIR Ltd
July 2018
© WESTIR Limited A.B.N 65 003 487 965 A.C.N. 003 487 965
This work is Copyright. Apart from use permitted under the Copyright Act 1968, no part can be reproduced by any process without
the written permission from the Executive Officer of WESTIR Ltd.
All possible care has been taken in the preparation of the information contained in this publication. However, WESTIR Ltd
expressly disclaims any liability for the accuracy and sufficiency of the information and under no circumstances shall be liable in
negligence or otherwise in or arising out of the preparation or supply of any of the information WESTIR Ltd is partly funded by the NSW Department of Family and Community Services.
WESTIR LTD
Suite 7, Level 2 154 Marsden Street Parramatta, NSW 2150 PO Box 136 Parramatta 2124
[email protected] (02) 9635 7764
ABN: 65 003 487 965 ACN: 003 487 965 |

1
2016 Census Topic Paper
Estimating Homelessness in Greater Western Sydney
By Amy Lawton, Social Research and Information Officer, WESTIR Ltd
July 2018
Acknowledgement of Country / Statement of Commitment
We respectfully acknowledge the traditional custodians of the land which Western Sydney covers, the Dharug people of the Dharug Nation, and pay our respects to Elders past and
present. We acknowledge that Dharug people were the first people of the Western Sydney area and have striven to retain their culture, identity and special connection with country for more than two centuries of non-Aboriginal and Torres Strait Islander settlement. We recognise the valuable contribution made by Dharug people to the local community in working towards a
future of mutual harmony and respect.
Table of contents Key points ………………………………………………………………………………………… p. 2 Aim of this paper ………………………………………………………………………………… p. 3 Estimating homelessness through the Australian Census ………………………………….. p. 3 Concepts and definitions of homelessness ………………………………………….. p. 3 Homeless operational groups …………………………………………………………. p. 4 Limitations with estimating homelessness ……………………………………………………. p. 4 Geographical regions used in this paper ……………………………………………………… p. 5 National and state estimates of homelessness …………………………………………….... p. 9 Estimating homelessness in Greater Western Sydney, 2016 ………………………………. p. 12 By Local Government Area …………………………………………………………….. p. 12 By Statistical Area ……………………………………………………………………….. p. 14 Mapping homelessness in Greater Sydney …………………………………………………… p. 23 Key references on homelessness ……………………………………………………………… p. 29 Appendices ……………………………………………………………………………………….. p. 30

2
Key points
• At the 2016 Census, there were an estimated 116,427 people in Australia who were classified as being homeless on Census night, up from 102, 439 persons in 2011. This represented an increase of 13.7% since 2011, and a rate per capita increase from 48 persons per 10,000 in 2011 to 49.8 persons per 10,000 in 2016.
• In NSW, there were an estimated 36,715 people enumerated in the Census who were classified as being homeless on Census night, up from 28,192 persons in 2011. NSW had the fastest growing homelessness rate in the country, rising by 27% between 2011 and 2016 (from 40 persons per 10,000 in 2011 to 50.4 persons per 10,000 in 2016).
• It was estimated that there were 14,147 homeless persons across the thirteen local government areas (LGAs) in Greater Western Sydney (GWS) in 2016. The number of homeless persons in GWS increased by 5,183 persons or 57.8% since 2011. The GWS homeless population grew at a faster rate than the homeless population of Greater Sydney (+47.5%), NSW (+37.1%) and Australia (+13.7%).
• Cumberland LGA had the largest homeless population in GWS (3,129 persons), followed by Canterbury – Bankstown (2,582 persons), Fairfield (2,226 persons), Blacktown (1,534 persons) and Liverpool (1,058 persons). Canterbury – Bankstown had the largest growth in homeless persons in GWS between 2011 and 2016, increasing by 1,086 persons or 72.6%.
• GWS had 61.3 homeless persons per 10,000 of the population in 2016, up from 43.5 persons per 10,000 in 2011. This was slightly lower than Greater Sydney rates (62.2 per 10,000) but higher than NSW (50.4 per 10,000) and Australia (49.8 per 10,000). Cumberland LGA had the highest homeless rate in GWS (144.8 homeless persons per 10,000), followed by Fairfield LGA (112.0 persons per 10,000).
• The Statistical Area 4 (SA4) in the GWS region with the highest total homeless persons was ‘Sydney – Parramatta’ (4,347 persons), followed by ‘Sydney – Inner South West’ (3,710 persons) and ‘Sydney – South West’ (3,071 persons). These three areas contained approximately 73% of the homeless population in the GWS region.
• Most homeless persons in GWS SA4s were living in severely crowded dwellings (10,238 persons; 66.8%), followed by persons in supported accommodation for the homeless (2,512 persons; 16.4%), persons temporarily living with other households (1,409 persons; 9.2%), persons living in boarding houses (838 persons; 5.5%), persons living in improvised dwellings, tents or sleeping out (307 persons; 2.0%) and persons living in other temporary lodgings (22 persons; 0.1%).
• When looking at those living other marginalised housing, most persons across GWS SA4s were living in other crowded dwellings (19,750 persons; 96.7%), while the rest were living in other improvised dwellings (414 persons; 2.0%) and caravan parks (264 persons; 1.3%).

3
Aim of this paper The aim of this paper is to explore the homelessness estimates of the Greater Western Sydney (GWS) region in NSW, derived from the 2016 Australian Census of Population and Housing. GWS, home to over 2.3 million people in 2016, is one of the fastest growing regions in the country and the geographical area it covers is outlined in the next section. Where appropriate, 2016 homelessness estimates are also compared with 2011 estimates to determine the change experienced by this population over a five year period.
Estimating homelessness through the Australian Census Concepts and definitions of homelessness The Australian Bureau of Statistics (ABS) undertakes the Census of Population and Housing every five years to count all persons in Australia on Census night, including homeless persons. While homelessness is not directly measured in the Census, the ABS undertakes a special methodology to estimate the number of homeless Australians at one point in time based on characteristics observed and assumptions made about the way people respond to Census questions. Measuring the prevalence of homelessness over many Censuses helps decisionmakers understand changes to homelessness over time, and shape policy and planning responses that successfully meet the needs of homeless people. Broadly, the ABS statistical definition of homelessness is: “When a person does not have suitable accommodation alternatives, they are considered homeless if their current living arrangement: (a) is in a dwelling that is inadequate, (b) has no tenure, or if their initial tenure is short and not extendable, or (c) does not allow them to have control of, and access to space for social relations” Definitions of homelessness are culturally and historically contingent. They range from limited objective measures which conflate homelessness with rooflessness to more equivocal subjective definitions founded on culturally and historically determined ideas of 'home'. The ABS definition of homelessness is informed by an understanding of homelessness as 'home' lessness, not rooflessness. These elements include: a sense of security, stability, privacy, safety, and the ability to control living space. Homelessness is therefore a lack of one or more of the elements that represent 'home'. The Chamberlain and MacKenzie (1992) cultural definition of homelessness (primary, secondary and tertiary) is not explicitly used by the ABS to define homelessness, however it is used by the ABS to test the validity of its existing definition. The ABS definition of homelessness is also used to produce statistics on homelessness from a range of ABS collections other than the Census of Population and Housing. This includes prevalence estimates from household surveys such as the General Social Survey, Survey of Disability, Ageing and Carers, Personal Safety Survey, National Aboriginal and Torres Strait Islander Social Survey, and other surveys, as appropriate.

4
Homeless operational groups The ABS uses six homeless operational groups to assess whether people enumerated in the Census were likely to be homeless on Census night. These groups are (1) people living in improvised dwellings – tents – sleepers out, (2) persons in supported accommodation for the homeless, (3) persons staying temporarily with other households, (4) people in boarding houses, (5) people in other temporary lodging, and (6) persons in severely crowded dwellings. The ABS also compiles estimates from Census data for specific key groups of people who are marginally housed (that is, people in housing situations close to the minimum standard), but who are not classified as homeless. Those groups are (1) persons living in other crowded dwellings, (2) persons in other improvised dwellings, and (3) persons who are marginally housed in caravan parks. The marginal housing groups are limited to the groups that can be obtained from the Census. Other marginal housing, such as housing with major structural problems or where residents are in constant threat of violence, cannot be obtained from the Census and are therefore not included.
Limitations with estimating homelessness The Census does not ask people whether or not they were homeless on Census night, but rather measures homelessness by aggregating responses to a number of questions. In other words, there is no single variable in the Census that directly measures homelessness. Therefore, the suite of variables used to estimate homelessness must be interpreted as proxies for likely, not definite, homelessness. As with any estimate, there is the potential to under- or over-estimate homelessness. This is true especially for certain groups, such as Aboriginal and Torres Strait Islander peoples, for whom there is a known likely undercount in the Census. The ABS has developed specific enumeration strategies for groups for whom a known undercount is likely to occur, by working with homeless service providers and others to ensure that all Australians are counted on Census night. However, it is important to use supplementary data sources to further inform homelessness estimates. For example, the ABS also publishes the General Social Survey (GSS) results, which provides information on people who have been homeless in the past, but are now usual residents of private dwellings. The GSS asks people about whether they were ever without a permanent place to live; the reasons for those circumstances; and their use of services in relation to periods of homelessness. Unlike the Census, the GSS cannot directly derive a prevalence measure of homelessness but it can inform analysis of the homelessness prevalence estimated by the Census. There is also a range of other homelessness datasets which create a more holistic picture of homelessness in Australia:
• City Street Counts: are regularly undertaken in cities across Australia but differ in methodologies, timeframes, resources, scope and area coverage. Hence, the counts cannot be directly compared across cities and may not coincide with other estimates for rough sleepers.
• Specialist Homelessness Services (SHS) Collection: undertaken by the Australian Institute of Health and Welfare to gauge the assistance provided by government funded specialist homelessness services to clients and their children. The SHS Collection

5
replaced the Supported Accommodation Assistance Program (SAAP) from July 2011, hence caution should be exercised when comparing these datasets over time.
• Report on Government Services: is commissioned annually to assess the performance of government services and help drive improvements in service effectiveness and efficiency. This report includes performance information on housing and homelessness, including public and community housing, Indigenous housing and homelessness services.
Geographical regions used in this paper This topic paper explores homelessness estimates in GWS by Local Government Area (LGA) and Statistical Areas (SAs). 2016 is the first Census for which the ABS has published homelessness estimates by LGA. GWS is made up of the followings LGAs:
• Blacktown
• Blue Mountains
• Camden
• Campbelltown
• Canterbury – Bankstown
• Cumberland
• Fairfield
• Hawkesbury
• Liverpool
• Parramatta
• Penrith
• The Hills Shire
• Wollondilly Lithgow and Wingecarribee LGAs are also presented with these estimates as they are part of the major NSW government service districts of Western and South Western Sydney, but are not included in GWS totals. Homelessness estimates are also explored through the Statistical Areas (SAs) released by the ABS, as defined by the Australian Statistical Geographic Standard (ASGS):
• Statistical Area Level 2 (SA2s): general purpose medium sized area built on whole
Statistical Area Level 1s (SA1s), the smallest geographical region in the ASGS. They have a population range from 3,000 to 25,000 persons, and have an average population of 10,000 persons.
• Statistical Area Level 3 (SA3s): standardised regional breakups of Australia built from whole SA2s and generally have populations between 30,000 to 130,000 persons.
• Statistical Area Level 4 (SA4s): the largest sub-state regions built from whole SA3s.

6
Broadly, GWS consists of the following SA4 regions:
• Sydney – Baulkham Hills and Hawkesbury
• Sydney – Blacktown
• Sydney – Inner South West
• Sydney – Outer South West
• Sydney – Outer West and Blue Mountains
• Sydney – Parramatta
• Sydney – South West Please note that the Statistical Areas (SA4s, SA3s and SA2s) do not conform neatly to LGA boundaries, as LGAs are considered non-ABS structures. The SA regions used in this paper do not map perfectly to the LGA or GWD boundaries (See Map 1 for more details). While the sum of LGAs are a more accurate representation of the GWS boundary, the SA levels (particularly SA3 and SA2) allow homelessness estimates to be explored at a finer geographical level than at LGA level. This paper also provides homelessness estimates for Greater Sydney, which is calculated either using Greater Sydney LGAs or Sydney SA4s. The geographical areas used to create Greater Sydney in the LGA and SAs datasets are outlined in Table 1. Homelessness estimates for NSW and Australia are also provided for comparison and follow the standard ABS geographical structures. Finally, some boundaries at both an LGA and SA level have changed between 2011 and 2016, and any discrepancies in data are outlined with the corresponding tables. All Census data is based on place of enumeration unless stated otherwise.

7
Table 1: Greater Sydney by LGA and SA4, 2016
Greater Sydney (by LGA) Greater Sydney (by SA4)
• Blacktown
• Blue Mountains
• Botany Baya
• Camden
• Campbelltown
• Canada Bay
• Canterbury – Bankstownb
• City of Sydney
• Cumberlandb
• Fairfield
• Georges Riverb
• Hawkesbury
• Hornsby
• Hunters Hill
• Inner Westb
• Ku-ring-gai
• Lane Cove
• Liverpool
• Mosman
• North Sydney
• Northern Beachesb
• Parramatta
• Penrith
• Randwick
• Rockdalea
• Ryde
• Strathfield
• Sutherland Shire
• The Hills Shire
• Waverley
• Willoughby
• Wollondilly
• Woollahra
• Sydney – Baulkham Hills and Hawkesbury
• Sydney – Blacktown
• Sydney – Inner South West
• Sydney – Outer South West
• Sydney – Outer West and Blue Mountains
• Sydney – Parramatta
• Sydney – South West
• Sydney – City and Inner South
• Sydney – Eastern Suburbs
• Sydney – Inner West
• Sydney – North Sydney and Hornsby
• Sydney – Northern Beaches
• Sydney – Ryde
• Sydney – Sutherland
aPlease note Botany Bay and Rockdale LGAs were amalgamated into Bayside LGA in 2016, however Census data was collected as two separate LGAs and therefore still presented as this in this paper. bThe following LGAs were also amalgamated in 2016: Inner West from Ashfield, Leichhardt and Marrickville LGAs; Georges River from Kogarah and Hurstville LGAs; Cumberland from Auburn, Holroyd and part of Parramatta LGAs; Northern Beaches for Manly, Pittwater and Warringah. 2011 estimates are derived from these previous boundary datasets.

8
Map 1: Statistical Area 4 and Local Government Area Boundaries, Greater Sydney, 2016

9
National and state estimates of homelessness At the 2016 Census, there were an estimated 116,427 people in Australia who were classified as being homeless on Census night, up from 102, 439 persons in 2011. This represented an increase of 13.7% since 2011, and a rate per capita increase from 47.6 persons per 10,000 in 2011 to 49.8 persons per 10,000 in 2016. Most of the increase in homelessness between 2011 and 2016 was found in the count of persons living in ‘severely crowded dwellings, up from 41,370 persons in 2011 to 51,088 in 2016. The distribution of homeless people by Australian state or territory in 2016 can be found in Map 1 and Table 2. Homelessness rates over time by Australian state or territory can also be found in Table 3. Table 2: Estimated homeless population by state and territory, 2016
Source: ABS, Estimating Homelessness, 2016 [Cat. No. 2049.0]
Table 3: Rate of homeless persons per 10,000 of the population, by State and Territory of usual residence - 2001, 2006, 2011 and 2016 (a)
Source: ABS, Estimating Homelessness, 2016 [Cat. No. 2049.0]
(a) Cells in this table have been randomly adjusted to avoid the release of confidential data. As a result cells may not add to the totals.
(b) Homeless estimates from 2011 for the category 'Persons living in boarding houses' have been revised.
State/territoryEstimated number of
homeless persons
Homeless rate per 10,000
people
New South Wales 37,715 50.4
Victoria 24,817 41.9
Queensland 21,671 46.1
South Australia 6,224 37.1
Western Australia 9,005 36.4
Tasmania 1,622 31.8
Northern Territory 13,717 599.4
ACT 1,596 40.2
Australia 116,427 49.8
Estimated homeless population by state and territory, 2016
States and Territories 2001 2006 2011 (b) 2016
New South Wales 36.4 33.9 39.7 50.4
Victoria 38.9 35.3 41.7 41.9
Queensland 54.8 48.3 43.9 46.1
South Australia 39.8 37 36.4 37.1
Western Australia 53.6 42.3 41 36.4
Tasmania 27.5 24 31 31.8
Northern Territory 904.4 791.7 723.3 599.4
Australian Capital Territory 30.4 29.3 48.7 40.2
Australia 50.8 45.2 47.6 49.8
Rate of homeless persons per 10,000 by state and territory of usual residence, 2001-16

10
Map 1: Total homeless persons (number) by SA2, Australia, 2016

11
In New South Wales (NSW), there were an estimated 36,715 people enumerated in the Census who were classified as being homeless on Census night, up from 28,192 persons in 2011. NSW had the fastest growing homelessness rate in the country, rising by 27% between 2011 and 2016 (from 40 persons per 10,000 in 2011 to 50 persons per 10,000 in 2016). On a national and state level, the following groups were disproportionately represented in the homeless population: rough sleepers, males, younger age groups (those under 25 years) and older age groups (those 55 years and over), Aboriginal and/or Torres Strait Islander people, culturally and linguistically diverse people and those with disability. Detailed statistics about these groups can be found on the ABS website. In addition, there were 43.5 persons per 10,000 in NSW who were estimated to be in some form of marginalised housing (and at risk of homelessness), higher than the 34.6 persons per 10,000 for Australia as a whole.

12
Estimating homelessness in Greater Western Sydney, 2016
By Local Government Area
Homelessness numbers
• In 2016, it was estimated that there were 14,147 homeless persons across the thirteen LGAs in GWS. This equated to 0.6% of the GWS population (similar to Greater Sydney [0.6%], NSW [0.5%] and national [0.5%] proportions).
• The number of homeless persons in GWS increased by 5,183 persons or 57.8% since 2011. The GWS homeless population grew at a faster rate than the homeless population of Greater Sydney (+47.5%), NSW (+37.1%) and Australia (+13.7%).
• Cumberland LGA had the largest homeless population in GWS (3,129 persons), followed by Canterbury – Bankstown (2,582 persons), Fairfield (2,226 persons), Blacktown (1,534 persons) and Liverpool (1,058 persons).
• Notable homeless populations were also recorded in Parramatta (987 persons), Campbelltown (928 persons) and Penrith (890 persons).
• The lowest recorded homeless population in GWS was Wollondilly LGA (65 persons) and Camden LGA (96 persons).
• Peripheral LGAs of the GWS region, Lithgow and Wingecarribee, also recorded low homeless populations (60 persons and 92 persons respectively), although the homeless in Lithgow made up 0.3% of the LGA’s population, which was a higher proportion than other LGAs such as Blue Mountains and The Hills Shire.
• Canterbury – Bankstown had the largest growth in homeless persons in GWS between 2011 and 2016, increasing by 1,086 persons or 72.6%. After Canterbury – Bankstown, the largest growth in homelessness was in Fairfield (+842 persons, +60.8%), Penrith (+283 persons; +46.6%) and Campbelltown (+284 persons; +44.1%). Outside the region, Lithgow’s homeless population increased by 66.7% since 2011.
• Only two LGAs in GWS recorded a minor decline in their homeless populations since 2011 – Blue Mountains (-68 persons; -28.6%) and Wollondilly (-6 persons; -8.5%).
Homelessness rates
• As a rate, GWS had 61.3 homeless persons per 10,000 in 2016, up from 43.5 persons per 10,000 in 2011. This was slightly lower than Greater Sydney rates (62.2 per 10,000) but higher than NSW (50.4 per 10,000) and Australia (49.8 per 10,000).
• Cumberland LGA had the highest homelessness rate in GWS (144.8 homeless persons per 10,000), followed by Fairfield LGA (112.0 persons per 10,000). These homeless rates were still not as high as inner city areas such as the City of Sydney (242.9 homeless persons per 10,000).
• The largest changes to homelessness rates from 2011 to 2016 were experienced by Canterbury – Bankstown (from 46.8/10,000 in 2011 to 74.6/10,000 in 2016; +59.4%), Lithgow (outside GWS) (from 17.9/10,000 to 28.4/10,000; +59.3%) and Fairfield (from 73.7/10,000 to 112.0/10,000; +51.9%).
• Some GWS LGAs experienced a decline in homelessness rates, including Blacktown, Blue Mountains, Camden, Parramatta and Wollondilly, but this may be due to faster rates of population growth in most of these areas.

13
Table 4: Homelessness estimates, rates and 5 year change, Greater Western Sydney LGAs and comparative regions, 2016
Homelessness estimates, rates and 5 year change, Greater Western Sydney LGAs and comparative regions, 2016
LGA
2016
Homeless change 2011-
16
All homeless persons
(no.)
Usual residence population
(2016)
Rate per
10,000 % of GWS homeless
% of Greater Sydney
homeless No %
Blacktown 1,534 336,962 45.5 10.8% 5.5% 134 9.6%
Blue Mountains 170 76,904 22.1 1.2% 0.6% -68 -28.6%
Camden 96 78,218 12.3 0.7% 0.3% 10 11.6%
Campbelltown 928 157,006 59.1 6.6% 3.3% 284 44.1%
Canterbury-Bankstown 2,582 346,302 74.6 18.3% 9.2% 1,086 72.6%
Cumberland 3,129 216,079 144.8 22.1% 11.2% N/A N/A
Fairfield 2,226 198,817 112.0 15.7% 8.0% 842 60.8%
Hawkesbury 231 64,592 35.8 1.6% 0.8% 32 16.1%
Lithgow 60 21,090 28.4 N/A 0.2% 24 66.7%
Liverpool 1,058 204,326 51.8 7.5% 3.8% 280 36.0%
Parramatta 987 226,149 43.6 7.0% 3.5% 183 22.8%
Penrith 890 196,066 45.4 6.3% 3.2% 283 46.6%
The Hills Shire 251 157,243 16.0 1.8% 0.9% 47 23.0%
Wingecarribee 92 47,882 19.2 N/A 0.3% 8 9.5%
Wollondilly 65 48,519 13.4 0.5% 0.2% -6 -8.5%
City of Sydney 5,061 208,374 242.9 N/A 18.1% 2,024 66.6%
Greater Western Sydney* 14,147 2,307,183 61.3 N/A 50.6% 5,183 57.8%
Greater Sydney 27,963 4,496,196 62.2 N/A 100.0% 9,008 47.5%
New South Wales 37,692 7,480,228 50.4 N/A N/A 10,209 37.1%
Australia 116,427 23,401,892 49.8 N/A N/A 13,988 13.7% Source: ABS Census of Population and Housing, 2011, 2016 - Estimating Homelessness (Cat No 2049.0) and ABS QuickStats 2011, 2016 *2011 GWS homelessness estimate includes Auburn (628 persons) and Holroyd LGAs (425 persons).
For the expanded table with 2011 homelessness data, please see Appendix A.

14
By Statistical Area
Statistical Area 4 (SA4s)
• In 2016, it was estimated that there were 15,333 homeless persons across the SA4s that cover the GWS region (See Map 1 for the geographical area that the SA4s cover).
• The SA4 in the GWS region with the highest total number of homeless persons was ‘Sydney – Parramatta’ (4,347 persons), followed by ‘Sydney – Inner South West’ (3,710 persons) and ‘Sydney – South West’ (3,071 persons). These three areas contained approximately 73% of the homeless population in the GWS region.
• Areas such as ‘Sydney – Blacktown’ (1,554 persons), ‘Sydney – Outer West and Blue Mountains (1,223 persons) and ‘Sydney – Outer South West’ (1,045 persons) also recorded over 1,000 persons experiencing homelessness.
• The SA4 with the lowest recorded homeless population in GWS was ‘Sydney – Baulkham Hills and Hawkesbury’ (383 persons).
• Overall, all the SA4s in the GWS region had a lower homeless population than inner city SA4 ‘Sydney – City and Inner South’ (6,196 persons). In saying, that ‘Sydney – Parramatta had a faster homeless growth between 2011 and 2016 (+2,210 persons; +103.4%) than ‘Sydney – City and Inner South’ (+2,057; +49.7%). More information about the 5 year homeless population change (2011 – 2016) by SA4 can be found in Table 5.
Table 5: Homelessness estimates, by place of enumeration, by Statistical Area 4, Greater Western Sydney and comparative regions, 2011 – 2016
All homeless persons, by place of enumeration, by Statistical Area 4, 2011-2016
SA4
2016 2011
Change 2011-2016
All homeless persons
All homeless persons
no. no. no. %
Sydney - City and Inner South 6,196 4,139 2,057 49.7%
Sydney - Parramatta 4,347 2,137 2,210 103.4%
Sydney - Inner South West 3,710 2,255 1,455 64.5%
Sydney - South West 3,071 2,100 971 46.2%
Sydney - Inner West 2,572 1,914 658 34.4%
Sydney - Blacktown 1,554 1,400 154 11.0%
Sydney - Eastern Suburbs 1,481 1,204 277 23.0%
Sydney - Outer West and Blue Mountains 1,223 1,002 221 22.1%
Sydney - Outer South West 1,045 771 274 35.5%
Sydney - North Sydney and Hornsby 1,036 823 213 25.9%
Sydney - Northern Beaches 605 370 235 63.5%
Sydney - Ryde 485 302 183 60.6%
Sydney - Baulkham Hills and Hawkesbury 383 237 146 61.6%
Sydney - Sutherland 266 317 -51 -16.1%
Greater Western Sydney (total SA4s) 15,333 7,524 4,596 61.1%
Greater Sydney (total SA4s) 27,974 18,971 9,003 47.5%
New South Wales 37,692 27,483 10,209 37.1%
Australia 116,427 102,439 13,988 13.7% Source: ABS Census of Population and Housing, 2011, 2016 - Estimating Homelessness (Cat No 2049.0)
15
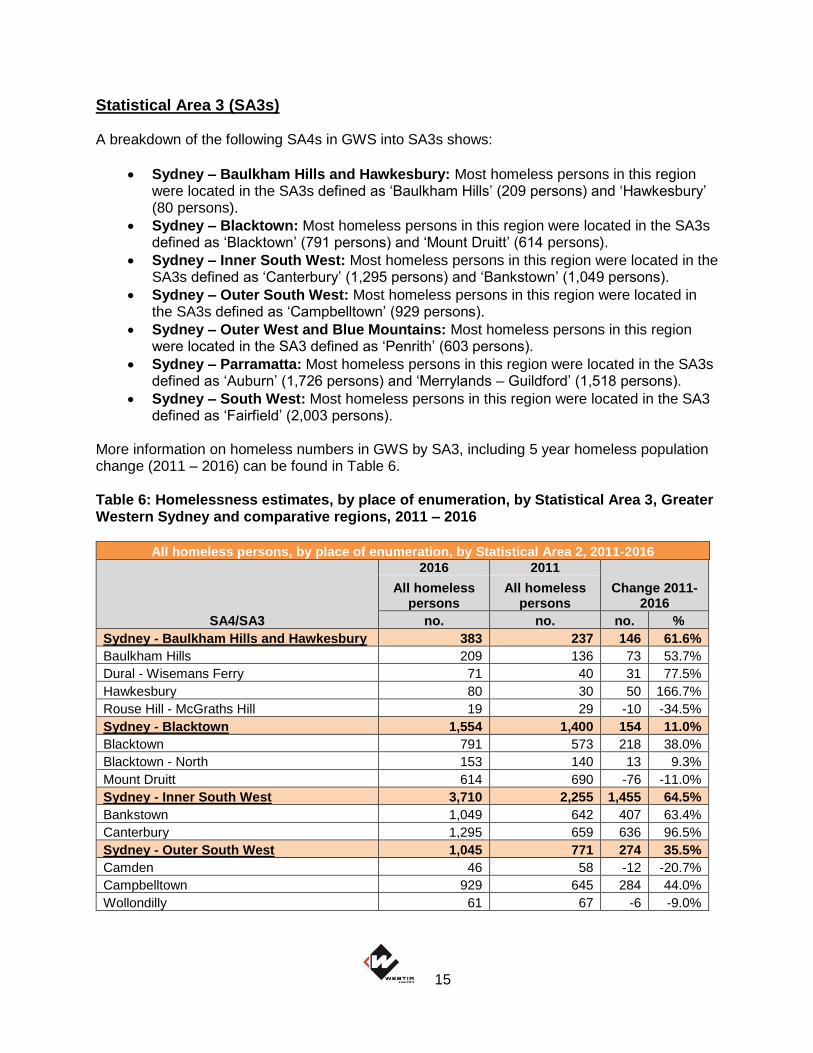
Statistical Area 3 (SA3s) A breakdown of the following SA4s in GWS into SA3s shows:
• Sydney – Baulkham Hills and Hawkesbury: Most homeless persons in this region were located in the SA3s defined as ‘Baulkham Hills’ (209 persons) and ‘Hawkesbury’ (80 persons).
• Sydney – Blacktown: Most homeless persons in this region were located in the SA3s defined as ‘Blacktown’ (791 persons) and ‘Mount Druitt’ (614 persons).
• Sydney – Inner South West: Most homeless persons in this region were located in the SA3s defined as ‘Canterbury’ (1,295 persons) and ‘Bankstown’ (1,049 persons).
• Sydney – Outer South West: Most homeless persons in this region were located in the SA3s defined as ‘Campbelltown’ (929 persons).
• Sydney – Outer West and Blue Mountains: Most homeless persons in this region were located in the SA3 defined as ‘Penrith’ (603 persons).
• Sydney – Parramatta: Most homeless persons in this region were located in the SA3s defined as ‘Auburn’ (1,726 persons) and ‘Merrylands – Guildford’ (1,518 persons).
• Sydney – South West: Most homeless persons in this region were located in the SA3 defined as ‘Fairfield’ (2,003 persons).
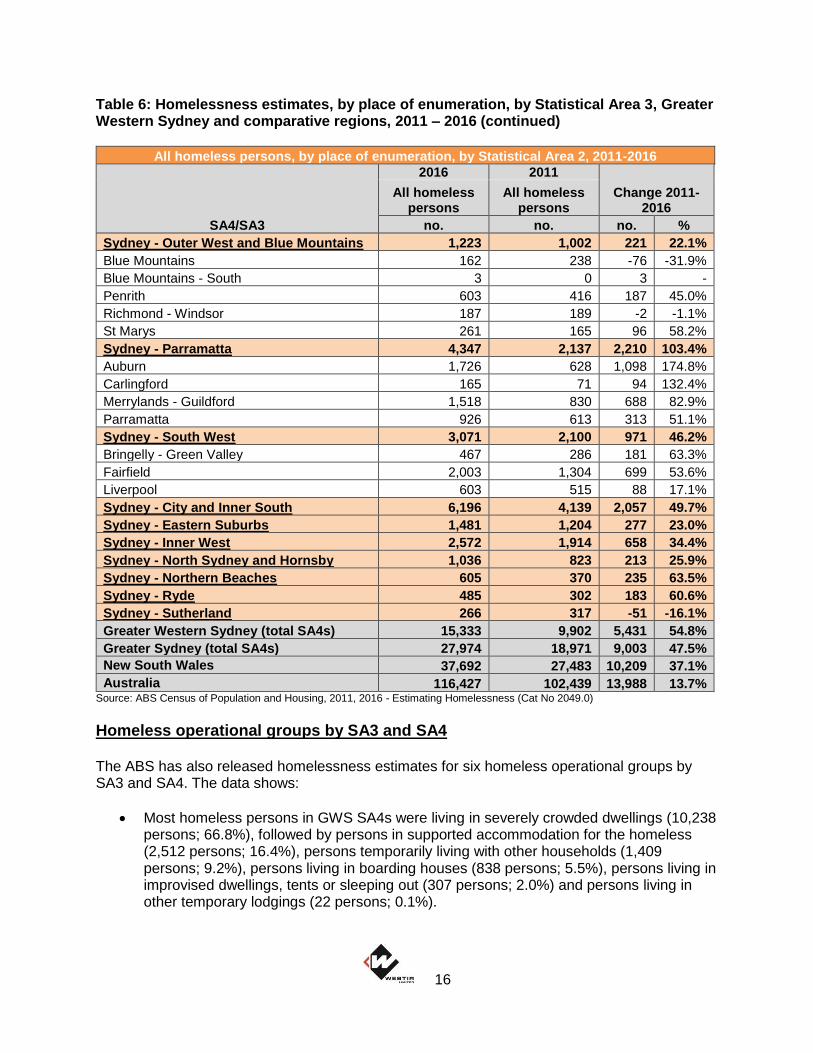
More information on homeless numbers in GWS by SA3, including 5 year homeless population change (2011 – 2016) can be found in Table 6. Table 6: Homelessness estimates, by place of enumeration, by Statistical Area 3, Greater Western Sydney and comparative regions, 2011 – 2016
All homeless persons, by place of enumeration, by Statistical Area 2, 2011-2016
SA4/SA3
2016 2011
Change 2011-2016
All homeless persons
All homeless persons
no. no. no. %
Sydney - Baulkham Hills and Hawkesbury 383 237 146 61.6%
Baulkham Hills 209 136 73 53.7%
Dural - Wisemans Ferry 71 40 31 77.5%
Hawkesbury 80 30 50 166.7%
Rouse Hill - McGraths Hill 19 29 -10 -34.5%
Sydney - Blacktown 1,554 1,400 154 11.0%
Blacktown 791 573 218 38.0%
Blacktown - North 153 140 13 9.3%
Mount Druitt 614 690 -76 -11.0%
Sydney - Inner South West 3,710 2,255 1,455 64.5%
Bankstown 1,049 642 407 63.4%
Canterbury 1,295 659 636 96.5%
Sydney - Outer South West 1,045 771 274 35.5%
Camden 46 58 -12 -20.7%
Campbelltown 929 645 284 44.0%
Wollondilly 61 67 -6 -9.0%
16
Table 6: Homelessness estimates, by place of enumeration, by Statistical Area 3, Greater Western Sydney and comparative regions, 2011 – 2016 (continued)
All homeless persons, by place of enumeration, by Statistical Area 2, 2011-2016
SA4/SA3
2016 2011
Change 2011-2016
All homeless persons
All homeless persons
no. no. no. %
Sydney - Outer West and Blue Mountains 1,223 1,002 221 22.1%
Blue Mountains 162 238 -76 -31.9%
Blue Mountains - South 3 0 3 -
Penrith 603 416 187 45.0%
Richmond - Windsor 187 189 -2 -1.1%
St Marys 261 165 96 58.2%
Sydney - Parramatta 4,347 2,137 2,210 103.4%
Auburn 1,726 628 1,098 174.8%
Carlingford 165 71 94 132.4%
Merrylands - Guildford 1,518 830 688 82.9%
Parramatta 926 613 313 51.1%
Sydney - South West 3,071 2,100 971 46.2%
Bringelly - Green Valley 467 286 181 63.3%
Fairfield 2,003 1,304 699 53.6%
Liverpool 603 515 88 17.1%
Sydney - City and Inner South 6,196 4,139 2,057 49.7%
Sydney - Eastern Suburbs 1,481 1,204 277 23.0%
Sydney - Inner West 2,572 1,914 658 34.4%
Sydney - North Sydney and Hornsby 1,036 823 213 25.9%
Sydney - Northern Beaches 605 370 235 63.5%
Sydney - Ryde 485 302 183 60.6%
Sydney - Sutherland 266 317 -51 -16.1%
Greater Western Sydney (total SA4s) 15,333 9,902 5,431 54.8%
Greater Sydney (total SA4s) 27,974 18,971 9,003 47.5%
New South Wales 37,692 27,483 10,209 37.1%
Australia 116,427 102,439 13,988 13.7% Source: ABS Census of Population and Housing, 2011, 2016 - Estimating Homelessness (Cat No 2049.0)
Homeless operational groups by SA3 and SA4 The ABS has also released homelessness estimates for six homeless operational groups by SA3 and SA4. The data shows:
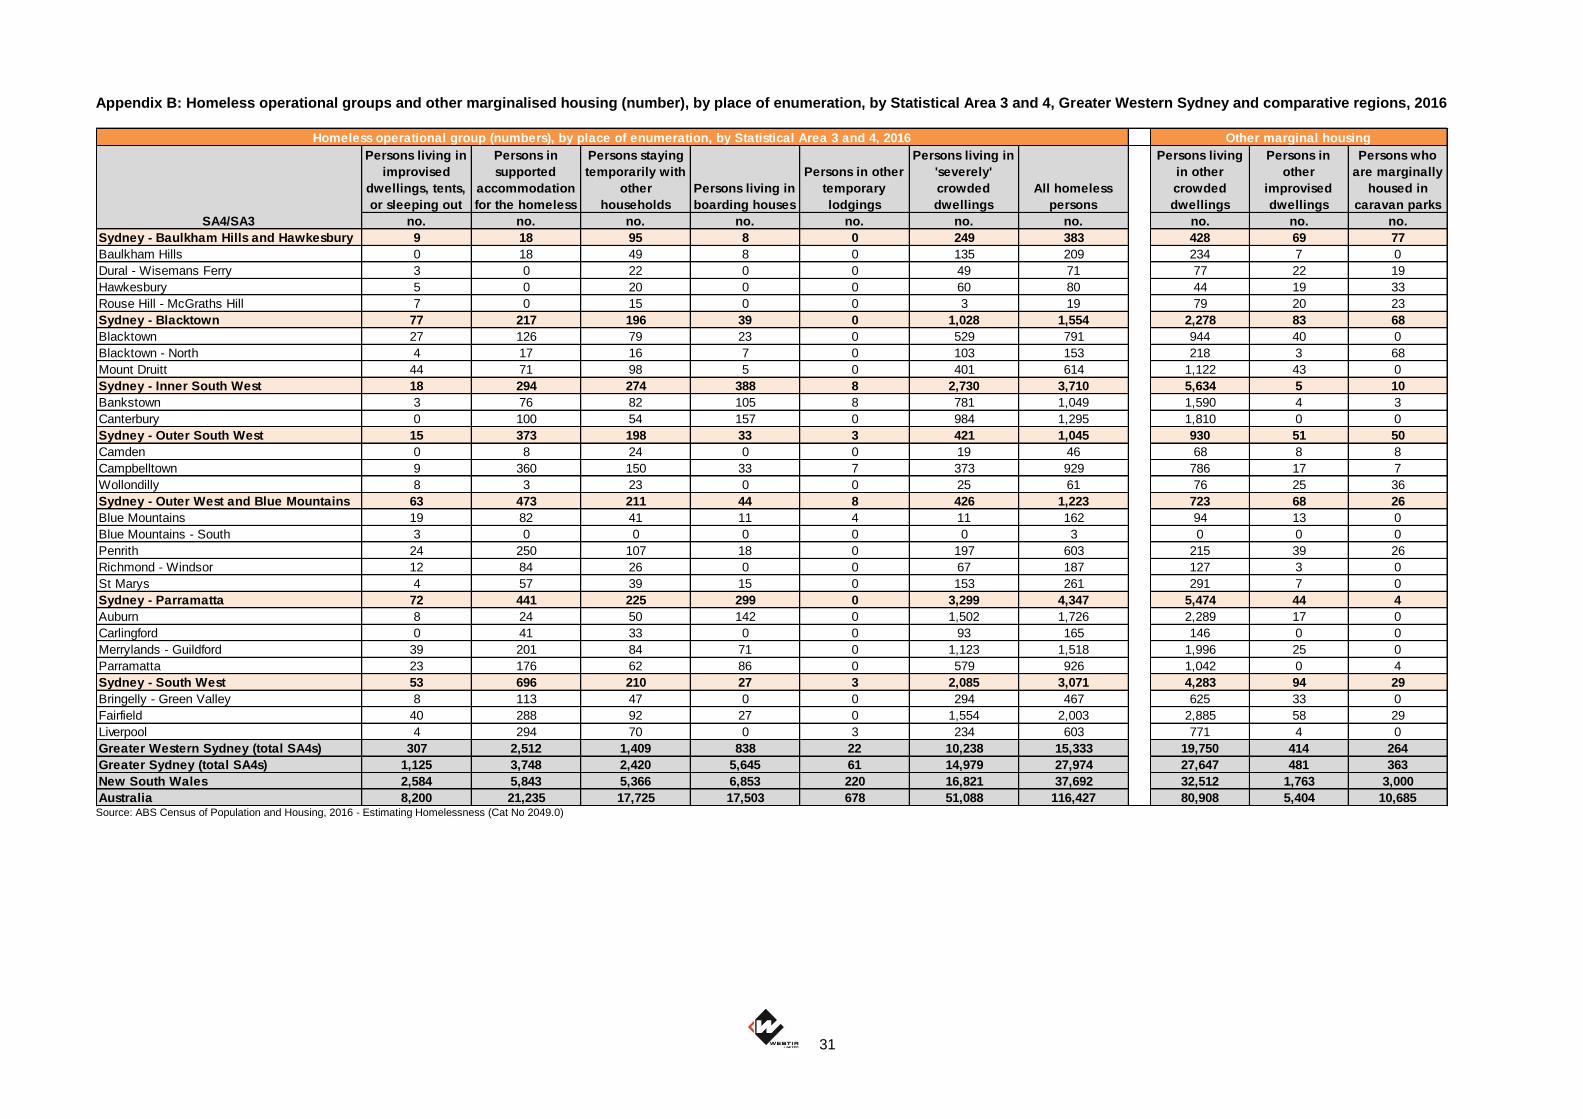
• Most homeless persons in GWS SA4s were living in severely crowded dwellings (10,238 persons; 66.8%), followed by persons in supported accommodation for the homeless (2,512 persons; 16.4%), persons temporarily living with other households (1,409 persons; 9.2%), persons living in boarding houses (838 persons; 5.5%), persons living in improvised dwellings, tents or sleeping out (307 persons; 2.0%) and persons living in other temporary lodgings (22 persons; 0.1%).

17
• When looking at the distribution across GWS SA4s, most homeless persons in ‘Sydney – Baulkham Hills and Hawkesbury’, ‘Sydney – Blacktown’, ‘Sydney – Inner South West’, ‘Sydney – Outer South West’, ‘Sydney – Parramatta’ and ‘Sydney – South West’ were classified as living in ‘severely’ crowded dwellings. Most homeless persons in ‘Sydney – Outer West and Blue Mountains’ were living in supported accommodation for the homeless.
• When looking at those living other marginalised housing, most persons across GWS SA4s were living in other crowded dwellings (19,750 persons; 96.7%), while the rest were living in other improvised dwellings (414 persons; 2.0%) and caravan parks (264 persons; 1.3%).
• Between 2011 and 2016, the homeless operational groups in GWS that experienced the largest growth were persons living in ‘severely’ crowded dwellings (+4,019 persons; 64.6%) and persons in supported accommodation for the homeless (+1,159 persons; +85.7%). For marginalised housing, the largest growth was in persons living in other crowded dwellings (+6,366 persons; +47.6%) and in other improvised dwellings (256 persons; +162.0%).
More information on homeless operational groups in GWS by SA3 and SA4, including 5 year homeless population change (2011 – 2016) can be found in Appendix B – F.
Statistical Area 2 A breakdown of SA3 regions into SA2 regions shows that the highest number of homeless persons (over 200 persons) in GWS were located in:
• Auburn – Central: 661 persons
• Auburn – North: 524 persons
• Cabramatta – Lansvale: 451 persons
• Parramatta – Rosehill: 362 persons
• Lakemba: 357 persons
• Guildford – South Granville: 342 persons
• Canterbury (South) – Campsie: 337 persons
• Merrylands – Holroyd: 308 persons
• Liverpool: 306 persons
• Bankstown – South: 278 persons
• Granville – Clyde: 275 persons
• Fairfield: 273 persons
• Ashcroft – Busby – Miller: 256 persons
• Canley Vale – Canley Heights: 248 persons
• Punchbowl: 236 persons
• Lidcombe: 234 persons
• Fairfield – East: 232 persons More information on homelessness numbers in GWS by SA2, including 5 year homeless population change (2011 – 2016) can be found in Table 7.

18
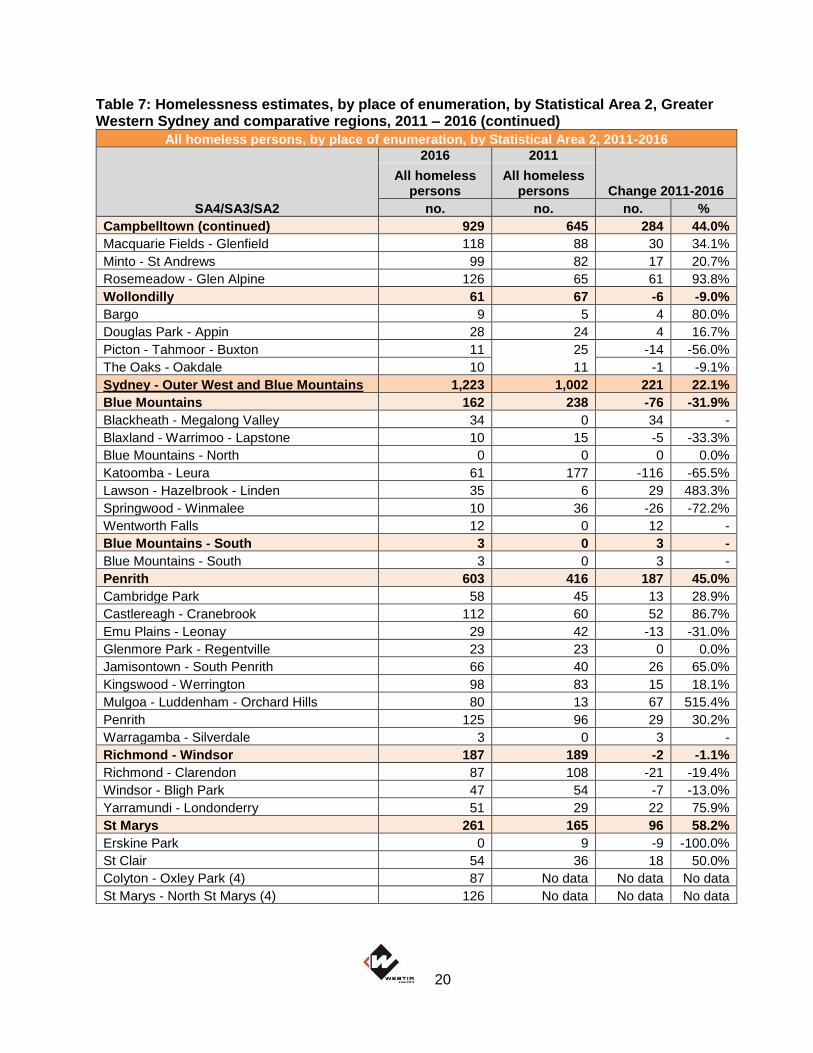
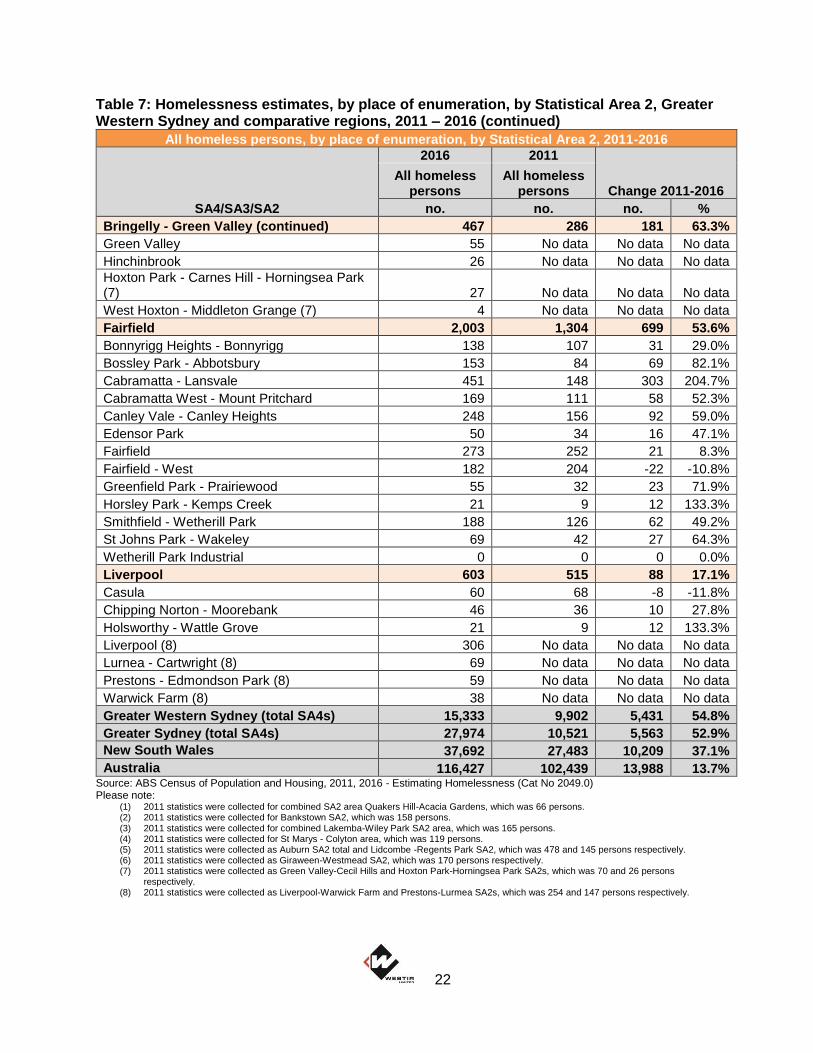
Table 7: Homelessness estimates, by place of enumeration, by Statistical Area 2, Greater Western Sydney and comparative regions, 2011 – 2016
All homeless persons, by place of enumeration, by Statistical Area 2, 2011-2016
SA4/SA3/SA2
2016 2011
Change 2011-2016 All homeless
persons All homeless
persons
no. no. no. %
Sydney - Baulkham Hills and Hawkesbury 383 237 146 61.6%
Baulkham Hills 209 136 73 53.7%
Baulkham Hills (East) 44 9 35 388.9%
Baulkham Hills (West) - Bella Vista 47 47 0 0.0%
Glenhaven 3 7 -4 -57.1%
West Pennant Hills 12 9 3 33.3%
Castle Hill - Central 26 21 5 23.8%
Castle Hill - East 0 No data No data No data
Castle Hill - North 22 No data No data No data
Castle Hill - South 8 No data No data No data
Castle Hill - West 0 No data No data No data
Cherrybrook 9 9 0 0.0%
Kellyville 42 37 5 13.5%
Dural - Wisemans Ferry 71 40 31 77.5%
Dural - Kenthurst - Wisemans Ferry 44 37 7 18.9%
Galston - Laughtondale 20 8 12 150.0%
Hawkesbury 80 30 50 166.7%
Bilpin - Colo - St Albans 38 0 38 -
Kurrajong Heights - Ebenezer 40 30 10 33.3%
Rouse Hill - McGraths Hill 19 29 -10 -34.5%
Pitt Town - McGraths Hill 18 11 7 63.6%
Rouse Hill - Beaumont Hills 4 16 -12 -75.0%
Sydney - Blacktown 1,554 1,400 154 11.0%
Blacktown 791 573 218 38.0%
Blacktown (East) - Kings Park 107 135 -28 -20.7%
Blacktown (North) - Marayong 83 86 -3 -3.5%
Doonside - Woodcroft 150 131 19 14.5%
Lalor Park - Kings Langley 85 18 67 372.2%
Seven Hills - Toongabbie 192 89 103 115.7%
Blacktown (South) 44 119 -75 -63.0%
Blacktown (West) 128 No data No data No data
Blacktown - North 153 140 13 9.3%
Glenwood 36 21 15 71.4%
Parklea - Kellyville Ridge 11 13 -2 -15.4%
Riverstone - Marsden Park 55 40 15 37.5%
Acacia Gardens (1) 0 No data No data No data
Quakers Hill (1) 41 No data No data No data

19
Table 7: Homelessness estimates, by place of enumeration, by Statistical Area 2, Greater Western Sydney and comparative regions, 2011 – 2016 (continued)
All homeless persons, by place of enumeration, by Statistical Area 2, 2011-2016
SA4/SA3/SA2
2016 2011
Change 2011-2016 All homeless
persons All homeless
persons
no. no. no. %
Mount Druitt 614 690 -76 -11.0%
Bidwill - Hebersham - Emerton 154 251 -97 -38.6%
Glendenning - Dean Park 53 22 31 140.9%
Hassall Grove - Plumpton 64 61 3 4.9%
Lethbridge Park - Tregear 90 79 11 13.9%
Mount Druitt - Whalan 160 162 -2 -1.2%
Prospect Reservoir 0 0 0 0.0%
Rooty Hill - Minchinbury 96 109 -13 -11.9%
Sydney - Inner South West 3,710 2,255 1,455 64.5%
Bankstown 1,049 642 407 63.4%
Bass Hill - Georges Hall 153 59 94 159.3%
Chullora 0 0 0 0.0%
Condell Park 42 23 19 82.6%
Greenacre - Mount Lewis 58 135 -77 -57.0%
Padstow 61 23 38 165.2%
Panania - Milperra - Picnic Point 63 22 41 186.4%
Revesby 60 47 13 27.7%
Yagoona - Birrong 187 178 9 5.1%
Bankstown - North (2) 134 No data No data No data
Bankstown - South (2) 278 No data No data No data
Canterbury 1,295 659 636 96.5%
Belmore - Belfield 122 70 52 74.3%
Canterbury (South) - Campsie 337 285 52 18.2%
Kingsgrove (North) - Earlwood 78 27 51 188.9%
Punchbowl 236 79 157 198.7%
Roselands 66 34 32 94.1%
Lakemba (3) 357 No data No data No data
Wiley Park (3) 93 No data No data No data
Sydney - Outer South West 1,045 771 274 35.5%
Camden 46 58 -12 -20.7%
Camden - Ellis Lane 4 19 -15 -78.9%
Elderslie - Harrington Park 22 23 -1 -4.3%
Mount Annan - Currans Hill 24 16 8 50.0%
Campbelltown 929 645 284 44.0%
Bradbury - Wedderburn 109 77 32 41.6%
Campbelltown - Woodbine 110 70 40 57.1%
Claymore - Eagle Vale - Raby 187 125 62 49.6%
Holsworthy Military Area 0 0 0 0.0%
Ingleburn - Denham Court 114 50 64 128.0%
Leumeah - Minto Heights 55 81 -26 -32.1%
20
Table 7: Homelessness estimates, by place of enumeration, by Statistical Area 2, Greater Western Sydney and comparative regions, 2011 – 2016 (continued)
All homeless persons, by place of enumeration, by Statistical Area 2, 2011-2016
SA4/SA3/SA2
2016 2011
Change 2011-2016 All homeless
persons All homeless
persons
no. no. no. %
Campbelltown (continued) 929 645 284 44.0%
Macquarie Fields - Glenfield 118 88 30 34.1%
Minto - St Andrews 99 82 17 20.7%
Rosemeadow - Glen Alpine 126 65 61 93.8%
Wollondilly 61 67 -6 -9.0%
Bargo 9 5 4 80.0%
Douglas Park - Appin 28 24 4 16.7%
Picton - Tahmoor - Buxton 11 25 -14 -56.0%
The Oaks - Oakdale 10 11 -1 -9.1%
Sydney - Outer West and Blue Mountains 1,223 1,002 221 22.1%
Blue Mountains 162 238 -76 -31.9%
Blackheath - Megalong Valley 34 0 34 -
Blaxland - Warrimoo - Lapstone 10 15 -5 -33.3%
Blue Mountains - North 0 0 0 0.0%
Katoomba - Leura 61 177 -116 -65.5%
Lawson - Hazelbrook - Linden 35 6 29 483.3%
Springwood - Winmalee 10 36 -26 -72.2%
Wentworth Falls 12 0 12 -
Blue Mountains - South 3 0 3 -
Blue Mountains - South 3 0 3 -
Penrith 603 416 187 45.0%
Cambridge Park 58 45 13 28.9%
Castlereagh - Cranebrook 112 60 52 86.7%
Emu Plains - Leonay 29 42 -13 -31.0%
Glenmore Park - Regentville 23 23 0 0.0%
Jamisontown - South Penrith 66 40 26 65.0%
Kingswood - Werrington 98 83 15 18.1%
Mulgoa - Luddenham - Orchard Hills 80 13 67 515.4%
Penrith 125 96 29 30.2%
Warragamba - Silverdale 3 0 3 -
Richmond - Windsor 187 189 -2 -1.1%
Richmond - Clarendon 87 108 -21 -19.4%
Windsor - Bligh Park 47 54 -7 -13.0%
Yarramundi - Londonderry 51 29 22 75.9%
St Marys 261 165 96 58.2%
Erskine Park 0 9 -9 -100.0%
St Clair 54 36 18 50.0%
Colyton - Oxley Park (4) 87 No data No data No data
St Marys - North St Marys (4) 126 No data No data No data

21
Table 7: Homelessness estimates, by place of enumeration, by Statistical Area 2, Greater Western Sydney and comparative regions, 2011 – 2016 (continued)
All homeless persons, by place of enumeration, by Statistical Area 2, 2011-2016
SA4/SA3/SA2
2016 2011
Change 2011-2016 All homeless
persons All homeless
persons
no. no. no. %
Sydney - Parramatta 4,347 2,137 2,210 103.4%
Auburn 1,726 628 1,098 174.8%
Homebush Bay - Silverwater 21 10 11 110.0%
Rookwood Cemetery 0 0 0 0.0%
Auburn - Central (5) 661 No data No data No data
Auburn - North (5) 524 No data No data No data
Auburn - South (5) 137 No data No data No data
Berala 125 No data No data No data
Lidcombe (5) 234 No data No data No data
Regents Park (5) 32 No data No data No data
Carlingford 165 71 94 132.4%
Carlingford 54 30 24 80.0%
Ermington - Rydalmere 55 17 38 223.5%
Oatlands - Dundas Valley 64 25 39 156.0%
Merrylands - Guildford 1,518 830 688 82.9%
Chester Hill - Sefton 121 139 -18 -12.9%
Fairfield - East 232 91 141 154.9%
Granville - Clyde 275 213 62 29.1%
Greystanes - Pemulwuy 47 34 13 38.2%
Guildford - South Granville 342 160 182 113.8%
Guildford West - Merrylands West 185 73 112 153.4%
Merrylands - Holroyd 308 115 193 167.8%
Smithfield Industrial 0 0 0 0.0%
Yennora Industrial 0 0 0 0.0%
Parramatta 926 613 313 51.1%
North Parramatta 146 115 31 27.0%
North Rocks 0 4 -4 -100.0%
Northmead 72 55 17 30.9%
Parramatta - Rosehill 362 218 144 66.1%
Toongabbie - Constitution Hill 67 33 34 103.0%
Winston Hills 3 15 -12 -80.0%
Pendle Hill - Girraween (6) 159 No data No data No data
Wentworthville - Westmead (6) 116 No data No data No data
Sydney - South West 3,071 2,100 971 46.2%
Bringelly - Green Valley 467 286 181 63.3%
Ashcroft - Busby - Miller 256 140 116 82.9%
Austral - Greendale 37 24 13 54.2%
Cobbitty - Leppington 43 35 8 22.9%
Badgerys Creek 0 No data No data No data
Cecil Hills 13 No data No data No data
22
Table 7: Homelessness estimates, by place of enumeration, by Statistical Area 2, Greater Western Sydney and comparative regions, 2011 – 2016 (continued)
All homeless persons, by place of enumeration, by Statistical Area 2, 2011-2016
SA4/SA3/SA2
2016 2011
Change 2011-2016 All homeless
persons All homeless
persons
no. no. no. %
Bringelly - Green Valley (continued) 467 286 181 63.3%
Green Valley 55 No data No data No data
Hinchinbrook 26 No data No data No data
Hoxton Park - Carnes Hill - Horningsea Park (7) 27 No data No data No data
West Hoxton - Middleton Grange (7) 4 No data No data No data
Fairfield 2,003 1,304 699 53.6%
Bonnyrigg Heights - Bonnyrigg 138 107 31 29.0%
Bossley Park - Abbotsbury 153 84 69 82.1%
Cabramatta - Lansvale 451 148 303 204.7%
Cabramatta West - Mount Pritchard 169 111 58 52.3%
Canley Vale - Canley Heights 248 156 92 59.0%
Edensor Park 50 34 16 47.1%
Fairfield 273 252 21 8.3%
Fairfield - West 182 204 -22 -10.8%
Greenfield Park - Prairiewood 55 32 23 71.9%
Horsley Park - Kemps Creek 21 9 12 133.3%
Smithfield - Wetherill Park 188 126 62 49.2%
St Johns Park - Wakeley 69 42 27 64.3%
Wetherill Park Industrial 0 0 0 0.0%
Liverpool 603 515 88 17.1%
Casula 60 68 -8 -11.8%
Chipping Norton - Moorebank 46 36 10 27.8%
Holsworthy - Wattle Grove 21 9 12 133.3%
Liverpool (8) 306 No data No data No data
Lurnea - Cartwright (8) 69 No data No data No data
Prestons - Edmondson Park (8) 59 No data No data No data
Warwick Farm (8) 38 No data No data No data
Greater Western Sydney (total SA4s) 15,333 9,902 5,431 54.8%
Greater Sydney (total SA4s) 27,974 10,521 5,563 52.9%
New South Wales 37,692 27,483 10,209 37.1%
Australia 116,427 102,439 13,988 13.7% Source: ABS Census of Population and Housing, 2011, 2016 - Estimating Homelessness (Cat No 2049.0) Please note:
(1) 2011 statistics were collected for combined SA2 area Quakers Hill-Acacia Gardens, which was 66 persons. (2) 2011 statistics were collected for Bankstown SA2, which was 158 persons. (3) 2011 statistics were collected for combined Lakemba-Wiley Park SA2 area, which was 165 persons. (4) 2011 statistics were collected for St Marys - Colyton area, which was 119 persons. (5) 2011 statistics were collected as Auburn SA2 total and Lidcombe -Regents Park SA2, which was 478 and 145 persons respectively. (6) 2011 statistics were collected as Giraween-Westmead SA2, which was 170 persons respectively. (7) 2011 statistics were collected as Green Valley-Cecil Hills and Hoxton Park-Horningsea Park SA2s, which was 70 and 26 persons
respectively. (8) 2011 statistics were collected as Liverpool-Warwick Farm and Prestons-Lurmea SA2s, which was 254 and 147 persons respectively.

23
Mapping homelessness in Greater Sydney The following section presents a range of maps showing estimates of homelessness in Greater Sydney, with a focus on the GWS region, and focusing on LGA and SA2 level. The maps show that the highest numbers of homeless people in Greater Sydney in 2016 tended to be concentrated in the inner west and inner city regions, although notable populations were also found in Cumberland and Canterbury – Bankstown LGAs in the western and south-western regions. There are several reasons why homeless people may be attracted to inner city areas including warmer coastal climates, perceived availability of more work and life opportunities, and easier access to a range of specialist homelessness services and transport systems (Robinson 2002; Wood et al 2014). It is important to note that every person’s pathway to homelessness, regardless of their location, is different and unique, hence compounding factors also need to be considered. Common compounding factors include domestic violence, family breakdown, unemployment and socioeconomic disadvantage, cost of living, mental illness, drug and alcohol abuse, disability, social exclusion and lack of access to support services (D’Souza et al 2013; Robinson & Searby 2006). Homeless populations are also mobile and transient, hence local numbers will inevitably fluctuate over time and seasons. While numbers of homeless people continue to rise in the inner city, this paper has highlighted that homelessness has continued to increase in the GWS region over the last five years. The greatest increases were reported in the south west of GWS, although some LGAs in the west of the region (such as Penrith LGA) also experienced notable growth since 2011. More research needs to be done to identify the unique causes of local homelessness in these areas and the factors driving its growth. With this in mind, addressing homelessness in the GWS region and beyond will require bold responses from a range of stakeholders now and in the future.

24
Map 3: Total homeless persons (number) by LGA, Greater Sydney, 2016

25
Map 4: Homelessness rates by LGA, Greater Sydney, 2016

26
Map 5: 5 year homeless population change (number) by LGA, Greater Sydney, 2016

27
Map 6: 5 year homeless population change (percentage) by LGA, Greater Sydney, 2016

28
Map 7: Total homeless persons (number) by SA2, Greater Sydney, 2016

29
Key references on homelessness The information sourced in this paper is from the following publications on the ABS website (www.abs.gov.au):
• ABS Information Paper – Census of Population and Housing: Estimating Homelessness, 2016 [Cat. No. 2049.0]
• ABS Information Paper – A Statistical Definition of Homelessness, 2012 [Cat. No. 4922.0]
• ABS Information Paper – Methodology for Estimating Homelessness from the Census of Population and Housing, 2012 [Cat. No. 2049.0.55.001]
Other references used throughout this paper include:
• D’Souza, G., Tanton, R., Abello, A., Mohanty, I. & Thurect, L. 2013, Geographical Analysis of the Risk of Homelessness, National Centre for Social and Economic Modelling (NATSEM) University of Canberra, accessed June 2018, https://bit.ly/2JPYJeP
• Robinson, C. 2002, Being somewhere: young homeless people in inner-city Sydney, PhD thesis, University of New South Wales, accessed June 2018, http://bit.ly/1KUEDYV
• Robinson, C. & Searby, R. 2006, Accommodation in Crisis: Forgotten Women in Western Sydney, University of Technology Sydney, accessed June 2018, https://bit.ly/2MB6keQ
• Wood, G., Batterham, D., Cigdem, M. & Mallett, S. 2014, The spatial dynamics of homelessness in Australia 2001–2011, AHURI Final Report No.227, RMIT Australian Housing and Urban Research Institute, Melbourne, accessed June 2018, http://bit.ly/1IhpOus
The following homelessness research publications have recently been released, and may also be of interest:
• Australian Homelessness Monitor 2018 (Launch Housing)
• The State of Homelessness in Australian Cities (Centre for Social Impact)
• Perceptions of Homelessness in Australia 2018 (Wesley Mission)

30
Appendices Appendix A: Homelessness estimates, rates and 5 year change, Greater Western Sydney LGAs and comparative regions, 2016 (expanded table)
Source: ABS Census of Population and Housing, 2011, 2016 - Estimating Homelessness (Cat No 2049.0) and ABS QuickStats 2011, 2016 *2011 GWS homelessness estimate includes Auburn (628 persons) and Holroyd LGAs (425 persons).
All homeless
persons (no.)
Usual residence
population (2016)
% of area
population
Rate per
10,000
% of GWS
homeless
% of Greater
Sydney homeless
All homeless
persons (no.)
Usual residence
population (2016)
% of area
population
Rate per
10,000
% of GWS
homeless
% of Greater
Sydney homeless No %
Blacktown 1,534 336,962 0.5% 45.5 10.8% 5.5% 1,400 301,099 0.5% 46.5 15.6% 7.4% 134 9.6%
Blue Mountains 170 76,904 0.2% 22.1 1.2% 0.6% 238 75,942 0.3% 31.3 2.7% 1.3% -68 -28.6%
Camden 96 78,218 0.1% 12.3 0.7% 0.3% 86 56,720 0.2% 15.2 1.0% 0.5% 10 11.6%
Campbelltown 928 157,006 0.6% 59.1 6.6% 3.3% 644 145,967 0.4% 44.1 7.2% 3.4% 284 44.1%
Canterbury-Bankstown 2,582 346,302 0.7% 74.6 18.3% 9.2% 1,496 319,806 0.5% 46.8 16.7% 7.9% 1,086 72.6%
Cumberland 3,129 216,079 1.4% 144.8 22.1% 11.2% N/A N/A N/A N/A N/A N/A N/A N/A
Fairfield 2,226 198,817 1.1% 112.0 15.7% 8.0% 1,384 187,766 0.7% 73.7 15.4% 7.3% 842 60.8%
Hawkesbury 231 64,592 0.4% 35.8 1.6% 0.8% 199 62,353 0.3% 31.9 2.2% 1.0% 32 16.1%
Lithgow 60 21,090 0.3% 28.4 N/A 0.2% 36 20,160 0.2% 17.9 0.4% 0.2% 24 66.7%
Liverpool 1,058 204,326 0.5% 51.8 7.5% 3.8% 778 180,143 0.4% 43.2 8.7% 4.1% 280 36.0%
Parramatta 987 226,149 0.4% 43.6 7.0% 3.5% 804 166,858 0.5% 48.2 9.0% 4.2% 183 22.8%
Penrith 890 196,066 0.5% 45.4 6.3% 3.2% 607 178,467 0.3% 34.0 6.8% 3.2% 283 46.6%
The Hills Shire 251 157,243 0.2% 16.0 1.8% 0.9% 204 169,872 0.1% 12.0 2.3% 1.1% 47 23.0%
Wingecarribee 92 47,882 0.2% 19.2 N/A 0.3% 84 44,395 0.2% 18.9 0.9% 0.4% 8 9.5%
Wollondilly 65 48,519 0.1% 13.4 0.5% 0.2% 71 43,259 0.2% 16.4 0.8% 0.4% -6 -8.5%
City of Sydney 5,061 208,374 2.4% 242.9 N/A 18.1% 3,037 169,505 1.8% 179.2 N/A 16.0% 2,024 66.6%
Greater Western Sydney (total LGAs)* 14,147 2,307,183 0.6% 61.3 N/A 50.6% 8,964 2,061,153 0.4% 43.5 N/A 47.3% 5,183 57.8%
Greater Sydney (total LGAs) 27,963 4,496,196 0.6% 62.2 N/A 100.0% 18,955 4,079,446 0.5% 46.5 N/A 100.0% 9,008 47.5%
New South Wales 37,692 7,480,228 0.5% 50.4 N/A N/A 27,483 6,917,658 0.4% 39.7 N/A N/A 10,209 37.1%
Australia 116,427 23,401,892 0.5% 49.8 N/A N/A 102,439 21,507,717 0.5% 47.6 N/A N/A 13,988 13.7%
LGA
Homeless
change 2011-16
Homelessness estimates, Greater Western Sydney LGAs and comparative regions, 2011-2016
2016 2011
31
Appendix B: Homeless operational groups and other marginalised housing (number), by place of enumeration, by Statistical Area 3 and 4, Greater Western Sydney and comparative regions, 2016
Source: ABS Census of Population and Housing, 2016 - Estimating Homelessness (Cat No 2049.0)
Persons living in
improvised
dwellings, tents,
or sleeping out
Persons in
supported
accommodation
for the homeless
Persons staying
temporarily with
other
households
Persons living in
boarding houses
Persons in other
temporary
lodgings
Persons living in
'severely'
crowded
dwellings
All homeless
persons
Persons living
in other
crowded
dwellings
Persons in
other
improvised
dwellings
Persons who
are marginally
housed in
caravan parks
no. no. no. no. no. no. no. no. no. no.
Sydney - Baulkham Hills and Hawkesbury 9 18 95 8 0 249 383 428 69 77
Baulkham Hills 0 18 49 8 0 135 209 234 7 0
Dural - Wisemans Ferry 3 0 22 0 0 49 71 77 22 19
Hawkesbury 5 0 20 0 0 60 80 44 19 33
Rouse Hill - McGraths Hill 7 0 15 0 0 3 19 79 20 23
Sydney - Blacktown 77 217 196 39 0 1,028 1,554 2,278 83 68
Blacktown 27 126 79 23 0 529 791 944 40 0
Blacktown - North 4 17 16 7 0 103 153 218 3 68
Mount Druitt 44 71 98 5 0 401 614 1,122 43 0
Sydney - Inner South West 18 294 274 388 8 2,730 3,710 5,634 5 10
Bankstown 3 76 82 105 8 781 1,049 1,590 4 3
Canterbury 0 100 54 157 0 984 1,295 1,810 0 0
Sydney - Outer South West 15 373 198 33 3 421 1,045 930 51 50
Camden 0 8 24 0 0 19 46 68 8 8
Campbelltown 9 360 150 33 7 373 929 786 17 7
Wollondilly 8 3 23 0 0 25 61 76 25 36
Sydney - Outer West and Blue Mountains 63 473 211 44 8 426 1,223 723 68 26
Blue Mountains 19 82 41 11 4 11 162 94 13 0
Blue Mountains - South 3 0 0 0 0 0 3 0 0 0
Penrith 24 250 107 18 0 197 603 215 39 26
Richmond - Windsor 12 84 26 0 0 67 187 127 3 0
St Marys 4 57 39 15 0 153 261 291 7 0
Sydney - Parramatta 72 441 225 299 0 3,299 4,347 5,474 44 4
Auburn 8 24 50 142 0 1,502 1,726 2,289 17 0
Carlingford 0 41 33 0 0 93 165 146 0 0
Merrylands - Guildford 39 201 84 71 0 1,123 1,518 1,996 25 0
Parramatta 23 176 62 86 0 579 926 1,042 0 4
Sydney - South West 53 696 210 27 3 2,085 3,071 4,283 94 29
Bringelly - Green Valley 8 113 47 0 0 294 467 625 33 0
Fairfield 40 288 92 27 0 1,554 2,003 2,885 58 29
Liverpool 4 294 70 0 3 234 603 771 4 0
Greater Western Sydney (total SA4s) 307 2,512 1,409 838 22 10,238 15,333 19,750 414 264
Greater Sydney (total SA4s) 1,125 3,748 2,420 5,645 61 14,979 27,974 27,647 481 363
New South Wales 2,584 5,843 5,366 6,853 220 16,821 37,692 32,512 1,763 3,000
Australia 8,200 21,235 17,725 17,503 678 51,088 116,427 80,908 5,404 10,685
Homeless operational group (numbers), by place of enumeration, by Statistical Area 3 and 4, 2016 Other marginal housing
SA4/SA3

32
Appendix C: Homeless operational groups and other marginalised housing (percentage), by place of enumeration, by Statistical Area 3 and 4, Greater Western Sydney and comparative regions, 2016
Source: ABS Census of Population and Housing, 2016 - Estimating Homelessness (Cat No 2049.0)
Persons living in
improvised
dwellings, tents,
or sleeping out
Persons in
supported
accommodation
for the homeless
Persons staying
temporarily with
other
households
Persons living in
boarding houses
Persons in other
temporary
lodgings
Persons living in
'severely'
crowded
dwellings
All homeless
persons
Persons living
in other
crowded
dwellings
Persons in
other
improvised
dwellings
Persons who
are marginally
housed in
caravan parks
no. no. no. no. no. no. no. no. no. no.
Sydney - Baulkham Hills and Hawkesbury 2.3% 4.7% 24.8% 2.1% 0.0% 65.0% 100.0% 74.6% 12.0% 13.4%
Baulkham Hills 0.0% 8.6% 23.4% 3.8% 0.0% 64.6% 100.0% 97.1% 2.9% 0.0%
Dural - Wisemans Ferry 4.2% 0.0% 31.0% 0.0% 0.0% 69.0% 100.0% 65.3% 18.6% 16.1%
Hawkesbury 6.3% 0.0% 25.0% 0.0% 0.0% 75.0% 100.0% 45.8% 19.8% 34.4%
Rouse Hill - McGraths Hill 36.8% 0.0% 78.9% 0.0% 0.0% 15.8% 100.0% 64.8% 16.4% 18.9%
Sydney - Blacktown 5.0% 14.0% 12.6% 2.5% 0.0% 66.2% 100.0% 93.8% 3.4% 2.8%
Blacktown 3.4% 15.9% 10.0% 2.9% 0.0% 66.9% 100.0% 95.9% 4.1% 0.0%
Blacktown - North 2.6% 11.1% 10.5% 4.6% 0.0% 67.3% 100.0% 75.4% 1.0% 23.5%
Mount Druitt 7.2% 11.6% 16.0% 0.8% 0.0% 65.3% 100.0% 96.3% 3.7% 0.0%
Sydney - Inner South West 0.5% 7.9% 7.4% 10.5% 0.2% 73.6% 100.0% 99.7% 0.1% 0.2%
Bankstown 0.3% 7.2% 7.8% 10.0% 0.8% 74.5% 100.0% 99.6% 0.3% 0.2%
Canterbury 0.0% 7.7% 4.2% 12.1% 0.0% 76.0% 100.0% 100.0% 0.0% 0.0%
Sydney - Outer South West 1.4% 35.7% 18.9% 3.2% 0.3% 40.3% 100.0% 90.2% 4.9% 4.8%
Camden 0.0% 17.4% 52.2% 0.0% 0.0% 41.3% 100.0% 81.0% 9.5% 9.5%
Campbelltown 1.0% 38.8% 16.1% 3.6% 0.8% 40.2% 100.0% 97.0% 2.1% 0.9%
Wollondilly 13.1% 4.9% 37.7% 0.0% 0.0% 41.0% 100.0% 55.5% 18.2% 26.3%
Sydney - Outer West and Blue Mountains 5.2% 38.7% 17.3% 3.6% 0.7% 34.8% 100.0% 88.5% 8.3% 3.2%
Blue Mountains 11.7% 50.6% 25.3% 6.8% 2.5% 6.8% 100.0% 87.9% 12.1% 0.0%
Blue Mountains - South 100.0% 0.0% 0.0% 0.0% 0.0% 0.0% 100.0% 0.0% 0.0% 0.0%
Penrith 4.0% 41.5% 17.7% 3.0% 0.0% 32.7% 100.0% 76.8% 13.9% 9.3%
Richmond - Windsor 6.4% 44.9% 13.9% 0.0% 0.0% 35.8% 100.0% 97.7% 2.3% 0.0%
St Marys 1.5% 21.8% 14.9% 5.7% 0.0% 58.6% 100.0% 97.7% 2.3% 0.0%
Sydney - Parramatta 1.7% 10.1% 5.2% 6.9% 0.0% 75.9% 100.0% 99.1% 0.8% 0.1%
Auburn 0.5% 1.4% 2.9% 8.2% 0.0% 87.0% 100.0% 99.3% 0.7% 0.0%
Carlingford 0.0% 24.8% 20.0% 0.0% 0.0% 56.4% 100.0% 100.0% 0.0% 0.0%
Merrylands - Guildford 2.6% 13.2% 5.5% 4.7% 0.0% 74.0% 100.0% 98.8% 1.2% 0.0%
Parramatta 2.5% 19.0% 6.7% 9.3% 0.0% 62.5% 100.0% 99.6% 0.0% 0.4%
Sydney - South West 1.7% 22.7% 6.8% 0.9% 0.1% 67.9% 100.0% 97.2% 2.1% 0.7%
Bringelly - Green Valley 1.7% 24.2% 10.1% 0.0% 0.0% 63.0% 100.0% 95.0% 5.0% 0.0%
Fairfield 2.0% 14.4% 4.6% 1.3% 0.0% 77.6% 100.0% 97.1% 2.0% 1.0%
Liverpool 0.7% 48.8% 11.6% 0.0% 0.5% 38.8% 100.0% 99.5% 0.5% 0.0%
Greater Western Sydney (total SA4s) 2.0% 16.4% 9.2% 5.5% 0.1% 66.8% 100.0% 96.7% 2.0% 1.3%
Greater Sydney (total SA4s) 4.0% 13.4% 8.7% 20.2% 0.2% 53.5% 100.0% 97.0% 1.7% 1.3%
New South Wales 6.9% 15.5% 14.2% 18.2% 0.6% 44.6% 100.0% 87.2% 4.7% 8.0%
Australia 7.0% 18.2% 15.2% 15.0% 0.6% 43.9% 100.0% 83.4% 5.6% 11.0%
Homeless operational group (percentage), by place of enumeration, by Statistical Area 3 and 4, 2016 Other marginal housing
SA4/SA3

33
Appendix D: Homeless operational groups and other marginalised housing (5 year change number), by place of enumeration, by Statistical Area 3 and 4, Greater Western Sydney and comparative regions, 2011 – 2016
Source: ABS Census of Population and Housing, 2011, 2016 - Estimating Homelessness (Cat No 2049.0)
Persons living in
improvised
dwellings, tents,
or sleeping out
Persons in
supported
accommodation
for the homeless
Persons staying
temporarily with
other
households
Persons living in
boarding houses
Persons in other
temporary
lodgings
Persons living in
'severely'
crowded
dwellings
All homeless
persons
Persons living
in other
crowded
dwellings
Persons in
other
improvised
dwellings
Persons who
are marginally
housed in
caravan parks
no. no. no. no. no. no. no. no. no. no.
Sydney - Baulkham Hills and Hawkesbury 1 -7 7 5 0 139 146 98 34 -5
Baulkham Hills 0 -7 4 8 0 71 73 79 7 0
Dural - Wisemans Ferry 0 0 0 -3 0 37 31 37 1 1
Hawkesbury 0 0 10 0 0 48 50 -30 7 -15
Rouse Hill - McGraths Hill 7 0 8 0 0 -14 -10 21 20 2
Sydney - Blacktown 66 57 -7 -5 -8 46 154 569 68 -44
Blacktown 27 27 7 -20 0 171 218 317 40 0
Blacktown - North 1 7 -20 7 0 22 13 43 -14 -44
Mount Druitt 44 20 12 -1 -7 -140 -76 216 40 0
Sydney - Inner South West 6 119 -20 70 2 1,285 1,455 2,011 -21 -50
Bankstown -5 21 -24 12 -3 407 407 314 -18 -21
Canterbury 0 62 -8 50 0 524 636 661 0 0
Sydney - Outer South West -1 235 26 24 0 -10 274 81 19 -19
Camden 0 4 0 0 0 -9 -12 35 8 4
Campbelltown 3 229 24 24 4 1 284 64 14 -6
Wollondilly 0 3 -4 0 0 -9 -6 -19 -7 -17
Sydney - Outer West and Blue Mountains -53 204 -70 -6 -5 161 221 113 45 0
Blue Mountains -16 42 -8 -17 -9 -61 -76 52 10 -4
Blue Mountains - South 3 0 0 0 0 0 3 0 0 0
Penrith -21 126 -37 14 0 112 187 -8 19 6
Richmond - Windsor -26 3 -17 0 0 50 -2 47 0 0
St Marys 4 33 2 1 0 62 96 21 7 0
Sydney - Parramatta -9 185 30 172 -12 1,835 2,210 2,009 17 4
Auburn -8 -9 16 115 0 981 1,098 1,140 17 0
Carlingford 0 29 -1 0 0 65 94 30 0 0
Merrylands - Guildford 29 124 28 31 0 479 688 557 -5 0
Parramatta -33 37 -11 22 -12 313 313 283 0 4
Sydney - South West 30 366 23 -12 3 563 971 1,485 94 -6
Bringelly - Green Valley 1 69 -12 0 0 113 181 188 33 0
Fairfield 37 119 29 -6 0 523 699 1,038 58 -6
Liverpool -11 178 2 -8 3 -77 88 265 4 0
Greater Western Sydney (total SA4s) 40 1,159 -11 248 -20 4,019 5,431 6,366 256 -120
Greater Sydney (total SA4s) 220 723 -205 890 -39 5,330 6,903 6,962 303 -150
New South Wales 664 922 420 1,055 -22 7,166 10,209 10,374 767 -787
Australia 1,390 -23 351 2,559 -4 9,718 13,988 20,030 895 -2,272
Homeless operational group (5 year change number), by place of enumeration, by Statistical Area 3 and 4, 2011-2016 Other marginal housing
SA4/SA3

34
Appendix E: Homeless operational groups and other marginalised housing (5 year change percentage), by place of enumeration, by Statistical Area 3 and 4, Greater Western Sydney and comparative regions, 2011 – 2016
Source: ABS Census of Population and Housing, 2011, 2016 - Estimating Homelessness (Cat No 2049.0)
Persons living in
improvised
dwellings, tents,
or sleeping out
Persons in
supported
accommodation
for the homeless
Persons staying
temporarily with
other
households
Persons living in
boarding houses
Persons in other
temporary
lodgings
Persons living in
'severely'
crowded
dwellings
All homeless
persons
Persons living
in other
crowded
dwellings
Persons in
other
improvised
dwellings
Persons who
are marginally
housed in
caravan parks
no. no. no. no. no. no. no. no. no. no.
Sydney - Baulkham Hills and Hawkesbury 12.5% -28.0% 8.0% 166.7% 0.0% 126.4% 61.6% 29.7% 97.1% -6.1%
Baulkham Hills 0.0% -28.0% 8.9% 0.0% 0.0% 110.9% 53.7% 51.0% 0.0% 0.0%
Dural - Wisemans Ferry 0.0% 0.0% 0.0% -100.0% 0.0% 308.3% 77.5% 92.5% 4.8% 5.6%
Hawkesbury 0.0% 0.0% 100.0% 0.0% 0.0% 400.0% 166.7% -40.5% 58.3% -31.3%
Rouse Hill - McGraths Hill 0.0% 0.0% 114.3% 0.0% 0.0% -82.4% -34.5% 36.2% 0.0% 9.5%
Sydney - Blacktown 600.0% 35.6% -3.4% -11.4% -100.0% 4.7% 11.0% 33.3% 453.3% -39.3%
Blacktown 0.0% 27.3% 9.7% -46.5% 0.0% 47.8% 38.0% 50.6% 0.0% 0.0%
Blacktown - North 33.3% 70.0% -55.6% 0.0% 0.0% 27.2% 9.3% 24.6% -82.4% -39.3%
Mount Druitt 0.0% 39.2% 14.0% -16.7% -100.0% -25.9% -11.0% 23.8% 1333.3% 0.0%
Sydney - Inner South West 50.0% 68.0% -6.8% 22.0% 33.3% 88.9% 64.5% 55.5% -80.8% -83.3%
Bankstown -62.5% 38.2% -22.6% 12.9% -27.3% 108.8% 63.4% 24.6% -81.8% -87.5%
Canterbury 0.0% 163.2% -12.9% 46.7% 0.0% 113.9% 96.5% 57.5% 0.0% 0.0%
Sydney - Outer South West -6.3% 170.3% 15.1% 266.7% 0.0% -2.3% 35.5% 9.5% 59.4% -27.5%
Camden 0.0% 100.0% 0.0% 0.0% 0.0% -32.1% -20.7% 106.1% 0.0% 100.0%
Campbelltown 50.0% 174.8% 19.0% 266.7% 133.3% 0.3% 44.0% 8.9% 466.7% -46.2%
Wollondilly 0.0% 0.0% -14.8% 0.0% 0.0% -26.5% -9.0% -20.0% -21.9% -32.1%
Sydney - Outer West and Blue Mountains -45.7% 75.8% -24.9% -12.0% -38.5% 60.8% 22.1% 18.5% 195.7% 0.0%
Blue Mountains -45.7% 105.0% -16.3% -60.7% -69.2% -84.7% -31.9% 123.8% 333.3% -100.0%
Blue Mountains - South 0.0% 0.0% 0.0% 0.0% 0.0% 0.0% 0.0% 0.0% 0.0% 0.0%
Penrith -46.7% 101.6% -25.7% 350.0% 0.0% 131.8% 45.0% -3.6% 95.0% 30.0%
Richmond - Windsor -68.4% 3.7% -39.5% 0.0% 0.0% 294.1% -1.1% 58.8% 0.0% 0.0%
St Marys 0.0% 137.5% 5.4% 7.1% 0.0% 68.1% 58.2% 7.8% 0.0% 0.0%
Sydney - Parramatta -11.1% 72.3% 15.4% 135.4% -100.0% 125.3% 103.4% 58.0% 63.0% 0.0%
Auburn -50.0% -27.3% 47.1% 425.9% 0.0% 188.3% 174.8% 99.2% 0.0% 0.0%
Carlingford 0.0% 241.7% -2.9% 0.0% 0.0% 232.1% 132.4% 25.9% 0.0% 0.0%
Merrylands - Guildford 290.0% 161.0% 50.0% 77.5% 0.0% 74.4% 82.9% 38.7% -16.7% 0.0%
Parramatta -58.9% 26.6% -15.1% 34.4% -100.0% 117.7% 51.1% 37.3% 0.0% 0.0%
Sydney - South West 130.4% 110.9% 12.3% -30.8% 0.0% 37.0% 46.2% 53.1% 0.0% -17.1%
Bringelly - Green Valley 14.3% 156.8% -20.3% 0.0% 0.0% 62.4% 63.3% 43.0% 0.0% 0.0%
Fairfield 1233.3% 70.4% 46.0% -18.2% 0.0% 50.7% 53.6% 56.2% 0.0% -17.1%
Liverpool -73.3% 153.4% 2.9% -100.0% 0.0% -24.8% 17.1% 52.4% 0.0% 0.0%
Greater Western Sydney (total SA4s) 15.0% 85.7% -0.8% 42.0% -47.6% 64.6% 54.8% 47.6% 162.0% -31.3%
Greater Sydney (total SA4s) 24.3% 23.9% -7.8% 18.7% -39.0% 55.2% 32.8% 33.7% 170.2% -29.2%
New South Wales 34.6% 18.7% 8.5% 18.2% -9.1% 74.2% 37.1% 46.9% 77.0% -20.8%
Australia 20.4% -0.1% 2.0% 17.1% -0.6% 23.5% 13.7% 32.9% 19.8% -17.5%
Homeless operational group (5 year change %), by place of enumeration, by Statistical Area 3 and 4, 2011-2016 Other marginal housing
SA4/SA3

35
Appendix E: Homeless operational groups and other marginalised housing (number), by place of enumeration, by Statistical Area 3 and 4, Greater Western Sydney and comparative regions, 2011
Source: ABS Census of Population and Housing, 2011, 2016 - Estimating Homelessness (Cat No 2049.0)
Persons living in
improvised
dwellings, tents,
or sleeping out
Persons in
supported
accommodation
for the homeless
Persons staying
temporarily with
other
households
Persons living in
boarding houses
Persons in other
temporary
lodgings
Persons living in
'severely'
crowded
dwellings
All homeless
persons
Persons living
in other
crowded
dwellings
Persons in
other
improvised
dwellings
Persons who
are marginally
housed in
caravan parks
no. no. no. no. no. no. no. no. no. no.
Sydney - Baulkham Hills and Hawkesbury 8 25 88 3 0 110 237 330 35 82
Baulkham Hills 0 25 45 0 0 64 136 155 0 0
Dural - Wisemans Ferry 3 0 22 3 0 12 40 40 21 18
Hawkesbury 5 0 10 0 0 12 30 74 12 48
Rouse Hill - McGraths Hill 0 0 7 0 0 17 29 58 0 21
Sydney - Blacktown 11 160 203 44 8 982 1,400 1,709 15 112
Blacktown 0 99 72 43 0 358 573 627 0 0
Blacktown - North 3 10 36 0 0 81 140 175 17 112
Mount Druitt 0 51 86 6 7 541 690 906 3 0
Sydney - Inner South West 12 175 294 318 6 1,445 2,255 3,623 26 60
Bankstown 8 55 106 93 11 374 642 1,276 22 24
Canterbury 0 38 62 107 0 460 659 1,149 0 0
Sydney - Outer South West 16 138 172 9 3 431 771 849 32 69
Camden 0 4 24 0 0 28 58 33 0 4
Campbelltown 6 131 126 9 3 372 645 722 3 13
Wollondilly 8 0 27 0 0 34 67 95 32 53
Sydney - Outer West and Blue Mountains 116 269 281 50 13 265 1,002 610 23 26
Blue Mountains 35 40 49 28 13 72 238 42 3 4
Blue Mountains - South 0 0 0 0 0 0 0 0 0 0
Penrith 45 124 144 4 0 85 416 223 20 20
Richmond - Windsor 38 81 43 0 0 17 189 80 3 0
St Marys 0 24 37 14 0 91 165 270 0 0
Sydney - Parramatta 81 256 195 127 12 1,464 2,137 3,465 27 0
Auburn 16 33 34 27 0 521 628 1,149 0 0
Carlingford 0 12 34 0 0 28 71 116 0 0
Merrylands - Guildford 10 77 56 40 0 644 830 1,439 30 0
Parramatta 56 139 73 64 12 266 613 759 0 0
Sydney - South West 23 330 187 39 0 1,522 2,100 2,798 0 35
Bringelly - Green Valley 7 44 59 0 0 181 286 437 0 0
Fairfield 3 169 63 33 0 1,031 1,304 1,847 0 35
Liverpool 15 116 68 8 0 311 515 506 0 0
Greater Western Sydney (total SA4s) 267 1,353 1,420 590 42 6,219 9,902 13,384 158 384
Greater Sydney (total SA4s) 905 3,025 2,625 4,755 100 9,649 21,071 20,685 178 513
New South Wales 1,920 4,921 4,946 5,798 242 9,655 27,483 22,138 996 3,787
Australia 6,810 21,258 17,374 14,944 682 41,370 102,439 60,878 4,509 12,957
Homeless operational group (numbers), by place of enumeration, by Statistical Area 3 and 4, 2011 Other marginal housing
SA4/SA3