Embed Size (px)
Citation preview
Estimating Future Costs of Estimating Future Costs of Power Plants with COPower Plants with CO22 CaptureCapture
Edward S. RubinDepartment of Engineering and Public Policy
Carnegie Mellon UniversityPittsburgh, Pennsylvania
Presentation toFifth Annual Conference on Carbon Capture & Sequestration
Alexandria, VirginiaMay 10, 2006
E.S. Rubin, Carnegie Mellon
AcknowledgementsAcknowledgements• Matt Antes• Sonia Yeh• Mike Berkenpas
• John Davison
• Dale Simbeck• Howard Herzog• Jon Gibbins• Keywan Riahi• Leo Schrattenholzer• Rodney Allem
• IEA GHG (John Davison)
• Co-Authors:
• Advisors:
Sponsor:
E.S. Rubin, Carnegie Mellon
Study ObjectiveStudy Objective
• Develop an empirically-based method to estimate future costs of power plants with CO2 capture, suitable for use in large-scale energy modeling, R&D planning, and other related efforts
E.S. Rubin, Carnegie Mellon
Two Approaches to Estimating Two Approaches to Estimating Future Technology CostsFuture Technology Costs
• Method 1: Engineering-Economic ModelingA “bottom up” approach based on engineering process models, informed by expert elicitations regarding potential improvements in key process parameters
• Method 2: Use of Historical Experience CurvesA “top down” approach based on use of mathematical “learning curves” or “experience curves” reflecting historical trends for analogous technologies or systems
This study employs the latter method
E.S. Rubin, Carnegie Mellon
Study ApproachStudy Approach
• Quantify historical learning rates of energy and environmental technologies relevant to power plants with CO2 capture
• Apply these results to leading plant design options to estimate learning rates and future plant costs
Note: This study does not include the costs of CO2 transport and storage technologies
E.S. Rubin, Carnegie Mellon
• Detailed report available from International Energy Agency Greenhouse Gas Programme(IEA GHG)

Retrospective Case StudiesRetrospective Case Studies
E.S. Rubin, Carnegie Mellon
E.S. Rubin, Carnegie Mellon
Case Study TechnologiesCase Study Technologies
• Flue gas desulfurization systems (FGD)
• Selective catalytic reduction systems (SCR)
• Gas turbine combined cycle system (GTCC)
• Pulverized coal-fired boilers (PC)
• Liquefied natural gas plants (LNG)
• Oxygen production plants (ASU)
• Hydrogen production plants (SMR)
E.S. Rubin, Carnegie Mellon
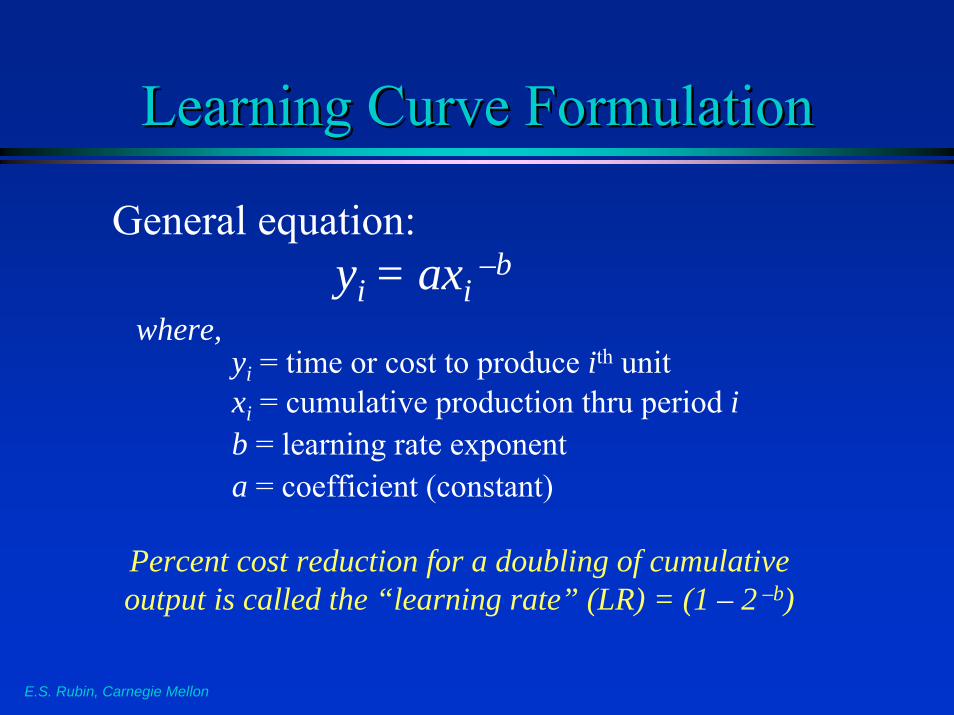
Learning Curve Formulation Learning Curve Formulation
where,yi = time or cost to produce ith unitxi = cumulative production thru period ib = learning rate exponenta = coefficient (constant)
General equation:yi = axi
–b
Percent cost reduction for a doubling of cumulative output is called the “learning rate” (LR) = (1 – 2 –b)
E.S. Rubin, Carnegie Mellon
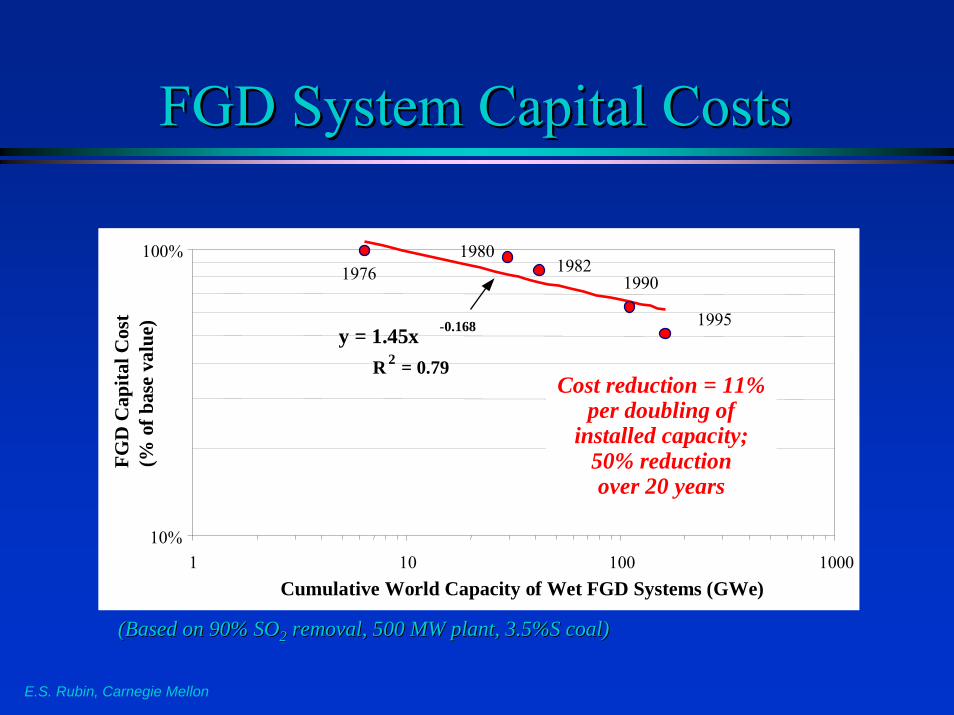
FGD System Capital CostsFGD System Capital Costs
(Based on 90% SO(Based on 90% SO22 removal, 500 MW plant, 3.5%S coal)removal, 500 MW plant, 3.5%S coal)
10%
100%
1 10 100 1000Cumulative World Capacity of Wet FGD Systems (GWe)
FGD
Cap
ital C
ost
(% o
f bas
e va
lue) y = 1.45x -0.168
R 2 = 0.79
19761980
19821990
1995
Cost reduction = 11%per doubling of
installed capacity;50% reductionover 20 years
10%
100%
1 10 100 1000Cumulative World Capacity of Wet FGD Systems (GWe)
FGD
Cap
ital C
ost
(% o
f bas
e va
lue) y = 1.45x -0.168
R 2 = 0.79
19761980
19821990
1995
Cost reduction = 11%per doubling of
installed capacity;50% reductionover 20 years
E.S. Rubin, Carnegie Mellon
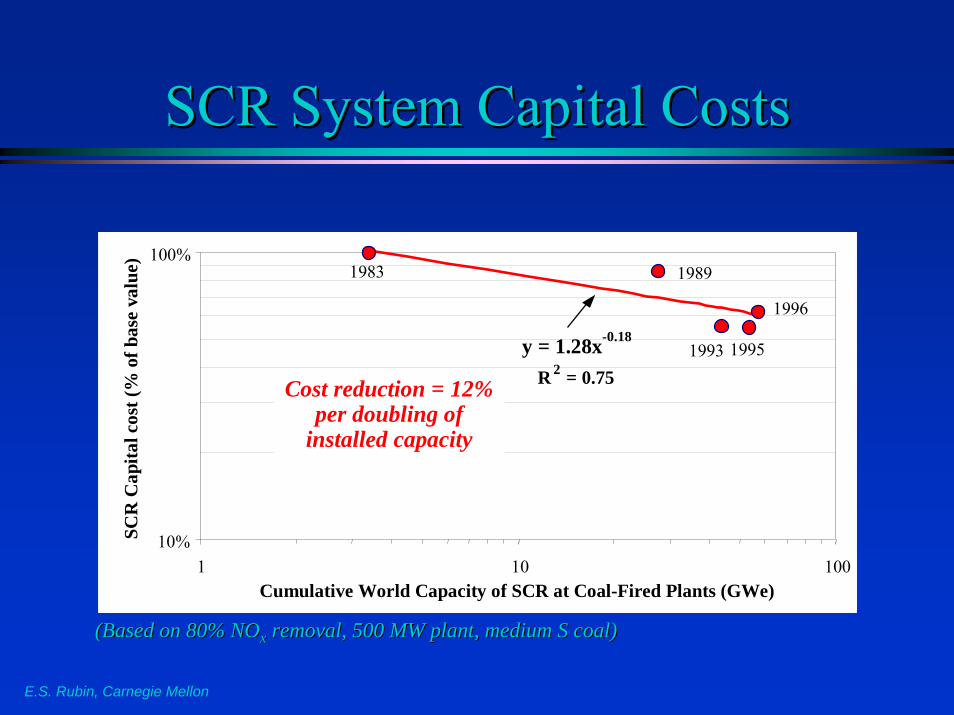
SCR System Capital CostsSCR System Capital Costs
(Based on 80% NO(Based on 80% NOxx removal, 500 MW plant, medium S coal)removal, 500 MW plant, medium S coal)
10%
100%
1 10 100Cumulative World Capacity of SCR at Coal-Fired Plants (GWe)
SCR
Cap
ital c
ost (
% o
f bas
e va
lue)
y = 1.28x-0.18
R 2 = 0.75
1983 1989
1996
19951993
Cost reduction = 12%per doubling of
installed capacity
10%
100%
1 10 100Cumulative World Capacity of SCR at Coal-Fired Plants (GWe)
SCR
Cap
ital c
ost (
% o
f bas
e va
lue)
y = 1.28x-0.18
R 2 = 0.75
1983 1989
1996
19951993
Cost reduction = 12%per doubling of
installed capacity
E.S. Rubin, Carnegie Mellon
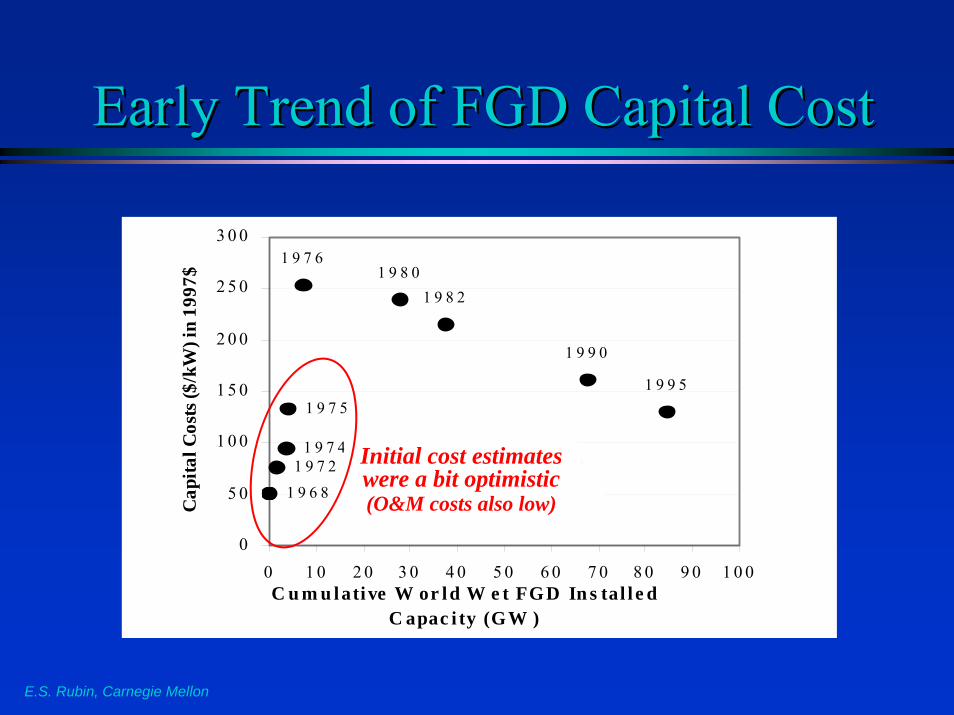
Early Trend of FGD Capital CostEarly Trend of FGD Capital Cost
1 9 6 81 9 7 2
1 9 7 4
1 9 7 5
1 9 7 61 9 8 0
1 9 8 2
1 9 9 0
1 9 9 5
0
5 0
1 0 0
1 5 0
2 0 0
2 5 0
3 0 0
0 1 0 2 0 3 0 4 0 5 0 6 0 7 0 8 0 9 0 1 0 0C u m u lative W or ld W e t FGD In s tal l e d
C apac i ty (GW )
Cap
ital C
osts
($/k
W) i
n 19
97$
( 1 0 0 0 M W , e f f = 8 0 - 9 0 % )
( 2 0 0 M W , e f f = 8 7 % )
Initial cost estimates were a bit optimistic (O&M costs also low)
E.S. Rubin, Carnegie Mellon
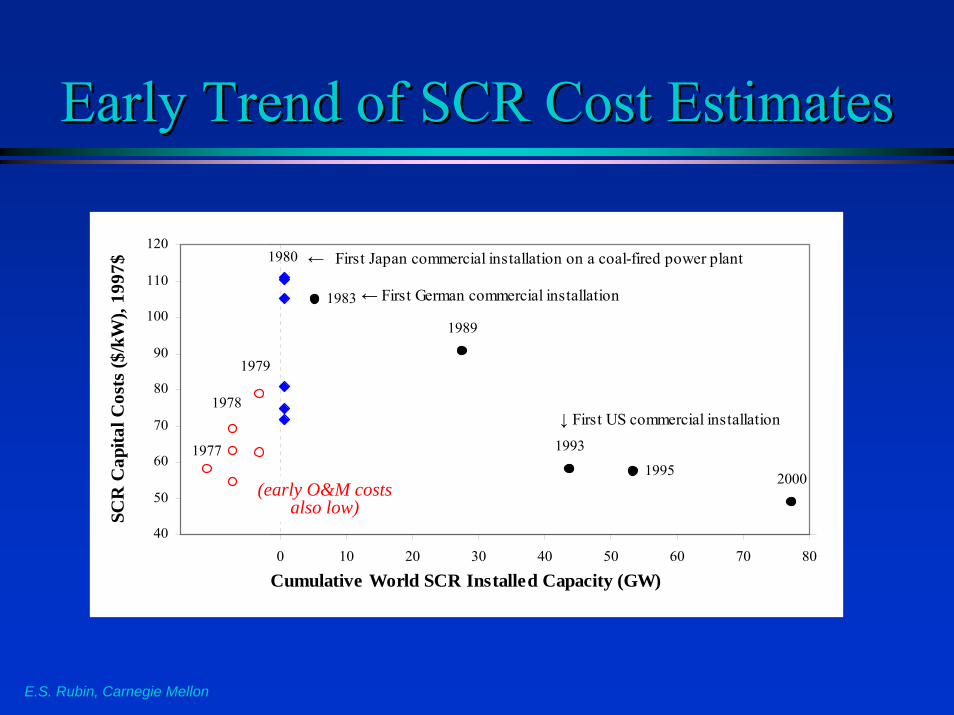
Early Trend of SCR Cost EstimatesEarly Trend of SCR Cost Estimates
1983
1989
1993
1995 2000
-20 -10 0 10 20 30 40 50 60 70 80
Cumulative World SCR Installed Capacity (GW)
SCR
Cap
ital C
osts
($/k
W),
1997
$ First Japan commercial installation on a coal-fired power plant
← First German commercial installation
↓ First US commercial installation
←
40
50
60
70
80
90
100
110
120
1977
1978
1979
1980
(early O&M costs also low)
E.S. Rubin, Carnegie Mellon
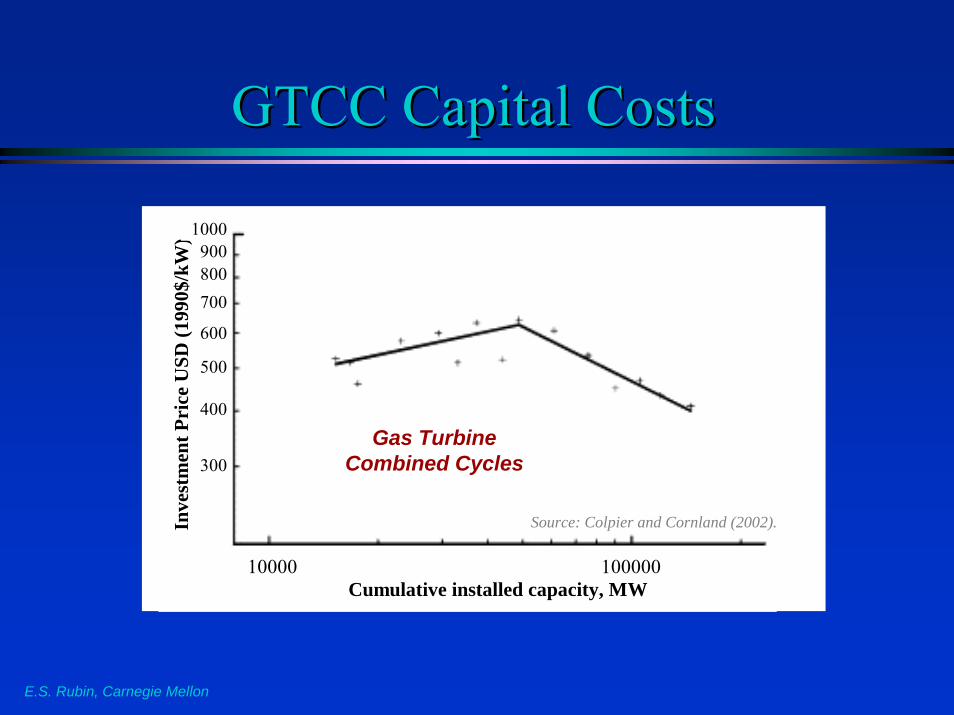
GTCC Capital CostsGTCC Capital Costs
PR~75% (1991-1997)
PR>100% (1981-1991)
Cumulative installed capacity, MW
Inve
stm
ent P
rice
USD
(199
0$/k
W)
10000 100000
300
400
500
600
700800900
1000
Gas Turbine Combined Cycles
Source: Colpier and Cornland (2002).
E.S. Rubin, Carnegie Mellon
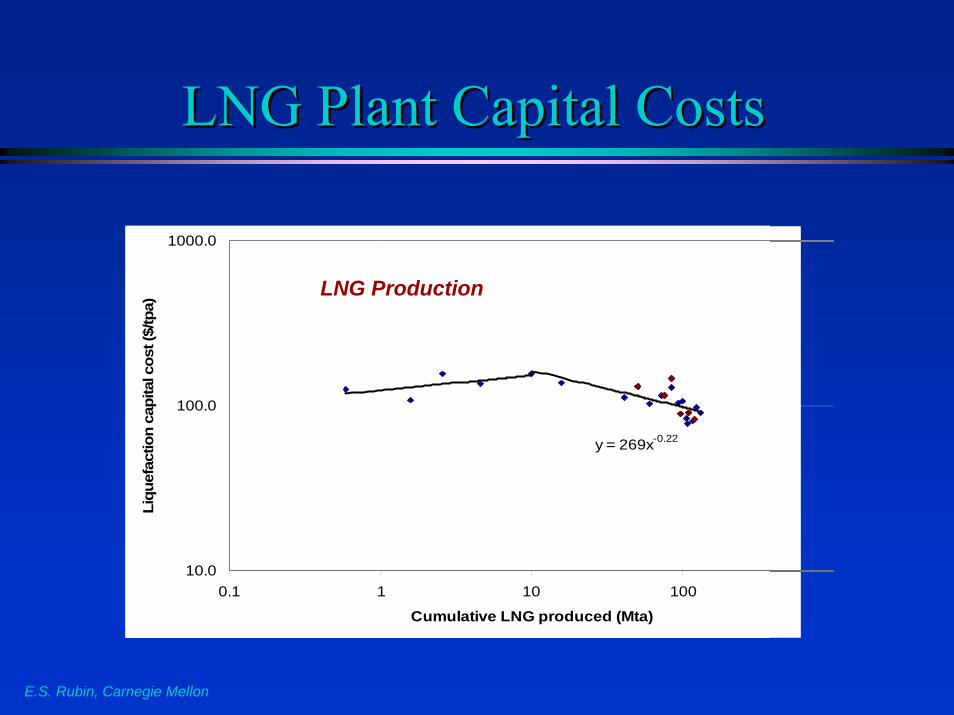
LNG Plant Capital CostsLNG Plant Capital Costs
y = 269x-0.22
R2 = 0.52
10.0
100.0
1000.0
0.1 1 10 100
Cumulative LNG produced (Mta)
Liqu
efac
tion
capi
tal c
ost (
$/tp
a)
Actual liquefaction unit costTheoretical liquefaction unit costLNG Production
y = 269x-0.22
R2 = 0.52
10.0
100.0
1000.0
0.1 1 10 100
Cumulative LNG produced (Mta)
Liqu
efac
tion
capi
tal c
ost (
$/tp
a)
Actual liquefaction unit costTheoretical liquefaction unit costLNG Production
E.S. Rubin, Carnegie Mellon
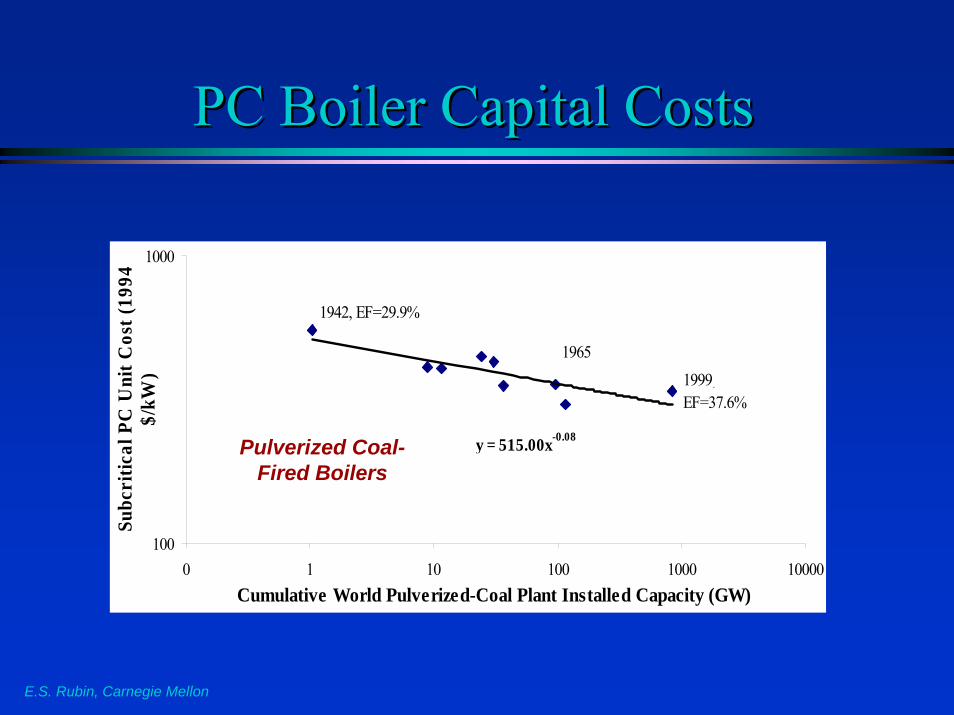
PC Boiler Capital CostsPC Boiler Capital Costs
y = 515.00x-0.08
PR = 0.95
100
1000
0 1 10 100 1000 10000Cumulative World Pulverized-Coal Plant Installed Capacity (GW)
Subc
ritic
al P
C U
nit C
ost (
1994
$/
kW)
1942, EF=29.9%
19651999, US DOEEF=37.6%
Pulverized Coal-Fired Boilers
E.S. Rubin, Carnegie Mellon
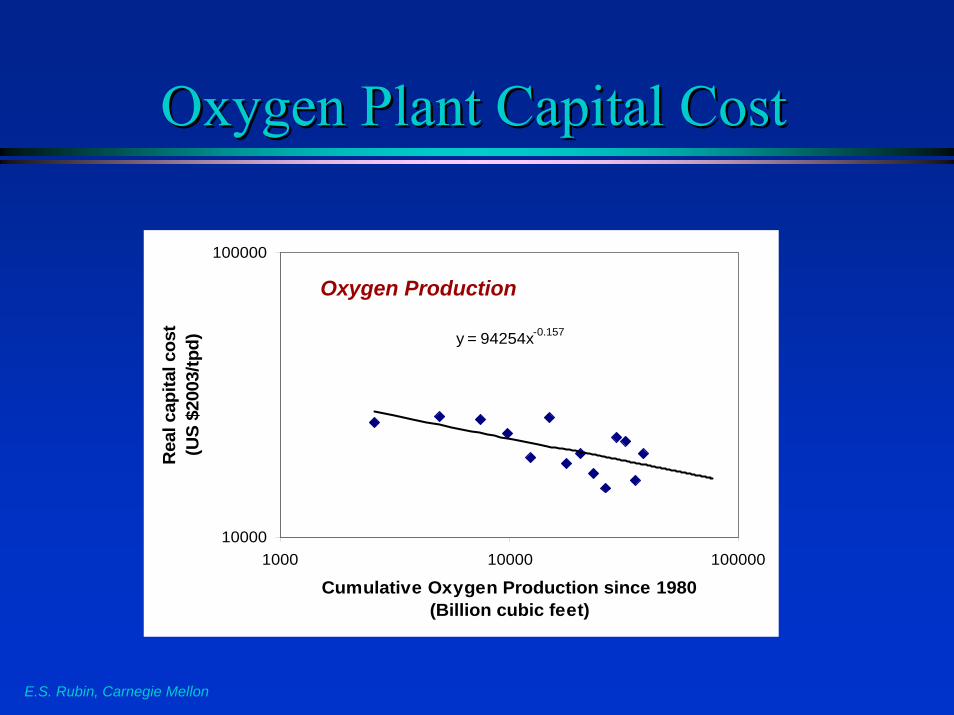
Oxygen Plant Capital CostOxygen Plant Capital Cost
y = 94254x-0.157
R2 = 0.43
10000
100000
1000 10000 100000
Cumulative Oxygen Production since 1980(Billion cubic feet)
Rea
l cap
ital c
ost
(US
$200
3/tp
d)
Oxygen Production
E.S. Rubin, Carnegie Mellon
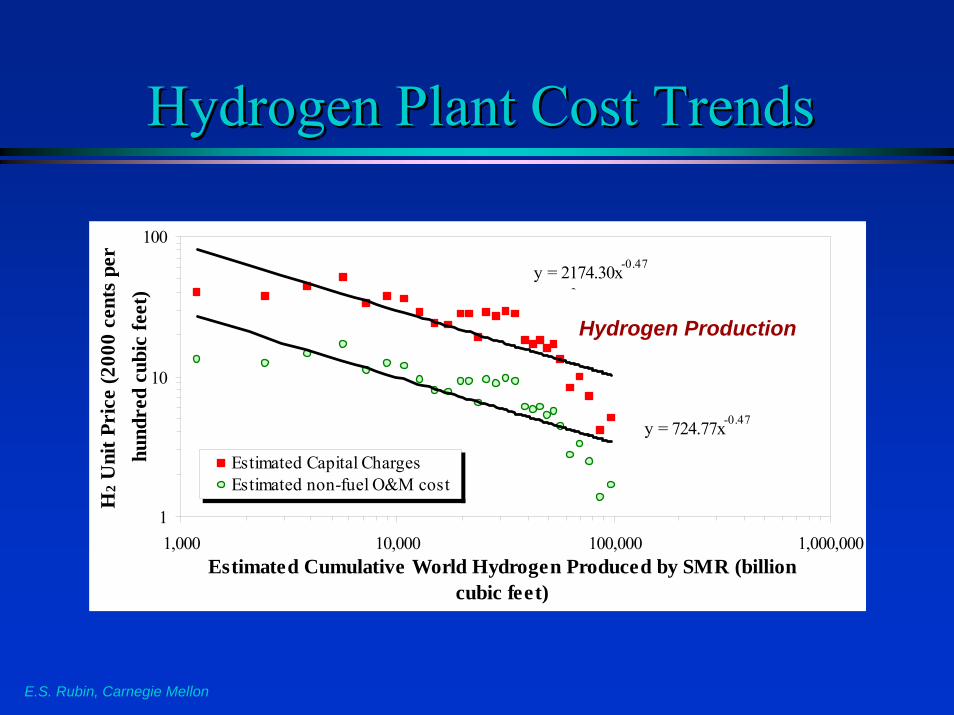
Hydrogen Plant Cost Trends Hydrogen Plant Cost Trends
y = 2174.30x-0.47
R2 = 0.65
y = 724.77x-0.47
R2 = 0.65
1
10
100
1,000 10,000 100,000 1,000,000Estimated Cumulative World Hydrogen Produced by SMR (billion
cubic feet)
H2 U
nit P
rice
(200
0 ce
nts
per
hund
red
cubi
c fe
et)
Estimated Capital ChargesEstimated non-fuel O&M cost
Hydrogen Production
E.S. Rubin, Carnegie Mellon
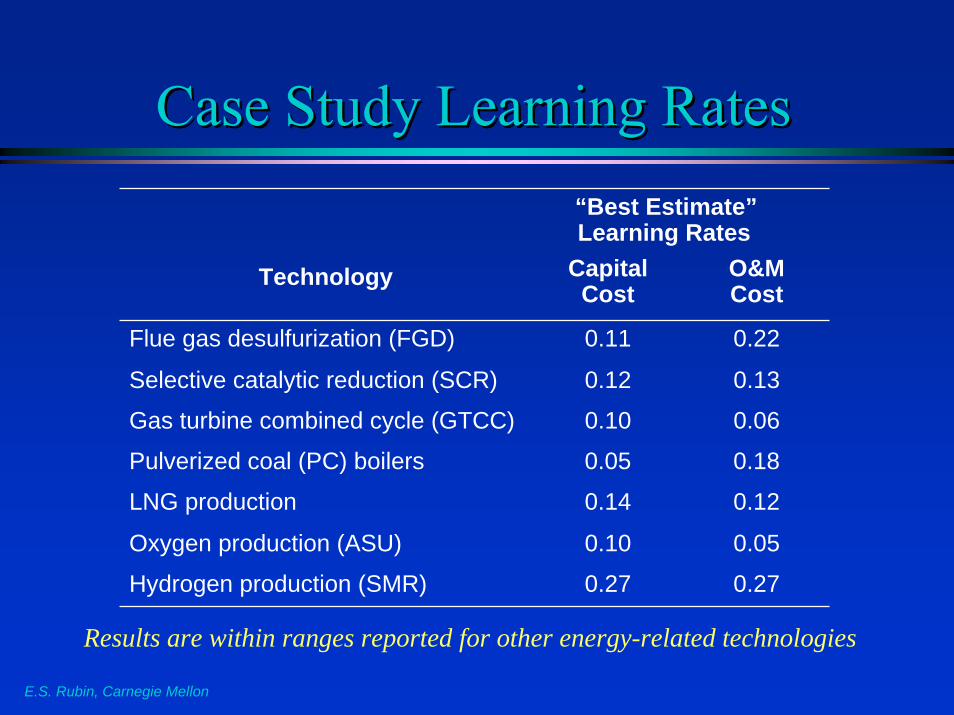
Case Study Learning RatesCase Study Learning Rates“Best Estimate”Learning Rates
Technology Capital Cost
O&M Cost
Flue gas desulfurization (FGD) 0.11 0.22
Selective catalytic reduction (SCR) 0.12 0.13
Gas turbine combined cycle (GTCC) 0.10 0.06
Pulverized coal (PC) boilers 0.05 0.18
LNG production 0.14 0.12
Oxygen production (ASU) 0.10 0.05
Hydrogen production (SMR) 0.27 0.27
Results are within ranges reported for other energy-related technologies
Application to Power Plants Application to Power Plants with COwith CO22 CaptureCapture
E.S. Rubin, Carnegie Mellon
E.S. Rubin, Carnegie Mellon
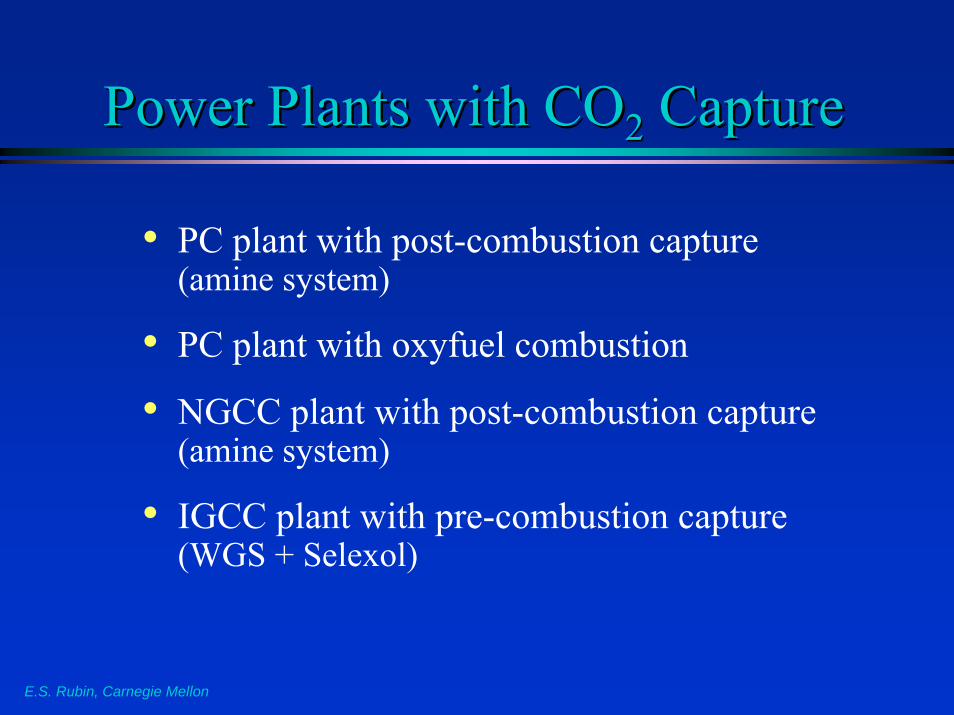
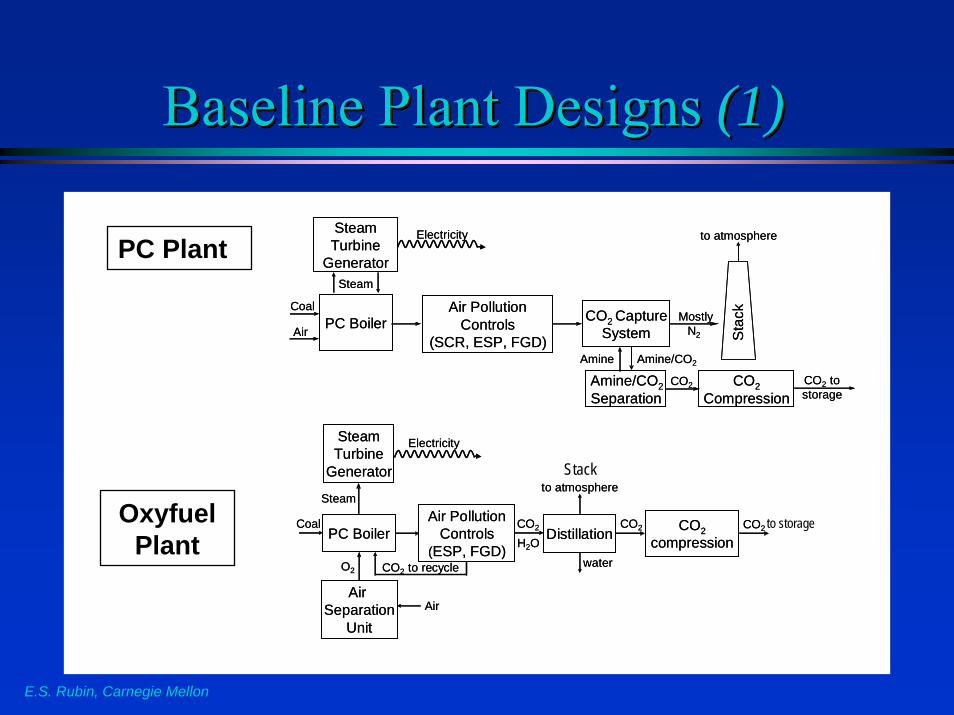
Power Plants with COPower Plants with CO22 CaptureCapture
• PC plant with post-combustion capture(amine system)
• PC plant with oxyfuel combustion
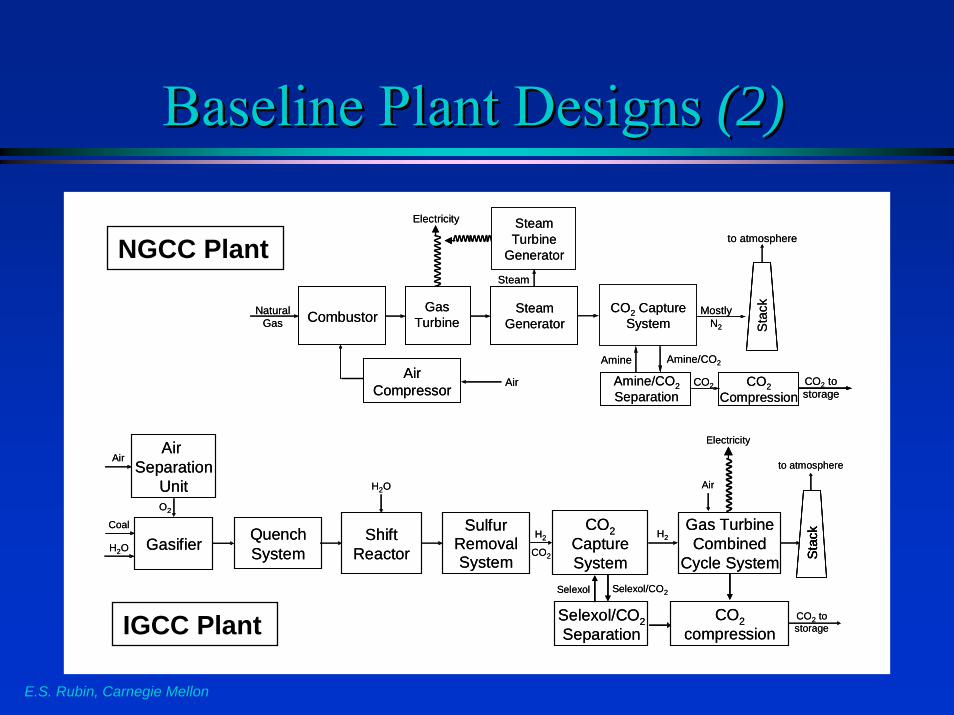
• NGCC plant with post-combustion capture(amine system)
• IGCC plant with pre-combustion capture(WGS + Selexol)
E.S. Rubin, Carnegie Mellon
Baseline Plant Designs Baseline Plant Designs (1)(1)
PC Plant
Oxyfuel Plant
Coal
Air
Steam
Sta
ck
Amine/CO2
CO2
Steam Turbine
Generator
Electricity
Air PollutionControls
(SCR, ESP, FGD)
CO2 CaptureSystem
PC Boiler
Amine/CO2 Separation
MostlyN2
CO2Compression
Amine
CO2 tostorage
to atmosphere
Coal
Air
Steam
Sta
ck
Amine/CO2
CO2
Steam Turbine
Generator
Electricity
Air PollutionControls
(SCR, ESP, FGD)
CO2 CaptureSystem
PC Boiler
Amine/CO2 Separation
MostlyN2
CO2Compression
Amine
CO2 tostorage
to atmosphere
CoalDistillation
water
CO2
Air
H2O
O2
SteamTurbine
Generator
Electricity
Steam
PC Boiler CO2compression
Air Separation
Unit
CO2 to recycle
to atmosphere
Air PollutionControls
(ESP, FGD)
CO2CO2CoalDistillation
water
CO2
Air
H2O
O2
SteamTurbine
Generator
Electricity
Steam
PC Boiler CO2compression
Air Separation
Unit
CO2 to recycle
to atmosphere
Air PollutionControls
(ESP, FGD)
CO2CO2 to storage
Stack
E.S. Rubin, Carnegie Mellon
Baseline Plant Designs Baseline Plant Designs (2)(2)
Gas TurbineCombined
Cycle SystemH2O St
ack
O2
Air
Coal
Gasifier
Stac
k
Air Separation
Unit
ShiftReactor CO2
Selexol/CO2Separation
Selexol Selexol/CO2
H2CO2
CaptureSystem
CO2compression
CO2 tostorage
Quench System
H2Sulfur
Removal System
to atmosphere
H2O
Electricity
Air
Gas TurbineCombined
Cycle SystemH2O St
ack
O2
Air
Coal
Gasifier
Stac
k
Air Separation
Unit
ShiftReactor CO2
Selexol/CO2Separation
Selexol Selexol/CO2
H2CO2
CaptureSystem
CO2compression
CO2 tostorage
Quench System
H2Sulfur
Removal System
to atmosphere
H2O
Electricity
Air
NaturalGas S
tack
Amine Amine/CO2
CO2 tostorage
Electricity SteamTurbine
Generator
CO2 CaptureSystem
Steam
GasTurbine
Amine/CO2Separation
MostlyN2
CO2Compression
CO2
SteamGenerator
AirCompressor
Combustor
Air
to atmosphere
NaturalGas S
tack
Amine Amine/CO2
CO2 tostorage
Electricity SteamTurbine
Generator
CO2 CaptureSystem
Steam
GasTurbine
Amine/CO2Separation
MostlyN2
CO2Compression
CO2
SteamGenerator
AirCompressor
Combustor
Air
to atmosphereNGCC Plant
IGCC Plant
E.S. Rubin, Carnegie Mellon
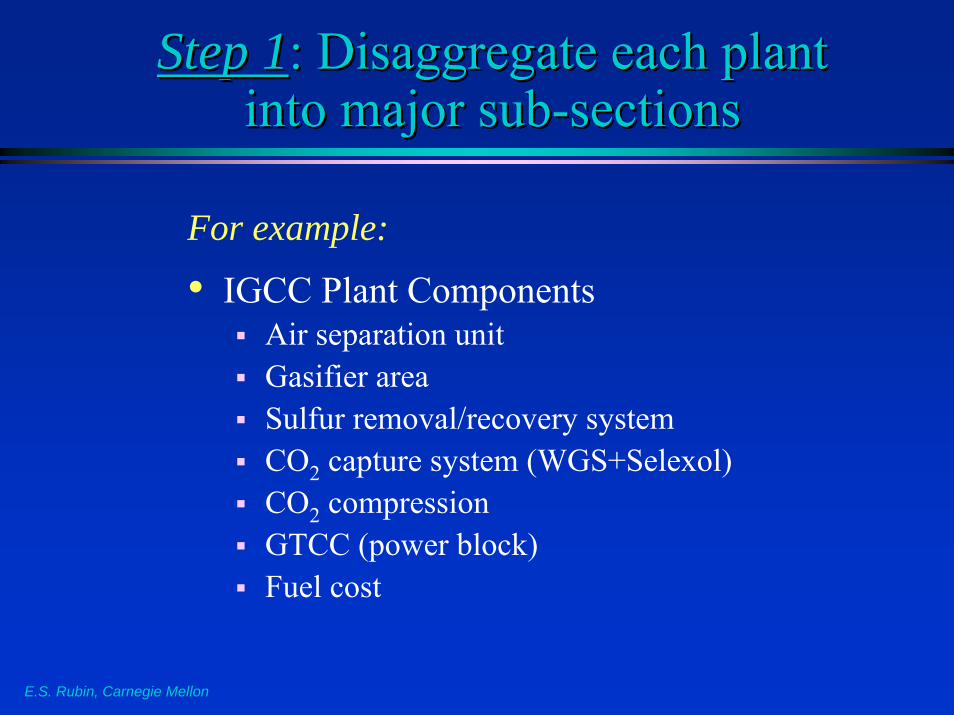
Step 1Step 1: Disaggregate each plant : Disaggregate each plant into major subinto major sub--sections sections
For example:
• IGCC Plant ComponentsAir separation unitGasifier areaSulfur removal/recovery systemCO2 capture system (WGS+Selexol)CO2 compressionGTCC (power block)Fuel cost
E.S. Rubin, Carnegie Mellon
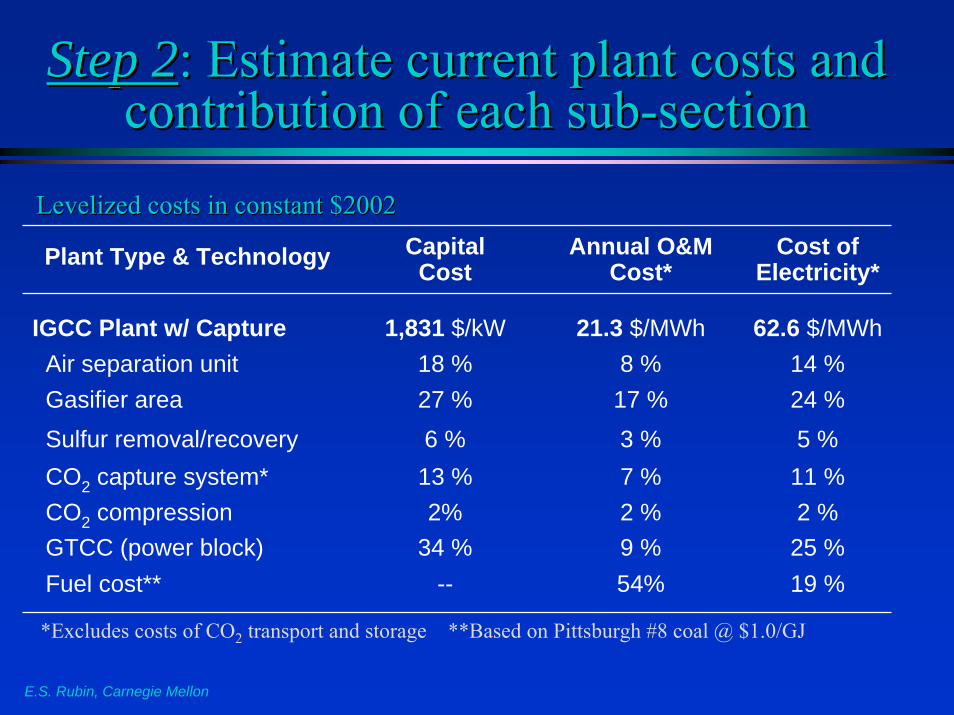
Step 2Step 2: Estimate current plant costs and : Estimate current plant costs and contribution of each subcontribution of each sub--section section
Plant Type & Technology Capital Cost
Annual O&M Cost*
Cost ofElectricity*
IGCC Plant w/ Capture 1,831 $/kW 21.3 $/MWh 62.6 $/MWhAir separation unit 18 % 8 % 14 %Gasifier area 27 % 17 % 24 %Sulfur removal/recovery 6 % 3 % 5 %CO2 capture system* 13 % 7 % 11 %CO2 compression 2% 2 % 2 %GTCC (power block) 34 % 9 % 25 %Fuel cost** -- 54% 19 %
Levelized costs in constant $2002 Levelized costs in constant $2002
*Excludes costs of CO2 transport and storage **Based on Pittsburgh #8 coal @ $1.0/GJ
E.S. Rubin, Carnegie Mellon
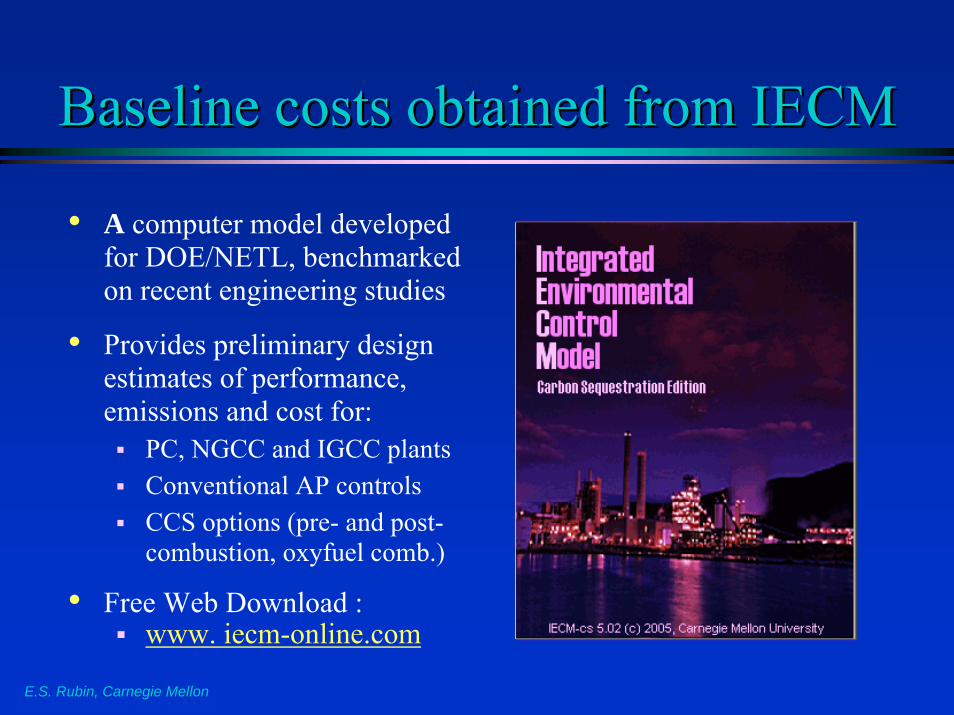
Baseline costs obtained from IECMBaseline costs obtained from IECM
• A computer model developed for DOE/NETL, benchmarked on recent engineering studies
• Provides preliminary design estimates of performance, emissions and cost for:
PC, NGCC and IGCC plantsConventional AP controlsCCS options (pre- and post-combustion, oxyfuel comb.)
• Free Web Download :www. iecm-online.com
E.S. Rubin, Carnegie Mellon
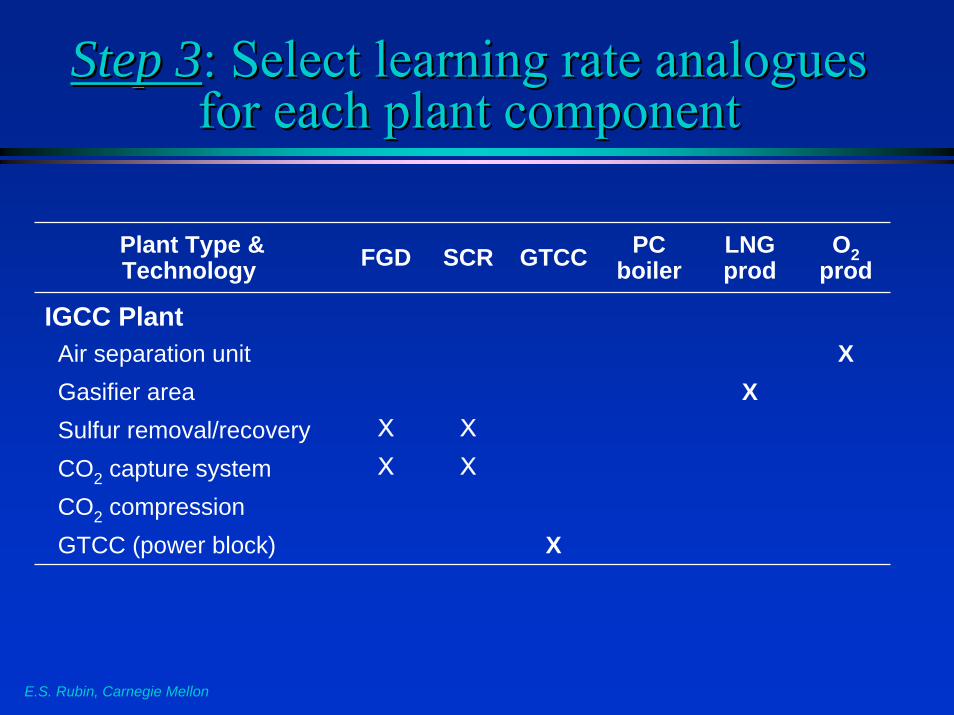
Step 3Step 3: Select learning rate analogues : Select learning rate analogues for each plant componentfor each plant component
Plant Type & Technology FGD SCR GTCC PC
boilerLNG prod
O2prod
IGCC PlantAir separation unit XGasifier area XSulfur removal/recovery X XCO2 capture system X XCO2 compressionGTCC (power block) X
E.S. Rubin, Carnegie Mellon
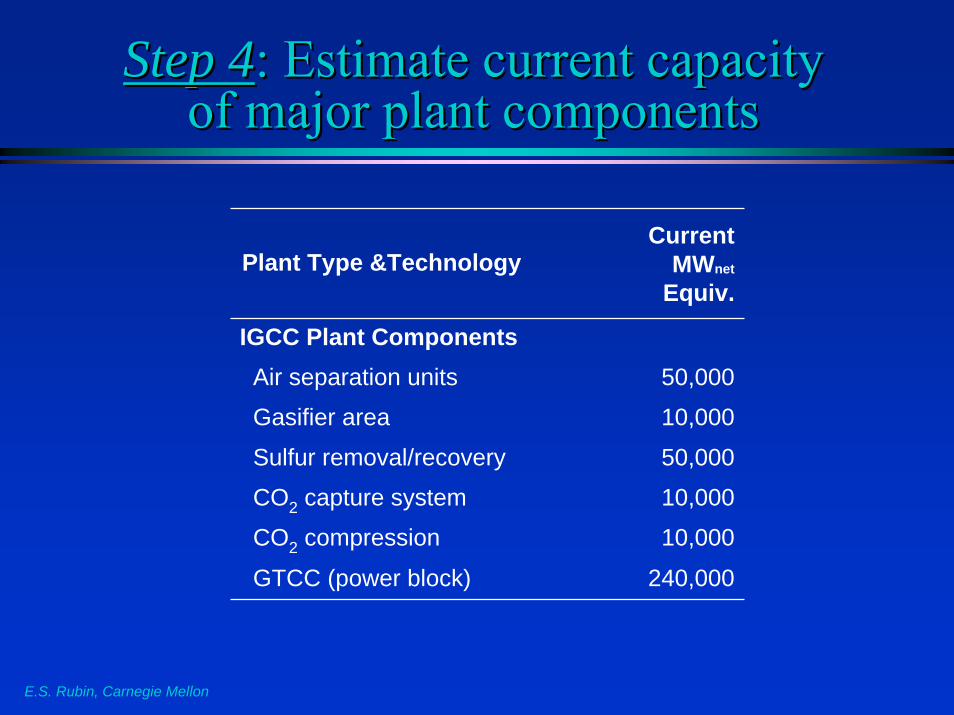
Step 4Step 4: Estimate current capacity : Estimate current capacity of major plant componentsof major plant components
Plant Type &TechnologyCurrent
MWnet
Equiv.
IGCC Plant ComponentsAir separation units 50,000
Gasifier area 10,000
Sulfur removal/recovery 50,000
CO2 capture system 10,000
CO2 compression 10,000
GTCC (power block) 240,000

E.S. Rubin, Carnegie Mellon
Step 5Step 5: Set projection period : Set projection period and start of learningand start of learning
Cumulative CCS Capacity (MW)
Plant Type Learning Begins at:1st Plant nth Plant
Learning Projected
to:NGCC Plant 432 3,000 100,000PC Plant 500 5,000 100,000
IGCC Plant 490 7,000 100,000Oxyfuel Plant 500 10,000 100,000
E.S. Rubin, Carnegie Mellon
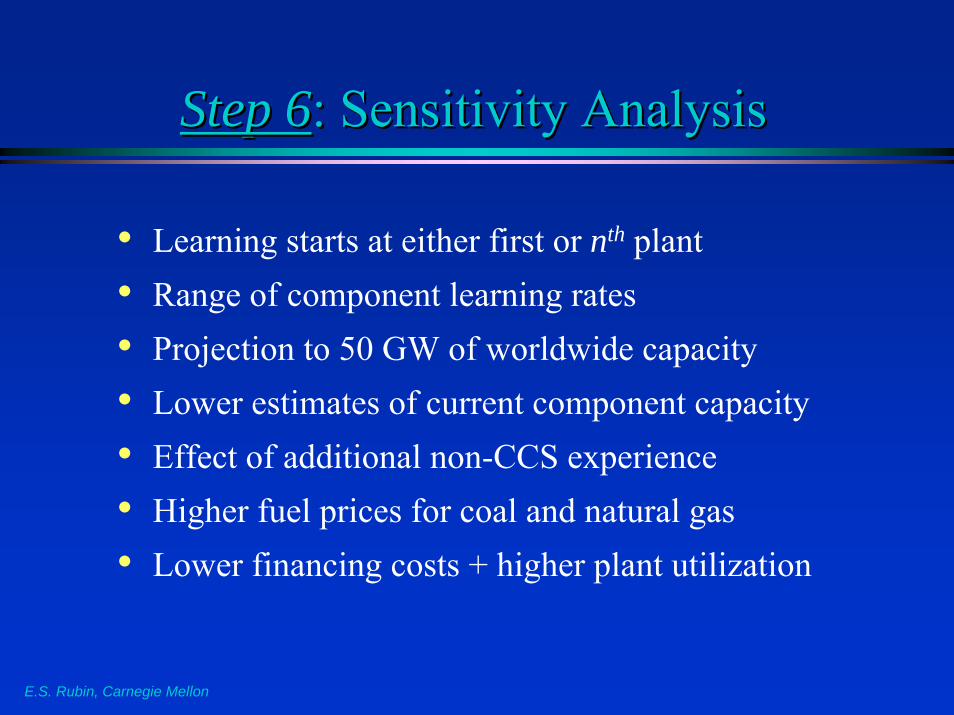
Step 6Step 6: Sensitivity Analysis: Sensitivity Analysis
• Learning starts at either first or nth plant• Range of component learning rates• Projection to 50 GW of worldwide capacity • Lower estimates of current component capacity• Effect of additional non-CCS experience • Higher fuel prices for coal and natural gas • Lower financing costs + higher plant utilization
E.S. Rubin, Carnegie Mellon
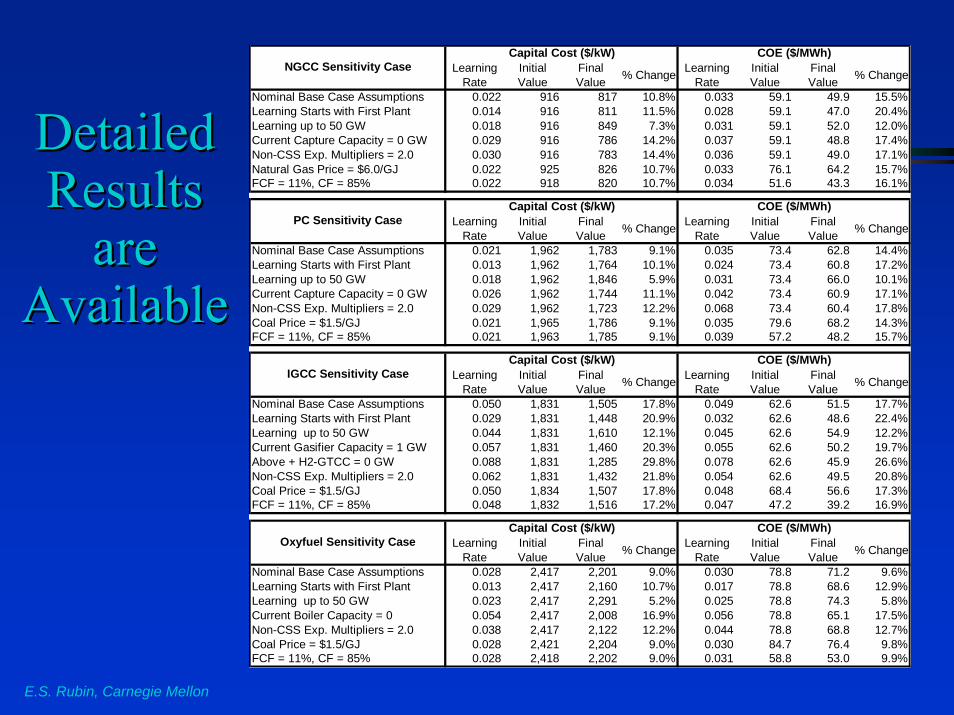
Detailed Detailed Results Results
are are AvailableAvailable
Learning Rate
Initial Value
Final Value % Change Learning
RateInitial Value
Final Value % Change
Nominal Base Case Assumptions 0.022 916 817 10.8% 0.033 59.1 49.9 15.5%Learning Starts with First Plant 0.014 916 811 11.5% 0.028 59.1 47.0 20.4%Learning up to 50 GW 0.018 916 849 7.3% 0.031 59.1 52.0 12.0%Current Capture Capacity = 0 GW 0.029 916 786 14.2% 0.037 59.1 48.8 17.4%Non-CSS Exp. Multipliers = 2.0 0.030 916 783 14.4% 0.036 59.1 49.0 17.1%Natural Gas Price = $6.0/GJ 0.022 925 826 10.7% 0.033 76.1 64.2 15.7%FCF = 11%, CF = 85% 0.022 918 820 10.7% 0.034 51.6 43.3 16.1%
Learning Rate
Initial Value
Final Value % Change Learning
RateInitial Value
Final Value % Change
Nominal Base Case Assumptions 0.021 1,962 1,783 9.1% 0.035 73.4 62.8 14.4%Learning Starts with First Plant 0.013 1,962 1,764 10.1% 0.024 73.4 60.8 17.2%Learning up to 50 GW 0.018 1,962 1,846 5.9% 0.031 73.4 66.0 10.1%Current Capture Capacity = 0 GW 0.026 1,962 1,744 11.1% 0.042 73.4 60.9 17.1%Non-CSS Exp. Multipliers = 2.0 0.029 1,962 1,723 12.2% 0.068 73.4 60.4 17.8%Coal Price = $1.5/GJ 0.021 1,965 1,786 9.1% 0.035 79.6 68.2 14.3%FCF = 11%, CF = 85% 0.021 1,963 1,785 9.1% 0.039 57.2 48.2 15.7%
Learning Rate
Initial Value
Final Value % Change Learning
RateInitial Value
Final Value % Change
Nominal Base Case Assumptions 0.050 1,831 1,505 17.8% 0.049 62.6 51.5 17.7%Learning Starts with First Plant 0.029 1,831 1,448 20.9% 0.032 62.6 48.6 22.4%Learning up to 50 GW 0.044 1,831 1,610 12.1% 0.045 62.6 54.9 12.2%Current Gasifier Capacity = 1 GW 0.057 1,831 1,460 20.3% 0.055 62.6 50.2 19.7%Above + H2-GTCC = 0 GW 0.088 1,831 1,285 29.8% 0.078 62.6 45.9 26.6%Non-CSS Exp. Multipliers = 2.0 0.062 1,831 1,432 21.8% 0.054 62.6 49.5 20.8%Coal Price = $1.5/GJ 0.050 1,834 1,507 17.8% 0.048 68.4 56.6 17.3%FCF = 11%, CF = 85% 0.048 1,832 1,516 17.2% 0.047 47.2 39.2 16.9%
Learning Rate
Initial Value
Final Value % Change Learning
RateInitial Value
Final Value % Change
Nominal Base Case Assumptions 0.028 2,417 2,201 9.0% 0.030 78.8 71.2 9.6%Learning Starts with First Plant 0.013 2,417 2,160 10.7% 0.017 78.8 68.6 12.9%Learning up to 50 GW 0.023 2,417 2,291 5.2% 0.025 78.8 74.3 5.8%Current Boiler Capacity = 0 0.054 2,417 2,008 16.9% 0.056 78.8 65.1 17.5%Non-CSS Exp. Multipliers = 2.0 0.038 2,417 2,122 12.2% 0.044 78.8 68.8 12.7%Coal Price = $1.5/GJ 0.028 2,421 2,204 9.0% 0.030 84.7 76.4 9.8%FCF = 11%, CF = 85% 0.028 2,418 2,202 9.0% 0.031 58.8 53.0 9.9%
COE ($/MWh)
COE ($/MWh)
COE ($/MWh)
COE ($/MWh)NGCC Sensitivity Case
Capital Cost ($/kW)
PC Sensitivity CaseCapital Cost ($/kW)
IGCC Sensitivity CaseCapital Cost ($/kW)
Oxyfuel Sensitivity CaseCapital Cost ($/kW)
E.S. Rubin, Carnegie Mellon
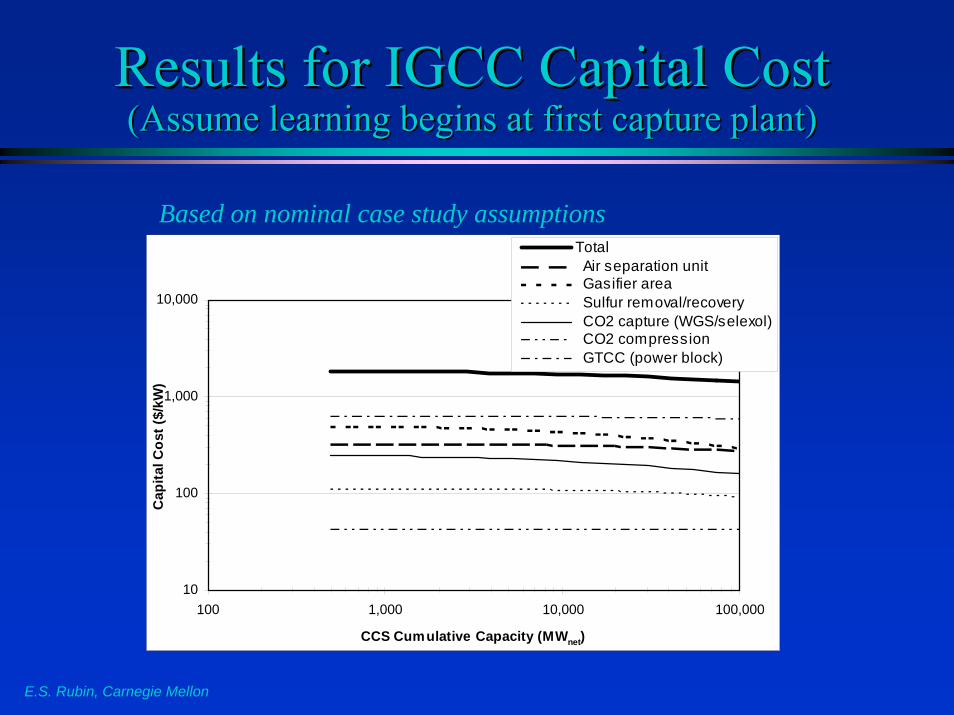
Results for IGCC Capital Cost Results for IGCC Capital Cost (Assume learning begins at first capture plant)(Assume learning begins at first capture plant)
10
100
1,000
10,000
100 1,000 10,000 100,000
CCS Cumulative Capacity (MWnet)
Cap
ital C
ost (
$/kW
)
Total Air separation unit Gasifier area Sulfur removal/recovery CO2 capture (WGS/selexol) CO2 compression GTCC (power block)
Based on nominal case study assumptions
E.S. Rubin, Carnegie Mellon
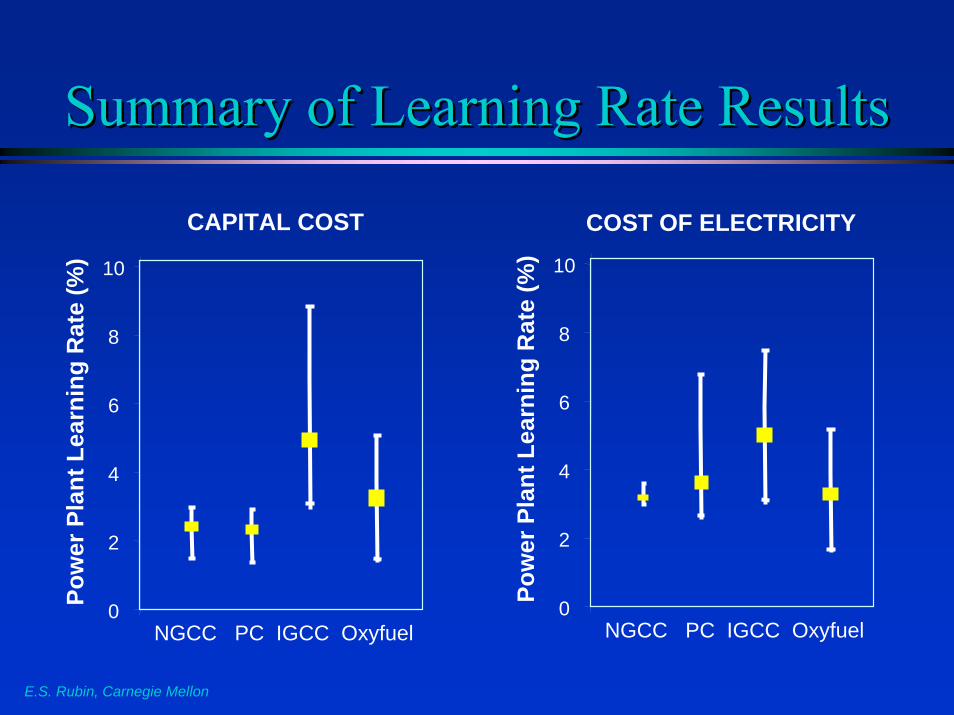
Summary of Learning Rate Results Summary of Learning Rate Results
0
2
4
6
8
10
Pow
er P
lant
Lea
rnin
g R
ate
(%)
NGCC PC IGCC Oxyfuel
CAPITAL COST
0
2
4
6
8
10
Pow
er P
lant
Lea
rnin
g R
ate
(%)
NGCC PC IGCC Oxyfuel
COST OF ELECTRICITY

E.S. Rubin, Carnegie Mellon
Summary of COE ResultsSummary of COE Results
30
40
50
60
70
80
90
Cos
t of E
lect
ricity
($20
02/M
Wh)
NGCC PC IGCC Oxyfuel
FINAL COE
0
5
10
15
20
25
30
Perc
ent R
educ
tion
in C
OE
NGCC PC IGCC Oxyfuel
% REDUCTION
E.S. Rubin, Carnegie Mellon
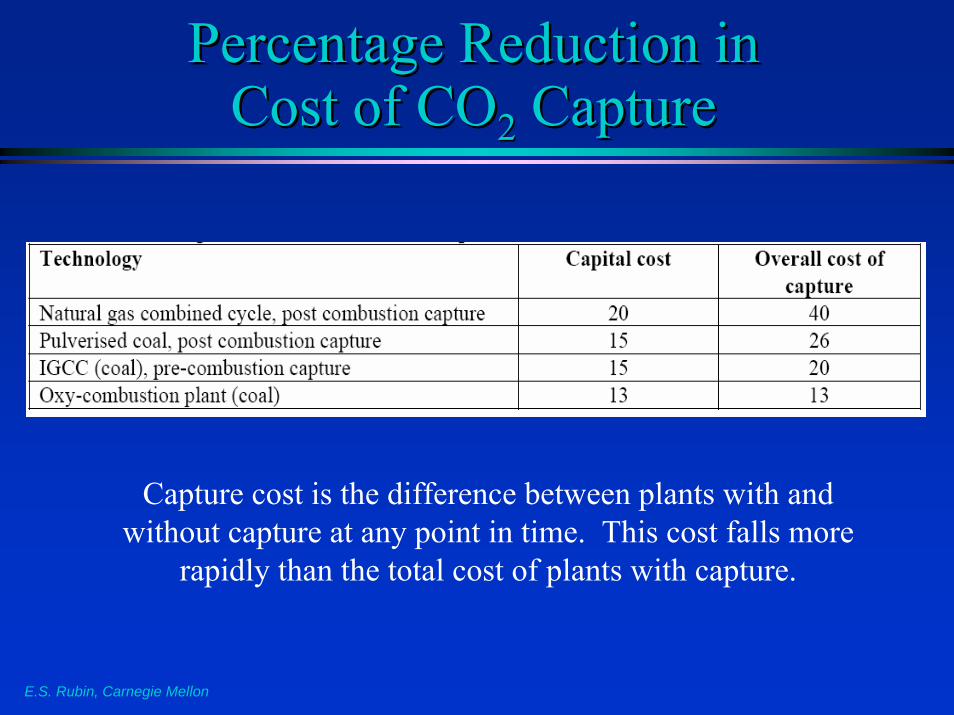
Percentage Reduction in Percentage Reduction in Cost of COCost of CO22 CaptureCapture
Capture cost is the difference between plants with and without capture at any point in time. This cost falls more
rapidly than the total cost of plants with capture.
E.S. Rubin, Carnegie Mellon
ConclusionsConclusions
• Future reductions in the cost of power plants with CO2 capture will require not only sustained R&D, but also full-scale deployment to foster learning-by-doing
• Results suggests that IGCC plants with CO2 capture have a potential for larger cost reductions compared to combustion-based plants with capture
• The timing and magnitude of future cost reductions are uncertain; policy drivers will play a key role
E.S. Rubin, Carnegie Mellon
CaveatsCaveats
• There are many!
• Please see full report for details.
A spreadsheet model accompanies the report to facilitate analyses with other input assumptions

Thank YouThank You
E.S. Rubin, Carnegie Mellon